Article

Evaluation on Rock Tensile Failure of the Brazilian Discs under Different Loading Configurations by Digital Image Correlation

School of Resources and Safety Engineering, Central South University, Changsha 410083, China
*
Author to whom correspondence should be addressed.
Appl. Sci. 2020, 10(16), 5513; https://doi.org/10.3390/app10165513
Submission received: 14 July 2020 / Revised: 5 August 2020 / Accepted: 7 August 2020 / Published: 10 August 2020
(This article belongs to the Special Issue Fracture Mechanics – Theory, Modeling and Applications)

Abstract

:

Featured Application

The present work is conducive to focused use of the Brazilian test to obtain the tensile strength and other information of a rock specimen.

Abstract

The fracture behavior of the disc specimens in the Brazilian test is closely related to the reliability and accuracy of the experimental results. To comprehensively investigate the effect of various loading methods and rock material types on the failure mechanism of the Brazilian discs, five different rock types tested with three typical loading methods were employed in this work. The digital image correlation (DIC) method was applied to record and analyze the strain and displacement field of the specimens during the loading process. Experimental results indicate that the peak load and deformation characteristics of the Brazilian discs are strongly affected by the loading types. The Brazilian test with the Chinese standard is evidently not suitable for measuring the tensile strength of rocks, and the other two testing methods may lead to an invalid failure mode for rock materials with high stiffness and tensile to compressive strength ratio. Furthermore, it revealed that the maximum equivalent stress point of a disc specimen is co-controlled by the material stiffness and its tensile–compression ratio. The present work shows that it is necessary to select a suitable loading configuration for each rock type in the Brazilian test.

1. Introduction

Rock is a brittle material commonly encountered in various geotechnical engineering applications (tunneling, mining, slope engineering, etc.) [1,2]. Since the tensile strength of rock is generally far less than its compressive strength, tension cracks play an important role during the failure process of rocks, which has been confirmed by numerous laboratory tests [3,4,5,6,7,8]. Therefore, it is of great significance to study the tensile mechanical properties of rock, especially its tensile strength. In general, the tensile strength of rock is measured by direct or indirect experimental methods. Compared with a direct tensile test [9], the Brazilian test is a more favorable method for determining the indirect tensile strength of rocks because of its simple experimental procedure and data reduction. Since it was introduced independently by Carneiro and Akazawa in 1943 [10,11], a large number of scholars have carried out theoretical and experimental research on it. The fundamental problem is the validity of the Brazilian test, which is closely related to the reliability and accuracy of the experimental results. There are three commonly used loading configurations in a typical Brazilian test [12], as shown in Figure 1, including (a) flat loading platens (Type I) [13], (b) flat loading platens with two small diameter steel bars (Type II), which was proposed by the Chinese standard [14], and (c) the official International Society for Rock Mechanics (ISRM) standard method (Type III), which recommends that two steel loading jaws should be used to contact the disc specimen, and the jaw radius should 1.5 times the specimen radius [9].
Based on the plane elasticity theory and Griffith criterion, the tensile crack should initiate at the center of the disc and then propagate along the compressive diametral line in the Brazilian test for isotropic and homogeneous rock materials [12]. In the last few decades, great efforts have been made to investigate the validity of the Brazilian disc test [15,16,17]. It was found that the crack initiation location was often far away from the disc center [18,19,20,21,22]. On the contrary, based on experimental and numerical studies of rocks, some authors confirmed that the tensile failure of the Brazilian disc occurs in the center (interior) of the disk and then propagates to its top and bottom surfaces [23,24,25,26]. The discrepancy between the above two phenomena may be caused by the inconsistent testing conditions for experiments or numerical studies.
In fact, the results of the Brazilian test are influenced by a variety of internal and external factors. Researchers attempted to investigate the effect of all the influencing factors on the Brazilian test [12], such as the intermediate principal stress [27,28], the frictional force between the loading platens and the disc specimen [29,30,31], distributions of applied load [32,33], its anisotropic (transverse isotropic) nature [34,35,36,37] and the thickness–diameter ratio of the disc specimen [27,38], etc. Nevertheless, most studies preferred to examine the effect of loading types on the test results. For example, Sgambitterra et al. [39] applied three different loading configurations in the Brazilian test to evaluate their effects on the experimental results. It was revealed that the curved loading type is the most suitable for determining the tensile strength. Liu et al. [40] investigated the tensile mechanical behavior and damage evolution process of Beishan granite with different test methods based on the acoustic emission test system. It was considered that the results of the direct tensile test were more rational and reliable. Stirling et al. [41] studied the failure mechanism of a sandstone disc under various testing conditions by DIC, showing that the flattened disc geometry represents the best compliance with Brazilian test theory. Aliabadian et al. [37] conducted three sets of experiments considering different load contact configurations to study crack development in transverse isotropic sandstone discs subjected to the Brazilian test. This study confirmed that the anisotropy angles and load configurations have strong effects on crack development. Komurlu et al. [42] performed an evaluation on the indirect tensile strength of various rocks using different types of jaws, and concluded that the determination of the indirect tensile strength of rocks was dependent on the loading geometry and the rock material. The major drawbacks of their work are that they focused only on the tensile strength of rock specimens and the failure patterns of failed discs. In addition, it can be found from the existing literature that most studies were carried out on a specific type of rock or rock-like material, and some of their conclusions are different and even contradictory. To summarize, the different findings in the above studies prove that no current uniform understanding exists as regards the Brazilian test, and the failure mechanisms of the Brazilian discs subjected to different loading methods have not been fully recognized. Therefore, this study intends to thoroughly investigate this knowledge gap by considering various rock types and loading conditions.
In order to detect possible crack initiation locations in the experiment and to study the development of surface deformations of rock specimens, traditional measuring instruments including strain gauges, linear variable differential transformers (LVDTs) and extensometers can be employed. However, these instruments are not capable of providing detailed information about the fracture behavior of the specimen. In addition, strain measurements of these instruments are highly localized, and will be affected by many factors such as temperature, adhesives, etc. [37,41]. To overcome these limitations, the digital image correlation (DIC) method has been proposed as a non-contact optical measurement technique to investigate the damage evolution and crack development of rock specimens. It also has many other advantages, such as operating in real-time, and being full-field and non-destructive [43,44]. The theoretical basis of the DIC technique was first proposed by Chu et al. [45], and has been used in many fields of material testing. Zhou et al. [46] evaluated the fracture behavior of ductile and brittle specimens subjected to a uniaxial compression test using DIC. Li et al. [6] analyzed the deformation and failure processes of marble containing a single hole under uniaxial compression using DIC technology. Stirling et al. [41] studied the failure mechanism of sandstone disc specimens under three different testing conditions via DIC. Zhang et al. [47] used DIC to study the deformation and failure behavior of a rock specimen in the indentation test. Aliabadian et al. [37] applied DIC to investigate the crack development of a sandstone disc in the Brazilian test. All these works highlighted that DIC technology is applicable and reliable for characterizing the mechanical deformation behavior and failure patterns of various rock types.
In this paper, three different load contact configurations were considered, including two international standard methods (Type I test and Type III test) as well as the Chinese standard (Type II test). Additionally, five different rock types with diverse brittleness indexes were tested. Finally, the effect of the load contact configurations on indirect tensile strength and the crack patterns (including crack initiation and propagation) with respect to various rocks were investigated in the Brazilian disc tests by combining DIC technology. The key findings of this work are essential in accurately using the Brazilian test to obtain the tensile strength and other information of a rock specimen.

2. Experimental Procedures

2.1. Specimen Preparation

The tested materials in this work include white sandstone (WS), red sandstone (RS), marble (M), granite (G) and basalt (B). For each rock type, nine intact Brazilian disc specimens were prepared with the dimensions of 50 mm × 25 mm (diameter × thickness). These specimens were extracted from intact rock blocks that were petrographically uniform and lacked obvious cracks or bedding planes. Therefore, they can be treated as approximately isotropic. Owing to the application of DIC technology in the Brazilin test, a fine aerosol paint was applied to make a black-on-white speckle pattern on the specimen surface. Moreover, in order to gain effective correlation, the speckle patterns were carefully made as non-repetitive, isotropic and high in contrast, as shown in Figure 2a. The detailed procedure of this work is described in CorelatedSolutions [48]. In addition, three standard specimens of 50 mm × 100 mm (diameter × height) were prepared for each rock type in order to conduct uniaxial compression tests. The results of the uniaxial compression tests are listed in Table 1.

2.2. Experimental Setup and Testing Method

The main experimental setup used in the Brazilian test includes the loading device (MTS-Landmark servo-hydraulic loading system) and an image acquisition device (Point Grey-GS3-U3-123S6M-C), as shown in Figure 2b. Loading was carried out using displacement control at a rate of 0.2 mm/min. The specimens failed within about 5 min, which is within the recommended time of 1–10 min [13]. During loading, two cameras were used to capture images at intervals of 50 ms (20 fps). As shown in Figure 2b, the two cameras with 50 mm fixed focal length were installed in front of the specimen, and the axes of the cameras were at an angle of ~20° from the axis of the specimen. Moreover, the two cameras were connected to a computer which was later used to analyze the images using three-dimensional visual image correlation software (VIC-3D). Further details of the camera setup are described in CorelatedSolutions [49]. To ensure the correct brightness of the specimen surface, two LED lamp sources were placed on both sides of the specimen. Additionally, image calibration was carried out before testing with the 3D-DIC technology.

3. Results

3.1. Tensile Strength and Deformation Characteristic

In the Brazilian test, a circular disk is diametrically compressed along its diameter, resulting in a constant tensile stress perpendicular to the loading direction in the central part of the specimen. According to the maximum tensile stress criterion, the formula for calculating the tensile strength σ t (MPa) is [9,13]:
σ t = 2 P π D t = 0.636 P D t
where P is the failure load (N), and D and t are the diameter and thickness of the specimen respectively (mm). However, it is believed that rock material properties and load conditions can generate a significant effect on the determination of indirect tensile strength and fracturing of rocks [38]. In other words, an invalid Brazilian test may occur because of some certain internal or external factors mentioned in the introduction. In fact, crack initiation occurring away from the disk center was observed in some rock specimens in this study. Therefore, the results from this standard formula may not present well the actual tensile strength of some rock materials, and the equation herein is mainly used for the purpose of comparison.
According to the experimental data, the Brazilian test results are listed in Table 2. The tensile strengths of all specimens are calculated by Equation (1), while the brittleness index (BI), which is commonly used to characterize the failure behavior of rocks, is determined by the ratio of the uniaxial compressive strength to average tensile strength [50]. For a better comparison, the average tensile strength of each rock type under different loading conditions is plotted in Figure 3. As can be seen from Figure 3, the loading method has a significant influence on the tensile strength of rocks. The average tensile strength determined by the Type III test is the highest among the three test types for all rock types, while the Type II test is the lowest. It can also be found that the tensile strength determined by the Type I test is similar to the Type III test. The above experimental results are mainly related to the contact area between the specimen and the platens, and its size depends on the disc material, jaw material and load level. In fact, curved platens (Type III) have the highest contact area, and the rod platens (Type II) have the lowest.
Figure 4 presents the load–displacement curves of representative tests of each rock type under different loading configurations. It can be observed that the loading force rises linearly before the peak (except for the initial loading stage) and drops rapidly at the peak, which indicates that little damage occurs inside the specimen during the loading process. In other words, the tested specimens undergo little plastic deformation during the loading process. When the input energy reaches a critical level, it is released abruptly via fracture formation [51,52]. In addition, it can be found that specimens tested by the Type I specification, undergoing less displacement, show a similar stiffness to those of the Type III specification when the slope is at the linear elastic stage. Moreover, it should be noted that the Type II test shows the lowest stiff response to load, i.e., specimens tested using the Type II specification exhibit the highest vertical displacement for the same loading force, which can be observed from the green horizontal dotted line in Figure 4a. Likewise, the other four rock types show similar performances. The main reason is that the severe stress concentration caused by the small steel bar placed between the flat platens and specimen gives rise to the localized premature failure, which in turn causes the steel bar to penetrate into the disc specimen. Conversely, the Type I specification shows the lowest displacement for a certain loading force. This may be due to the end restraint effect, which constrains the compressive deformation and leads to a smaller displacement.

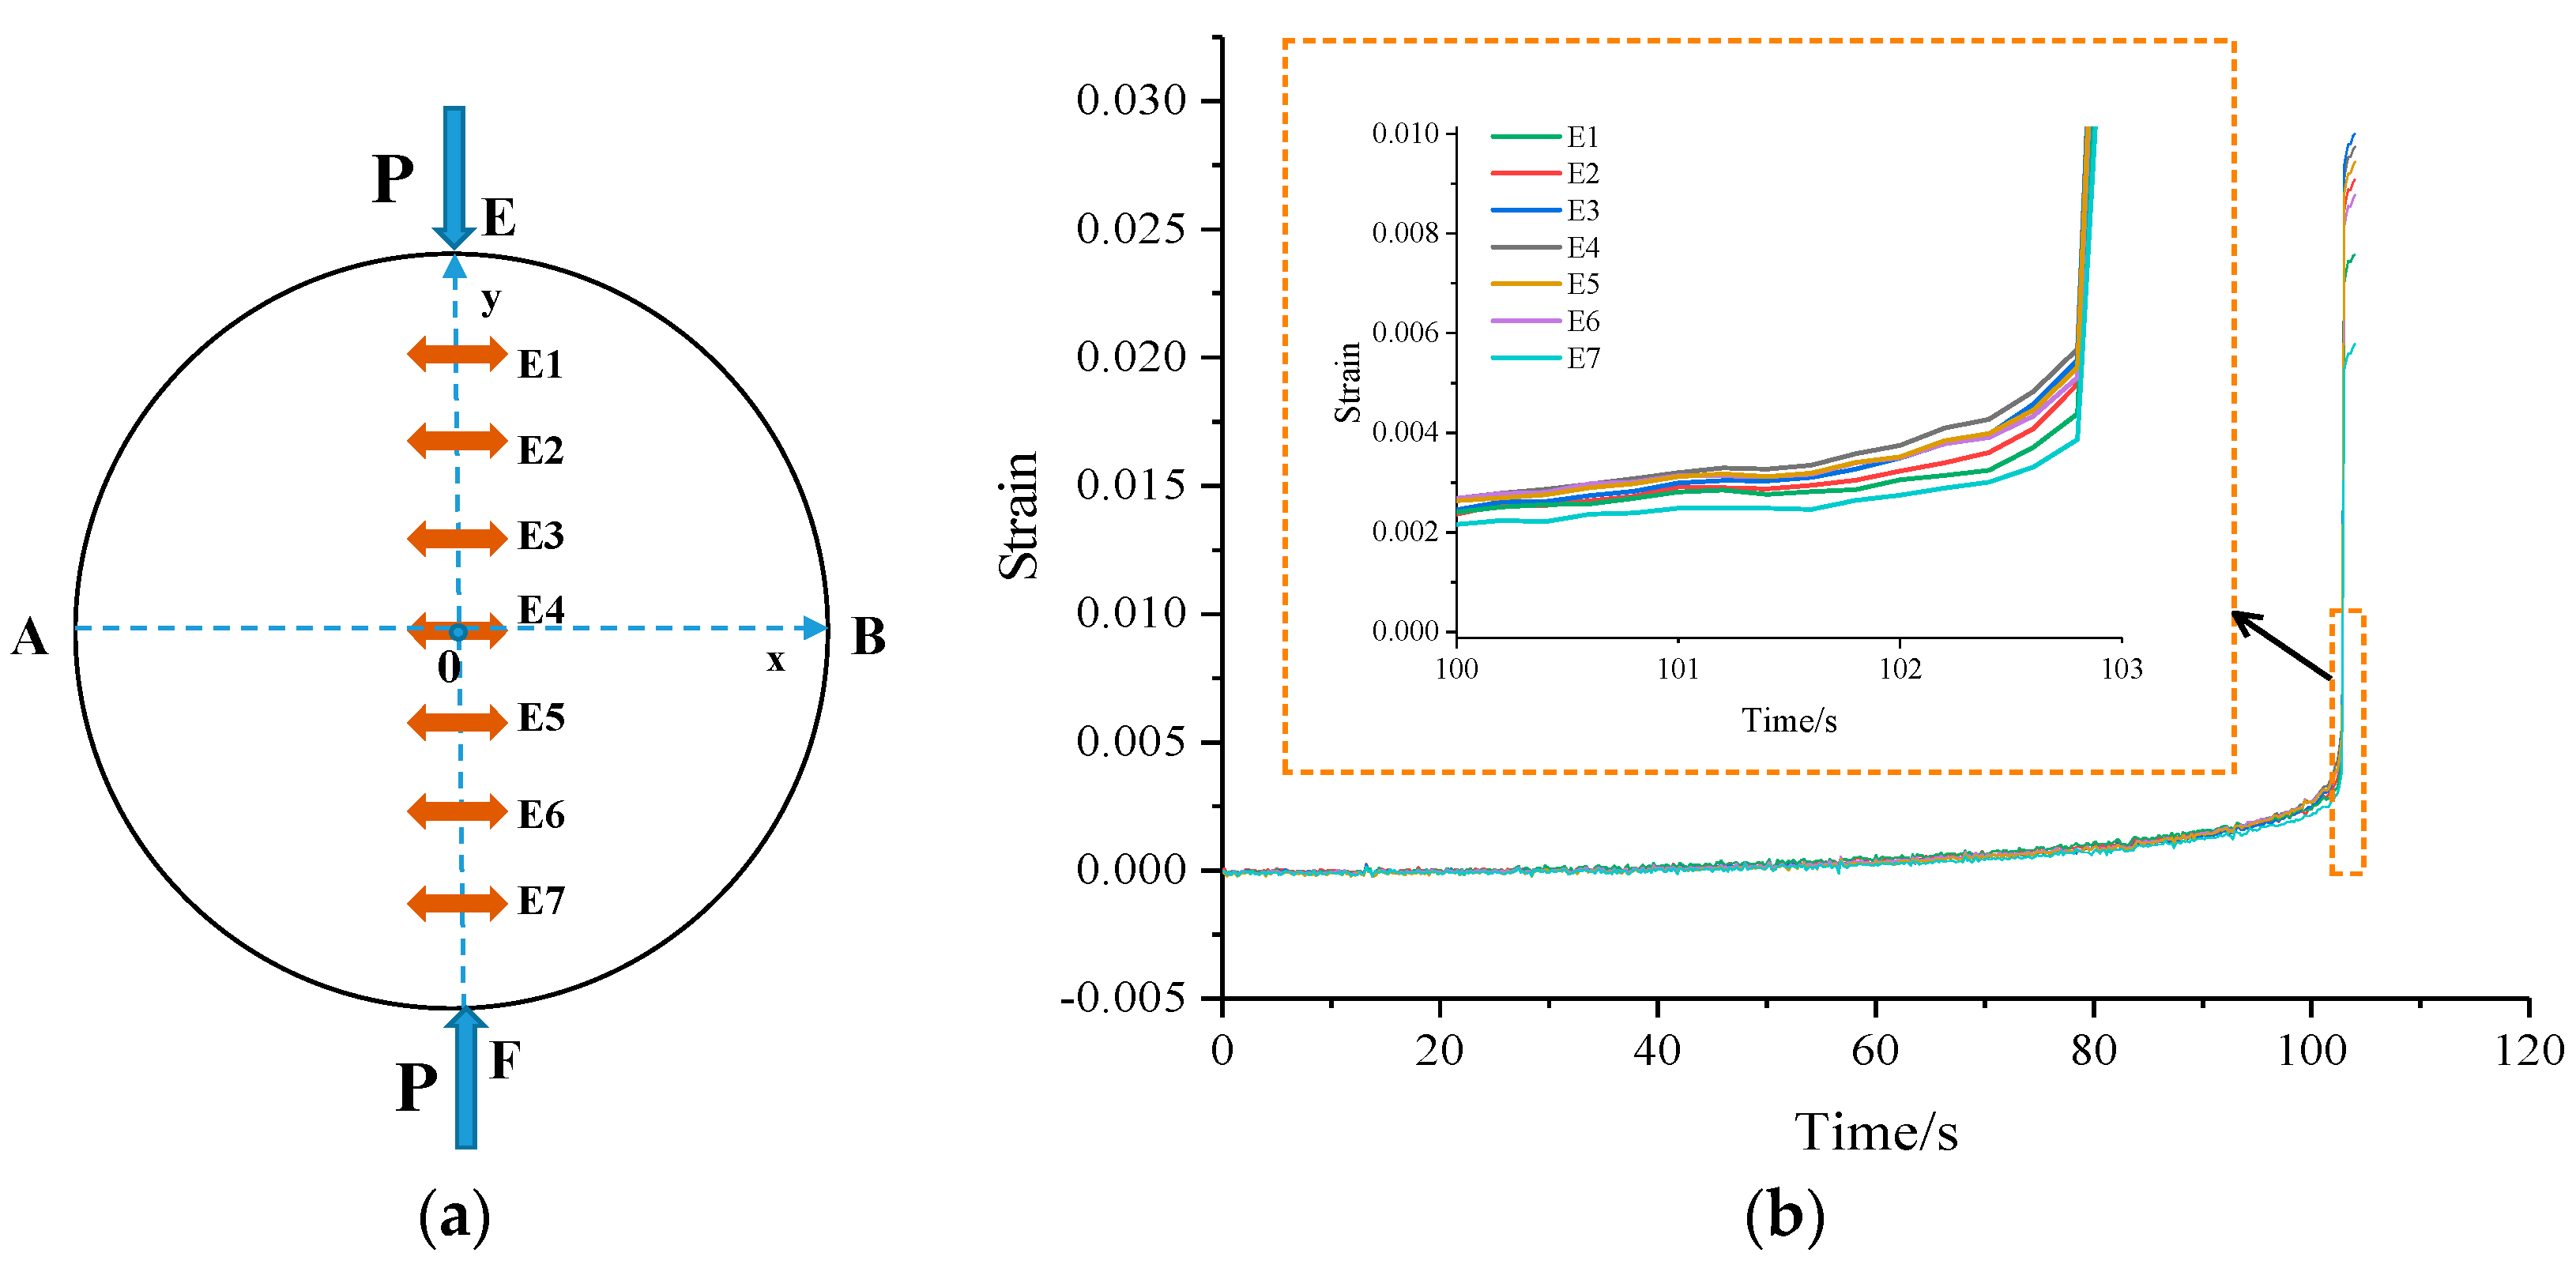
3.2. Failure Process Analysis

The standard failure mode during a Brazilian test is that the crack initiates from the disc center and propagates toward the loading points [9]. To date, the rock fracturing behavior, especially the crack initiation and propagation, are still a hot issue in rock mechanics [37,39,41]. In this paper, for the purpose of comparison, representative tests of each loading type were selected for analysis. Table 3 presents the tensile strain contour plots of the specimens immediately prior to failure. Obviously, the localized tensile strain exhibits two types of distribution characteristics: one is that the tensile strain concentration area is located at the center of the disc surface, and the other one is that the tensile strain severely concentrates very near to the loading points. The discussion of these two cases is presented herein. According to the linear elastic theory, the extension strain at the disc center can be calculated as follows [12]:
ε x 0 = σ t E ( 1 + 3 ν )
where ε x 0 is the extension strain normal to the loading direction, E is the Young’s modulus and ν is the Poisson’s ratio. Therefore, the tensile strain concentration can be considered as the tensile stress concentration for the first case, which corresponds with the Brazilian test theory. This is directly illustrated in Figure 5, which shows the conversion between the tensile strain and stress contour plot of a sandstone specimen (RS3-2) using VIC-3D software. However, for the second case, the localized tensile strain immediately beneath the loading points cannot be fully considered to be induced by tensile stress owing to the extremely high compressive stress existing on the top and bottom of the disc. As such, a localized premature failure may occur near the loading points of the disc specimen. From the above analysis, it can be found that the results of the Type III test specifications seem to be more reliable, in accordance with the Brazilian theory.
The failure analysis of disc specimens tested by Type III specification is described in detail below. It is well known that the crack propagation in brittle rock specimens is extremely fast, and that the initial crack location cannot be detected by the naked eye. DIC was sometimes employed to address this problem [37,53]. Furthermore, the criterion for crack initiation is characterized by a rapid jump in the strain at a point of interest, or displacement discontinuity along a line crossing the crack. The specimen WS3-1 is taken as an example to demonstrate this method in this paper. Seven virtual monitoring extensometers were located at equal intervals along the vertical loading axis (as shown in Figure 6a). It can be seen in Figure 6b, and in the inset figure, that the tensile strains of all extensometers rise rapidly almost at the same time, and it is difficult to show the rapid increase sequence of the extensometers under the current image acquisition interval (20 fps). Based on the above analysis, it can be recognized that DIC (except a high speed camera) is generally employed to qualitatively, rather than quantitatively, determine crack initiation in brittle materials. In general, researchers commonly use Griffith fracture criterion to judge the crack initiation point for brittle materials, specifically, using equivalent stress to judge the crack initiation point. However, this fracture criterion has occasionally been criticized due to its applicability to only one specific rock type [54]. Accordingly, the Mohr strength theory is selected in this paper to calculate the equivalent stress value of the disc specimen, and find the location where the maximum equivalent stress occurs. The Mohr strength theory can be expressed as [54]:
σ 1 β σ 3 = σ t
where σ 1 and σ 3 are the maximum principal stress and the minimum principal stress respectively, and β is the ratio of tensile ( σ t ) to compressive strength ( σ c ). In fact, the maximum principal stress, σ 1 , can be considered as the tensile stress, σ x , on the surface of the Brazilian disc, while the minimum principal stress, σ 3 , is the compressive stress, σ y , correspondingly. Moreover, the tensile and compressive stress on the disc surface can be derived by the VIC-3D software using the plane stress solution:
σ x = E 1 ν 2 ( ε x + ν ε y )
σ y = E 1 ν 2 ( ε y + ν ε x )
where ε x and ε y are tensile and compressive strain, respectively. Consequently, the equivalent stress, σ M , can be derived as:
σ M = σ x β σ y
It is well known that the crack initiation point in the Brazilian test is generally located near the vertical diameter of the disc. Therefore, this paper mainly focuses on the equivalent stress distribution on this path. For the purpose of a better comparison, the final results are normalized by the maximum equivalent stress of each rock specimen, and plotted in Figure 7. It was found that the possible crack initiation points of all specimens are all located in the central part of the disc. In other words, these specimens can be regarded as exhibiting a valid failure mode [12]. Additionally, the current results show a good agreement with a previous numerical study performed by Yu and Xu [54]. In other words, the maximum equivalent stress (individually directed by arrows) based on Mohr theory generally tends to occur far away from the disc center for an increasing ratio of tensile to compressive strength in rocks. It can be seen from the insert figure in Figure 7 that the vertical distance between the maximum equivalent stress point and the center of the disc varies significantly with the ratio of tensile to compressive strength increasing, and the Basalt specimen exhibits the largest distance while the Marble specimen shows the lowest one. However, it can be found that the result is aberrant for the red sandstone specimen, despite the fact that its tensile to compressive strength ratio is slightly higher than that of the granite specimen. This observation could be explained by the fact that, for relatively hard materials (e.g., the granite specimen), a smooth transition from the loaded rim to the unloaded part of the specimen is not allowed, and the fracture tends to occur further away from the disc center [12]. Therefore, it can be recognized that the maximum equivalent stress of a disc specimen is co-controlled by the material stiffness and the tensile–compression ratio when the loading condition is fixed.
For the purpose of simple description, the results of the Type II tests are analyzed continuously. For this test specification, two regions of dominant horizontal extension strain were located at the top and bottom of the disc prior to failure, and the minimum tensile strain was located at the disc center, as shown in Table 3. In order to quantitatively compare the distribution of tensile strain, the strain profiles across the vertical diameter are shown in Figure 8. It can be seen that the strain concentration at the loading points on both ends of the granite and basalt specimen is the most severe, which may indicate a localized premature failure. The fracturing process of specimen G2-1 is investigated as an example. Generally, there are three possible crack initiation positions in the Brazilian disc, shown by the small red dotted circles in Figure 9a, namely C0, C1 and C2. The diameter of these circles is about 5 mm, and they are sequentially utilized to monitor tensile and shear strain history in these areas using DIC, as shown in Figure 9b. It can be obviously found that the tensile and shear strain both increase slightly up to 140 s. At 140 s, the tensile and shear strain both abruptly increase dramatically at the bottom of the disc, where C2 is located, indicating that a crushing behavior occurs there. In addition, similar results have been observed in basalt disc specimens. However, the crushing behavior is not evidently observed in sandstone (white and red sandstone) and marble specimens before the peak load. Furthermore, owing to the high fracture velocity in these specimens, the location of the first cracking point cannot be accordingly confirmed by DIC. However, it is certain that the strain concentration at both ends of the disc must accelerate the accumulation of damage, resulting in a lower load-displacement curve response and tensile strength. Therefore, this standard testing method may not be applicable for determining the tensile strength of rock disc specimens. Further theoretical investigation can give confidence in this inference. As shown in Figure 8, the critical extension strain values of the central portion of the disc are very low. Taking specimen WS2-1 as an example, the tensile and compressive strains at the center of the disc prior to failure are 181 μm/m and 387 μm/m, respectively. Assuming linear elasticity, the peak tensile stress at the center of the disk is 1.13 MPa from Equation (4), which is apparently less than the tensile strength of the specimen with central crack initiation. This indicates that the failure of the disc ultimately initiated at the bottom or top of the disc, which is counter to the Brazilian test theory.
For the last Type I test, i.e., the ASTM standard specification [13], it resembles a combination of the above two experiments. To summarize, soft rocks or rock materials with low ratios of tensile to compressive strength (sandstone and marble in this paper) exhibit similar cracking behavior to that of the Type III test. Conversely, crushed regions just beneath the flat platens were observed when a relatively hard rock with a high ratio of tensile to compressive strength was tested, showing a good match with the Type II tests (G2-2, B2-2). Nevertheless, the tensile strength determined by the Type I test is much higher than that determined by the Type II test. This indicates that when smaller angles of loading contact area are adopted, the measured tensile strength will be lower, which agrees well with the conclusion of Fairhurst [15].

3.3. Failure Patterns

The failure patterns of representative specimens tested by different loading methods after reassembly are shown in Figure 10. These specimens are the same as those selected for analysis in Table 3. Although the specimens are generally split along the loading line, some difference can still be noticed.
In the Type I test, the bottom or top of all the disc specimens seem to show different magnitudes of crushing behavior, as illustrated by the dotted line ellipse in Figure 10a. Moreover, the edge crushed zones just beneath the contact surface are especially evident for granite and basalt specimens. This observation is in compliance with Table 3. For Type II test, it can be noticed that the failure surfaces of the specimens are more regular than in the Type I test, as shown in Figure 10b. In fact, due to the stress concentration around the steel bars, the linear failure surface considered as an ideal split [38] can be easily formed, which also leads to a smaller tensile strength. In addition, for relatively hard rocks, wedge-shaped crushed regions (illustrated by the dotted circle) can be clearly observed due to the more severe stress concentrations existing in the vicinity of the loading points. It should be noted that these crushed regions have already been formed during the loading process. However, the above-mentioned compression failure zones cannot be found in the specimens tested by Type III specification, indicating that this loading geometry well mitigated the stress concentration beneath the loading platens, and can be expected to ensure that the crack initiation point occurs in the middle portion of the disc. For materials with high tensile–compression ratio (red sandstone, granite and basalt), their dominant fracture is typically accompanied by secondary fractures that open from the vicinity of the loading points, as shown in Figure 10c. Conversely, the white sandstone specimen with the lowest uniaxial compressive strength, and the marble with the lowest tensile–compression ratio tested in this study, eventually failed with only one central crack.

4. Discussion

Based on the present study, it can be concluded that the fracture behavior of the Brazilian disc is not only affected by its loading condition, but also by its material properties. This may serve as an explanation for the discrepancy in some of the existing findings, which are stated in the introduction. In addition, it should be noted that the anisotropy of rocks will also have a significant effect on the failure mode of the Brazilian discs, according to Aliabadian et al. [37]. The tested materials in this work were treated as approximately isotropic. Therefore, the key findings from this study are not suitable for those rock types that show anisotropy or transverse isotropy. Furthermore, although the ISRM loading type is the most suitable test method for the Brazilian test in this paper, it may lead to an invalid failure mode for rock materials with high stiffness and tensile to compressive strength ratios. For such rock types, it is necessary to explore loading configurations that are suitable for them, which is another research direction that will be explored later.
In fact, the test specifications recommended by ASTM and ISRM are feasible in this study if only the final results of the Brazilian test (i.e., the tensile strength values) are considered. Additionally, the similar tensile strength values of the rocks measured by these two experimental methods can be found in some existing experimental results [39,41]. However, most scholars believe that the Brazilian disc test overestimates the tensile strength of rocks compared to the direct tensile test [55,56,57]. In this regard, the Brazilian test with the Chinese standard has occasionally been considered a suitable method for measuring the tensile strength of rocks, due to its lower load carrying capacity compared with other loading methods [40]. Of course, this may be unreasonable based on the key findings of this paper.
The macroscopic crack behavior of the rock specimens shows a good agreement with the results from the analysis performed by DIC. For example, the crushed regions at the ends of the failed discs indicate the existence of severe stress concentration in these regions. However, it is not recommended to evaluate the validity of the Brazilian test only by visually observing the post-fracture pattern of the tested specimen. As shown in Figure 10b, although the sandstone and marble specimens tested by the Type II test specification both show an ideal splitting mode, they are actually invalid failure modes based on the results of the analysis performed by DIC.
Finally, it has to be pointed out that it is difficult for us to perform the direct tension test in our laboratory because of its demanding requirements for testing [12,58]. Therefore, there is no way to compare the results obtained from this paper with the results obtained from the direct tensile test. This is a deficiency, and is also the next research direction of this work.

5. Conclusions

In this work, combining the DIC technology, five different rock types tested with three typical loading methods were employed to investigate their effects on the failure load and fracture behavior of disc specimens in the Brazilian test. The key findings are summarized below:
(1)
The failure load and deformation of the Brazilian discs are strongly affected by the loading type. The average tensile strength determined by the Type III test is the highest among the three test types for all rock types, while the Type II test is the lowest. Additionally, the vertical deformation response to load of the disc specimens tested by Type II test specification is the largest, while the Type I test resulted in the lowest.
(2)
The Type II test is evidently not applicable to measuring the tensile strength of rocks. The other two testing methods may lead to an invalid failure mode for rock materials with high stiffness and tensile to compressive strength ratios. In this regard, other testing methods and rock types need to be further investigated, which is also the next research direction of this work.
(3)
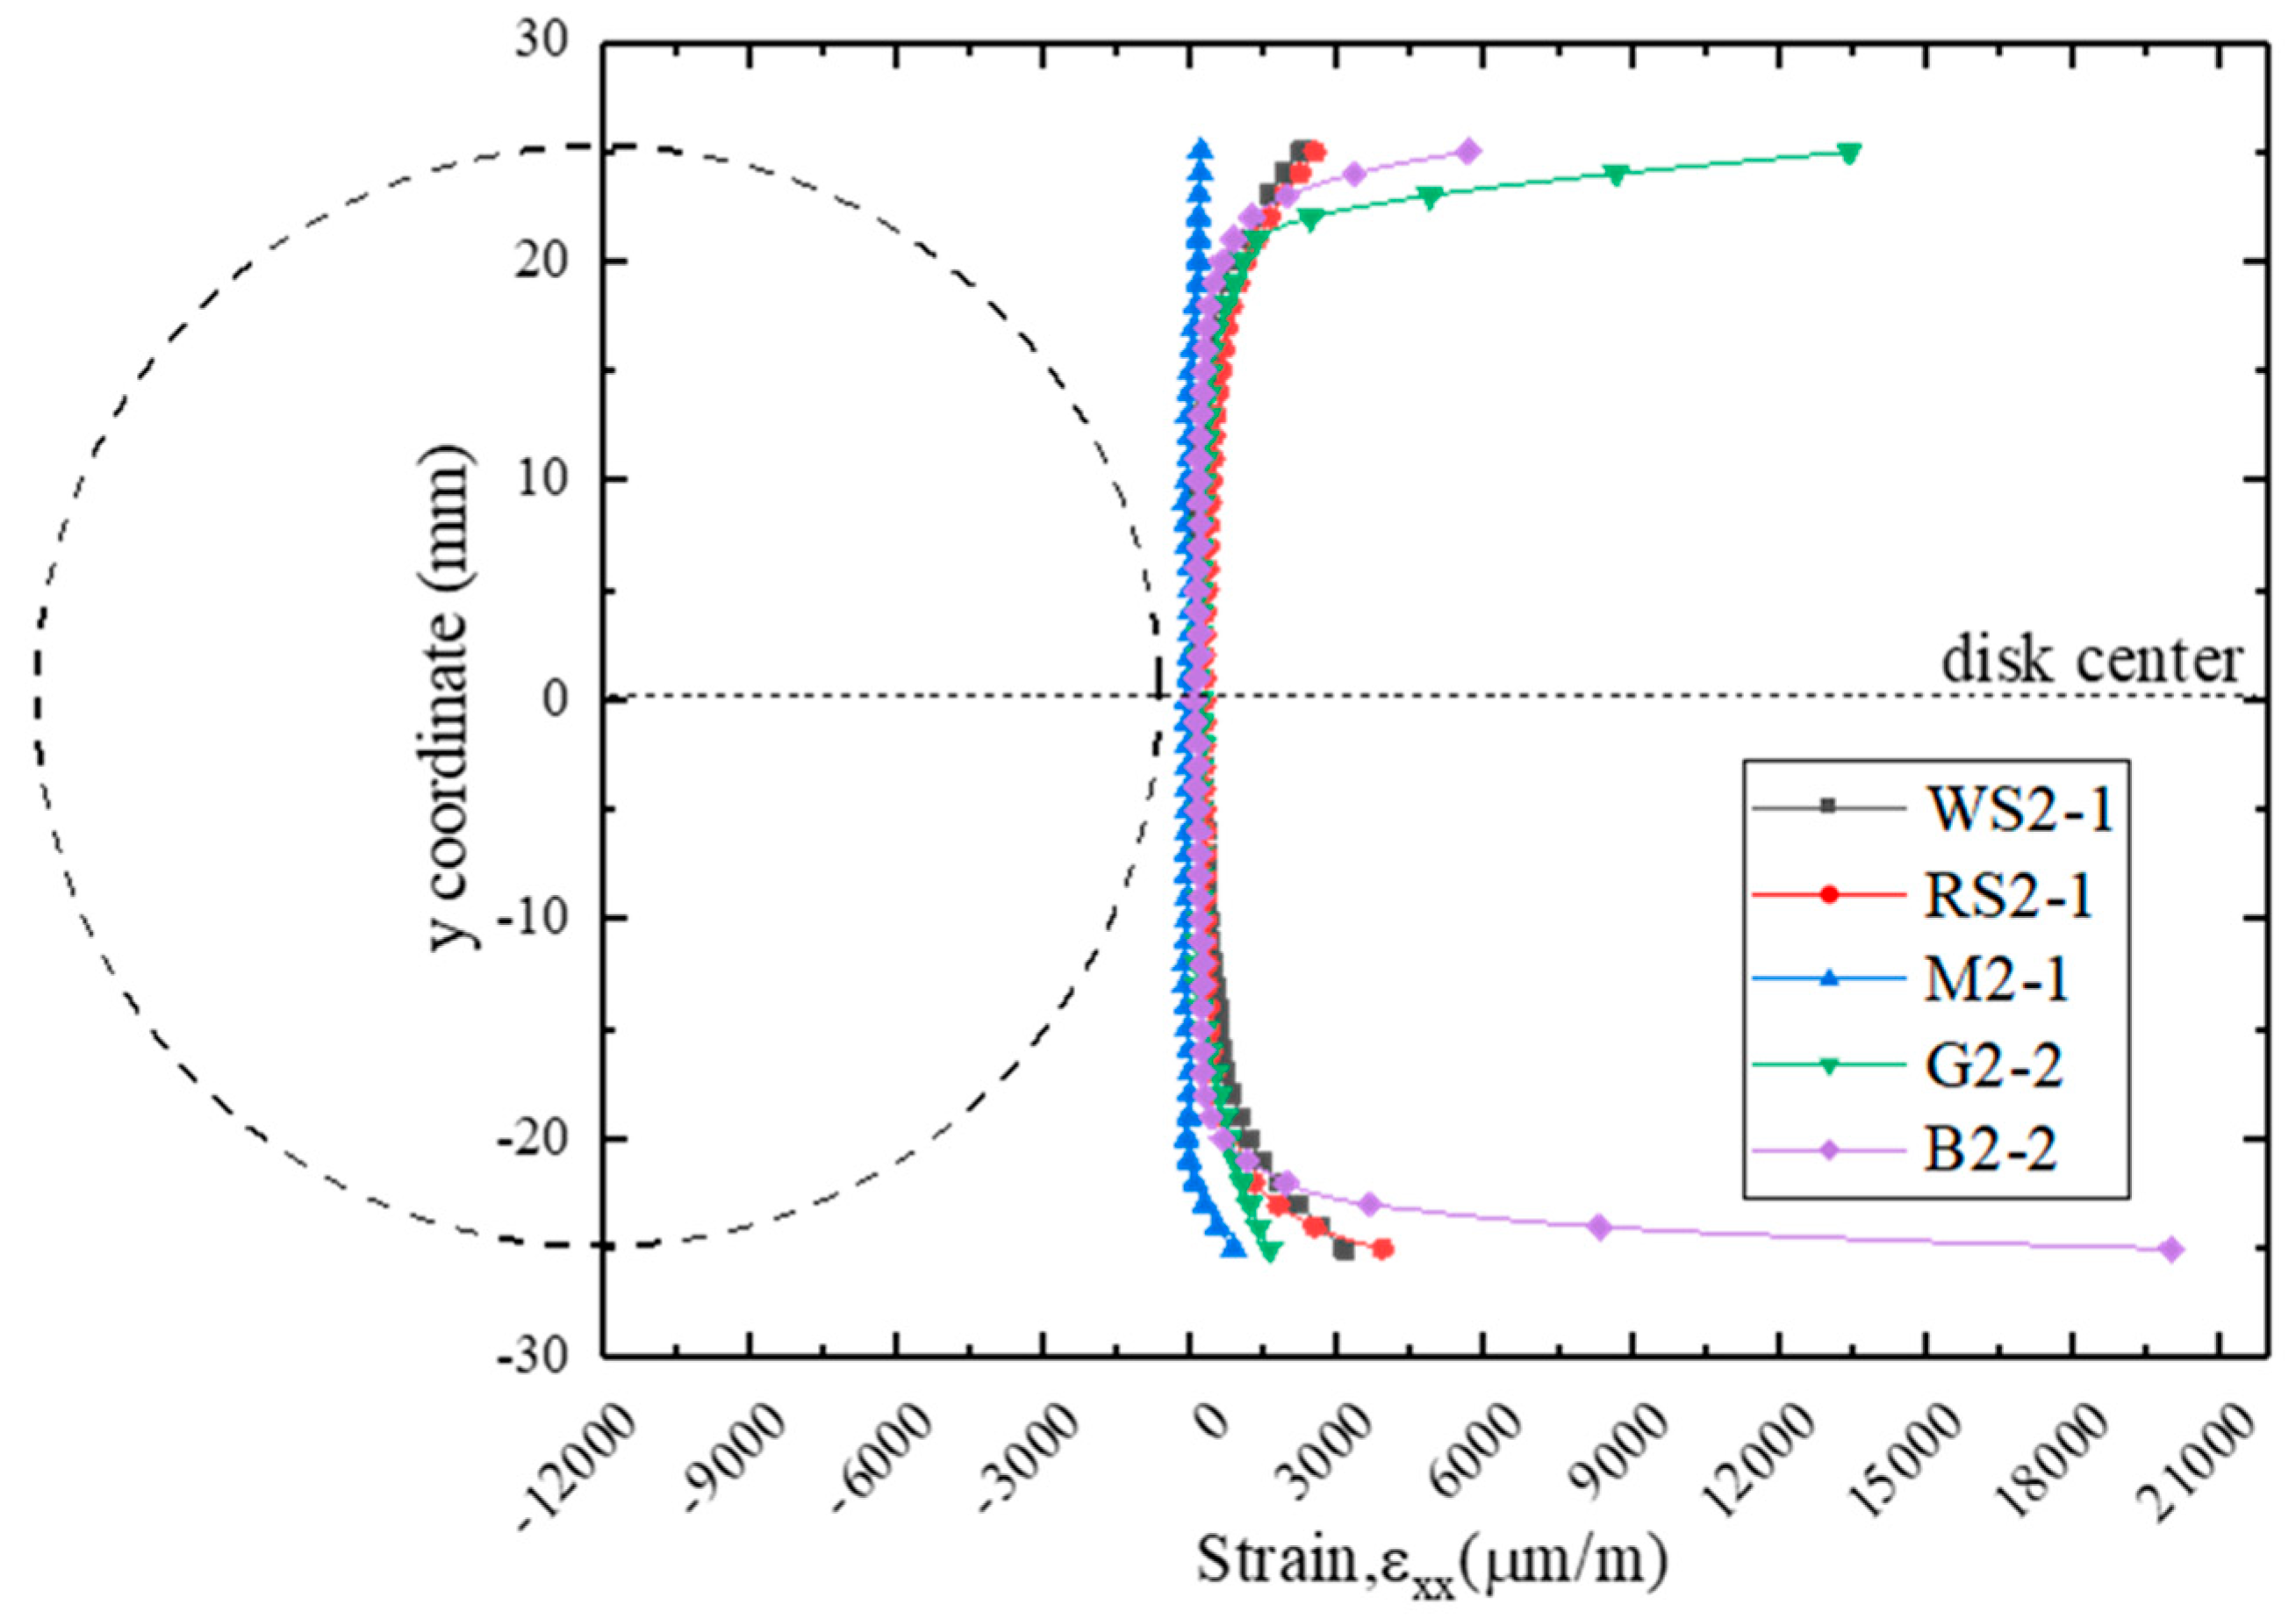
In the Brazilian test with the ISRM standard specification, the maximum equivalent stress point (possible crack initiation point) based on the Mohr theory generally tends to occur further away from the disc center with the increasing ratio of tensile to compressive strength in rock specimens. Nevertheless, this is not absolute. It was found that the maximum equivalent stress of a disc specimen is co-controlled by the material stiffness and its tensile–compression ratio.
(4)
It is not recommendable to evaluate the validity of the Brazilian test only by visually observing the post-fracture pattern of the disc specimens. In fact, DIC can enable us to understand the damage evolution process and failure modes of the specimens.

Author Contributions

Conceptualization, D.L.; data curation, Z.H.; funding acquisition, D.L.; investigation, B.L. and Q.Z.; validation, D.L.; writing—original draft, B.L.; writing—review and editing, D.L., Z.H. and Q.Z. All authors have read and agreed to the published version of the manuscript.

Funding

This research was funded by the Outstanding Youth Science Foundations of Hunan Province of China (No. 2019JJ20028) and the Key projects of the National Natural Science Foundation of China (No. 41630642).

Conflicts of Interest

The authors declare no conflict of interest.

References

  1. Rehman, H.; Ali, W.; Naji, A.M.; Kim, J.-J.; Abdullah, R.A.; Yoo, H.-K. Review of Rock-Mass Rating and Tunneling Quality Index Systems for Tunnel Design: Development, Refinement, Application and Limitation. Appl. Sci. 2018, 8, 1250. [Google Scholar] [CrossRef] [Green Version]
  2. Fernandez-Gutierrez, J.D.; Perez-Acebo, H.; Mulone-Andere, D. Correlation between Bieniawski’s RMR index and Barton’s Q index in fine-grained sedimentary rock formations. Inf. Constr. 2017, 69, e205. [Google Scholar]
  3. Dan, D.; Konietzky, H.; Herbst, M. Brazilian tensile strength tests on some anisotropic rocks. Int. J. Rock Mech. Min. Sci. 2013, 58, 1–7. [Google Scholar] [CrossRef]
  4. Zhou, J.; Zhang, L.Q.; Yang, D.X.; Braun, A.; Han, Z.H. Investigation of the Quasi-Brittle Failure of Alashan Granite Viewed from Laboratory Experiments and Grain-Based Discrete Element Modeling. Materials 2017, 10, 835. [Google Scholar] [CrossRef] [PubMed]
  5. Han, Z.Y.; Li, D.Y.; Zhou, T.; Zhu, Q.Q.; Ranjith, P.G. Experimental study of stress wave propagation and energy characteristics across rock specimens containing cemented mortar joint with various thicknesses. Int. J. Rock Mech. Min. Sci. 2020, 131, 104–352. [Google Scholar] [CrossRef]
  6. Li, D.Y.; Zhu, Q.Q.; Zhou, Z.L.; Li, X.B.; Ranjith, P.G. Fracture analysis of marble specimens with a hole under uniaxial compression by digital image correlation. Eng. Fract. Mech. 2017, 183, 109–124. [Google Scholar] [CrossRef]
  7. Zhu, Q.Q.; Li, D.Y.; Han, Z.Y.; Li, X.B.; Zhou, Z.L. Mechanical properties and fracture evolution of sandstone specimens containing different inclusions under uniaxial compression. Int. J. Rock Mech. Min. Sci. 2019, 115, 33–47. [Google Scholar] [CrossRef]
  8. Li, D.Y.; Han, Z.Y.; Sun, X.L.; Zhou, T.; Li, X.B. Dynamic Mechanical Properties and Fracturing Behavior of Marble Specimens Containing Single and Double Flaws in SHPB Tests. Rock Mech. Rock Eng. 2019, 52, 1623–1643. [Google Scholar] [CrossRef]
  9. International Society for Rock Mechanics. Suggested methods for determining tensile strength of rock materials. Int. J. Rock Mech. Min. Sci. Geomech. Abstr. 1978, 15, 99–103. [Google Scholar] [CrossRef]
  10. Akazawa, T. New test method for evaluating internal stress due to compression of concrete: The splitting tension test. J. Jpn. Soc. Civ. Eng. 1943, 29, 777–787. [Google Scholar]
  11. Carneiro, F. A new method to determine the tensile strength of concrete. In Proceedings of the 5th Meeting of the Brazilian Association for Technical Rules, Rio de Janeiro, Brazil, 16 September 1943; pp. 126–129. [Google Scholar]
  12. Li, D.Y.; Wong, L. The Brazilian disc test for rock mechanics applications: Review and new insights. Rock Mech. Rock Eng. 2013, 46, 269–287. [Google Scholar] [CrossRef]
  13. American Society for Testing and Materials International (ASTM). Standard Test Method for Splitting Tensile Strength of Intact Rock Core Specimens; ASTM D3967-16; ASTM International: West Conshohocken, PA, USA, 2016. [Google Scholar]
  14. National Standards Compilation Group of People’s Republic of China. Standard for Tests Method of Engineering Rock Masses; GB/T 50266-99; China Plan Press: Beijing, China, 1999.
  15. Fairhurst, C. On the validity of the ‘Brazilian’ test for brittle materials. Int. J. Rock Mech. Min. Sci. Geomech. Abstr. 1964, 1, 535–546. [Google Scholar] [CrossRef]
  16. Hudson, J.A.; Brown, E.T.; Rummel, F. The controlled failure of rock discs and rings loaded in diametral compression. Int. J. Rock Mech. Min. Sci. Geomech. Abstr. 1972, 9, 241–248. [Google Scholar] [CrossRef]
  17. Yu, Y. Questioning the validity of the Brazilian test for determining tensile strength of rocks. Chin. J. Rock Mech. Eng. 2005, 24, 1150–1157. (In Chinese) [Google Scholar]
  18. Hooper, J.A. The failure of glass cylinders in diametral compression. J. Mech. Phys. Solids 1971, 19, 179–200. [Google Scholar] [CrossRef]
  19. Mellor, M.; Hawkes, I. Measurement of tensile strength by diametral compression of discs and annuli. Eng. Geol. 1971, 5, 173–225. [Google Scholar] [CrossRef]
  20. Jaeger, J.C.; Cook, N.G.W. Fundamentals of Rock Mechanics; Chapman and Hall: London, UK, 1976. [Google Scholar]
  21. Swab, J.; Yu, J.; Gamble, R.; Kilczewski, S. Analysis of the diametral compression method for determining the tensile strength of transparent magnesium aluminate spinel. Int. J. Fract. 1971, 172, 187–192. [Google Scholar] [CrossRef]
  22. Erarslan, N.; Williams, D.J. Experimental, numerical and analytical studies on tensile strength of rocks. Int. J. Rock Mech. Min. Sci. 2012, 49, 21–30. [Google Scholar] [CrossRef]
  23. Yanagidani, T.; Sano, O.; Terada, M.; Ito, I. The observation of cracks propagating in diametrically-compressed rock discs. Int. J. Rock Mech. Min. Sci. Geomech. Abstr. 1978, 15, 225–235. [Google Scholar] [CrossRef]
  24. Steen, B.; Vervoort, A.; Napier, J.A.L. Observed and simulated fracture pattern in diametrically loaded discs of rock material. Int. J. Fract. 2005, 131, 35–52. [Google Scholar] [CrossRef]
  25. Zhu, W.C.; Tang, C.A. Numerical simulation of Brazilian disk rock failure under static and dynamic loading. Int. J. Rock Mech. Min. Sci. 2006, 43, 236–252. [Google Scholar] [CrossRef]
  26. Cai, M.; Kaiser, P.K. Numerical simulation of the Brazilian test and the tensile strength of anisotropic rocks and rocks with pre-existing cracks. Int. J. Rock Mech. Min. Sci. 2004, 41, 450–451. [Google Scholar] [CrossRef]
  27. Yu, Y.; Yin, J.M.; Zhong, Z.W. Shape effects in the Brazilian tensile strength test and a 3D FEM correction. Int. J. Rock Mech. Min. Sci. 2006, 43, 623–627. [Google Scholar] [CrossRef]
  28. Yu, Y.; Zhang, J.X.; Zhang, J.C. A modified Brazilian disk tension test. Int. J. Rock Mech. Min. Sci. 2009, 46, 421–425. [Google Scholar] [CrossRef]
  29. Lavrov, A.; Vervoort, A. Theoretical treatment of tangential loading effects on the Brazilian test stress distribution. Int. J. Rock Mech. Min. Sci. 2002, 39, 275–283. [Google Scholar] [CrossRef]
  30. Markides, C.F.; Pazis, D.N.; Kourkoulis, S.K. Influence of friction on the stress field of the Brazilian tensile test. Rock Mech. Rock Eng. 2011, 44, 113–119. [Google Scholar] [CrossRef]
  31. Dorogoy, A.; Banks-Sills, L. Effect of crack face contact and friction on Brazilian disk specimens—A finite difference solution. Eng. Fract. Mech. 2005, 72, 2758–2773. [Google Scholar] [CrossRef]
  32. Markides, C.F.; Kourkoulis, S.K. The stress field in a standardized brazilian disc: The influence of the loading type acting on the actual contact length. Rock Mech. Rock Eng. 2012, 45, 145–158. [Google Scholar] [CrossRef]
  33. Markides, C.F.; Pazis, D.N.; Kourkoulis, S.K. Closed full-field solutions for stresses and displacements in the Brazilian disk under distributed radial load. Int. J. Rock Mech. Min. Sci. 2010, 7, 227–237. [Google Scholar] [CrossRef]
  34. Exadaktylos, G.E.; Kaklis, K.N. Applications of an explicit solution for the transversely isotropic circular disc compressed diametrically. Int. J. Rock Mech. Min. Sci. 2001, 38, 227–243. [Google Scholar] [CrossRef]
  35. Claesson, J.; Bohloli, B. Brazilian test: Stress field and tensile strength of anisotropic rocks using an analytical solution. Int. J. Rock Mech. Min. Sci. 2002, 39, 991–1004. [Google Scholar] [CrossRef]
  36. Tavallali, A.; Vervoort, A. Effect of layer orientation on the failure of layered sandstone under Brazilian test conditions. Int. J. Rock Mech. Min. Sci. 2010, 47, 313–322. [Google Scholar] [CrossRef]
  37. Aliabadian, Z.; Zhao, G.F.; Russell, A.R. Crack development in transversely isotropic sandstone discs subjected to Brazilian tests observed using digital image correlation. Int. J. Rock Mech. Min. Sci. 2019, 119, 211–221. [Google Scholar] [CrossRef]
  38. Komurlu, E.; Kesimal, A. Jaw effects on indirect tensile strength test disc failure mechanism. In Proceedings of the 7th Asian Rock Mechanics Symposium, Seoul, Korea, 15–19 October 2012; pp. 624–637. [Google Scholar]
  39. Sgambitterra, E.; Lamuta, C.; Candamano, S.; Pagnotta, L. Brazilian disk test and digital image correlation: A methodology for the mechanical characterization of brittle materials. Mater. Struct. 2018, 51, 19. [Google Scholar] [CrossRef]
  40. Liu, J.F.; Chen, L.; Wang, C.P.; Man, K.; Wang, L.; Wang, J.; Su, R. Characterizing the mechanical tensile behavior of Beishan granite with different experimental methods. Int. J. Rock Mech. Min. Sci. 2014, 69, 50–58. [Google Scholar] [CrossRef]
  41. Stirling, R.A.; Simpson, D.J.; Davie, C.T. The application of digital image correlation to Brazilian testing of sandstone. Int. J. Rock Mech. Min. Sci. 2013, 60, 1–11. [Google Scholar] [CrossRef] [Green Version]
  42. Komurlu, E.; Kesimal, A. Evaluation of Indirect Tensile Strength of Rocks Using Different Types of Jaws. Rock Mech. Rock Eng. 2015, 48, 1723–1730. [Google Scholar] [CrossRef]
  43. Pan, B.; Li, K. A fast digital image correlation method for deformation measurement. Opt. Laser Eng. 2011, 49, 841–847. [Google Scholar] [CrossRef]
  44. Sutton, M.A.; Matta, F.; Rizos, D.; Ghorbani, R.; Rajan, S.; Mollenhauer, D.H.; Schreier, H.W.; Lasprilla, A.O. Recent Progress in Digital Image Correlation: Background and Developments since the 2013 W M Murray Lecture. Exp. Mech. 2017, 57, 1–30. [Google Scholar] [CrossRef]
  45. Chu, T.C.; Ranson, W.F.; Sutton, M.A. Applications of digital-image-correlation techniques to experimental mechanics. Exp. Mech. 1985, 25, 232–244. [Google Scholar] [CrossRef]
  46. Zhou, X.P.; Lian, Y.J.; Wong, L.N.Y.; Berto, F. Understanding the fracture behavior of brittle and ductile multi-flawed rocks by uniaxial loading by digital image correlation. Eng. Fract. Mech. 2018, 199, 438–460. [Google Scholar] [CrossRef]
  47. Zhang, H.; Huang, G.Y.; Song, H.P.; Kang, Y.L. Experimental investigation of deformation and failure mechanisms in rock under indentation by digital image correlation. Eng. Fract. Mech. 2012, 96, 667–675. [Google Scholar] [CrossRef]
  48. CorelatedSolutions. CSI Application Note AN-824; Correlated Solutions: Columbia, SC, USA, 2010; Available online: www.CorrelatedSolutions.com (accessed on 20 May 2020).
  49. CorelatedSolutions. Vic-3D 2010 Reference Manual; Correlated Solutions: Columbia, SC, USA, 2010; Available online: www.CorrelatedSolutions.com (accessed on 20 May 2020).
  50. Hucka, V.; Das, B. Brittleness determination of rocks by different methods. Int. J. Rock Mech. Min. Sci. Geomech. Abstr. 1974, 11, 389–392. [Google Scholar] [CrossRef]
  51. Yang, S.; Yin, P.; Huang, Y. Experiment and discrete element modelling on strength, deformation and failure behaviour of shale under Brazilian compression. Rock Mech. Rock Eng. 2019, 52, 4339–4359. [Google Scholar] [CrossRef]
  52. Wang, C.; Li, S.Y.; Zhang, T.W.; You, Z.M. Experimental Study on Mechanical Characteristics and Fracture Patterns of Unfrozen/Freezing Saturated Coal and Sandstone. Materials 2019, 12, 992. [Google Scholar] [CrossRef] [Green Version]
  53. Bhavikatti, S.; Bhat, M.R.; Murthy, C.R.L. Fatigue crack growth monitoring in Ti-6Al-4V alloy using acoustic emission technique and digital image correlation. J. Nondestruct. Eval. 2011, 9, 4. [Google Scholar]
  54. Yu, Y.; Xu, Y. Method to determine tensile strength of rock using flattened Brazilian disk. Chin. J. Rock Mech. Eng. 2006, 25, 1457–1462. (In Chinese) [Google Scholar]
  55. Pandey, P.; Singh, D.P. Deformation of a rock in different tensile tests. Eng. Geol. 1986, 22, 281–292. [Google Scholar] [CrossRef]
  56. Efimov, V.P. The rock strength in different tension conditions. J. Min. Sci. 2009, 45, 569–575. [Google Scholar] [CrossRef]
  57. Fuenkajorn, K.; Klanphumeesri, S. Laboratory determination of direct tensile strength and deformability of intact rocks. Geotech. Test. J. 2011, 34, 103134. [Google Scholar]
  58. Ye, J.H.; Wu, F.Q.; Sun, J.Z. Estimation of the tensile elastic modulus using Brazilian disc by applying diametrically opposed concentrated loads. Int. J. Rock Mech. Min. Sci. 2009, 46, 568–576. [Google Scholar]
Figure 1. Typical Brazilian tensile test loading configurations: (a) flat loading platens; (b) flat loading platens with two small diameter steel rods and (c) curved loading jaws.
Applsci 10 05513 g001
Figure 2. (a) A typical speckled pattern of specimen WS3-1; and (b) experimental setup for the Brazilian test.
Applsci 10 05513 g002aApplsci 10 05513 g002b
Figure 3. Average tensile strength of different rock types under three typical loading configurations.
Applsci 10 05513 g003
Figure 4. Load–displacement curves of representative specimens of (a) WS, (b) RS, (c) M, (d) G and (e) B for each loading method (WS, RS, M, G, B represents white sandstone, red sandstone, marble, granite and basalt, respectively).
Applsci 10 05513 g004aApplsci 10 05513 g004b
Figure 5. Transition of strain and stress contour diagram of specimen RS3-2.
Applsci 10 05513 g005
Figure 6. (a) Seven virtual extensometers assigned equally along the loading diameter; (b) the lateral strains history during the loading process.
Applsci 10 05513 g006
Figure 7. The distribution of the Mohr equivalent stress along the loaded diameter for different rock types.
Applsci 10 05513 g007
Figure 8. Strain profiles across loaded diameter just before the peak load in Type II tests.
Applsci 10 05513 g008
Figure 9. (a) Three possible crack initiation positions; (b) evolution of tensile and shear strains at these interest areas.
Applsci 10 05513 g009
Figure 10. The failure patterns of representative specimens tested by (a) Type I, (b) Type II and (c) Type III loading configurations.
Applsci 10 05513 g010aApplsci 10 05513 g010b
Table 1. Testing results of the uniaxial compression tests.
Rock TypeParameterMean ValueStandard Deviation
White sandstone σ c   ( MPa ) 37.70.6
E (GPa) 9.20.2
ν 0.150.01
Red sandstone σ c   ( MPa ) 62.60.8
E (GPa) 14.80.6
ν 0.180.01
Marble σ c   ( MPa ) 79.20.7
E (GPa) 43.70.6
ν 0.210.01
Granite σ c   ( MPa ) 171.70.4
E (GPa) 72.20.9
ν 0.230.01
Basalt σ c   ( MPa ) 158.43.3
E (GPa) 61.92.1
ν 0.250.01
Table 2. Specimen dimensions and the Brazilian test results.
Specimens No.D/mmt/mmPmax/kNσt/MPaMean/MPaBI
WS1-1 148.9825.094.542.352.32
WS1-249.0825.094.262.20
WS1-349.0925.094.622.39
WS2-149.0225.112.941.521.52
WS2-249.0525.103.001.55
WS2-349.0125.092.881.49
WS3-149.0625.094.962.572.3416.11
WS3-248.9925.094.302.19
WS3-348.9825.064.362.26
RS1-149.0925.058.794.554.15
RS1-249.0625.057.703.99
RS1-349.0725.027.523.90
RS2-149.0225.045.232.712.84
RS2-249.0625.066.243.23
RS2-349.0225.034.962.57
RS3-149.0725.0210.085.235.2012.04
RS3-249.0325.0210.105.24
RS3-349.0325.069.905.13
M1-149.0725.036.193.213.32
M1-249.0525.087.353.81
M1-349.0525.015.662.94
M2-149.0525.085.402.802.90
M2-249.0425.045.732.97
M2-349.0525.075.602.92
M3-149.3925.318.404.284.0219.70
M3-249.0324.997.293.80
M3-348.9625.017.613.96
G1-148.8125.1024.8712.9312.88
G1-248.8625.0823.8612.40
G1-348.8425.1025.6213.31
G2-148.8925.0717.459.079.11
G2-248.8925.0616.858.76
G2-348.8725.1118.319.50
G3-148.9125.1125.2413.0913.4912.73
G3-248.9225.1226.8413.91
G3-348.8625.1225.9713.48
B1-149.5425.0228.3614.5713.45
B1-249.5624.9926.2613.50
B1-349.5624.9823.8912.29
B2-149.5425.0016.858.678.63
B2-249.5425.0017.228.86
B2-349.5924.9816.288.37
B3-149.5225.0328.9414.8716.019.89
B3-249.5325.0131.0415.96
B3-349.5524.9633.4017.20
1 Note: The specimen number describes the rock type and testing conditions. For example, specimen WS1, WS2 and WS3 denote white sandstone specimens tested with Type I [13], Type II [14] and Type III [9] specification, respectively.
Table 3. The tensile strain contour plots of representative tested specimens prior to failure.
Rock TypeType I TestType II TestType III Test
White sandstone Applsci 10 05513 i001 Applsci 10 05513 i002 Applsci 10 05513 i003
Red sandstone Applsci 10 05513 i004 Applsci 10 05513 i005 Applsci 10 05513 i006
Marble Applsci 10 05513 i007 Applsci 10 05513 i008 Applsci 10 05513 i009
Granite Applsci 10 05513 i010 Applsci 10 05513 i011 Applsci 10 05513 i012
Basalt Applsci 10 05513 i013 Applsci 10 05513 i014 Applsci 10 05513 i015

