Article

Optimization and Economic Analysis for Small-Scale Movable LNG Liquefaction Process with Leakage Considerations

1
Department of Chemical and Biological Engineering, Sookmyung Women’s University, Seoul 04310, Korea
2
Green Materials & Process R&D Group, Korea Institute of Industrial Technology, 55 Jongga-ro, Jung-gu, Ulsan 44413, Korea
*
Author to whom correspondence should be addressed.
Appl. Sci. 2020, 10(15), 5391; https://doi.org/10.3390/app10155391
Submission received: 10 July 2020 / Revised: 30 July 2020 / Accepted: 3 August 2020 / Published: 4 August 2020
(This article belongs to the Special Issue Recent Advances in Sustainable Process Design and Optimization)

Abstract

:
In this study, exergy and economic analysis were conducted to gain insight on small-scale movable LNG liquefaction considering leakage. Optimization and comparison were performed to demonstrate the quantitative results of single mixed refrigerant, dual nitrogen expansion, and the propane pre-cooling self-refrigeration processes. For the optimization, exergy efficiency was used as the objective function; the results showed that exergy efficiencies are 38.85%, 19.96%, and 13.65%, for single mixed refrigerant, dual nitrogen expansion, and propane pre-cooling self-refrigeration, respectively. Further, the cost analysis showed that the product cost of each process is 4002.3 USD/tpa, 5490.2 USD/tpa, and 9608.5 USD/tpa. A sensitivity analysis was conducted to determine parameters that affect exergy and cost. The SMR process is the most competitive in terms of exergy efficiency, product cost, and operability, without considering makeup facilities.

1. Introduction

Energy demand has gradually increased from the last decade because of the economic development and population growth around the world [1]. Liquefied natural gas (LNG) is becoming a primary energy resource in the global energy market owing to its cleanness, ease of transportability, and lower greenhouse gas emissions compared to other fossil fuels [2]. These positive advantages of LNG have attracted considerable attention in view of the current energy crisis.
Liquefying natural gas and pipeline transportation are two major methods for transporting natural gas. However, the pipeline method is not economical for long-distance transportation because of unstable gas flow rates [3]. Therefore, liquefying natural gas can be the best method to transport natural gas across the ocean.
The international gas union reported that various countries are constructing LNG liquefaction plants because of their rapidly growing reliance on natural gas from Asia to America [4]. Thus far, centralized large-capacity LNG liquefaction plants have been widely used; however, there has been an increasing interest toward distributed LNG liquefaction systems because of isolated small natural gas reservoirs [3], energy supply to isolated areas, and LNG bunkering systems [5]. Distributed LNG liquefaction plants can be classified into small-scale liquefaction plants with capacities of less than 40 million standard cubic feet per day or about 700 tonne per day (tpd) [6]. To satisfy the growing demand of LNG, movable and economically efficient small-scale LNG processes such as single mixed refrigerant (SMR) process and expander cycle have been studied [7].
Energy and exergy efficiencies are key factors for evaluating the performance of small-scale LNG processes [8]. Khan and Lee employed particle swarm optimization (PSO) on the SMR process to enhance exergy efficiency, and the result of enhanced exergy efficiency was 50.77% after optimization [9]. Qyyum et al. [10] proposed a dual effect SMR (DSMR) LNG liquefaction cycle that has relatively lower cost and energy efficiencies. The DSMR process uses a SMR loop that separates into dual cooling and subcooling loops, and it can replace the classical dual mixed refrigerant process. Further, they reported that the exergy efficiency of the DSMR process is 36.62% and the total annualized cost is 1565 MM USD/year. Qyyum et al. [11] attempted to replace a Joule-Thomson (JT) valve with a hydraulic turbine (HT) in the SMR process to improve energy and exergy efficiencies. The energy consumption reduced up to 16.5% and the exergy efficiency can be improved up to 10.95% compared to the conventional SMR process. The effect of the number of mixed refrigerant (MR) components in the SMR process was investigated by Tianbiao et al.; they concluded that energy and exergy efficiencies increased with an increase in the number of MR components [12]. Qyyum et al. [13] proposed a hybrid modified coordinate descent (HMCD) algorithm to optimize the SMR process. They compared the optimization performance of the HMCD to other optimization algorithms such as PSO, knowledge-based optimization, and genetic algorithm. The HMCD showed better performance in terms of energy savings and coefficient of performance compared to other optimization algorithms.
Although the SMR process has higher energy and exergy efficiency compared to the nitrogen expansion cycle, the nitrogen expansion cycle is suited for small-scale LNG liquefaction because it is more safe and easy to operate [14]. The nitrogen expansion cycle has been studied by several researchers. He and Ju [15] proposed a novel conceptual design of parallel nitrogen expansion liquefaction for small-scale plants. They installed expanders in parallel to reduce the temperature difference, which can help achieve high exergy efficiencies. Thus, their proposed process could reduce the unit energy consumption by 4.69% compared to the conventional nitrogen expansion liquefaction. Further, He and Ju [16] investigated the performance of the two different refrigerants (R410a and propane) for pre-cooling the nitrogen expansion cycle. They optimized three different processes using specific energy consumption as the objective function and proved that nitrogen expansion with the R410a pre-cooling cycle is better than that with or without the propane pre-cooling cycle. Yuan et al. [17] proposed a novel small-scale liquefaction that uses single nitrogen expansion with a carbon dioxide pre-cooling cycle. They compared the energy consumption of the proposed process with three different small-scale LNG liquefaction cycles such as a propane pre-cooling MR cycle, an N2-CH4 expander cycle, and a modified mixed refrigerant cycle (MRC). They concluded that the proposed cycle achieved the lowest energy consumption (9.90 kWh/kmol) among all compared processes and insisted on the advantages of considerable stability and simple capability of their process. Qyyum et al. [18] proposed the closed-loop self-cooling recuperative N2 expander cycle, wherein they added a recuperator to the single nitrogen expansion cycle to reduce exergy losses. In addition, after performing optimization configurations of the proposed process, they concluded that a configuration with a natural gas feed expander can save up to 22.2% of the required energy compared to the base case.
Self-refrigeration LNG liquefaction based on the Linde-Hampson cycle is another improvement in the natural gas liquid (NGL) recovery process [19]. The gas from the separator is partially vaporized, and this vapor is then used as the refrigerant in the cycle to cool the inlet gas. This process is called self-refrigeration, and it can reduce the refrigeration duty of the cooling cycle and the required amount of refrigerants [
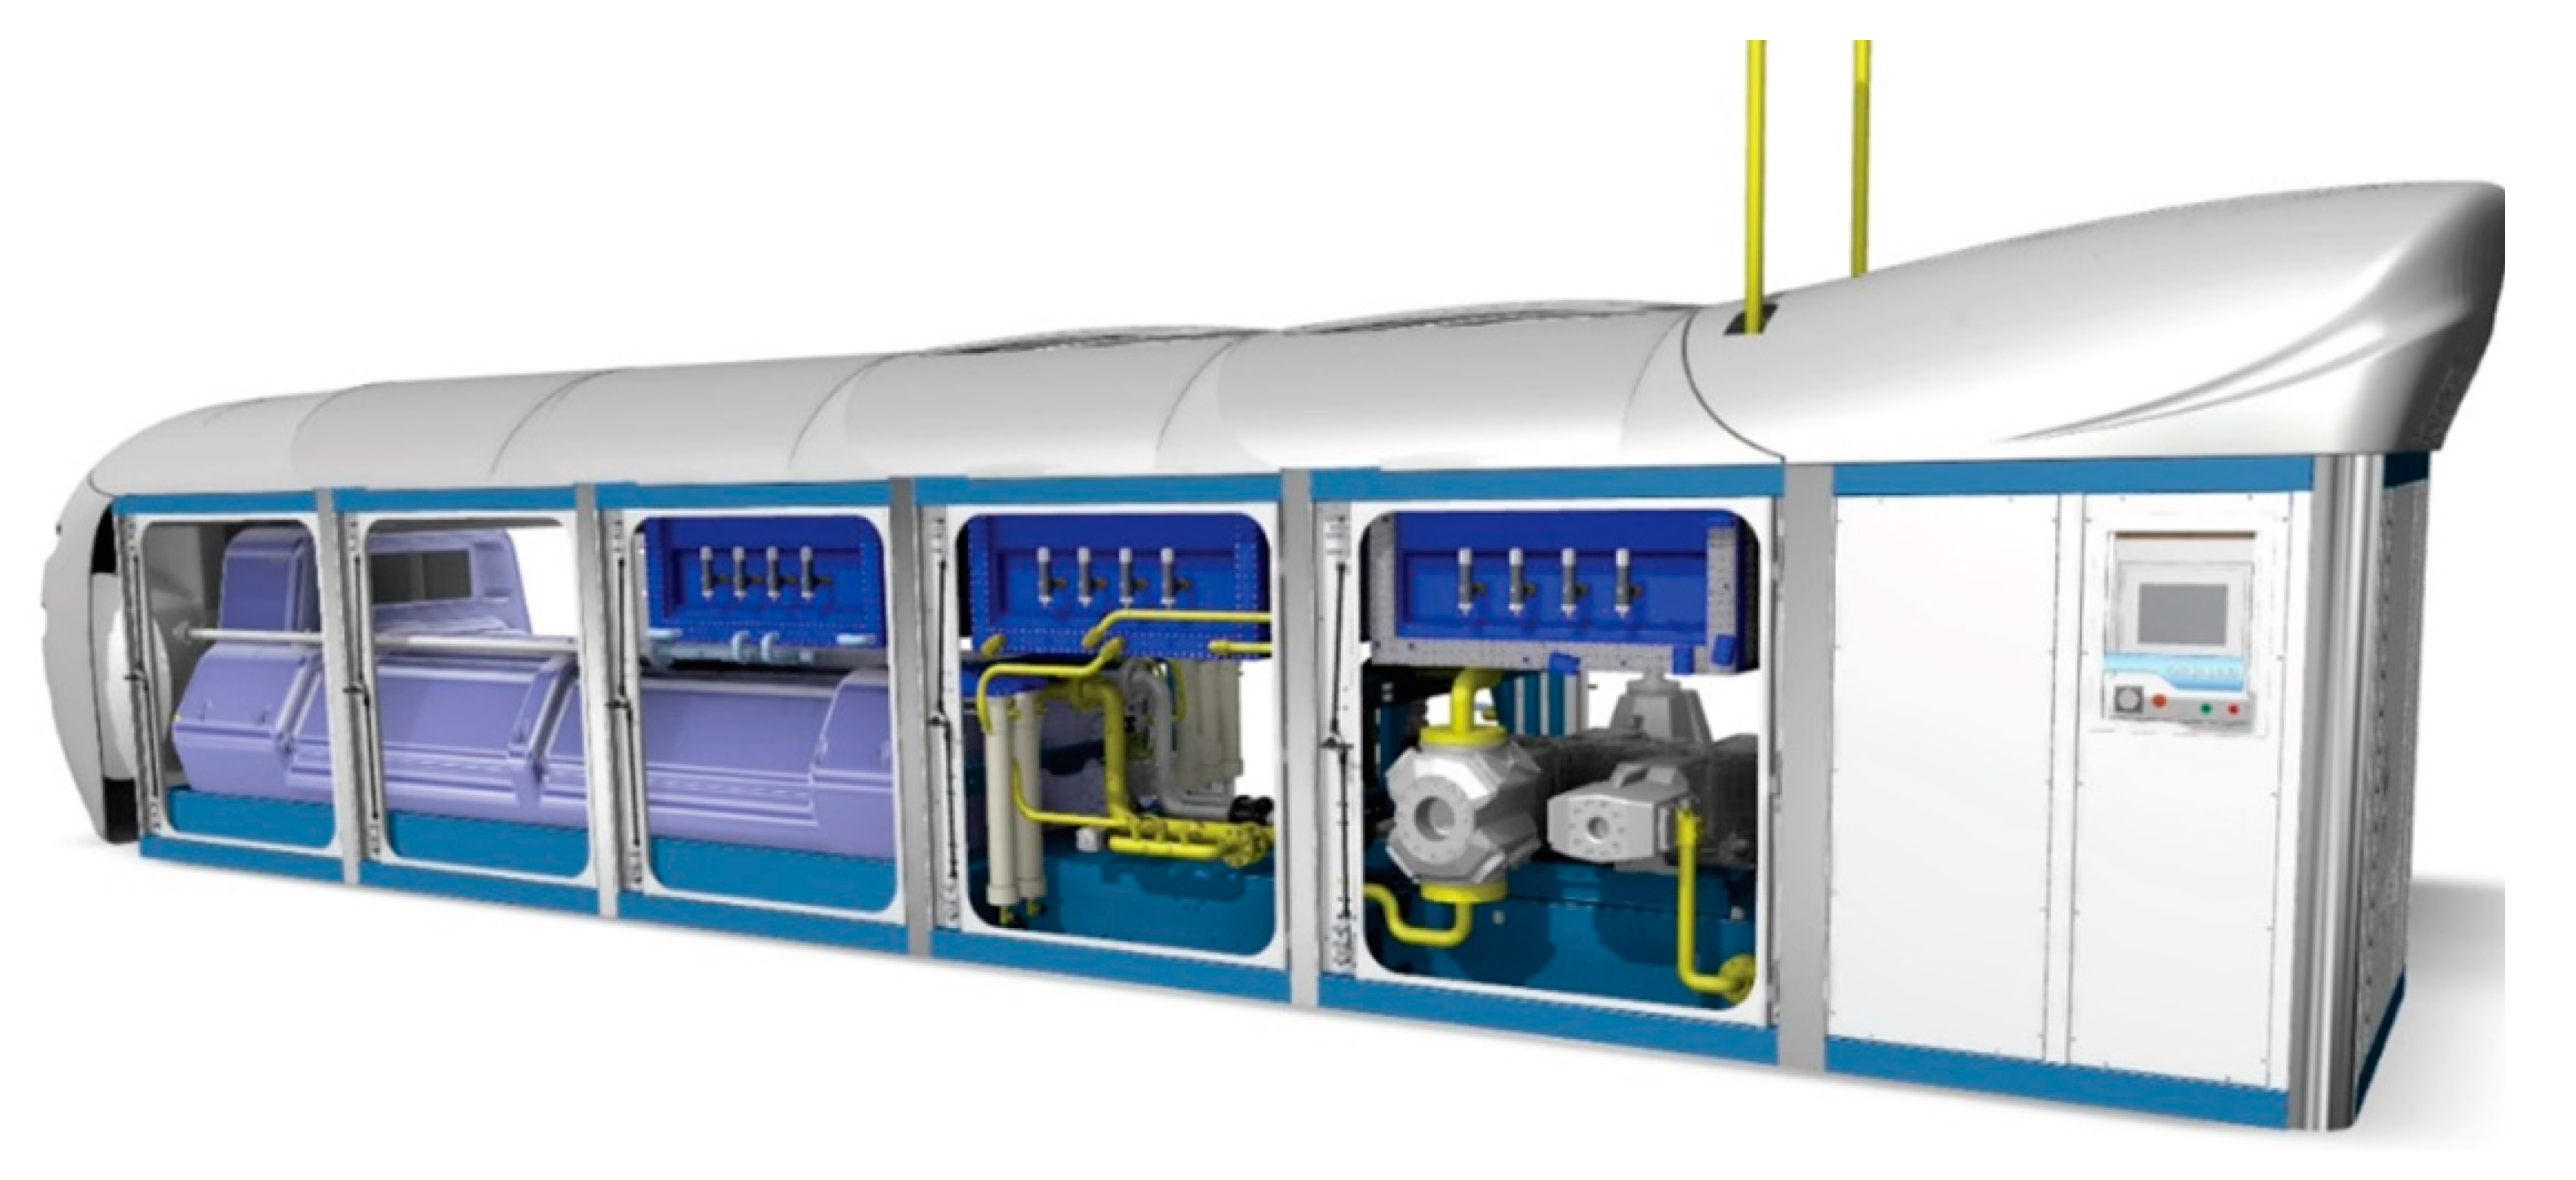
19]. Unfortunately, there have been few studies regarding the self-refrigeration process. The LNG production and transportation company Galileo Technologies developed a small-scale movable LNG liquefaction plant by applying the self-refrigeration technology to their product called Cryobox®; this is an actual commercialized movable LNG production plant [20].
Although various studies developed the LNG liquefaction process, only a few studies focus on the leakage problem on the compressors. Previous studies focused on developing new processes with high exergy or energy efficiency, performing optimizations to increase efficiency, or varying the composition of the refrigerant. Ravukumar et al. [21] pointed out that the potential problem of LNG liquefaction plants is the refrigerant leak from the compressors. Further, the leakage problem can cause considerable problems for entire system, especially in small-scale LNG liquefaction systems where the compressors and seal systems are not leak-tight [22]. Consequently, the sustainability of the LNG liquefaction plants can be improved by solving this leakage problem. The refrigerant leakage problem can be resolved using a makeup system. Although it is easy for large-scale LNG plants to compensate for the leaked refrigerant using an NGL fractionation unit; this is not an economical option for small-scale LNG plants [23]. Therefore, small-scale LNG plants or movable LNG plants need to consider extra external makeup facilities for the leaked refrigerant or to use less leaking compressors [22].
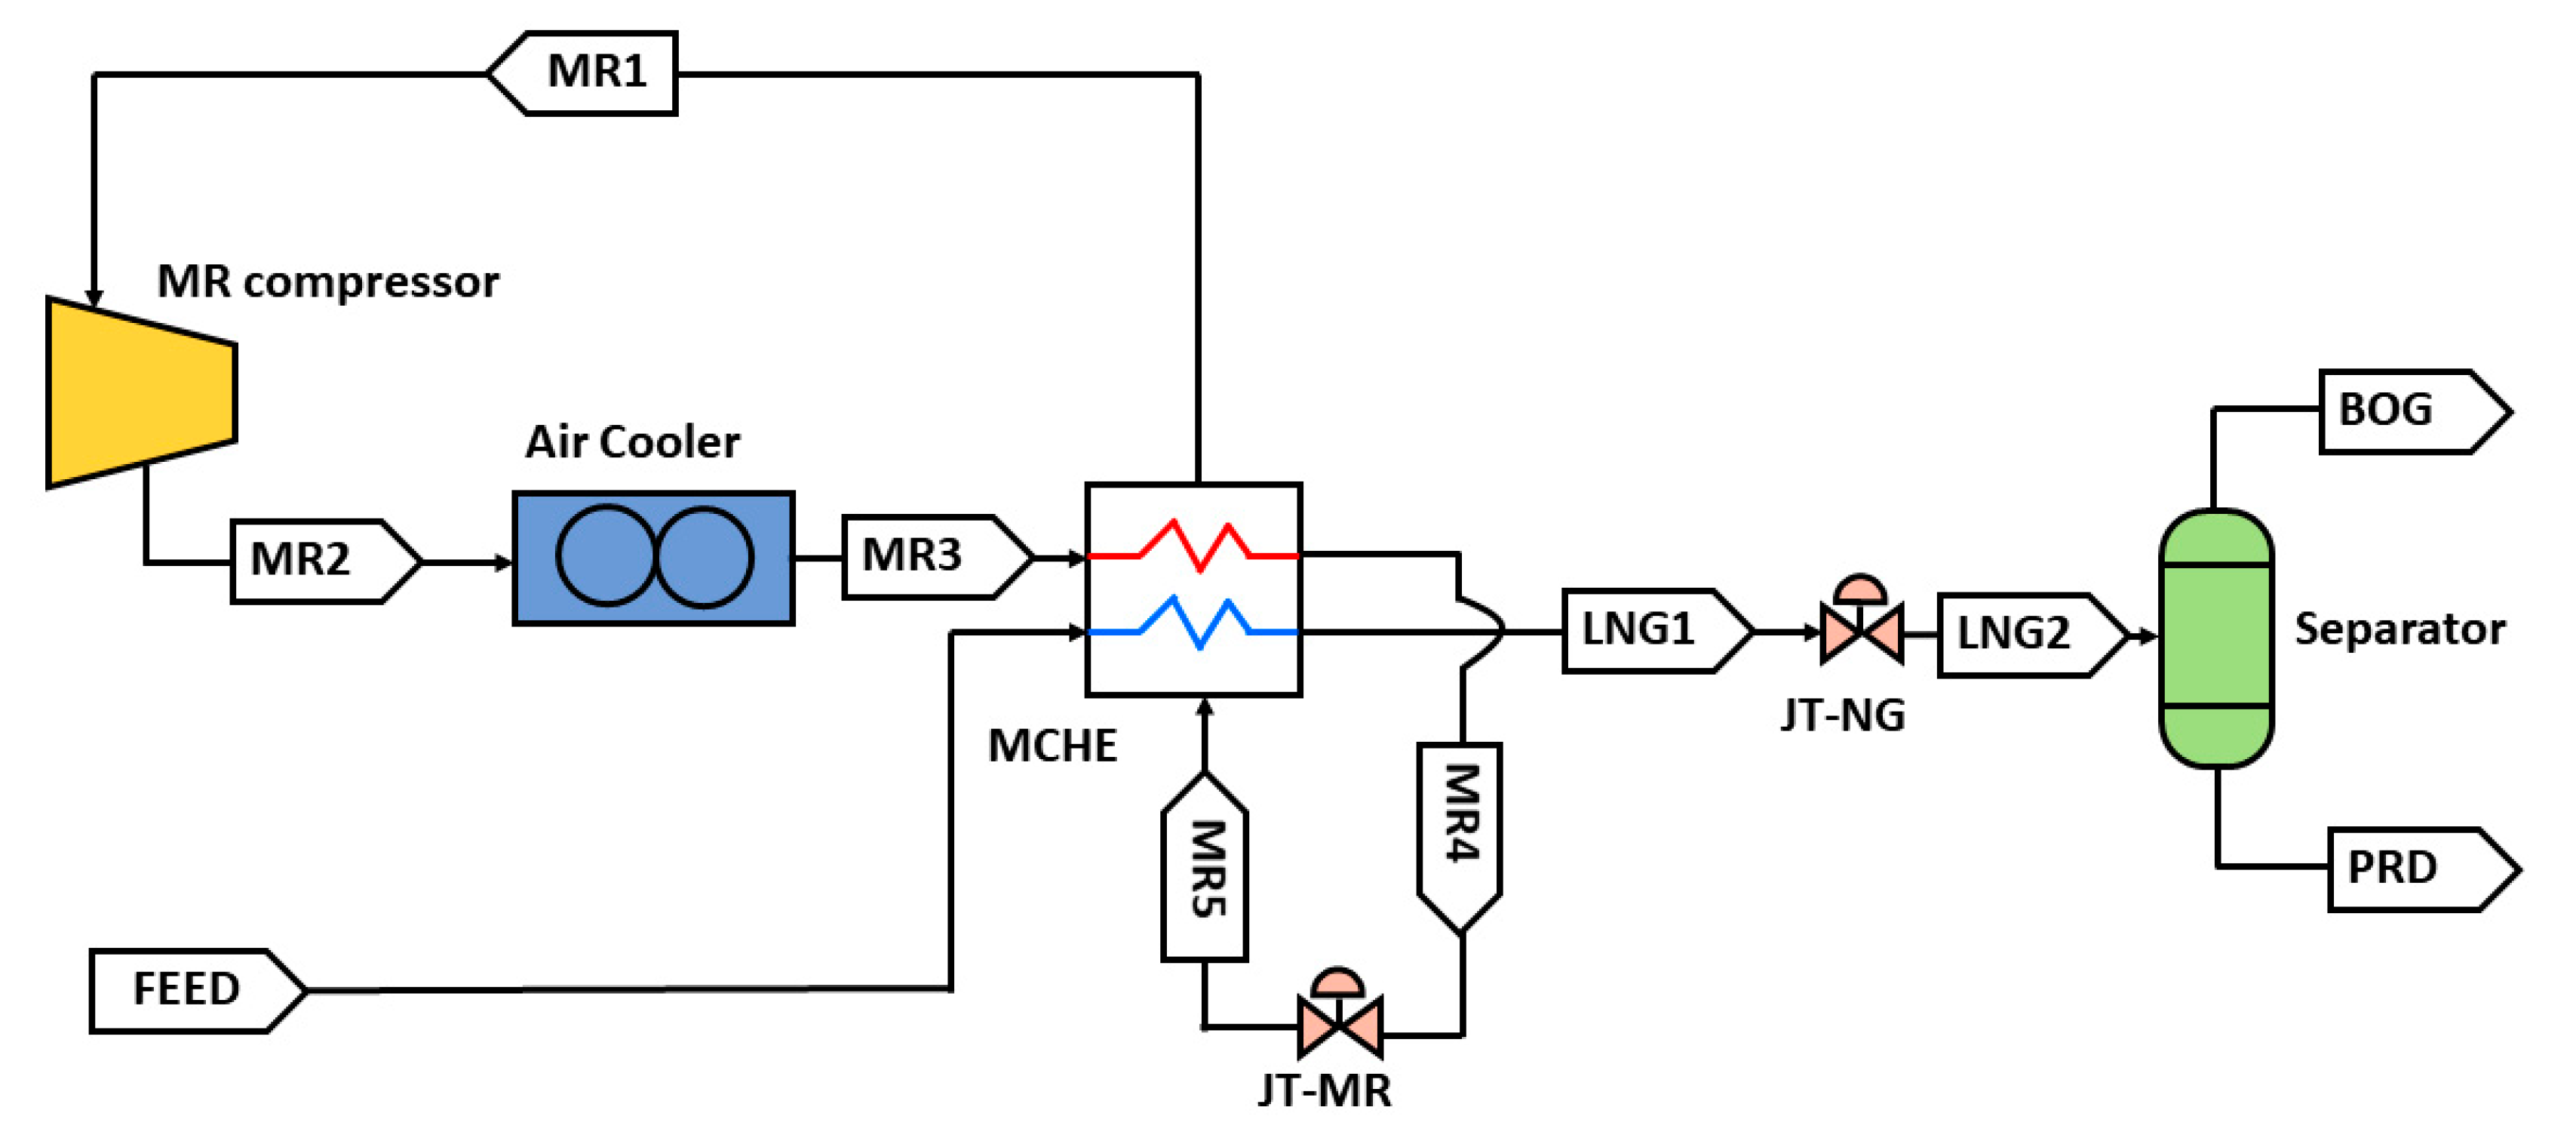
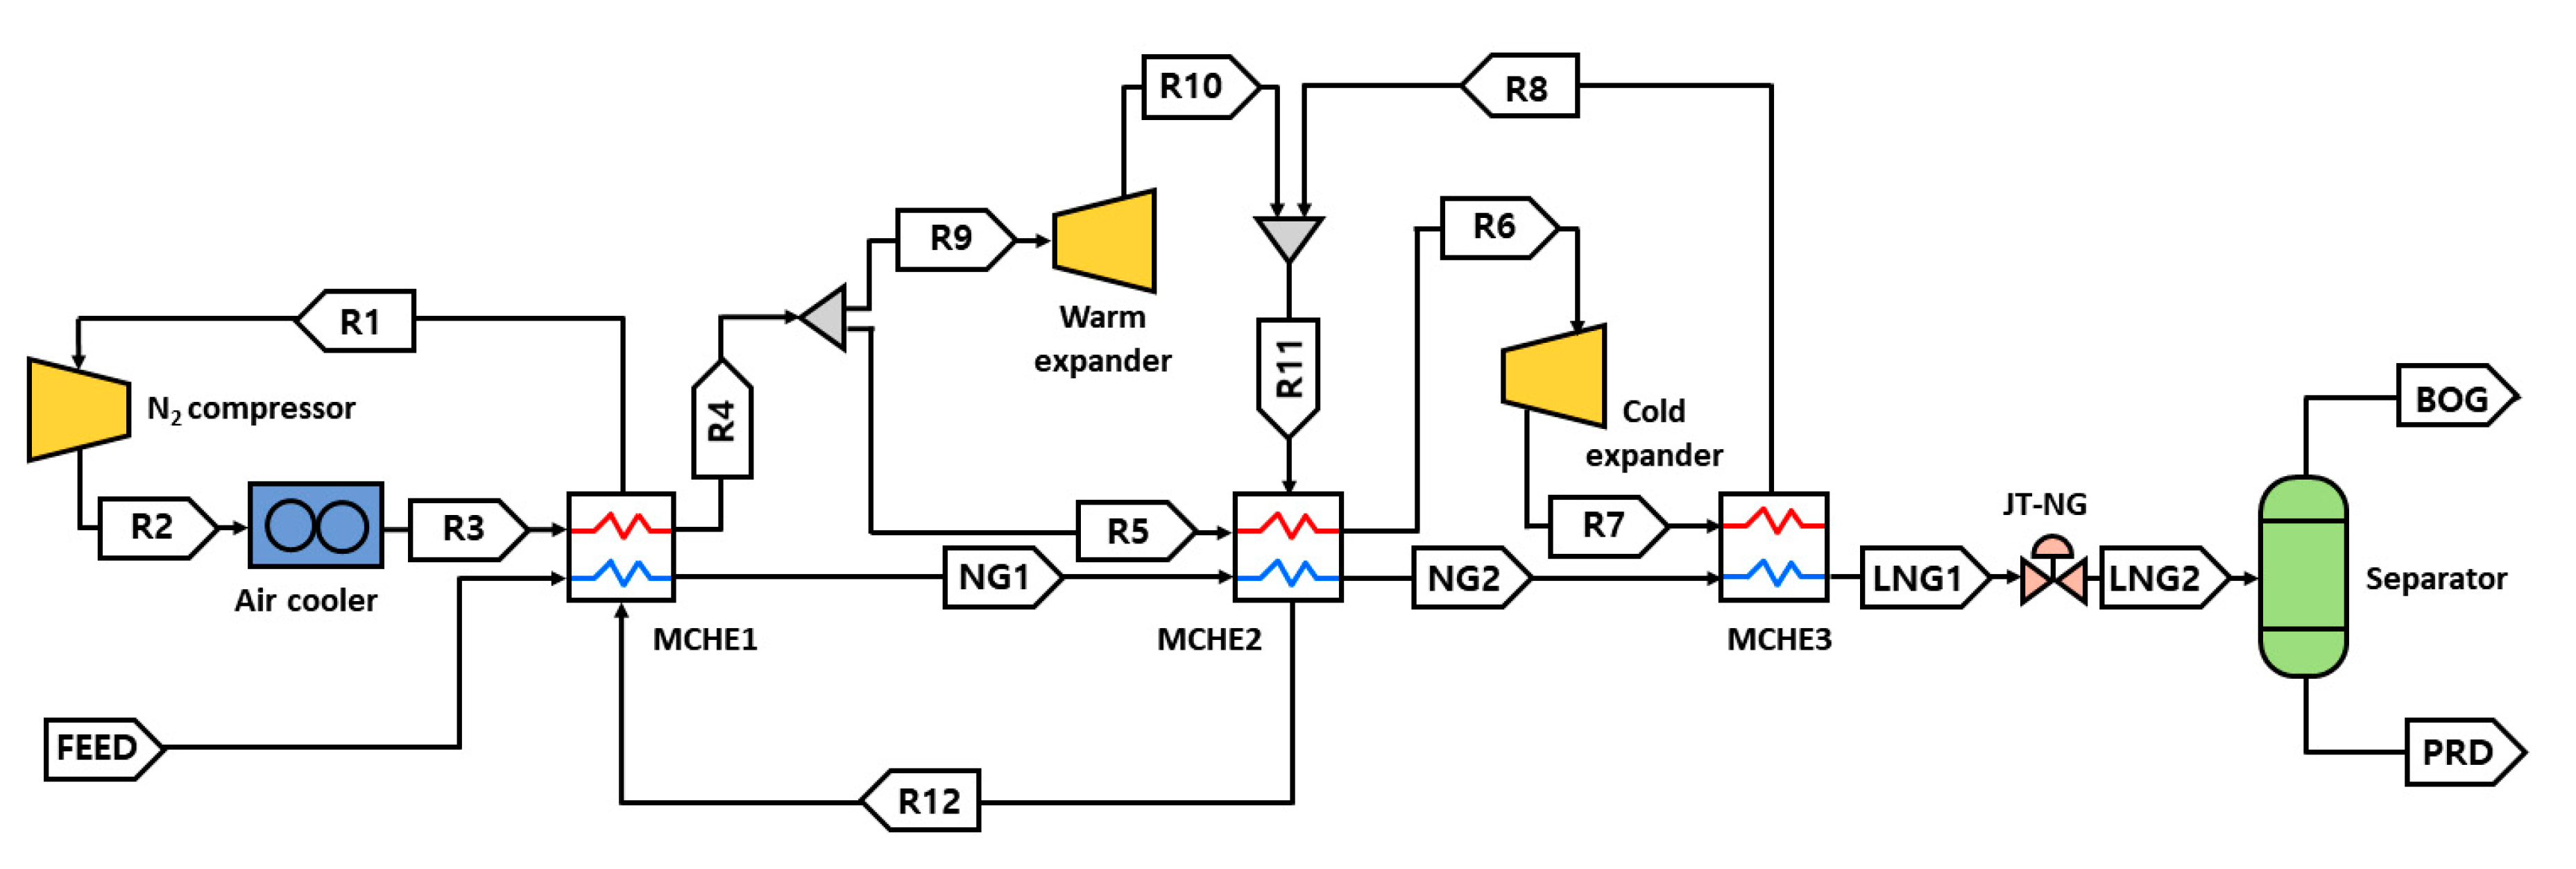
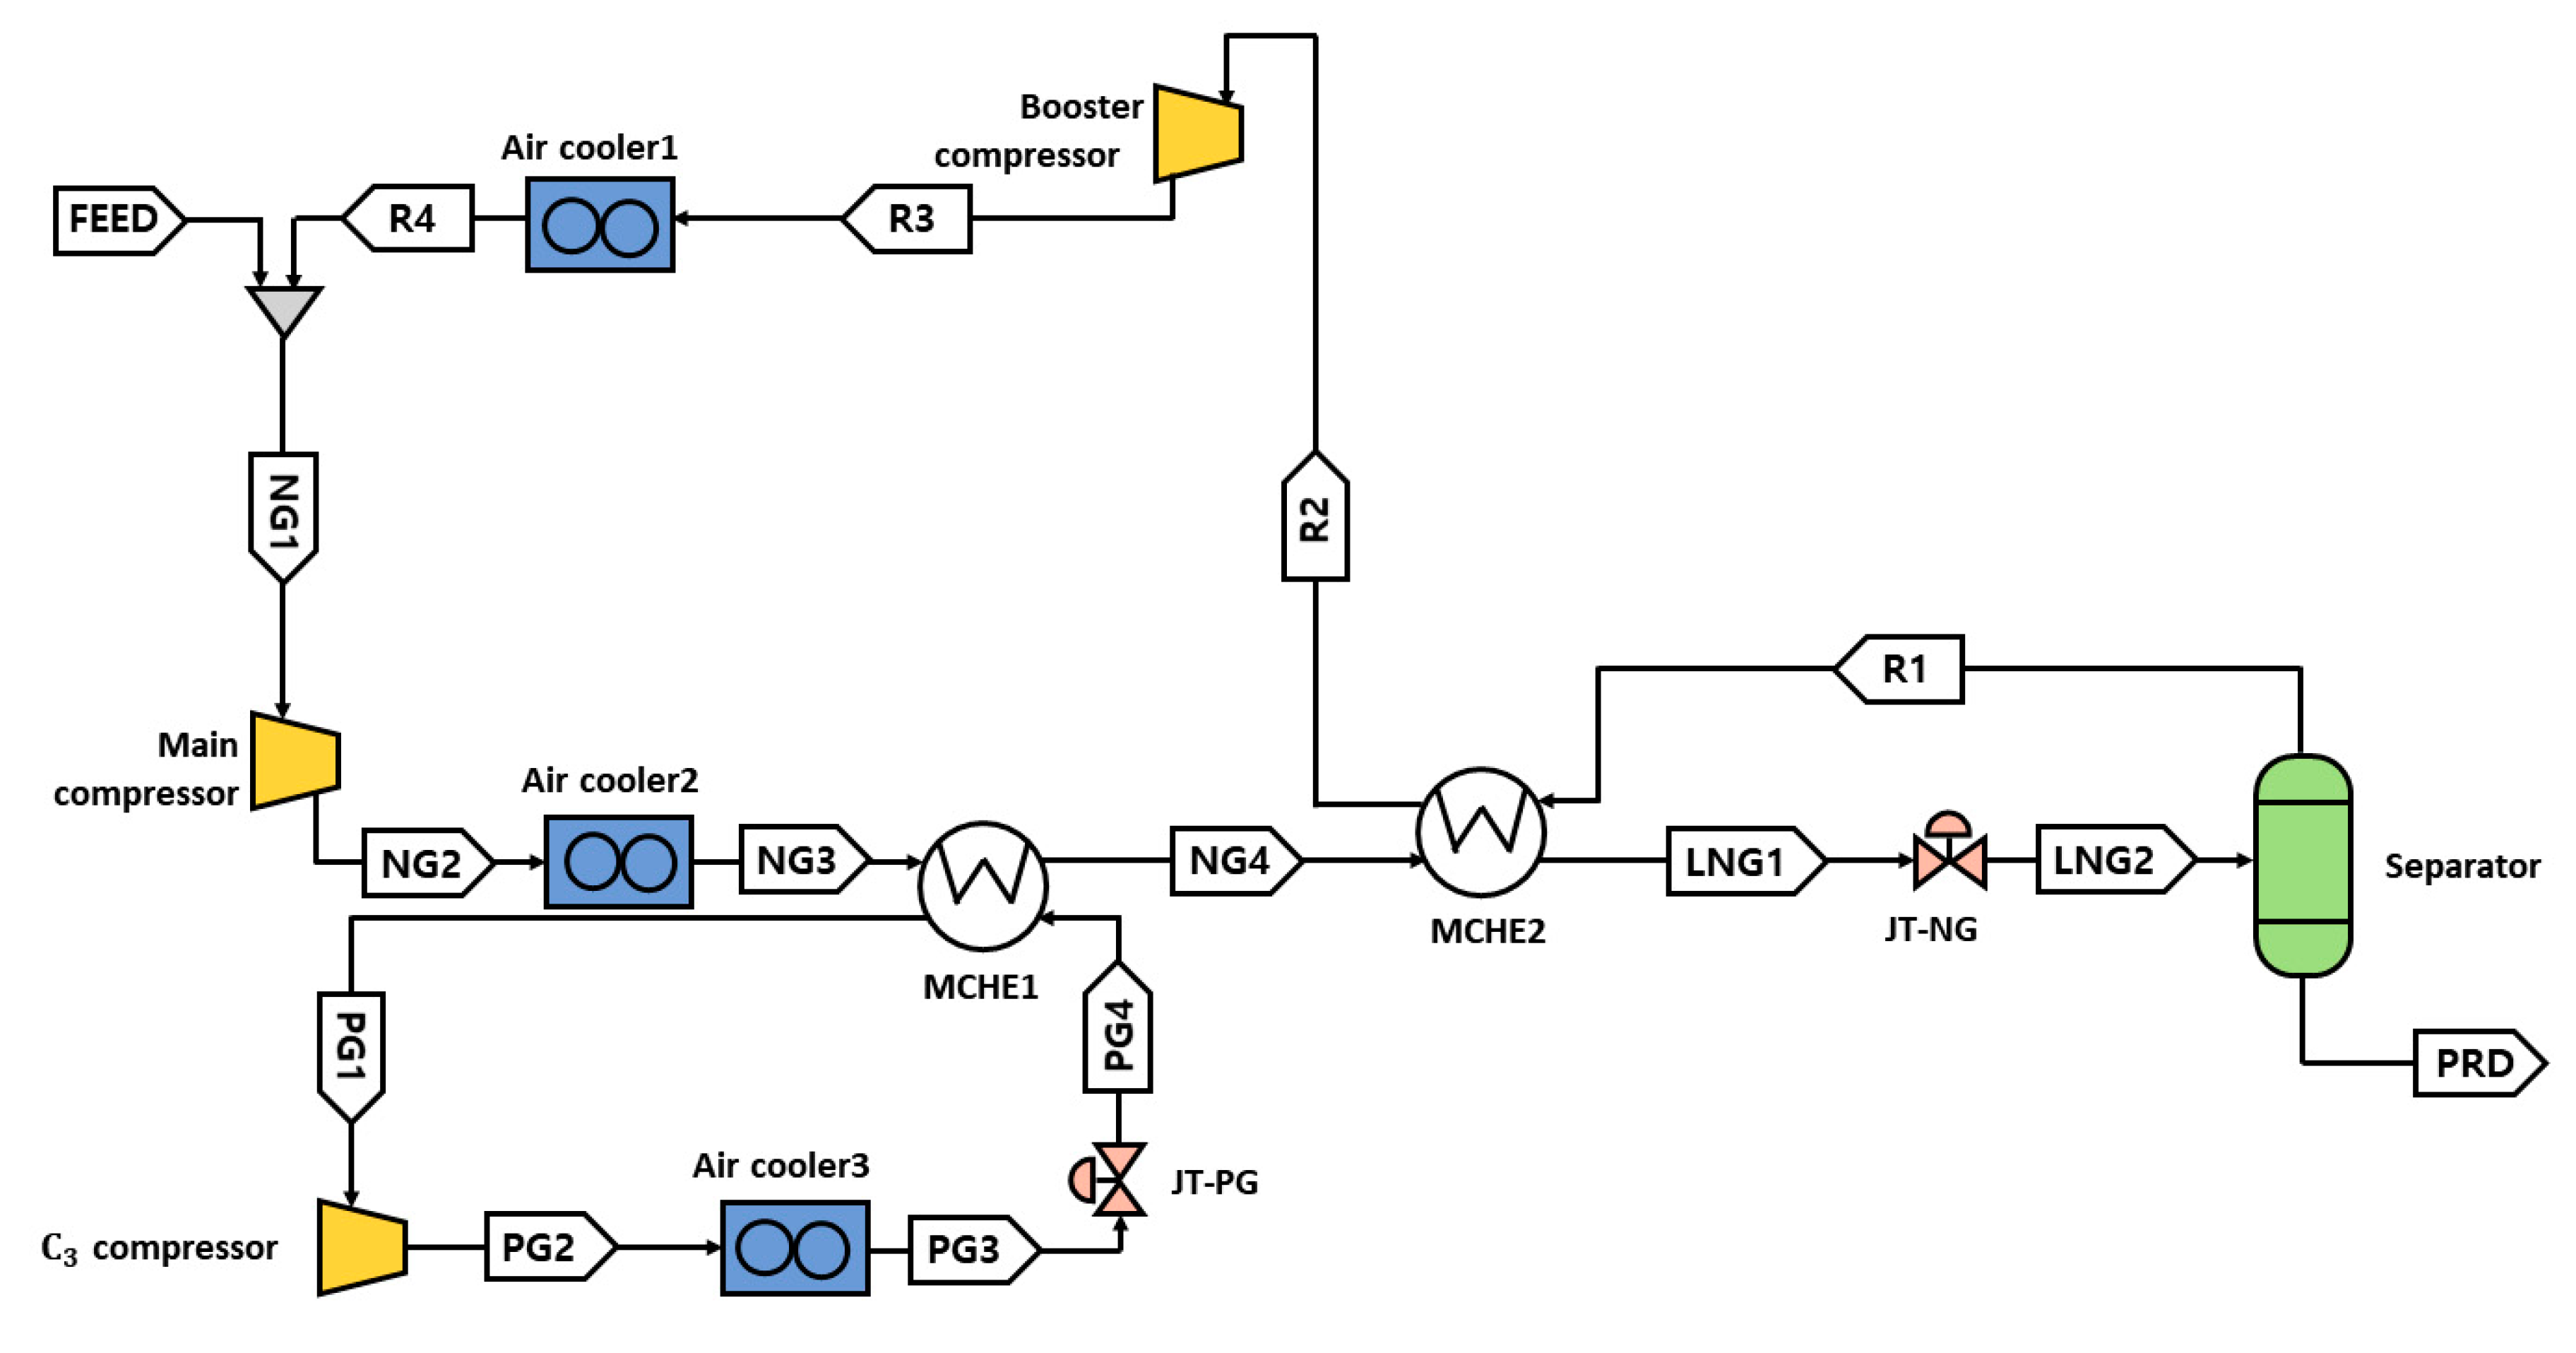
In this study, three LNG liquefaction processes for a small-scale movable LNG liquefaction plant: SMR, dual nitrogen expansion, and propane pre-cooled self-refrigeration are investigated considering compressor leakage. To analyze the thermodynamics and economics, exergy efficiency, and product cost of all three processes are calculated in this study. The product cost of a small-scale movable LNG plant is not very economically favored compared to medium to large-scale businesses. However, small-scale movable LNG plant can be considered the first alternative for businesses that require a lower CAPEX and relatively simple on-site infrastructure [24]. Therefore, this paper analyzes whether it is reasonable to have a makeup system to resolve the leakage problem in terms of product cost. This paper is expected to provide more realistic insight into small-scale movable LNG liquefaction plants considering leakage problems to meet the growing demand for small-scale movable LNG plants.
The rest of this paper is organized as follows: The process descriptions of the three LNG liquefaction processes are proposed in Section 2. Further, in this section, the initial conditions of the simulation models and the optimization framework are introduced in detail. Exergy analysis and the cost analysis results are shown with the optimized model in Section 3. The effect of the refrigerant compositions, ambient temperature, electricity cost, and leakage rate on the thermodynamics and economics are investigated via a sensitivity analysis in Section 4. Finally, the conclusion of this study is provided in Section 5.

2. Methods

2.1. Process Description

Since most energy supply systems are operated under a centralized energy system concept [25], the movable LNG liquefaction plant is considered as an alternative for a distributed energy system. This plant can be used to supply LNG to an energy-supply isolated area or in transportation such as on trucks or ships. This study aims to investigate a movable LNG liquefaction plant that comprises compressors/expanders, JT-valves, separators, LNG storage drums, and a motor room as shown in Figure 1.
The SMR, N2 expansion, and propane pre-cooled self-refrigeration processes for the movable LNG liquefaction plant are considered in this study because they have been extensively studied for small-and medium-scale LNG plants owing to their low capital expenditures [26], low equipment count, and simple process configuration [27].

2.1.1. Single Mixed Refrigerant (SMR)

Figure 2 shows a schematic of the SMR process, which is the simplest natural gas liquefaction system. The SMR process comprises a MR compressor with an associated after-cooler, a main cryogenic heat exchanger (MCHE), JT valves, and a separator. In this process, the feed gas is liquefied in the MCHE, and the liquefied feed gas is then expanded by the JT-NG to separate non-condensable gases from the final product to meet the required LNG conditions. The required cold energy is provided by the MR, that consists of nitrogen, methane, ethane, propane, and butane.

2.1.2. Dual Nitrogen Expansion

Dual nitrogen expansion uses a reverse Brayton cycle to liquefy natural gas using nitrogen as a refrigerant [28]. The reverse Brayton cycle uses only the sensible heat of the refrigerant to transfer cold energy to natural gas so that the volume of the refrigerant is relatively larger than that of the SMR process. In this process, the external work is provided by an N2 compressor, and then, a cold and warm expander transforms the pressure energy to cold energy [29]. Dual nitrogen expansion uses two expanders working at different range of temperature, endeavor to extract the maximum sensible heat from the refrigerant to liquefy natural gas [30]. A schematic of the dual nitrogen expansion cycle is shown in Figure 3.

2.1.3. Propane Pre-Cooled Self-Refrigeration

Propane pre-cooled self-refrigeration is based on the Linde-Hampson liquefaction cycle and the overall process is shown in Figure 4. In the Linde-Hampson liquefaction cycle, the highly compressed gas is cooled down in heat exchangers using the returned low-pressure stream, and it is then moved to the JT valve to expand [29]. This process is the enhanced Linde-Hampson liquefaction cycle that adopts a propane precooling loop to achieve better performance [30]. This liquefaction process requires higher pressure (>200 bar) than other liquefaction processes to produce cold energy by expansion. Thus, a low process efficiency is inevitable.

2.1.4. Compressor Leak Consideration

The potential problem of a movable LNG liquefaction plant is a refrigerant leak from the compressor. Compressor leaks without refrigerant make-up causes severe operational problems such as poor efficiency and variations in operating conditions [31]. All compressors in the liquefaction processes compared in this study are assumed to be reciprocating compressors because of their small capacity.
The main cause of leaks in reciprocating compressors is valve leakages. Therefore, according to [32], newly installed packing has been reported to leak an average of 2 m3/h and worn packing may leak up to an average of 26 m3/h. Further, the leakage rates vary with production size; thus, the average leakage rate for a small-size production compressor is 0.31–0.34 m3/h, and it is the large compressors may leak 0.68–4.25 m3/h for large compressors [33]. Ferreira [34] reported that the leakage through the clearance of the compressor depends on the actual radial clearance and thus, the total leak mass varies in the range of 0.017–0.443 kg/h with 2.75–12 μ m of radial clearance. Based on previous studies and our project experience, the leakage rate of reciprocating compressors is fixed to 0.05 wt. % of the total amount of refrigerant in this study. The compressor leak can be also solved using compressors with high leakage resistance such as a Labyrinth sealed compressor; however, this solution is not considered in this paper [22].
As the target LNG liquefaction plant is movable, an additional leakage makeup system for each process is required to make up the refrigerants. The schematics for each refrigerant make up system are shown Figure A1(3). The SMR system is supposed to have separate tanks for all component of the refrigerants and a mixing tank for mixing the refrigerants [35]. In the case of dual nitrogen expansion, liquid nitrogen is supplied for the leakage make up [36]; for propane pre-cooled self-refrigeration, only propane makeup facilities are required.

2.1.5. Initial Process Condition

To investigate the processes, all LNG liquefaction processes are simulated using a commercial simulator ASPEN PLUS V11 and the thermodynamic property Peng-Robinson (PR) equation of state is applied since PR is a widely used in the LNG processes [37,38,39]. All common parameters for each simulation case are summarized in Table 1. The process is based on actual project experience that produces 626 kg/h (15 tons per day) of LNG.
This study used three different natural gas compositions: lean, normal, and rich. The lean stream is chosen for the base case, and the others are adopted in the sensitivity analysis to investigate the effect of the natural gas compositions on the proposed processes.

2.2. Optimization Framework

Optimization was performed using the concept of exergy to determine the best operating conditions of the liquefaction processes.
Exergy analysis has been widely studied to evaluate the performance of a liquefaction system [8,42,43,44]. Exergy is defined as the maximum amount of useful energy that can be extracted from a reversible process [8]. Exergy can be calculated as [45]
E x = ( h x h 0 ) T 0 ( s x s 0 )
where h is the enthalpy of the stream, s is the entropy of the stream, and T is the temperature of the stream; subscript “0” indicates the reference state (at ambient temperature, 20 °C in this study) of enthalpy and entropy.
Exergy efficiency is an important factor for performing exergy analysis, and it is calculated as [14].
η e x = Δ E x W n e t
where η e x is the exergy efficiency, ΔEx is the total exergy supplied to the system, and Wnet is the net power consumed. The total exergy supplied to the system can be formulated as
Δ E x = E x f e e d E x P r o d u c t
where Exfeed is the exergy of feed streams, and Exproduct is the exergy of the product streams. The total net power produced by the system can be formulated as
W n e t = W e x p a n d e r W c o m p r e s s o r W p u m p
where Wexpander is the energy produced by expanders, Wcompressor is the energy consumed by compressors, and Wpump is the energy consumed by pumps.
Finally, the objective function can be defined as
Maximize .   f ( x ) = Minimize ( η ex )
subject to
10 P M R 2 S M R 80
160   T L N G 1 ,   M R 4 S M R 150
1.25   P L N G 2 S M R 10
100 m M R ,     n i t r o g e n S M R 800
100 m M R ,   m e t h a n e S M R 800
500 m M R ,   e t h a n e S M R 2000
0               m M R ,   p r o p a n e S M R 100
    500     m M R ,   b u t a n e S M R 2000 ,
10         P R 1 D U A L 20
        3000 m R 1 D U A L 10000
    40           P R 2 D U A L 80
20       T F E E D D U A L 20
30       T R 3 D U A L 0
  120     T N G 1 D U A L 80
  160   T N G 2 D U A L 150
0.5     x R 9 D U A L 0.8
      200   P N G 2 S E L F 400
5             P P G 2 S E L F 20
40       T N G 4 S E L F 20
  100   T L N G 1 S E L F 70
1.25 P P G 4 S E L F 5
900   m P G 1 S E L F 1300
v f i n l e t ,   c o m p r e s s o r s = 1
v f i n l e t / o u t l e t ,   e x p a n d e r s = 1
MITA   of   the   MCHE 2 K ,
where x is a set of the decision variables of the objective function, x∈{ x S M R ,   x D U A L ,   x S E L F }. Equations (6)–(27) are boundary limits for decision variables; Equations (6)–(13) are for SMR ( x S M R ∈{ P M R 2 S M R ,   T L N G 1 ,   M R 4 S M R ,   P L N G 2 S M R ,   m M R ,     n i t r o g e n S M R ,   m M R ,   m e t h a n e S M R ,   m M R ,   p r o p a n e S M R ,   m M R ,   b u t a n e S M R } ), Equations (14)–(21) are for dual nitrogen expansion ( x D U A L ∈{ P R 2 D U A L ,   m R 1 D U A L ,   P R 2 D U A L ,   T F E E D D U A L ,   T R 3 D U A L ,   T N G 1 D U A L ,   T N G 2 D U A L ,   x R 9 D U A L } ), and Equations (22)–(27) are for propane-precooling self-refrigeration process ( x S E L F ∈{ P N G 2 S E L F ,   P N G 2 S E L F ,   T N G 4 S E L F ,   T L N G 1 S E L F ,   P P G 4 S E L F ,   m P G 1 S E L F } ). Equations (28)–(30) are the constraints set up for practical optimization results. Equations (28) and (29) are for protecting the compressors and expanders from the damage caused by liquid droplets, and Equation (30) [44] is for avoiding irreversibility and achieving better exergy efficiency. Therefore, the number of decision variables for SMR is 7, 8 for dual nitrogen expansion, and 6 for propane-precooling self-refrigeration. In addition, the number of constraints for SMR is 2, 6 for dual nitrogen expansion, and 5 for propane-precooling self-refrigeration.
In the sensitivity analysis, additional constraints are added to consider liquefaction as an as-built plant, which means the duty of the motor-driven equipment and heat transfer area of the heat exchangers are fixed. The additional constraints are
MCH   E   s   UAs = UA   values   from   the   optimized   base   case
Compressors   and   expanders   duties Compressors   and   expanders   duties   from   the   optimized   base   case
Since the UA values of the MCHE (overall heat transfer coefficient, U, multiplied by the heat transfer area, (A) are fixed, Equation (31) is deactivated in the sensitivity analysis. The specific constraint values for Equations (31) and (32) are summarized in Appendix A.2.
In this paper, optimization was performed using the PSO algorithm because of the high nonlinearity of the optimization problem formulated in this study [15,17,18,19]. The flowchart of the PSO algorithm is provided in Figure A2 and the detailed parameters used in this study are summarized in Table 3.

2.3. Economic Analysis Framework

The economic analysis is conducted to evaluate the different processes because it provides a comprehensive understanding of the process [46]. The cost estimation framework used in this study is illustrated in Figure 5. The assumptions considered for the economic analysis are summarized in Table 4 [47,48,49].
The amortization factor ( α ) represents the annual repayment of the total capital cost (TCC); it is computed as
α = i ( 1 + i ) n ( 1 + i ) n 1  
where i represents the interest rate (8%) and n represents the plant lifetime (25 years) [51].
To calculate the raw material cost, this study considered both the initial charge cost and the leakage makeup cost as mentioned earlier. The total raw material cost of variable cost can be calculated
Raw   material   cos t = ( initial   charge   cos t n + leakage   makeup   cos t ) × CEPCI   ( 2020 ) CEPCI   ( 2017 )
The raw material cost is adjusted based on the chemical engineering plant cost index (CEPCI) because some material costs are based on 2007 and 2020 prices [52]. The CEPCI for 2020 is 599.5; 2017 is 567.5; and 2007, 525.4 [53].
The considered raw materials in this study are: methane and natural gas, $0.21/kg [54]; ethane, $0.534kg [55]; propane, $0.679/kg [56]; butane, $0.702/kg [57]; and nitrogen $0.546/kg [58]. As methane has the largest proportion in the composition of the natural gas, the price of the methane is assumed to be the price of the natural gas.
The total annualized cost (TAC) is calculated as
TAC = TCC n + TOC
Product cost is a useful index to compare LNG liquefaction plants regardless of its capacity [24]; the product cost is calculated as
P r o d u c t   c o s t ( U S D t p a ) = T C C + T O C n p l a n t   a v a i l a b i l i t y L N G   p r o d u c t i o n   r a t e  
where n represents the plant lifetime and the plant availability is 95%.

3. Results

Base Case

To verify the performance of the PSO algorithm, the performance of three different optimization algorithms are compared and results are shown in Figure 6. The performance comparison between the pattern search (PS), the genetic algorithm (GA), and the PSO algorithm was investigated for the base case. Also, the execution time of each algorithm for the base case is summarized in Table 5. As shown in Figure 6 and Table 5, the PSO algorithm shows the best performance work and the shorted execution time compared to the other two algorithms. Consequently, this paper conducted the rest of the optimization by utilizing the PSO algorithm.
The base case adopts the lean natural gas and the optimized results of each process are summarized in Table A4(6); Figure 7 shows exergy efficiency and TAC of each case. As shown in Figure 6, SMR has the highest exergy efficiency (38.85%) and the lowest TAC (0.888 MM USD/year). In contrast, propane pre-cooled self-refrigeration has the lowest exergy efficiency (13.65%) and the highest TAC (2.179 MM USD/year).
The details of TAC are summarized in Table 6 and Figure 8 shows total equipment cost (TEC) breakdown of each process. As shown in Table 6, TAC of SMR (0.888 MM USD/year) is considerably lower than that of the others because of the low direct cost contributed by the simple process layout. According to Figure 8, the compressor costs comprises a significant portion of the TEC regardless of the process, and therefore, Wnet and the number of compressors is the most important factors in the cost analysis. Further, Wnet affects the variable cost because the energy cost comprises a large portion of the variable cost. The proportion of the makeup system in TEC of SMR is about 38.98%, which is remarkably higher than that of other processes because of mixed refrigerant. In contrast, the proportion of the makeup system in propane pre-cooled self-refrigeration does not seem to be significant (3.39%) because of the single (propane) refrigerant.
The product cost for propane pre-cooled self-refrigeration (10,213.5 USD/tpa) has the highest value, followed by that for dual nitrogen expansion (5645.4 USD/tpa) and SMR (4162.5 USD/tpa). According to the Oxford institute for energy studies [59], a capital expenditure (CAPEX) of small-scale movable LNG liquefaction usually ranges between 200–1600 USD/tpa. The CAPEX can be calculated by dividing TCC by the annual LNG production rate. The CAPEX for SMR, dual nitrogen expansion, and propane pre-cooled self-refrigeration investigated in this paper are 858.5 USD/tpa, 1069.9 USD/tpa, and 2064.9 USD/tpa, respectively. Therefore, the results of the CAPEX for the three processes are approximately in the range of 200–1600 USD/tpa, the economic analysis in this study appears reliable.
Figure 9 shows the compassion of TAC differences between the case with and without the refrigerant leakage consideration. As shown in Figure 8, TOC and TCC differences between both cases in SMR are significant because of the complex refrigerant make-up system. In contrast, TOC and TCC differences between both cases in other processes are not significant because of the simple make-up system.

4. Sensitivity Analysis

4.1. Effect of Natural Gas Compositions

The analysis of the effect of natural gas composition on exergy efficiency is important because the target LNG plant in this study is movable, and because the uncertain effect of natural gas composition on exergy has already been reported [60]. As illustrated in Figure 10, the process most sensitive to natural gas compositions is SMR, which varies in the range of 36.85%–37.46% (0.61%); propane pre-cooled self-refrigeration is the least sensitive and it varies in the range of 13.65%–14.07% (0.42%). Overall, the effect of natural gas composition changes on exergy efficiency do not seem to be significant.
Figure 11 shows the effects of natural gas compositions on the product cost of each process. As shown in Figure 11, the product cost of all three processes tends to decrease as the composition becomes richer. However, the differences are not significant (about 3%) for all three processes.
Figure 12 shows the effects of different natural gas composition on the variable cost. Even if leakage is considered, the raw material cost of all three processes is not affected by the composition of the natural gas. However, the energy cost of all three processes seems to be highly, and it tends to decrease from lean to rich. The largest differences in the variables cost can be seen for SMR (15.5%), followed by propane pre-cooled self-refrigeration (15%) and dual nitrogen expansion (9.18%).

4.2. Effect of Ambient Temperature

The temperature of the air cooler outlet stream varies according to ambient temperature. Therefore, the sensitivity analysis conducted to investigate the effect of ambient temperature on the exergy efficiency of each process and the results are illustrated in Figure 13. The air cooler discharge temperature is defined to be 10 °C higher than the ambient temperature. With an increasing ambient temperature value in the range of 0–40 °C with 5 °C step sizes, the exergy efficiency decreases in all three processes. The increase in the ambient temperature leads to an increment of the duties of the compressor and the rise in the inlet temperatures of the MCHEs. Therefore, the required energy for liquefying the same natural gas capacity increases accordingly. The largest differences in the exergy efficiency can be observed in SMR (34.4%), followed by dual nitrogen expansion (22.3%) and propane pre-cooled self-refrigeration (5.08%). Each process has a certain temperature ranges that make the process infeasible because of the compressor duty constraint. The SMR process can operate over the wide range (10–40 °C) because it can adjust the MR composition according to the ambient temperature changes. However, the operation availability range of propane pre-cooled self-refrigeration is relatively small because of the refrigeration duty of the main compressor.
The effects of ambient temperature on the product cost are illustrated in Figure 14. As stated earlier, an increase in the required energy affects the energy cost that leads to an increase in product cost. The largest difference in product cost can be observed for SMR, 5.9%; this is followed by dual nitrogen expansion (4.5%) and propane pre-cooled self-refrigeration (1.1%). Overall, the effect of the ambient temperature on the product cost does not seem to be significant.

4.3. Effect of Electricity Cost

Sensitivity analysis for the electricity cost is conducted because the energy cost occupies a large percentage of the total cost (Table 6), and the electricity cost varies widely within a given range. Figure 14 shows the effect of changes in the electricity cost on the product cost. The electricity cost varies between 0.08 and 2 $/kWh, and this range is referred from the previous studies [45,61]. As shown in Figure 15, the effect of the electricity cost on the product cost is to be significant. The SMR is the most affected with a 24.1% difference, followed by dual nitrogen expansion (23.9%) and propane pre-cooled self-refrigeration (21.7%).

4.4. Effect of Compressor Leakage

Compressor leakage of the base case of the fixed to 0.05% to refrigerant mass flow rate, and it can differ within a range under certain conditions such as worn packing, product capacity, and actual radial clearance. To analyze the effect of different compressor leakage on the product cost, nine different weight percentages of leakage (0.01–1 wt. %) were selected to perform the sensitivity analysis.
Figure 15 shows the results of the product cost differences with respect to the compressor leakage. According to Figure 16, the effect of the compressor leakage on the product cost is not significant in propane pre-cooled self-refrigeration compared to other two processes. The largest differences in product cost among three processes was observed for SMR (3%), followed by dual nitrogen expansion (2.6%) and propane pre-cooled self-refrigeration (0.2%). This is because SMR requires an MR that consists of multiple hydrocarbon components to form the refrigerant, whereas dual nitrogen expansion only requires pure nitrogen as the refrigerant. Further, propane pre-cooled self-refrigeration requires a small amount of pure propane for the refrigerant leakage makeup.

5. Conclusions

In this study, SMR, dual nitrogen expansion, propane pre-cooled self-refrigeration are investigated for a small-scale movable plant considering the compressor leakage. This paper presents a quantitative investigation of the three processes from the perspectives of exergy efficiency and cost analysis considering leakage problems.
The following conclusions were drawn based on the results of this study.
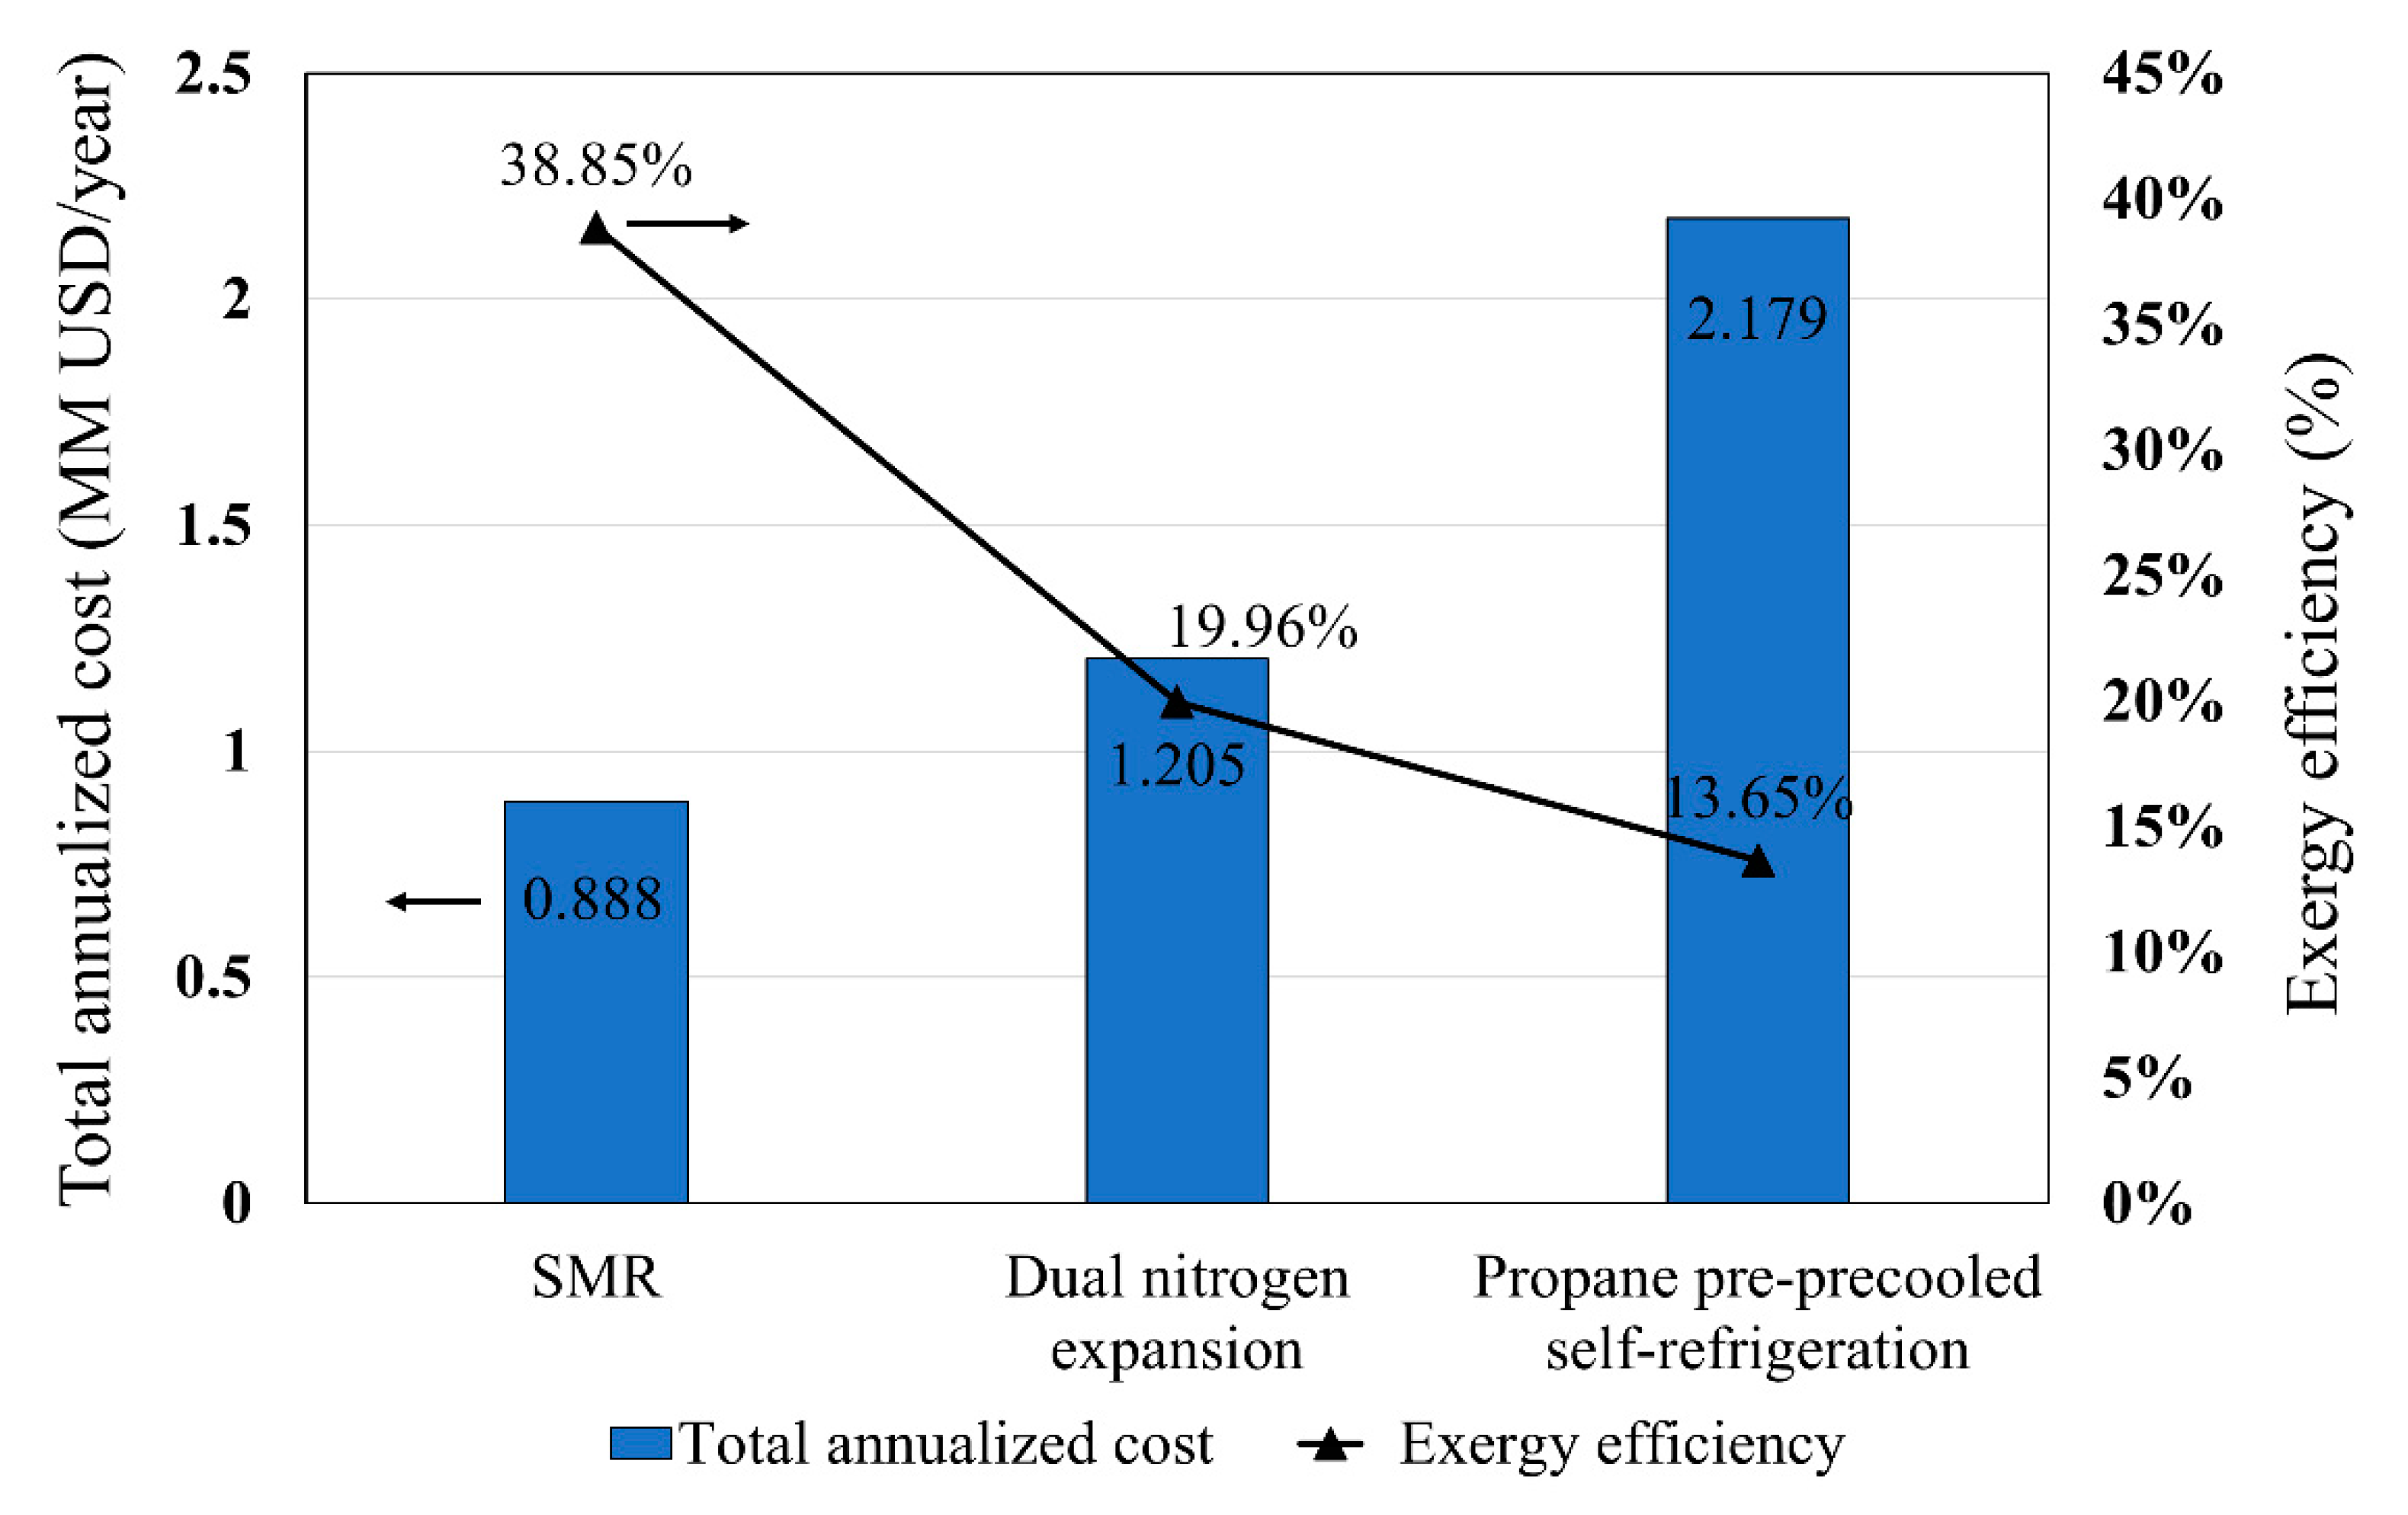
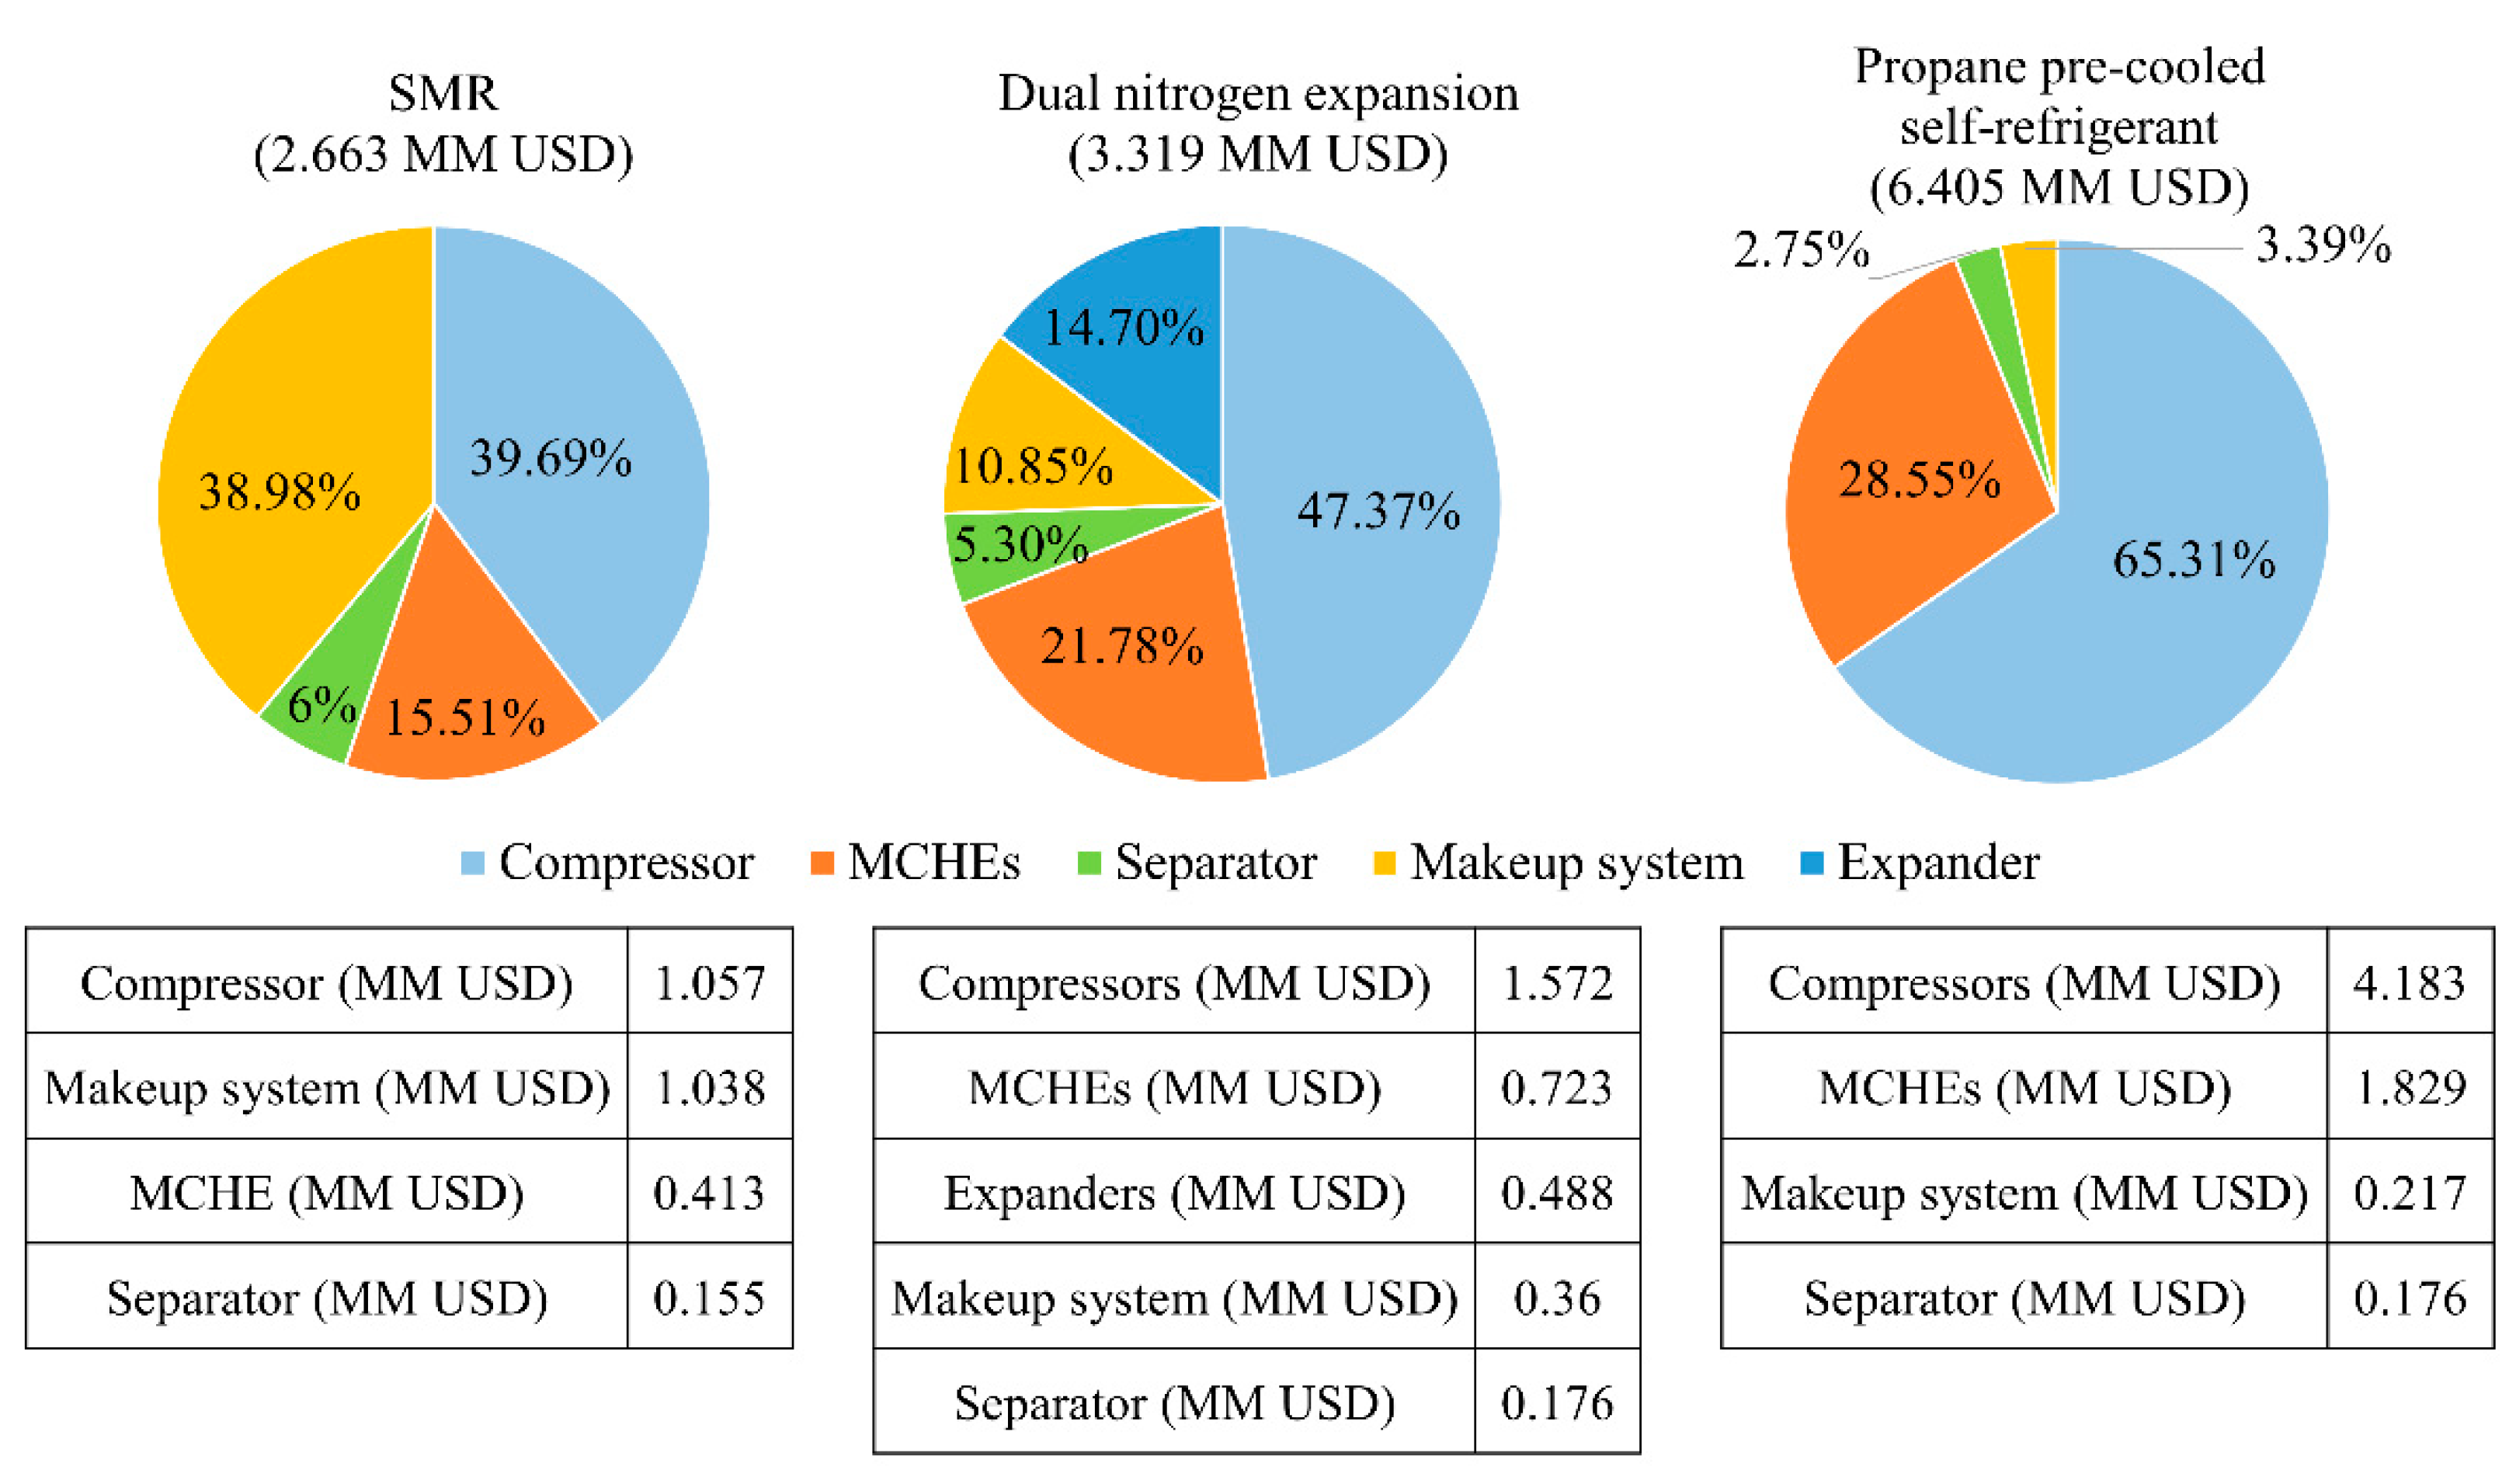
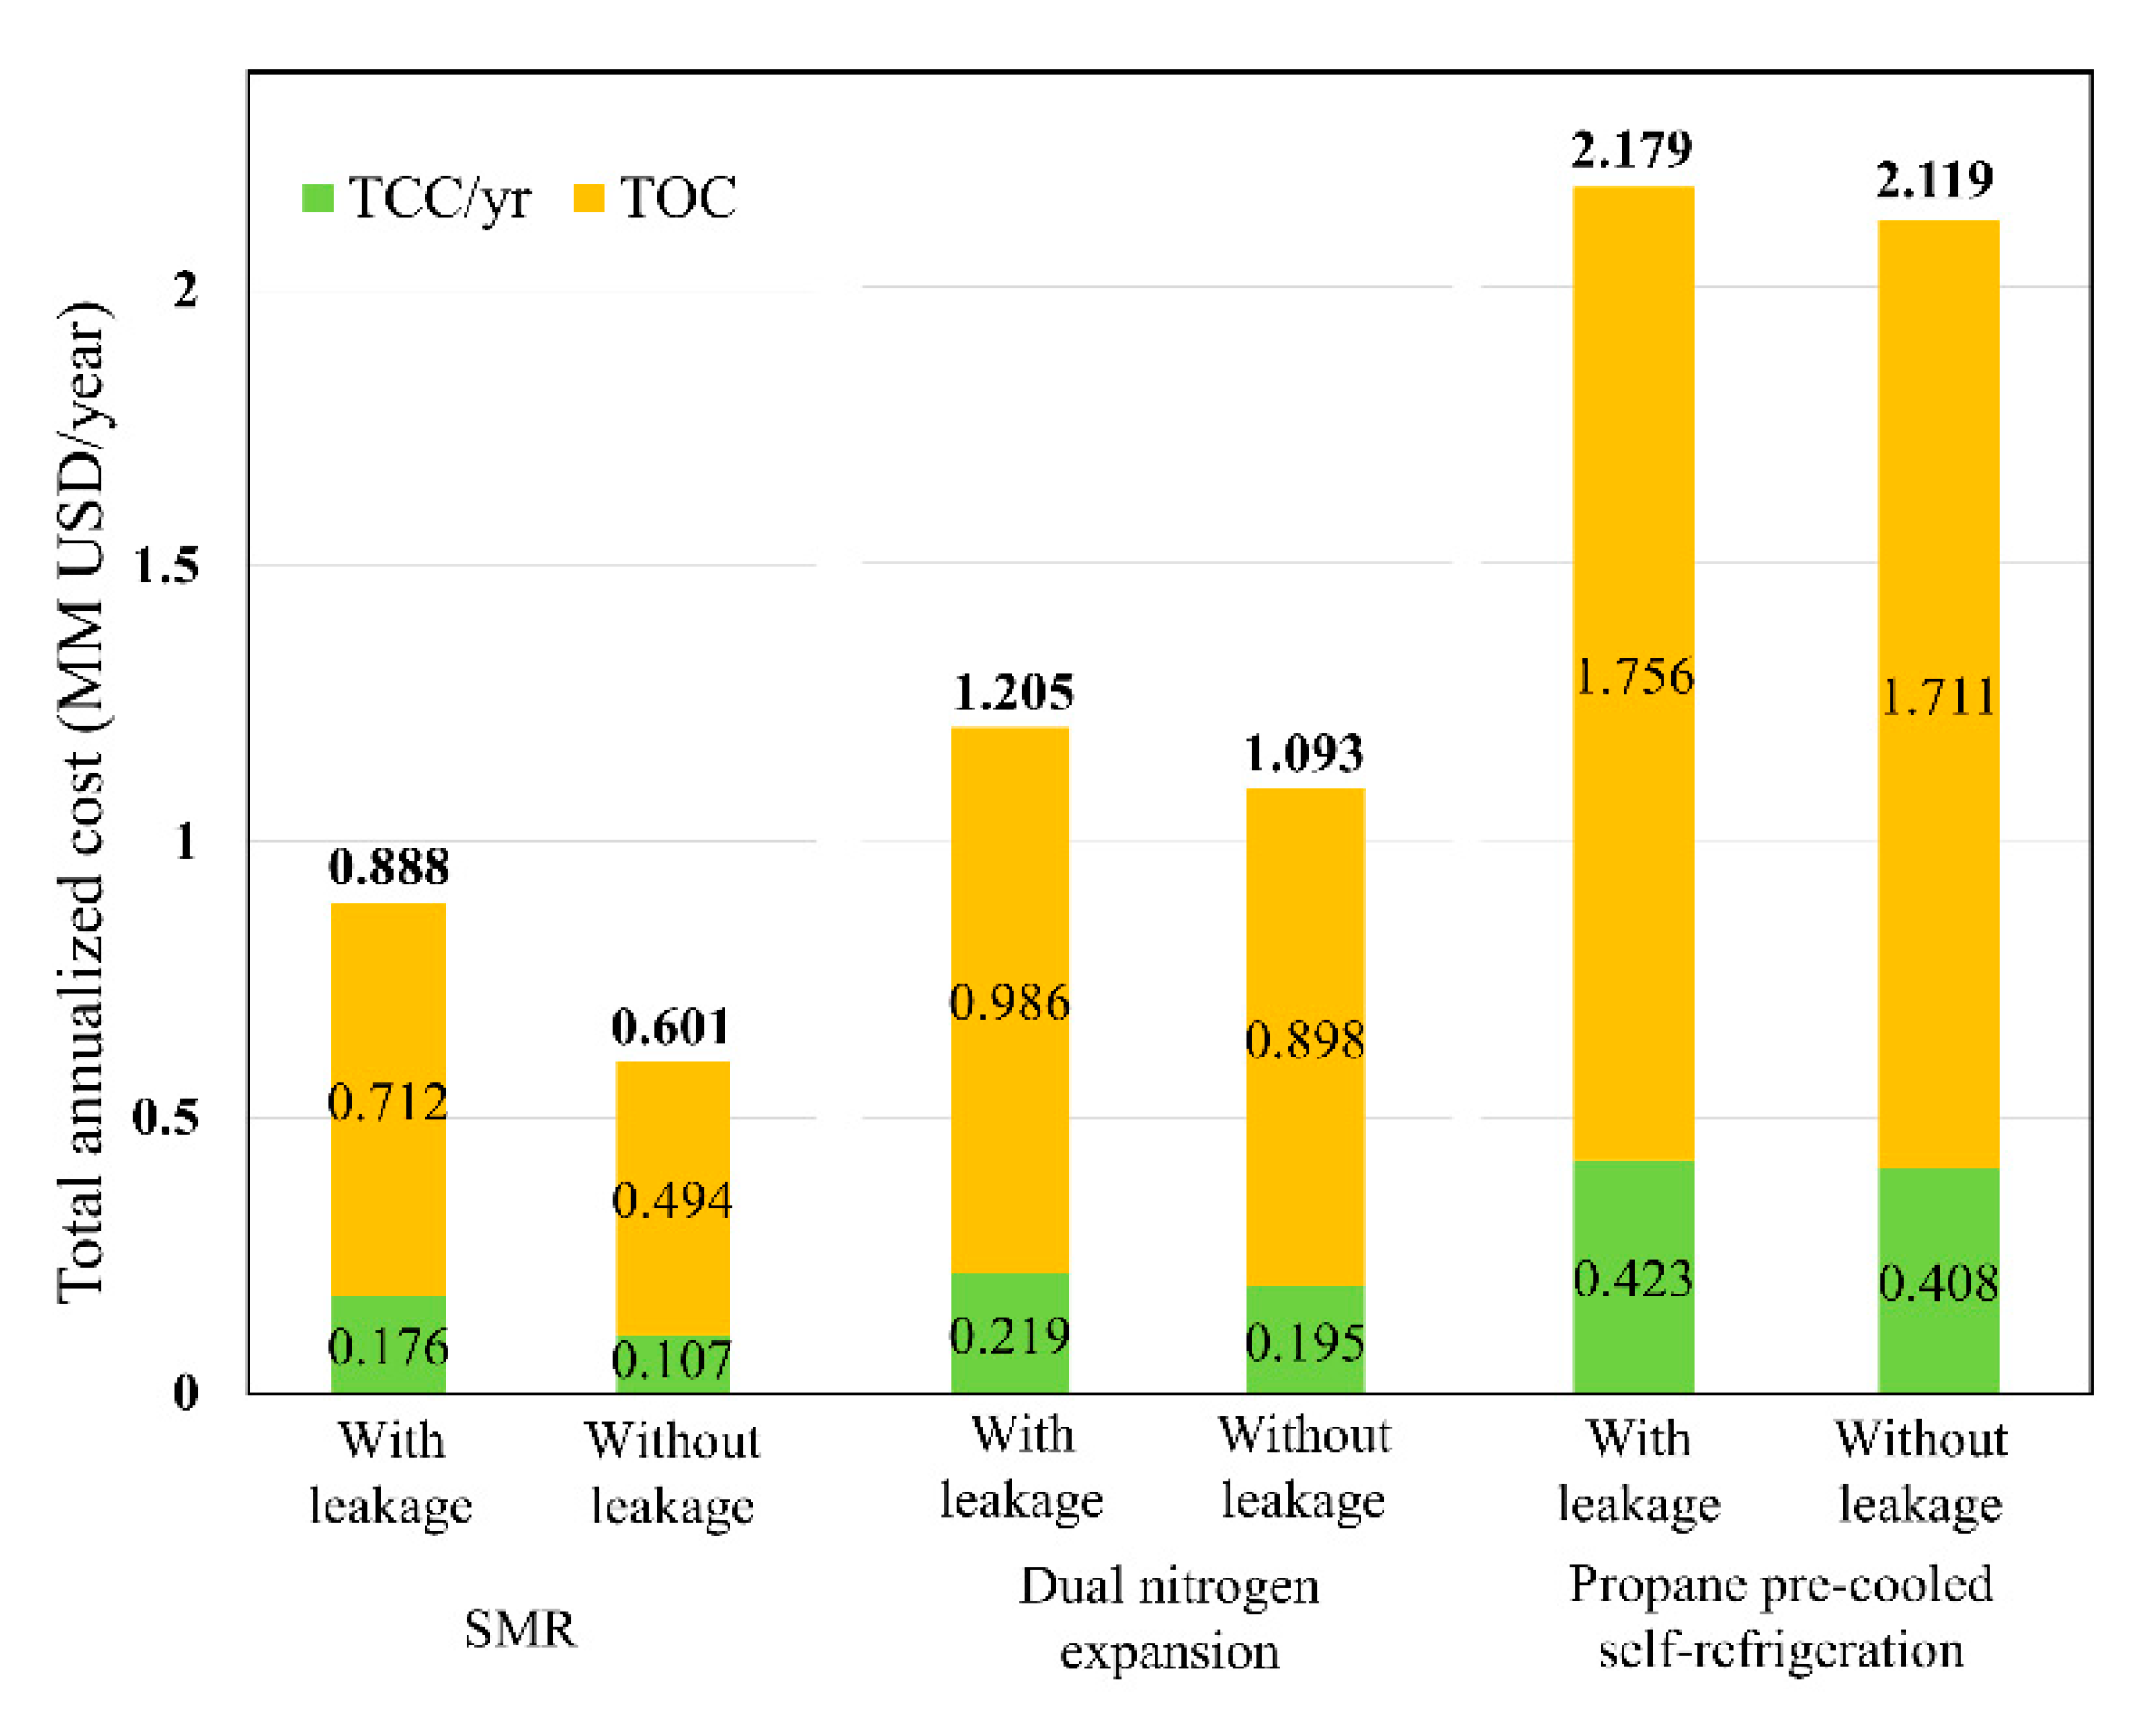
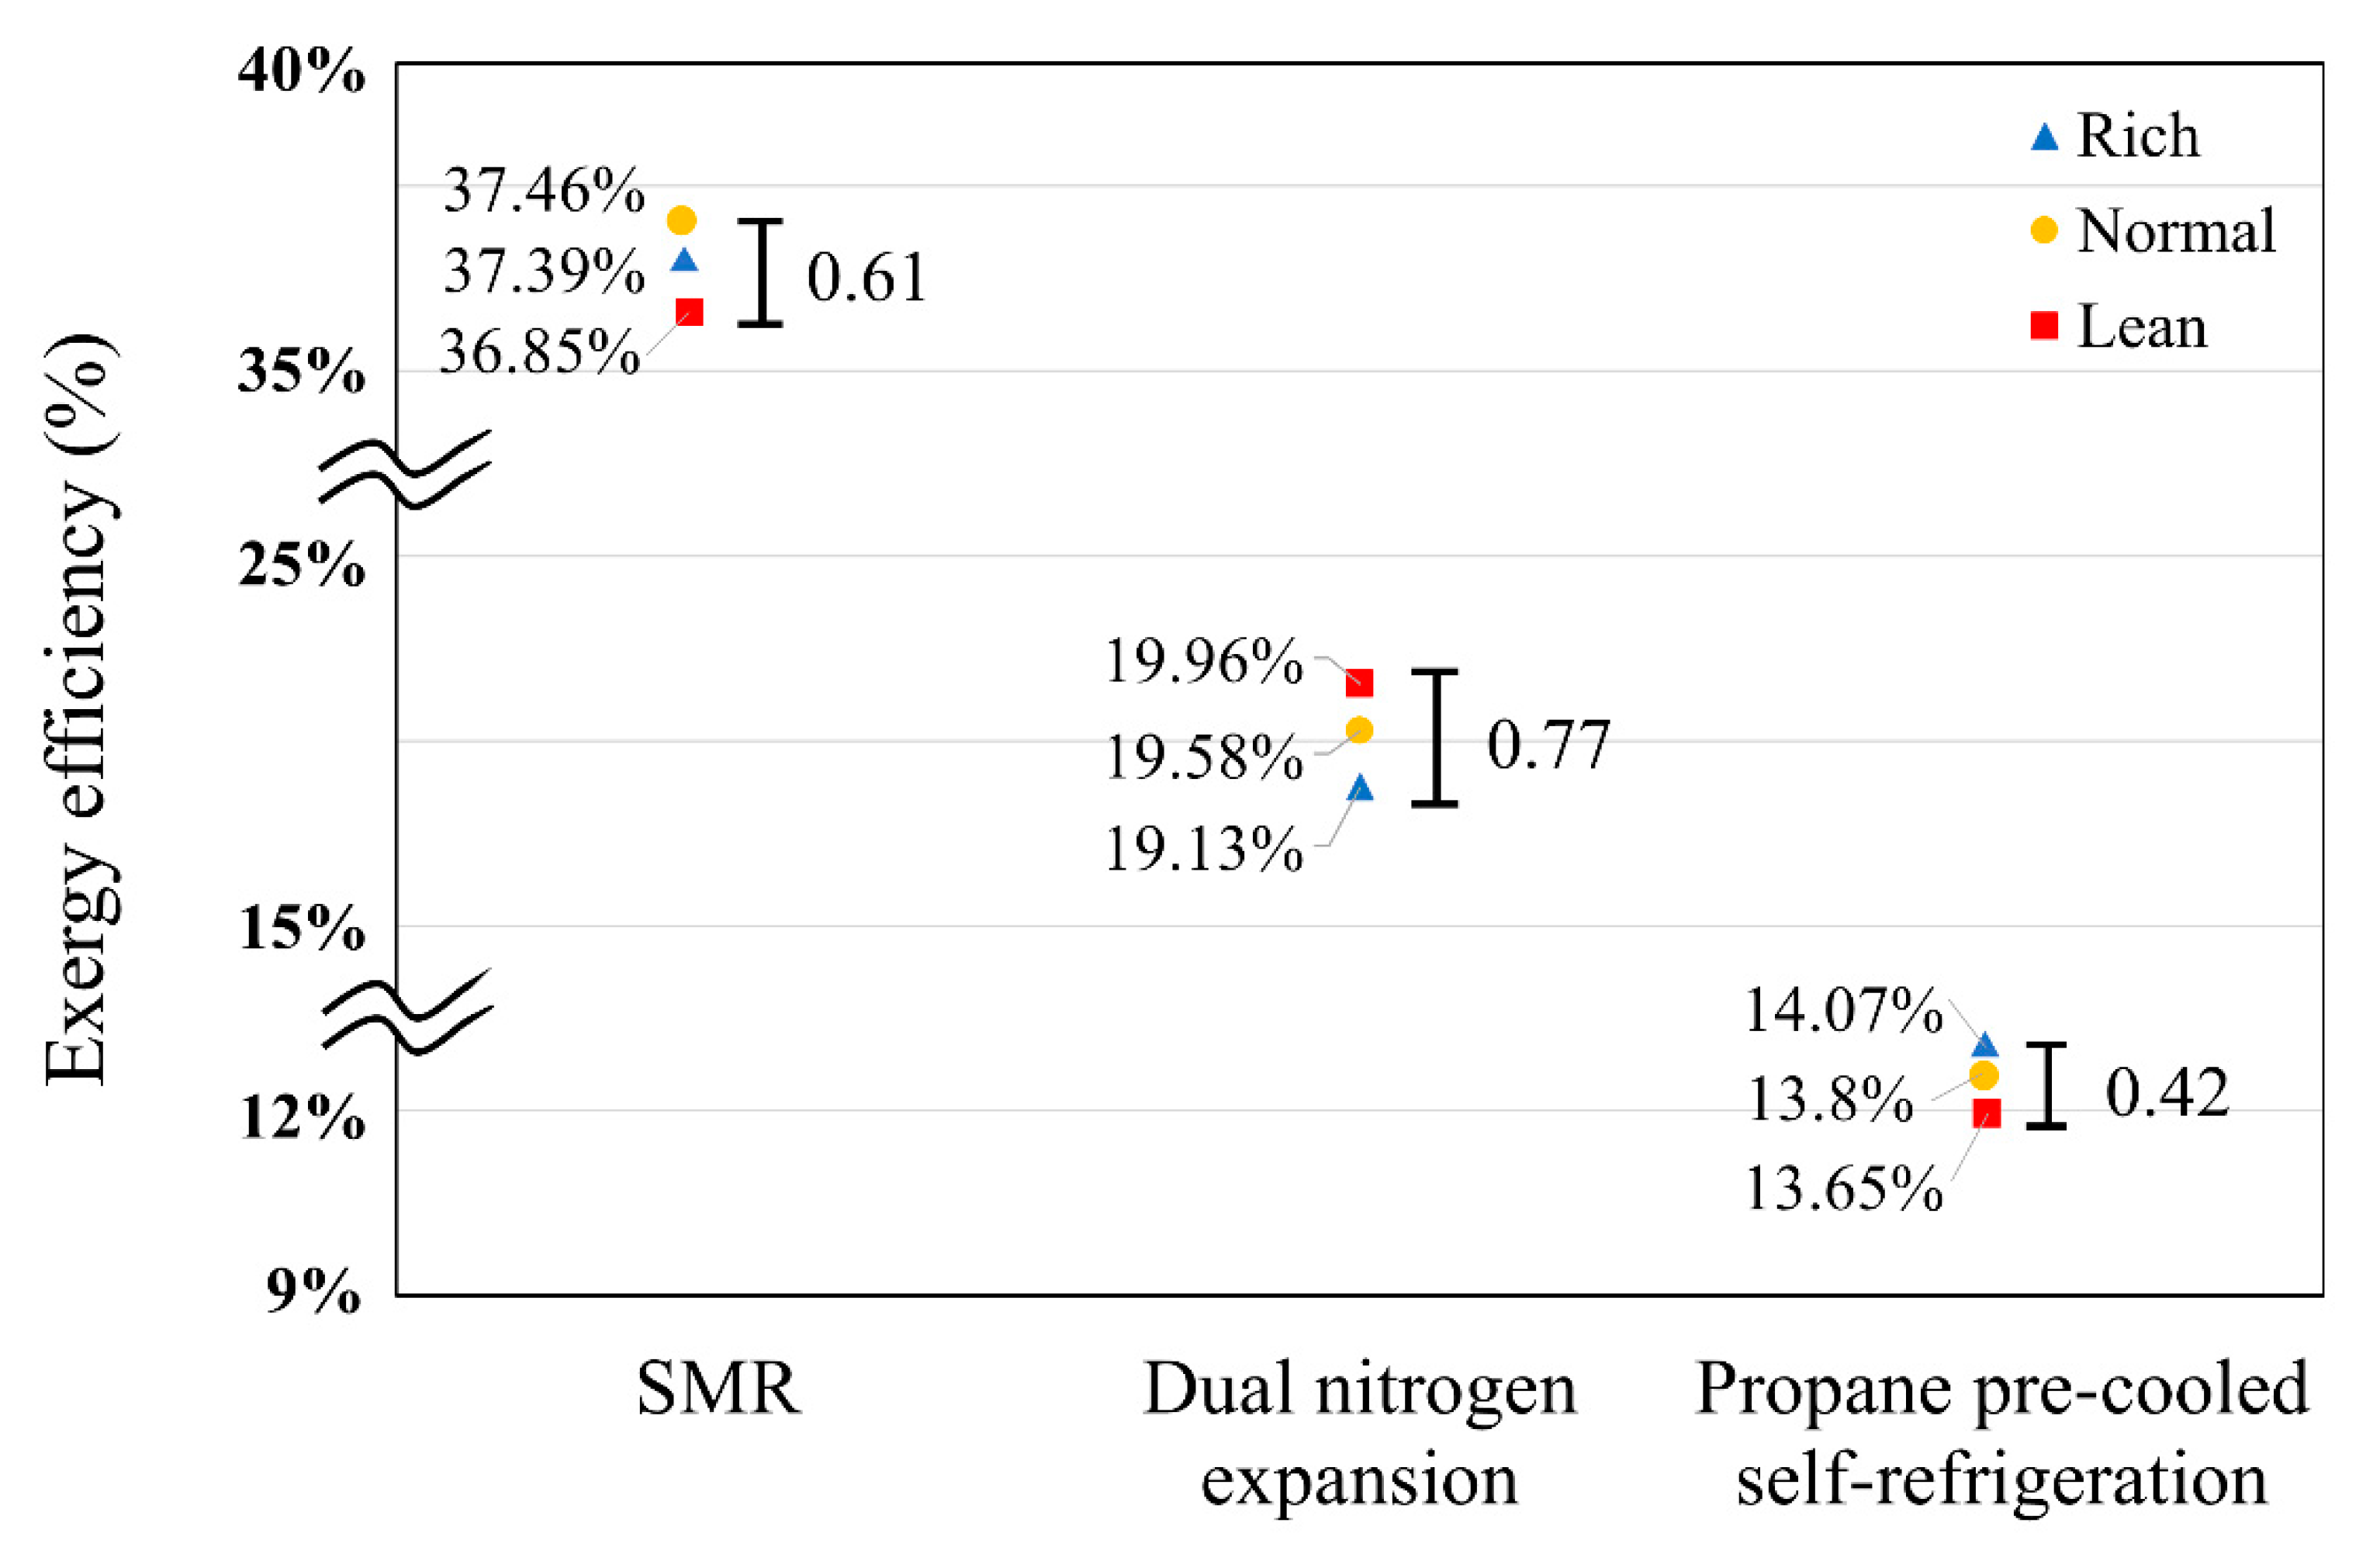
  • Optimization results indicated that SMR is the most efficient in terms of the exergy efficiency and economics even considering the makeup system. The addition of an extra makeup system significantly affects TAC of SMR compared to those of the others because SMR requires complex makeup facilities because of the MR. Yet, SMR is considered a competitive LNG liquefaction process for movable LNG plants.
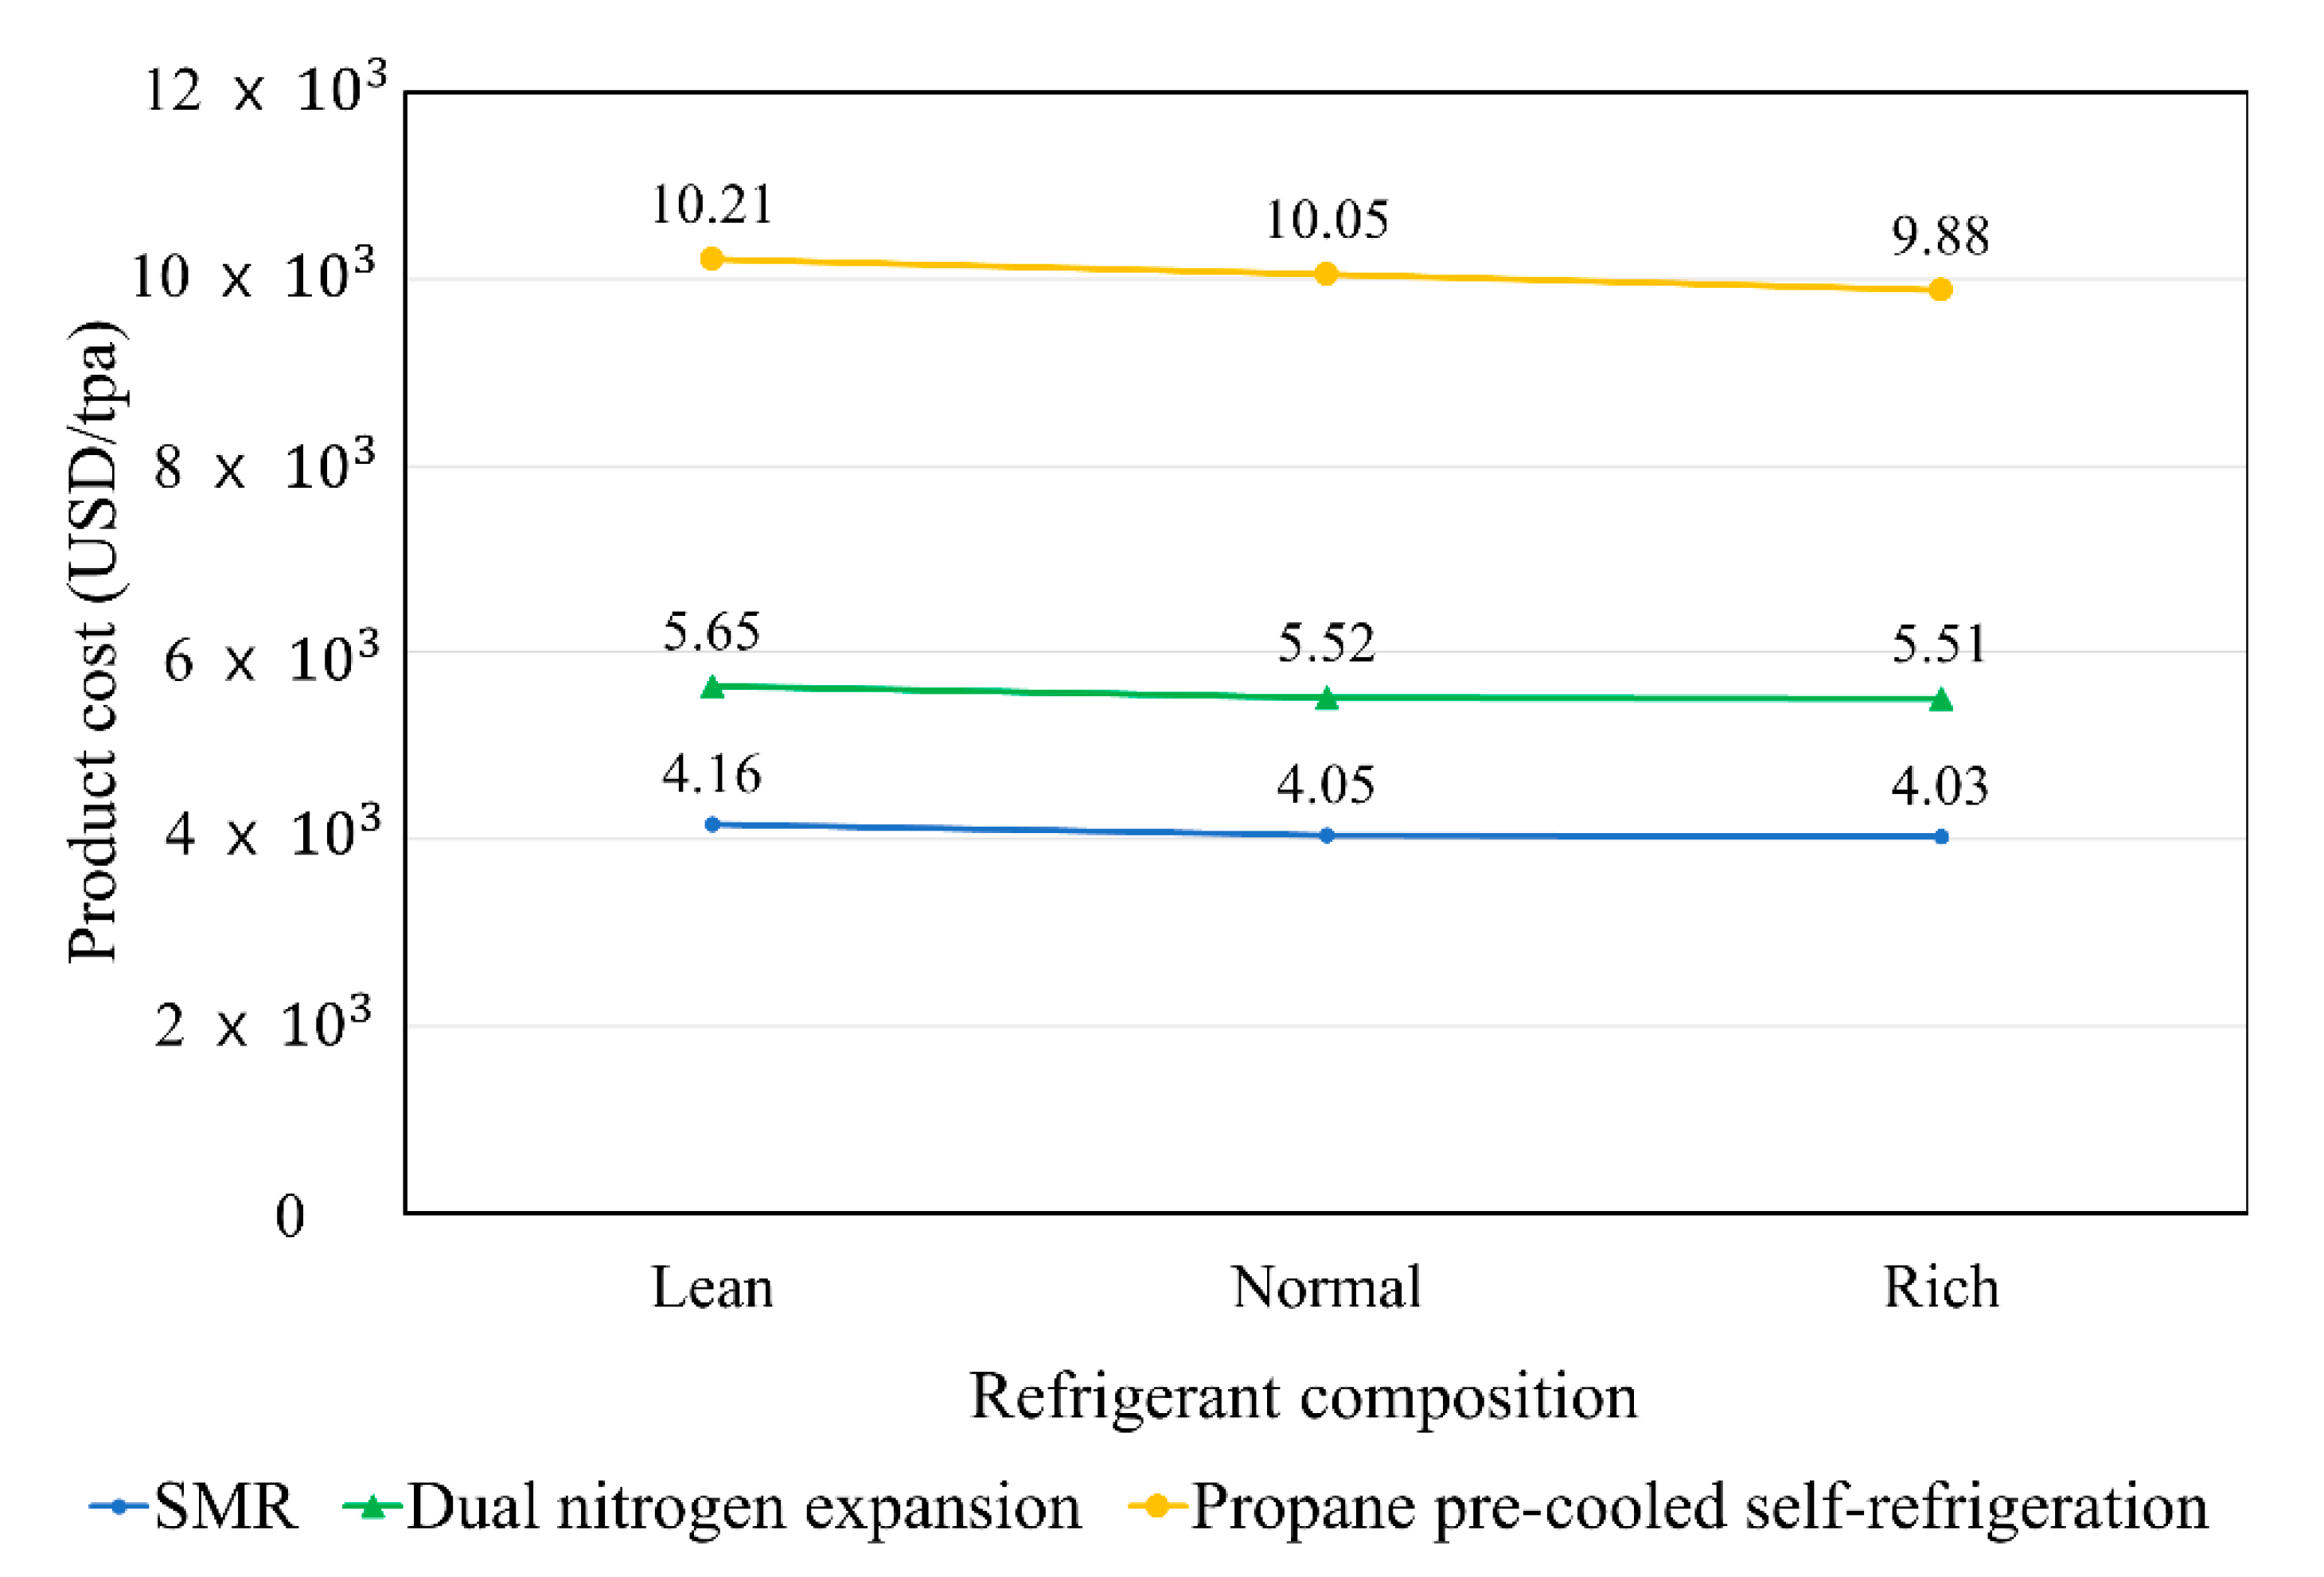
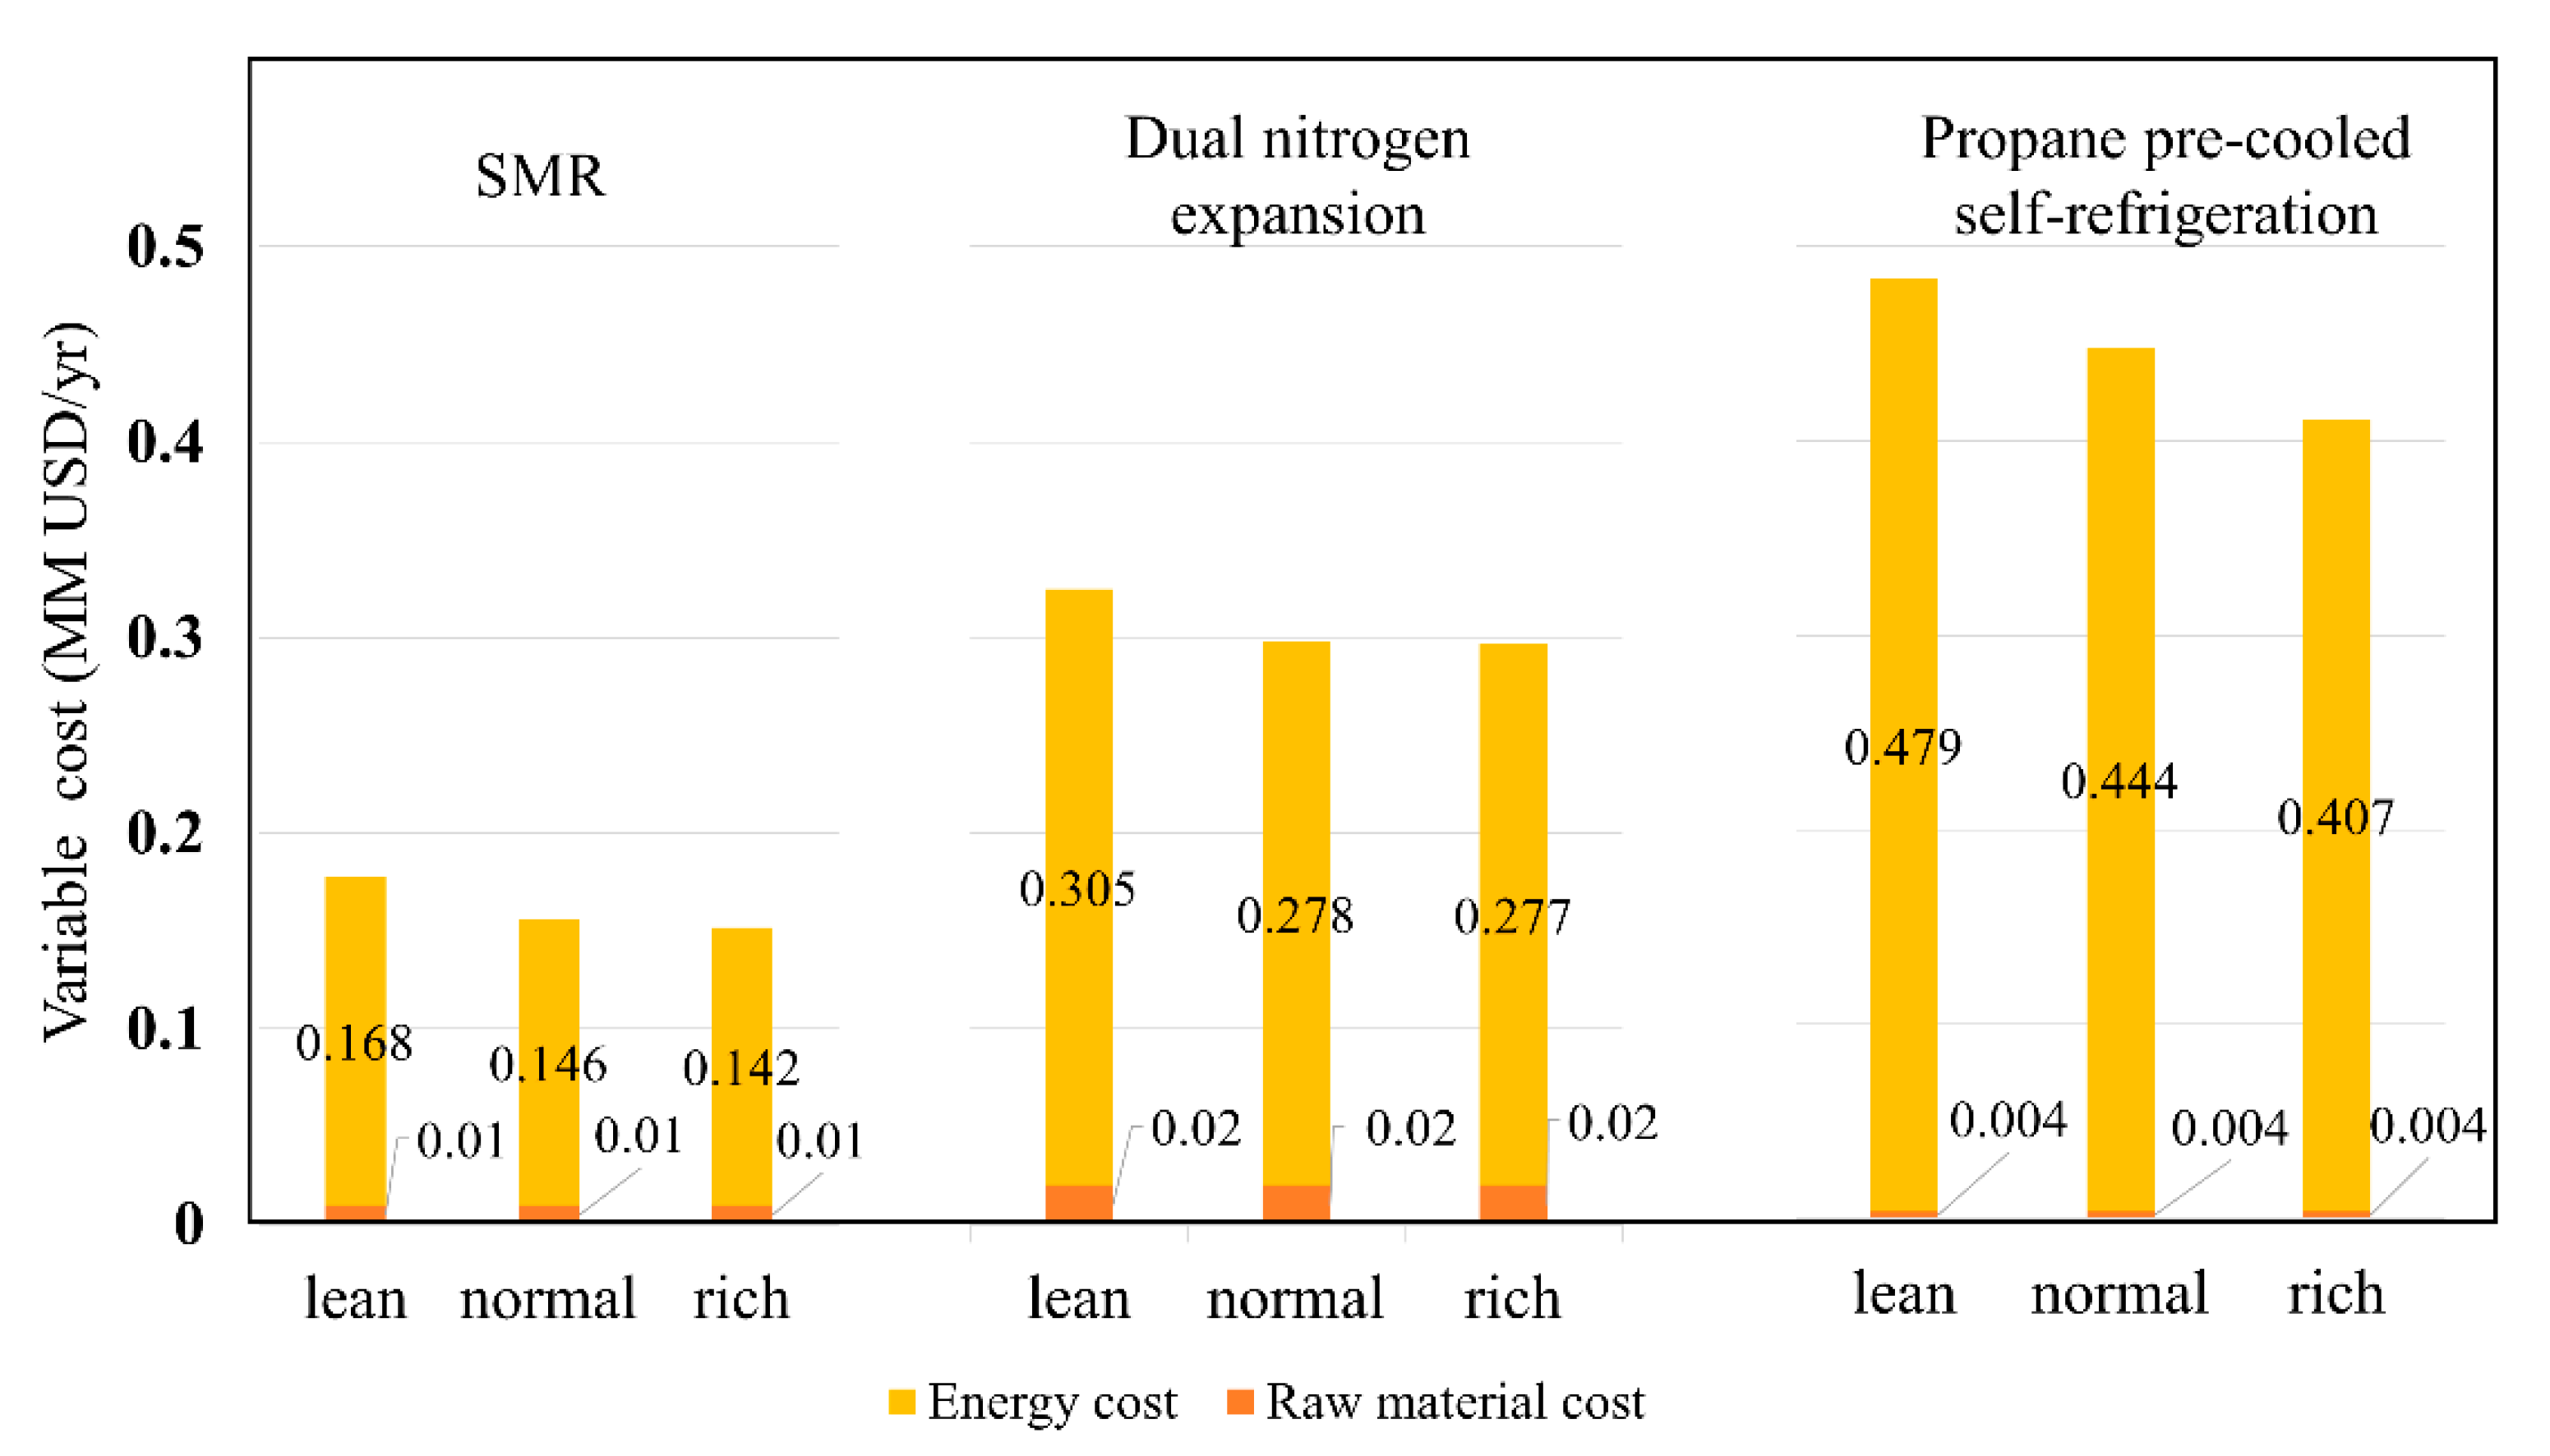
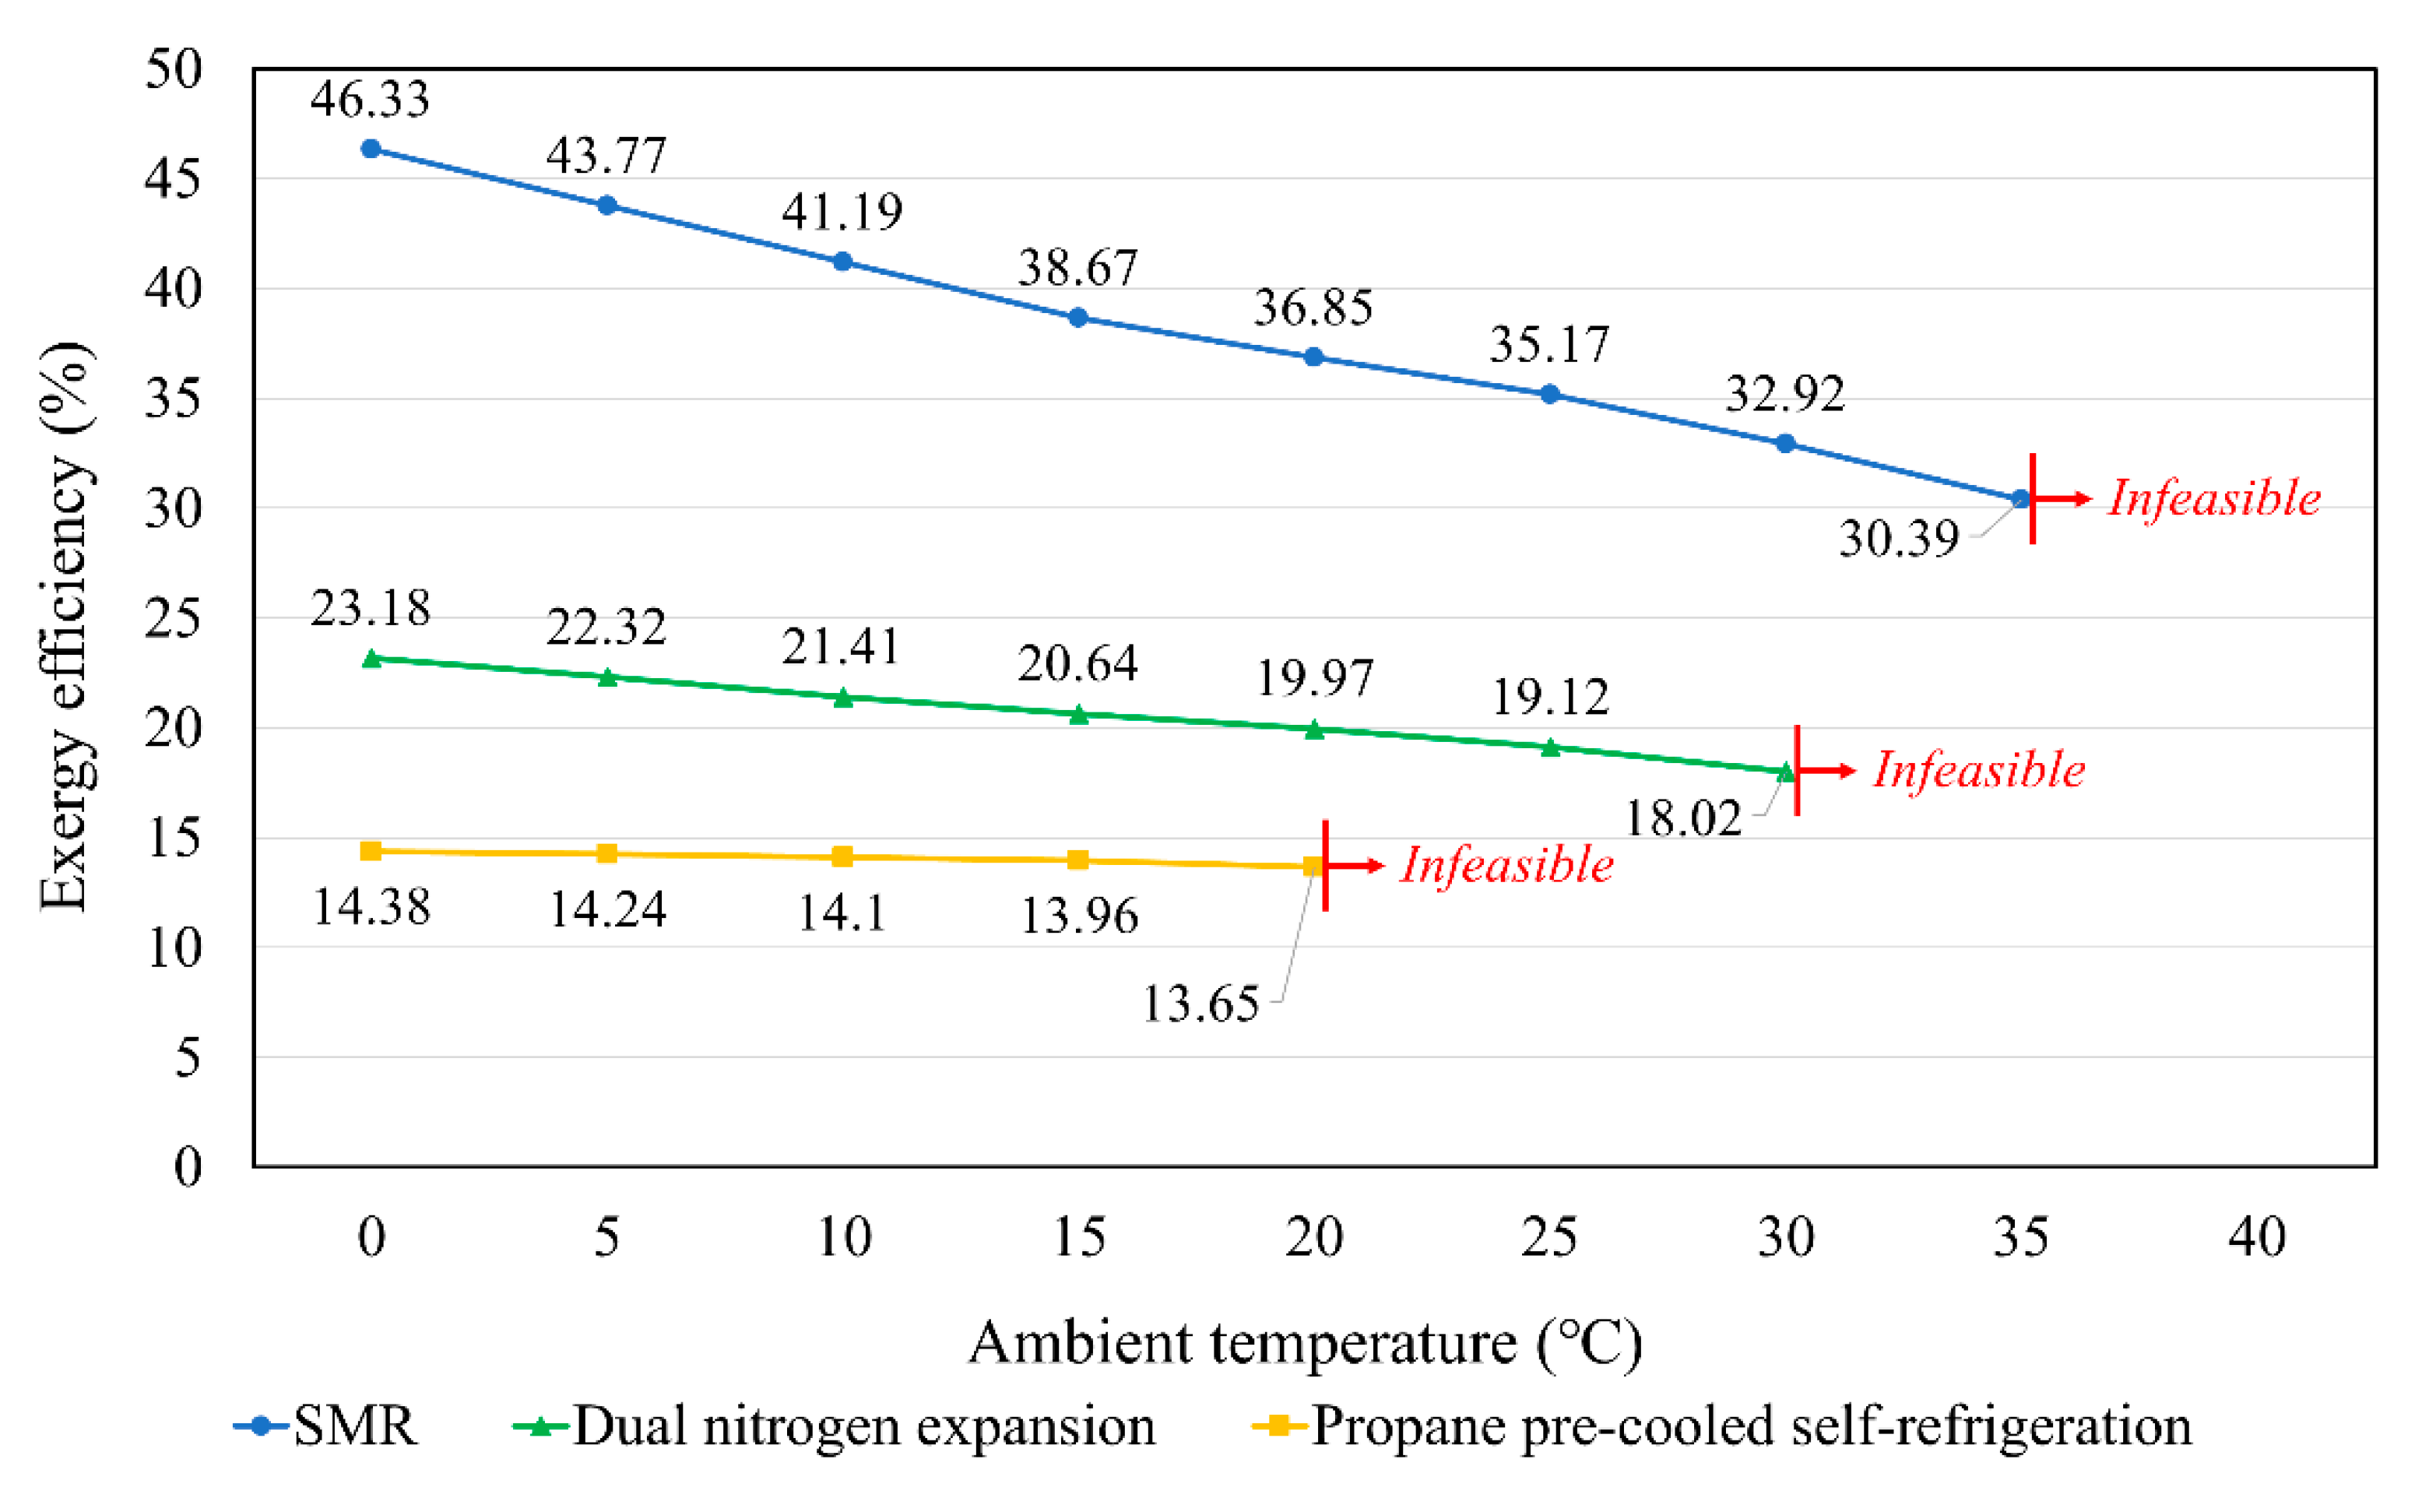
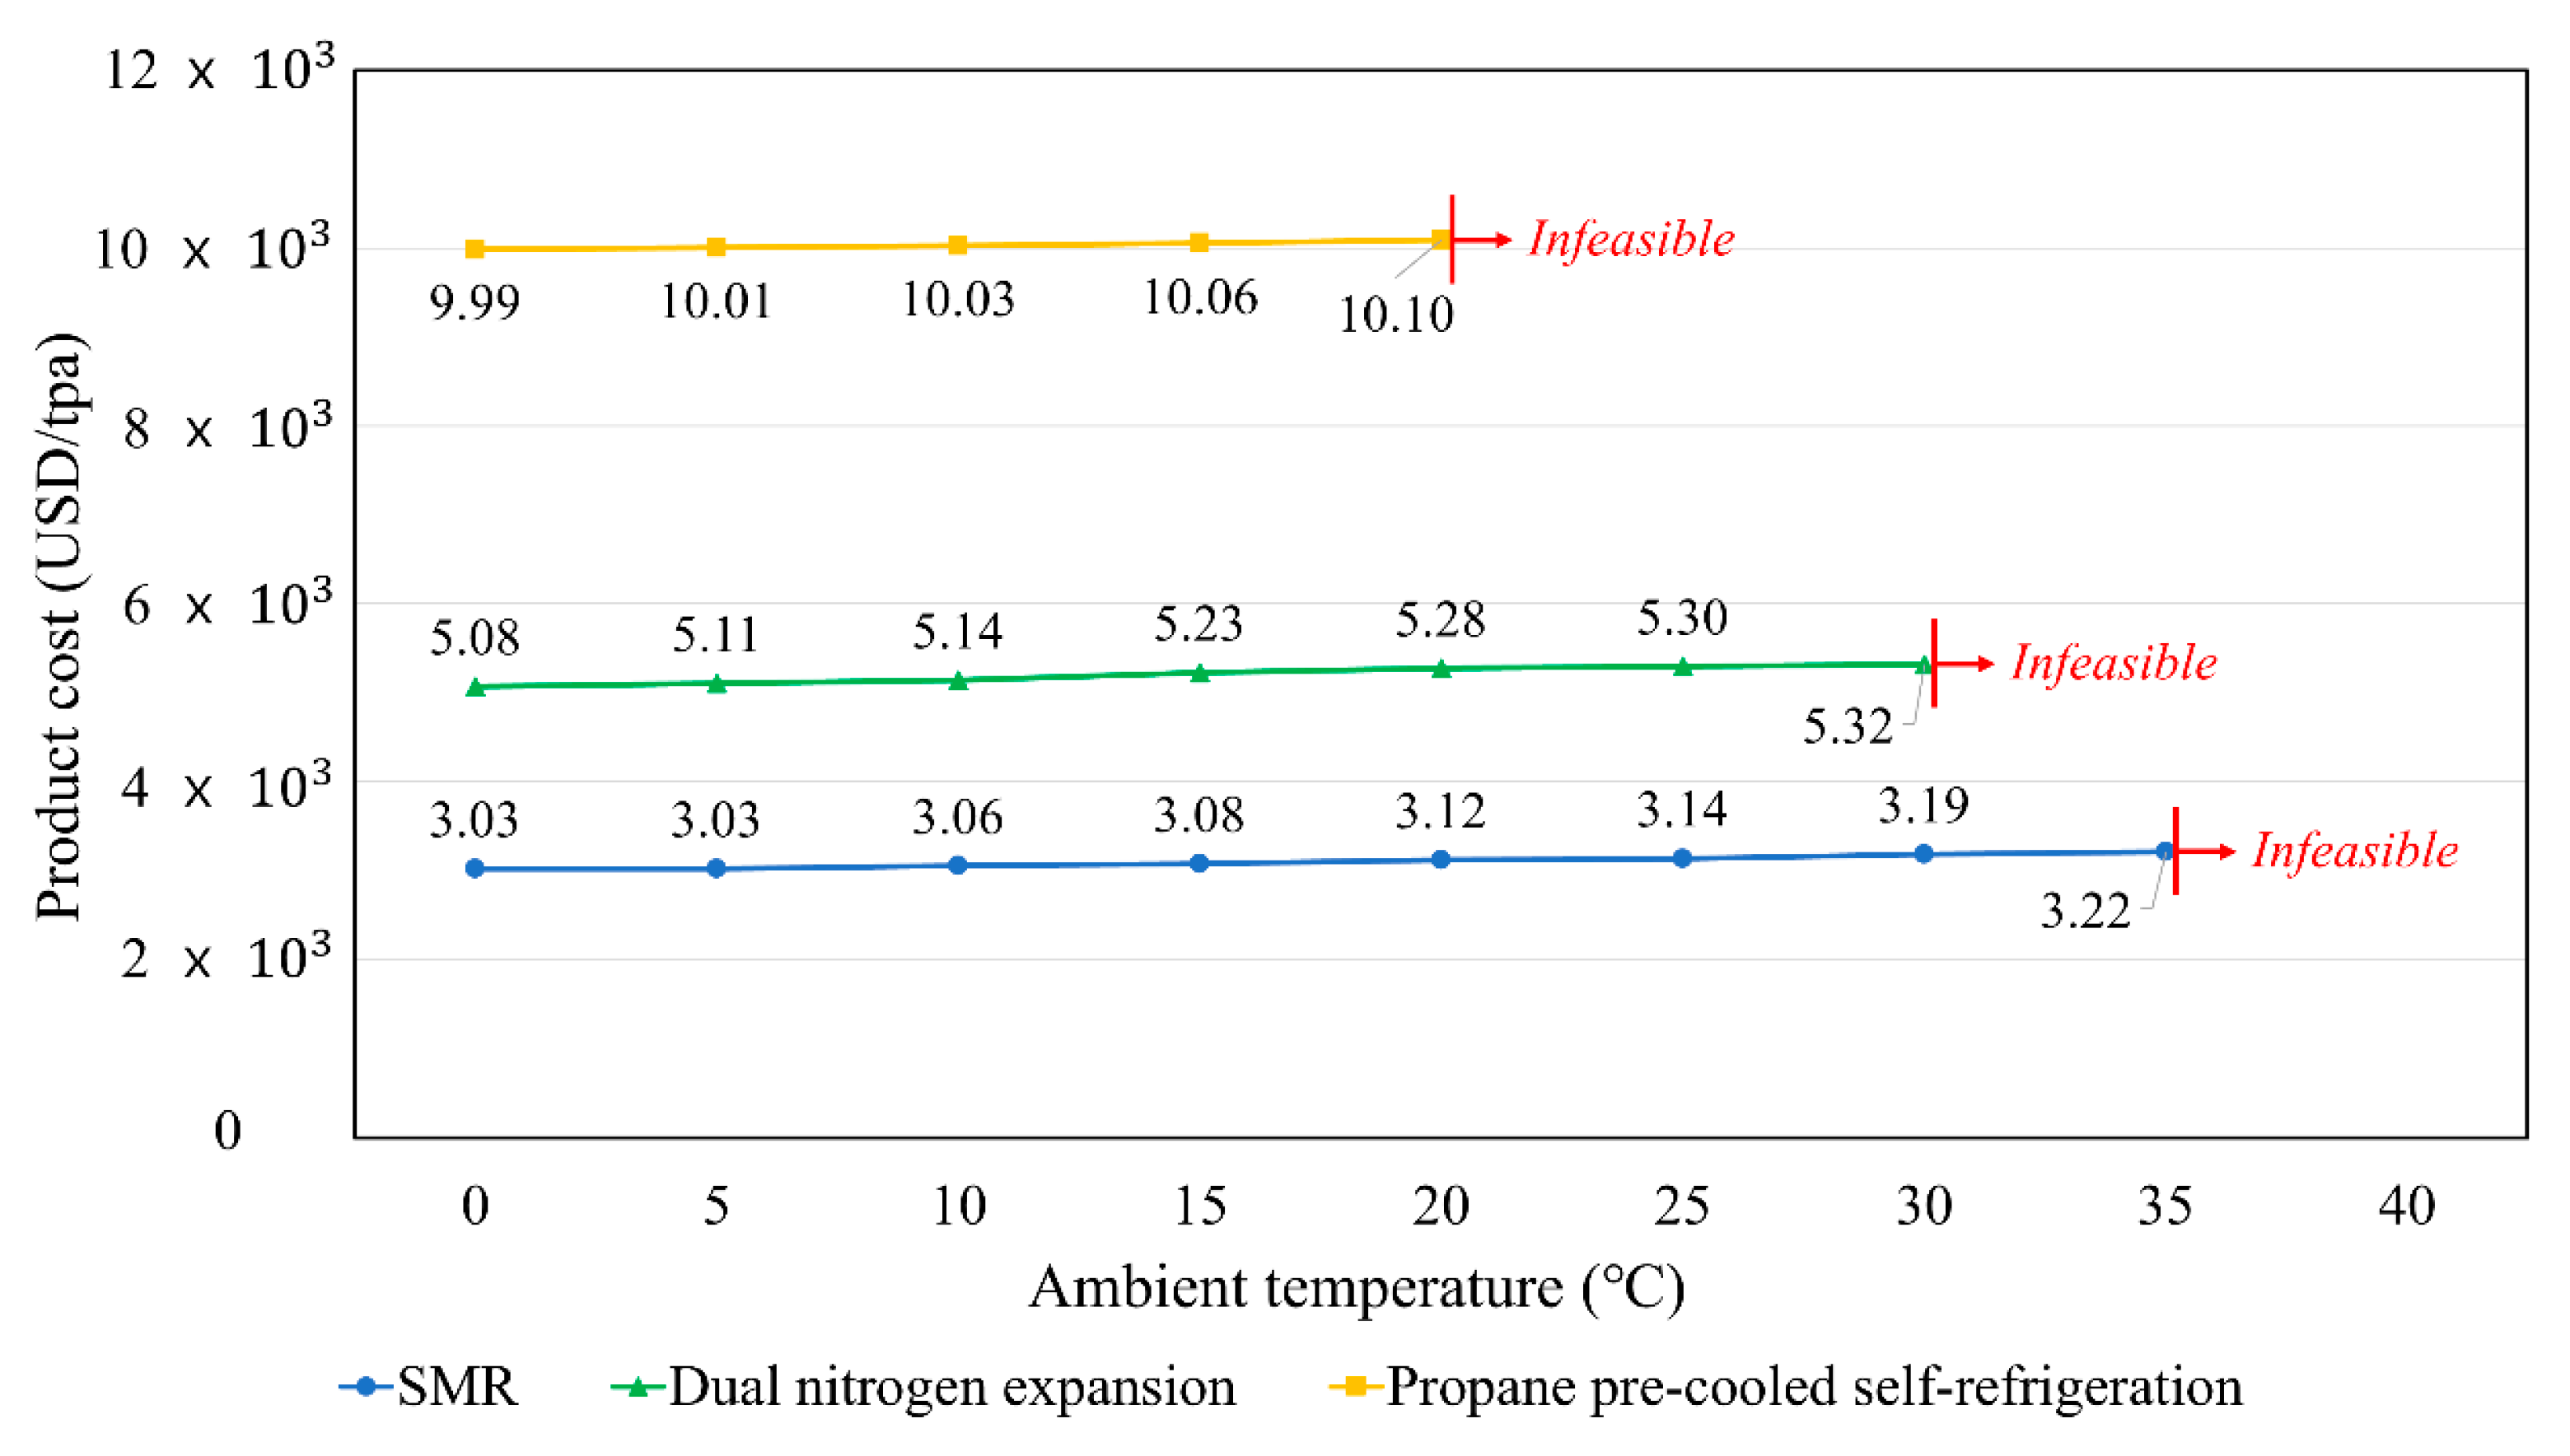
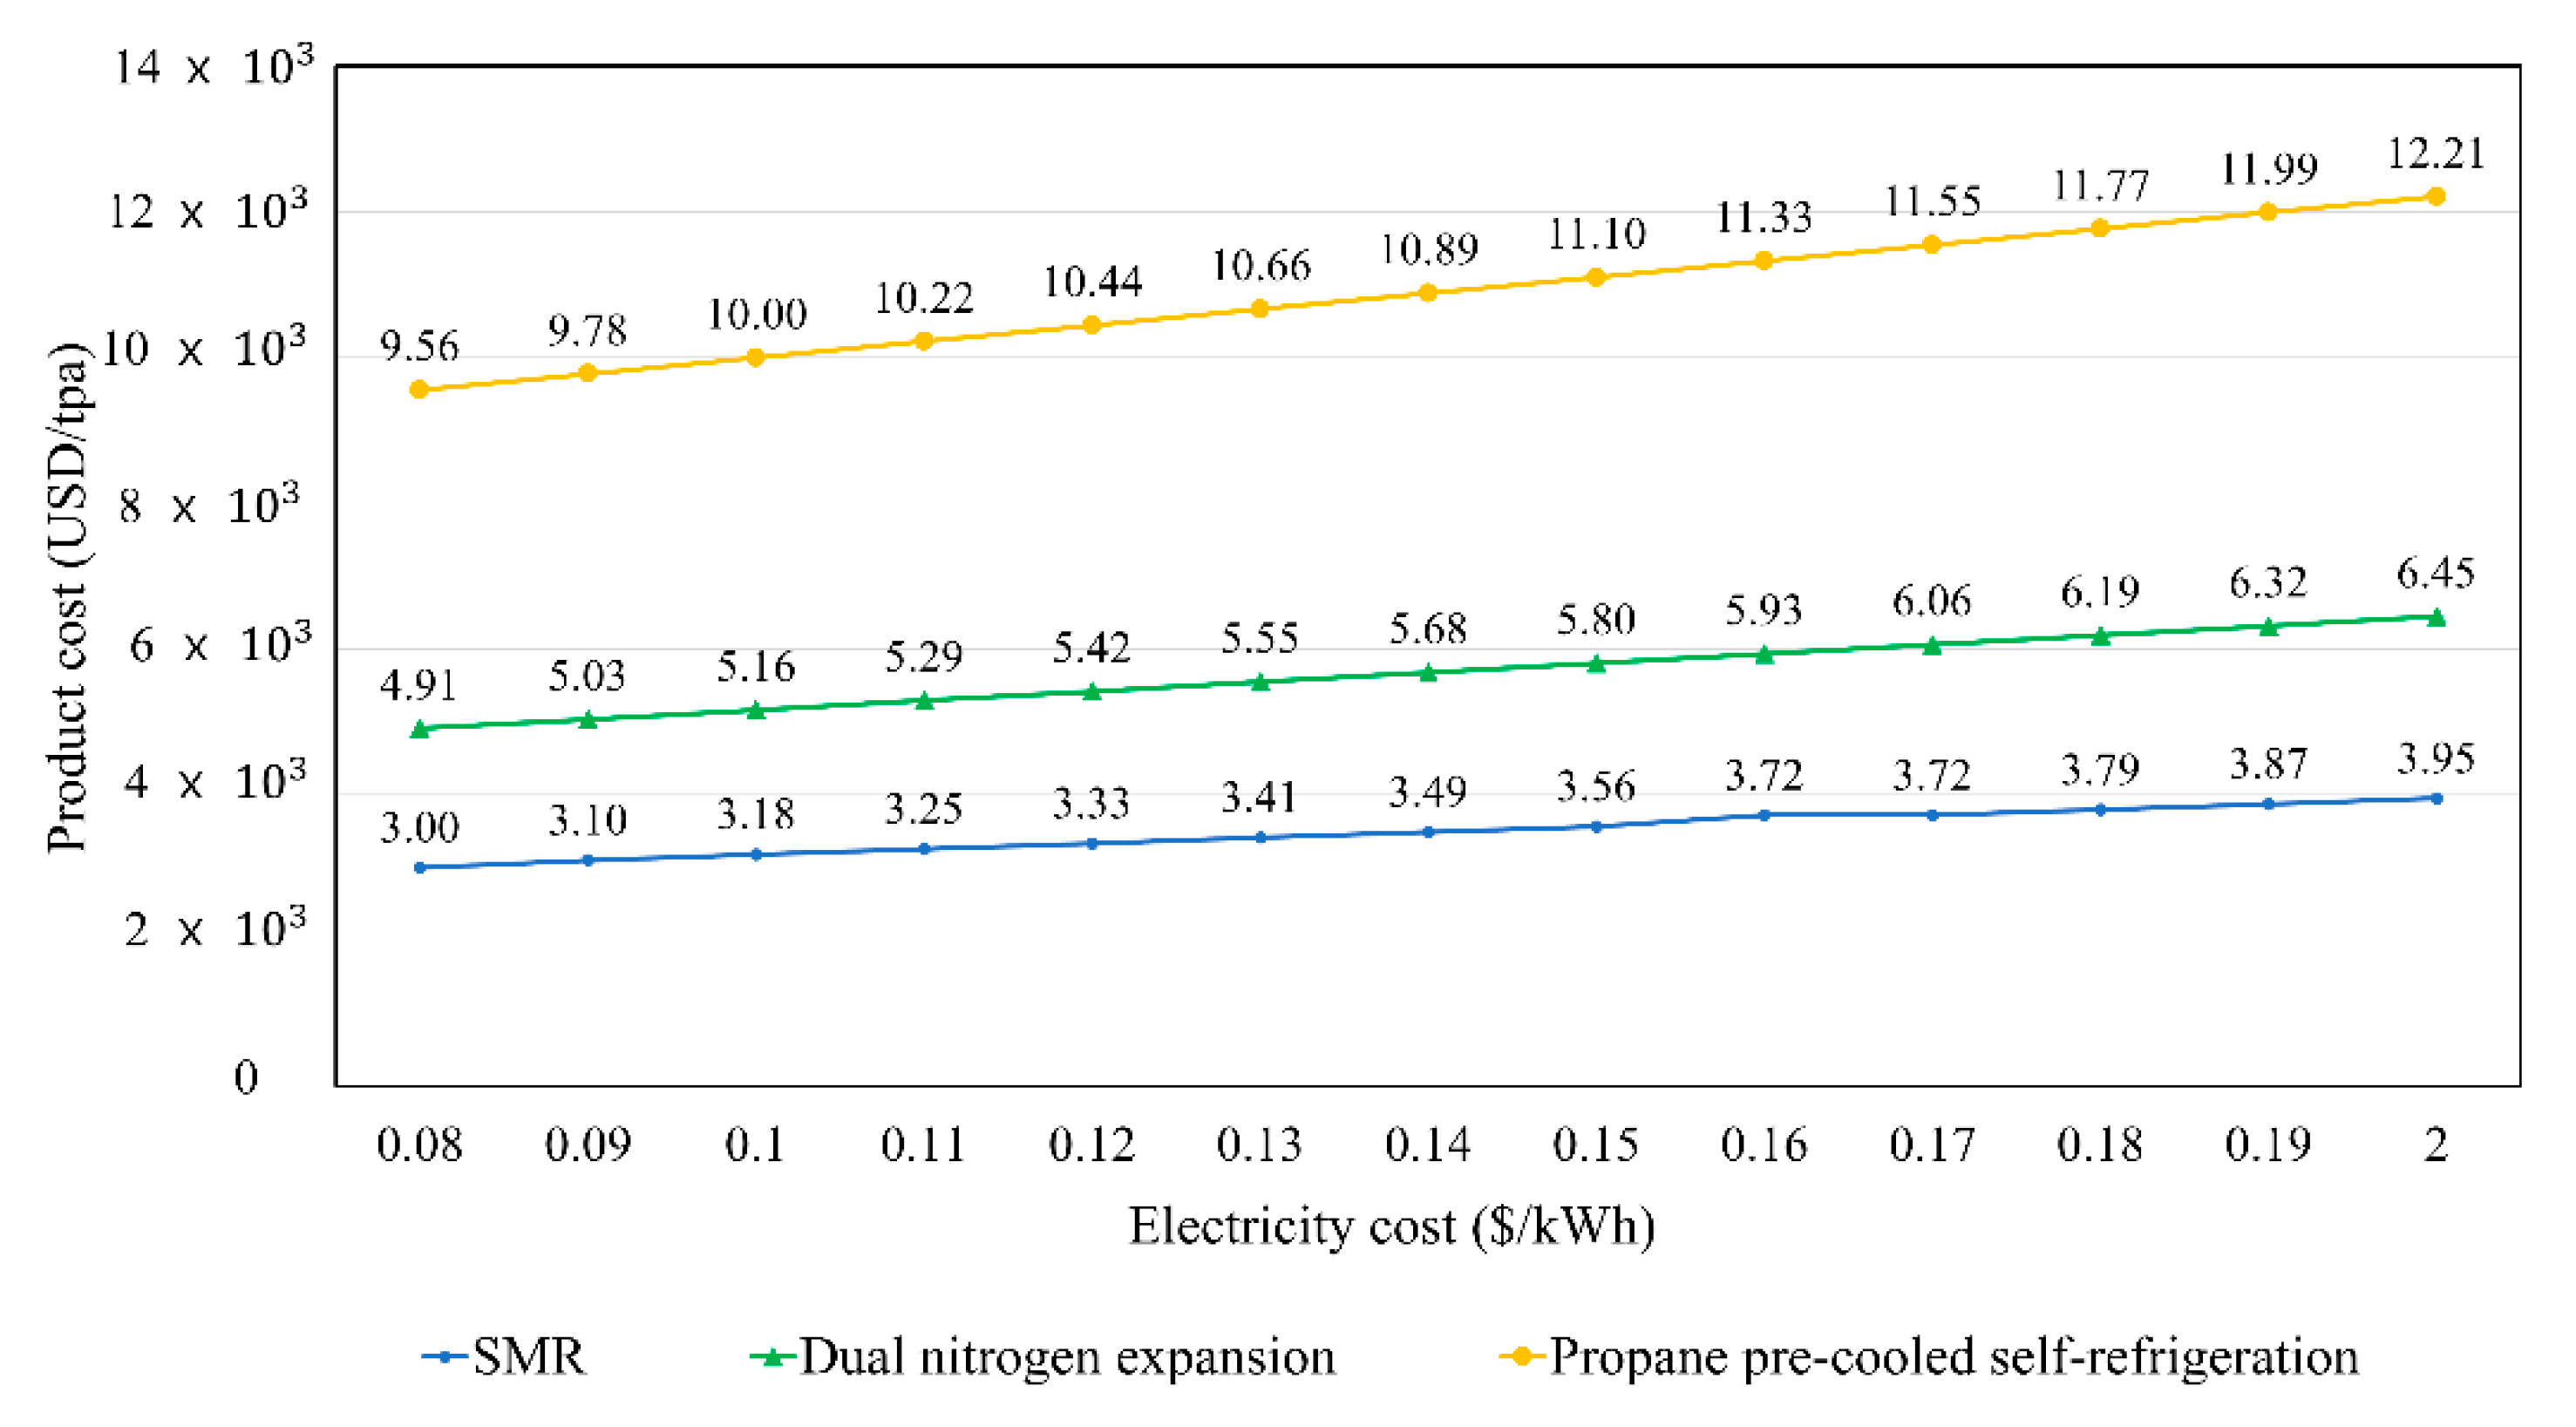
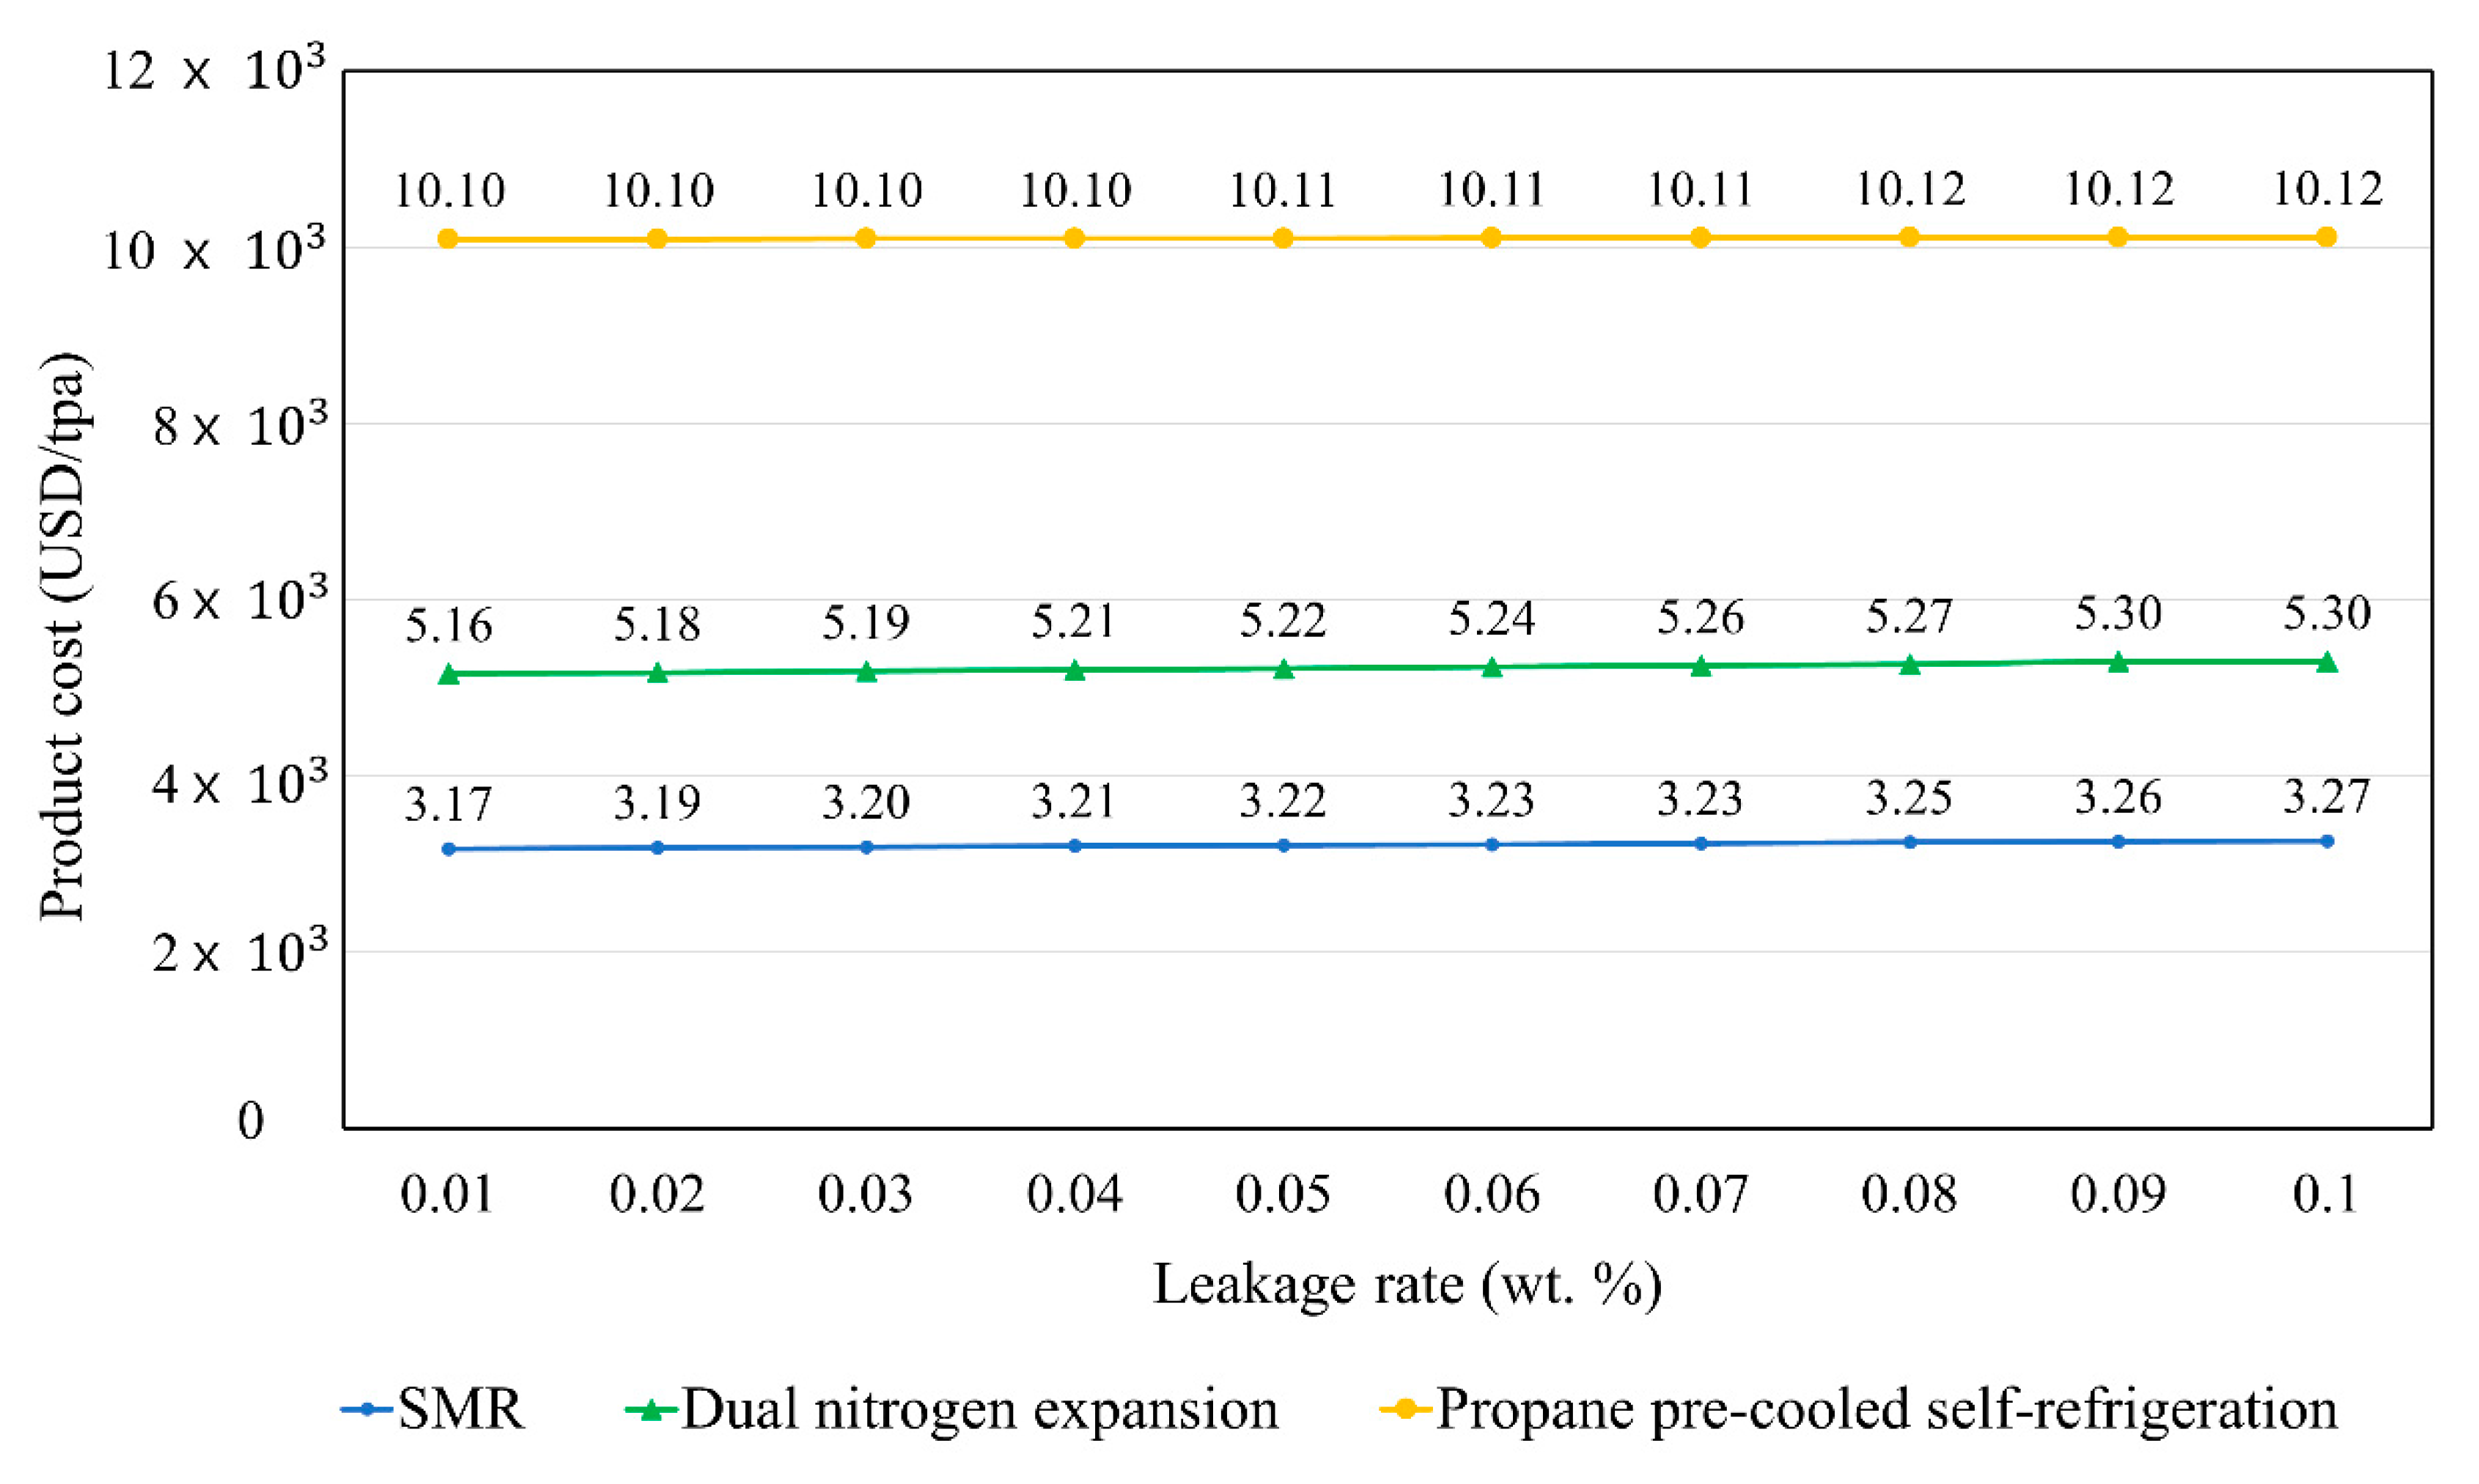
  • Sensitivity analysis was performed to identify parameters that affect exergy and cost significantly. The results showed that natural gas composition, ambient temperature, and compressor leakage rate does not significantly affect product cost. However, effect of electricity cost on the product cost was found to be significant for all processes.
  • The effect of ambient temperature is noticeable from the perspective of exergy efficiency because the required energy tends to increase with an increase in ambient temperature. The SMR can operate within a wider range of ambient temperature changes compared to other processes.
This paper revealed that adding an extra external makeup system for small-scale movable LNG liquefaction not only solves the compressor leakage problem but also does not require significant financial expenditure compared to conventional small-scale movable LNG plants. Further, SMR is concluded to be the most suitable process for small-scale movable LNG plants because it exhibits the highest exergy efficiency, the lowest product cost considering makeup facilities, and the widest operation range. In future work, the safety and environmental issues of the refrigerant will be further investigated as these were excluded in this study.

Author Contributions

Conceptualization, K.P. and D.-H.L.; methodology, S.H.L.; writing—original draft preparation, S.H.L. and K.P.; data curation, S.H.L.; supervision, K.P.; funding acquisition, K.P.; All authors have read and agreed to the published version of the manuscript.

Funding

This research was funded by Sookmyung Women’s University Research, grant number 1-1903-2001 and the National research foundation of Korea, grant number NRF-2018R1C1B5086306.

Conflicts of Interest

The authors declare no conflict of interest.

Nomenclature

AbbreviationDescription (Unit)
CAPEXCapital expenditure (USD/tpa)
CEPCIChemical engineering plant cost index
COPCoefficient of performance
DCDirect cost (MM USD)
DSMRDual single mixed refrigerant
GbestGlobal best
GAGenetic algorithm
HMCDHybrid modified coordinate descent
HTHydraulic turbine
ICIndirect cost (MM USD)
IGUInternational gas union
JTJoule-Thomson
LNGLiquefied natural gas
MCHEMain cryogenic heat exchanger
MITAMinimum internal temperature approach (K)
MM USMillion US dollars (MM USD)
MRMixed refrigerant
MRCMixed refrigerant cycle
NGNatural gas
NGLNatural gas liquid
PbestParticle best
PGPropane gas
PSPatter search
PSOParticle swarm optimization
SMRSingle mixed refrigerant
TACTotal annualized cost (MM USD)
TCCTotal capital cost (MM USD)
TECTotal equipment cost (MM USD)
TOCTotal operating cost (MM USD)
UAOverall heat transfer coefficient, U, multiplied by heat transfer area, A (kJ/sec-K)
Greek symbols
αAmortization factor
Symbols
ExExergy
hEnthalpy
iInterest rate (%)
m R 1 D U A L Mass flow or stream R1 in dual nitrogen expansion process
m M R ,     b u t a n e S M R Mass flow of stream MR’s butane in SMR process
m M R , e t h a n e S M R Mass flow of stream MR’s ethane in SMR process
m M R ,     m e t h a n e S M R Mass flow of stream MR’s methane in SMR process
m M R ,     n i t r o g e n S M R Mass flow of stream MR’s nitrogen in SMR process
m M R ,     p r o p a n e S M R Mass flow of stream MR’s propane in SMR process
ηexExergy efficiency (%)
nPlant lifetime (year)
P R 1 D U A L Pressure of stream LNG2 in dual nitrogen expansion process
P R 2 D U A L Pressure of stream LNG2 in dual nitrogen expansion process
P N G 2 S E L F Pressure of stream NG2 in propane-precooling self-refrigeration process
P P G 2 S E L F Pressure of stream PG2 in propane-precooling self-refrigeration process
P P G 4 S E L F Pressure of stream PG4 in propane-precooling self-refrigeration process
P L N G 2 S M R Pressure of stream LNG2 in SMR process
P M R 2 S M R Pressure of stream MR2 in SMR process
sEntropy
T F E E D D U A L Temperature of stream FEED in dual nitrogen expansion process
T N G 1 D U A L Temperature of stream NG1 in dual nitrogen expansion process
T N G 2 D U A L Temperature of stream NG2 in dual nitrogen expansion process
T R 3 D U A L Temperature of stream R3 in dual nitrogen expansion process
T L N G 1 S E L F Temperature of stream LNG1 in propane-precooling self-refrigeration process
T N G 4 S E L F Temperature of stream NG4 in propane-precooling self-refrigeration process
T L N G 1 ,   M R 4 S M R Temperature of stream LNG1 and MR4 in SMR process
vfequipmentVapor fraction of equipment
WNet power consumed/produced (kW)
x R 9 D U A L Split ratio of stream R9 in dual nitrogen expansion process

Appendix A

Appendix A.1. Schematics for Each Refrigerant Make up System

Figure A1. Refrigerant makeup systems for all processes; * The supply facilities consist of pumps and heaters.
Applsci 10 05391 g0a1

Appendix A.2. Additional Constraints Values Used in the Sensitivity Analysis of Each Process

Table A1. Additional constraints for SMR.
ConstraintsValueUnit
UA of MCHE1242.4kJ/s-K
MR compressor duty192.7kW
Table A2. Additional constraints for dual nitrogen expansion.
ConstraintsValueUnit
UA of MCHE125.6kJ/s-K
UA of MCHE222.7
UA of MCHE25.5kW
Warm expander duty−100.1
Cold expander duty−14.8
N2 compressor duty464.5
Table A3. Additional constraints for propane pre-cooled self-refrigeration.
ConstraintsValueUnit
UA of MCHE17.3kJ/s-K
UA of MCHE23.5
Main compressor duty154.4kW
C3 compressor duty57.6
Booster compressor duty339.1

Appendix A.3. Flowchart of PSO Algorithm

Figure A2. Flowchart of PSO algorithm.
Applsci 10 05391 g0a2

Appendix A.4. Optimization Results of Each Process

This study conducted optimization to acquire the optimal value of the decision variables. The initial and optimized values for the decision variables of each process are summarized in Table A1, Table A2 and Table A3.
Table A4. Optimization results for single mixed refrigerant.
Decision VariablesInitial ValueOptimized Value
Refrigerant mass flowrate (kg/h)
Nitrogen361.62332.17
Methane1056.19456.65
Ethane194.081303.89
Propane512.320.01
N-Butane1875.791936.80
JT-MR outlet pressure (bar)2.53.76
Compressors discharge pressure (bar)4019.68
Hot stream outlet temperatures from MCHE (°C)−148−160.00
LNG production rate (tonne/year) 5346.6
Table A5. Optimization results for dual nitrogen expansion.
Decision VariablesInitial ValueOptimized Value
Refrigerant mass flowrate (kg/h)70687361.56
N2 compressors suction pressure (bar)316.24
N2 compressors discharge pressure (bar)8079.92
Warm/Cold expanders split ratio (R9)0.420.75
Hot stream outlet temperatures from MCHE (°C)
NG1−22−19.74
R4−20−25.29
NG2−102−101.95
R6−95−101.95
LNG1−148−158.68
LNG production rate (tonne/year) 5301.8
Table A6. Optimization results for propane pre-cooled self-refrigeration.
Decision VariablesInitial ValueOptimized Value
Propane mass flowrate (kg/h)11001098.55
JT-PG outlet pressure (bar)21.25
Main compressors discharge pressure (bar)251.01261.68
C3 compressor discharge pressure (bar)20.0111.01
Hot stream outlet temperature from MCHE1 (°C)−20−35.33
Hot stream outlet temperature from MCHE2 (°C)−69−80.08
LNG production rate (tonne/year) 5487.3

References

  1. Dudley, B. BP Energy Outlook 2016; BP: London, UK, 2016. [Google Scholar]
  2. He, T.; Chong, Z.R.; Zheng, J.; Ju, Y.; Linga, P. LNG cold energy utilization: Prospects and challenges. Energy 2019, 170, 557–568. [Google Scholar] [CrossRef]
  3. He, T.; Ju, Y. Optimal synthesis of expansion liquefaction cycle for distributed-scale LNG (liquefied natural gas) plant. Energy 2015, 88, 268–280. [Google Scholar] [CrossRef]
  4. IGU. IGU Releases 2017 World LNG Report; IGU: Barcelona, Spain, 2017. [Google Scholar]
  5. Ryu, J.; Lee, C.; Seo, Y.; Kim, J.; Seo, S.; Chang, D. A Novel Boil-Off Gas Re-Liquefaction Using a Spray Recondenser for Liquefied Natural-Gas Bunkering Operations. Energies 2016, 9, 1004. [Google Scholar] [CrossRef] [Green Version]
  6. Price, B.; Mahaley, M.; Shimer, W. Optimize Small-Scale LNG Production with Modular SMR Technology. 2017. Available online: http://www.gasprocessingnews.com/features/201404/optimize-small-scale-lng-production-with-modular-smr-technology.aspx (accessed on 10 July 2020).
  7. Seddon, D. Gas Usage & Value; PennWell: Tulsa, OK, USA, 2006; ISBN 1-59370-073-3. [Google Scholar]
  8. Remeljej, C.; Hoadley, A. An exergy analysis of small-scale liquefied natural gas (LNG) liquefaction processes. Energy 2006, 31, 2005–2019. [Google Scholar] [CrossRef]
  9. Khan, M.S.; Lee, M. Design optimization of single mixed refrigerant natural gas liquefaction process using the particle swarm paradigm with nonlinear constraints. Energy 2013, 49, 146–155. [Google Scholar] [CrossRef]
  10. Qyyum, M.A.; He, T.; Qadeer, K.; Mao, N.; Lee, S.; Lee, M. Dual-effect single-mixed refrigeration cycle: An innovative alternative process for energy-efficient and cost-effective natural gas liquefaction. Appl. Energy 2020, 268, 115022. [Google Scholar] [CrossRef]
  11. Qyyum, M.A.; Ali, W.; Long, N.V.D.; Khan, M.S.; Lee, M. Energy efficiency enhancement of a single mixed refrigerant LNG process using a novel hydraulic turbine. Energy 2018, 144, 968–976. [Google Scholar] [CrossRef]
  12. He, T.; Mao, N.; Liu, Z.; Qyyum, M.A.; Lee, M.; Pravez, A.M. Impact of mixed refrigerant selection on energy and exergy performance of natural gas liquefaction processes. Energy 2020, 199, 117378. [Google Scholar] [CrossRef]
  13. Qyyum, M.A.; Long, N.V.D.; Minh, L.Q.; Lee, M. Design optimization of single mixed refrigerant LNG process using a hybrid modified coordinate descent algorithm. Cryogenics 2018, 89, 131–140. [Google Scholar] [CrossRef]
  14. Barclay, M.A. Thermodynamic Cycle Selection for Distributed Natural Gas Liquefaction. AIP Conf. Proc. 2004, 710, 75–82. [Google Scholar]
  15. He, T.; Ju, Y. A novel conceptual design of parallel nitrogen expansion liquefaction process for small-scale LNG (liquefied natural gas) plant in skid-mount packages. Energy 2014, 75, 349–359. [Google Scholar] [CrossRef]
  16. He, T.B.; Ju, Y.L. Performance improvement of nitrogen expansion liquefaction process for small-scale LNG plant. Cryogenics 2014, 61, 111–119. [Google Scholar] [CrossRef]
  17. Yuan, Z.; Cui, M.; Xie, Y.; Li, C. Design and analysis of a small-scale natural gas liquefaction process adopting single nitrogen expansion with carbon dioxide pre-cooling. Appl. Therm. Eng. 2014, 64, 139–146. [Google Scholar] [CrossRef]
  18. Abdul Qyyum, M.; Qadeer, K.; Lee, M. Closed-Loop Self-Cooling Recuperative N2 Expander Cycle for the Energy Efficient and Ecological Natural Gas Liquefaction Process. ACS Sustain. Chem. Eng. 2018, 6, 5021–5033. [Google Scholar] [CrossRef]
  19. Elbashir, N.O.; El-Halwagi, M.M.; Economou, I.G.; Hall, K.R. Natural Gas Processing from Midstream to Downstream; John Wiley & Sons: Hoboken, NJ, USA, 2018. [Google Scholar]
  20. Breaking the Barriers of Small-Scale LNG: Galileo Launches the Cryobox. Available online: https://www.galileoar.com/en/galileo-launches-small-scale-lng-cryobox/ (accessed on 2 May 2020).
  21. Ravikumar, A.P.; Roda-Stuart, D.; Liu, R.; Bradley, A.; Bergerson, J.; Nie, Y.; Zhang, S.; Bi, X.; Brandt, A.R. Repeated leak detection and repair surveys reduce methane emissions over scale of years. Environ. Res. Lett. 2020, 15, 034029. [Google Scholar] [CrossRef]
  22. Kohler, T.; Bruentrup, M.; Engineering, L.; Key, R.D.; Edvardsson, T. Choose the best refrigeration technology for small-scale LNG production. Hydrocarb. Process. 2014, 93, 45–52. [Google Scholar]
  23. Krishnamurthy, G.; Roberts, M.J.; Ott, C.M. Precooling strategies for efficient natural gas liquefaction. Hydrocarb. Process. 2017, 96, 19. [Google Scholar]
  24. International Gas Union. Small Scale LNG. In Proceedings of the World Gas Conference (WGC Paris 2015), Paris, France, 1–5 June 2015. [Google Scholar]
  25. Jeremi, M. Distributed vs. Centralized Electricity Generation: Are We Witnessing A Change of Paradigm? HEC Paris: Jouy-en-Josas, France, 2009. [Google Scholar]
  26. Shirazi, L.; Sarmad, M.; Rostami, R.M.; Moein, P.; Zare, M.; Mohammadbeigy, K. Feasibility study of the small scale LNG plant infrastructure for gas supply in north of Iran (Case Study). Sustain. Energy Technol. Assess. 2019, 35, 220–229. [Google Scholar] [CrossRef]
  27. Cao, L.; Liu, J.; Xu, X. Robustness analysis of the mixed refrigerant composition employed in the single mixed refrigerant (SMR) liquefied natural gas (LNG) process. Appl. Therm. Eng. 2016, 93, 1155–1163. [Google Scholar] [CrossRef]
  28. Reverse Brayton Cycle—Brayton Refrigeration Cycle. Available online: https://www.nuclear-power.net/nuclear-engineering/thermodynamics/thermodynamic-cycles/heating-and-air-conditioning/reverse-brayton-cycle-brayton-refrigeration-cycle/ (accessed on 2 May 2020).
  29. Gadhiraju, V. Cryogenic Mixed Refrigerant Processes; International Cryogenics Monograph Series; Timmerhaus, K.D., Rizzuto, C., Eds.; Springer: New York, NY, USA, 2008; ISBN 978-0-387-78513-4. [Google Scholar]
  30. Bukowski, J.; Liu, Y.N.; Boccella, S.; Kowalski, L. Innovations in Natural Gas Liquefaction Technology for Future LNG Plants and Floating Lng Facilities; All from Air Products and Chemicals, Inc, International Has Union Research Conference; IGRC: Seoul, Korea, 2011. [Google Scholar]
  31. Namdeo, R.; Manepatil, S.; Saraswat, S. Detection of Valve Leakage in Reciprocating Compressor Using Artificial Neural Network (ANN); Purdue University: West Lafayette, IN, USA, 2008. [Google Scholar]
  32. Compressed Air Leakage and Compressor Efficiency. Swagelok Indiana. Available online: https://indiana.swagelok.com/en/Tech-Resources/Blog---Tips-and-News/Compressed-Air-Leakage-and-Compressor-Efficiency (accessed on 1 June 2020).
  33. Climate and Clean Air Coalition (CCAC). Technical Guidance Document Number 4: Reciprocating Compressors Rod Seal/Packing Vents; CCAC: Paris, France, 2017. [Google Scholar]
  34. Ferreira, R.T.S.; Lilie, D.E.B. Evaluation of the Leakage through the Clearance between Piston and Cylinder in Hermetic Compressors; Purdue University: West Lafayette, IN, USA, 1984. [Google Scholar]
  35. PARK, K.T. Transportable Refrigerant Supplying System for LNG Liquefaction Plant 2019. Patent Application Number 10-2017-0106470, 23 August 2017. [Google Scholar] [CrossRef]
  36. Wang, B.; Huang, Y.; Wu, J.; Wang, T.; Lei, G. Experimental study on pressure control of liquid nitrogen tank by thermodynamic vent system. Appl. Therm. Eng. 2017, 125, 1037–1046. [Google Scholar] [CrossRef]
  37. Wang, M.; Khalilpour, R.; Abbas, A. Thermodynamic and economic optimization of LNG mixed refrigerant processes. Energy Convers. Manag. 2014, 88, 947–961. [Google Scholar] [CrossRef]
  38. He, T.; Liu, Z.; Ju, Y.; Parvez, A.M. A comprehensive optimization and comparison of modified single mixed refrigerant and parallel nitrogen expansion liquefaction process for small-scale mobile LNG plant. Energy 2019, 167, 1–12. [Google Scholar] [CrossRef]
  39. Kim, J.; Seo, Y.; Chang, D. Economic evaluation of a new small-scale LNG supply chain using liquid nitrogen for natural-gas liquefaction. Appl. Energy 2016, 182, 154–163. [Google Scholar] [CrossRef]
  40. Aspelund, A.; Gundersen, T.; Myklebust, J.; Nowak, M.P.; Tomasgard, A. An optimization-simulation model for a simple LNG process. Comput. Chem. Eng. 2010, 34, 1606–1617. [Google Scholar] [CrossRef]
  41. Bao, J.; Lin, Y.; Zhang, R.; Zhang, N.; He, G. Effects of stage number of condensing process on the power generation systems for LNG cold energy recovery. Appl. Therm. Eng. 2017, 126, 566–582. [Google Scholar] [CrossRef]
  42. Ansarinasab, H.; Mehrpooya, M.; Sadeghzadeh, M. An exergy-based investigation on hydrogen liquefaction plant-exergy, exergoeconomic, and exergoenvironmental analyses. J. Clean. Prod. 2019, 210, 530–541. [Google Scholar] [CrossRef]
  43. Sadaghiani, M.S.; Mehrpooya, M.; Ansarinasab, H. Process development and exergy cost sensitivity analysis of a novel hydrogen liquefaction process. Int. J. Hydrogen Energy 2017, 42, 29797–29819. [Google Scholar] [CrossRef]
  44. Park, K.; Oh, S.-R.; Won, W. Techno-economic optimization of the integration of an organic Rankine cycle into a molten carbonate fuel cell power plant. Korean J. Chem. Eng. 2019, 36, 345–355. [Google Scholar] [CrossRef]
  45. Koo, J.; Oh, S.-R.; Choi, Y.-U.; Jung, J.-H.; Park, K. Optimization of an Organic Rankine Cycle System for an LNG-Powered Ship. Energies 2019, 12, 1933. [Google Scholar] [CrossRef] [Green Version]
  46. Emadi, M.A.; Mahmoudimehr, J. Modeling and thermo-economic optimization of a new multi-generation system with geothermal heat source and LNG heat sink. Energy Convers. Manag. 2019, 189, 153–166. [Google Scholar] [CrossRef]
  47. Akbari, N. Introducing and 3E (energy, exergy, economic) analysis of an integrated transcritical CO2 Rankine cycle, Stirling power cycle and LNG regasification process. Appl. Therm. Eng. 2018, 140, 442–454. [Google Scholar] [CrossRef]
  48. Ghorbani, B.; Shirmohammadi, R.; Mehrpooya, M. A novel energy efficient LNG/NGL recovery process using absorption and mixed refrigerant refrigeration cycles—Economic and exergy analyses. Appl. Therm. Eng. 2018, 132, 283–295. [Google Scholar] [CrossRef]
  49. Chong, Z.R.; He, T.; Babu, P.; Zheng, J.; Linga, P. Economic evaluation of energy efficient hydrate based desalination utilizing cold energy from liquefied natural gas (LNG). Desalination 2019, 463, 69–80. [Google Scholar] [CrossRef]
  50. Rezaie, F.; Pirouzfar, V.; Alihosseini, A. Technical and economic analysis of acrylonitrile production from polypropylene. Therm. Sci. Eng. Prog. 2020, 16, 100463. [Google Scholar] [CrossRef]
  51. Wang, T. U.S. average retail electricity prices 1990–2018 (in U.S. cents per kilowatt hour). Stat. Res. Dep. Available online: https://www.statista.com/statistics/711752/industrial-consumer-price-for-retail-electricity-in-mena-by-key-country/ (accessed on 12 April 2020).
  52. Jenkins, S. 2019 CEPCI UPDATES: NOVEMBER (PRELIM.) AND OCTOBER (FINAL); Chemical Engineering Essentials for the CPI Professional. Available online: https://www.chemengonline.com/2019-cepci-updates-november-prelim-and-october-final (accessed on 27 January 2020).
  53. Lozowki, D. The chemical engineering plant cost index; Chemical Engineering Essentials for the CPI Professional. Available online: https://www.chemengonline.com/pci-home/ (accessed on 27 January 2020).
  54. Methane Prices, Liter. Available online: https://www.globalpetrolprices.com/methane_prices/ (accessed on 27 May 2020).
  55. Ethane Prices. Available online: https://www.intratec.us/chemical-markets/ethane-price (accessed on 27 May 2020).
  56. Propane Prices. Available online: https://www.intratec.us/chemical-markets/propane-price (accessed on 27 May 2020).
  57. Butane Prices. Available online: https://www.intratec.us/chemical-markets/butane-price (accessed on 27 May 2020).
  58. Sodium Prices. Available online: https://www.intratec.us/chemical-markets/sodium-price (accessed on 27 May 2020).
  59. Songhurst, B. LNG Plant Cost Escalation; Oxford Institute for Energy Studies: Oxford, UK, 2014. [Google Scholar]
  60. Graham, E.; Kenbar, A. LNG energy transfer uncertainty–sensitivity to composition and temperature changes. Flow Meas. Instrum. 2015, 44, 79–88. [Google Scholar] [CrossRef]
  61. Schmid, D. Industrial sector electricity prices in the European Union (28 countries) between July and December 2017. Stat. Res. Dep. Available online: https://www.statista.com/statistics/263262/industrial-sector-electricity-prices-in-selected-european-countries/ (accessed on 5 June 2020).
Figure 1. Illustration of a movable liquefied natural gas liquefaction plant.
Applsci 10 05391 g001
Figure 2. Process flow diagram of the single mixed refrigerant system.
Applsci 10 05391 g002
Figure 3. Process flow diagram of the dual nitrogen expansion system.
Applsci 10 05391 g003
Figure 4. Process flow diagram of the propane pre-cooled self-refrigeration system.
Applsci 10 05391 g004
Figure 5. Cost estimation framework.
Applsci 10 05391 g005
Figure 6. Performance comparison results of optimization algorithms for the base case.
Applsci 10 05391 g006
Figure 7. Exergy efficiency and the total annualized cost for each process.
Applsci 10 05391 g007
Figure 8. Breakdown of the total equipment cost.
Applsci 10 05391 g008
Figure 9. TAC comparison of the base case with/without the makeup system.
Applsci 10 05391 g009
Figure 10. Effect of natural gas compositions on each process.
Applsci 10 05391 g010
Figure 11. Effect of the natural gas compositions on the product cost of each process.
Applsci 10 05391 g011
Figure 12. Effects of the natural gas compositions on the variable cost of each process.
Applsci 10 05391 g012
Figure 13. Effects of ambient temperature on exergy efficiency of each process.
Applsci 10 05391 g013
Figure 14. Effects of ambient temperature on product cost of each process.
Applsci 10 05391 g014
Figure 15. Effects of electricity cost on product cost of each process.
Applsci 10 05391 g015
Figure 16. Effects of the compressor leakage on product cost of each process.
Applsci 10 05391 g016
Table 1. Common parameters for all simulation cases.
Parameters [40,41]UnitValue
Feed NG compositions Table 2
Feed NG flowrate kg/h626.4
Feed NG temperature°C20
Feed NG inlet pressurebar60
LNG production pressurebar1.05
LNG production temperature°CSaturated
Ambient temperature°C20
Pressure drop in heat exchangersbar0.2
Compressor adiabatic efficiency 0.8
Expander adiabatic efficiency 0.8
Table 2. Different feed natural gas compositions [40].
ComponentMole Fraction
LeanNormal (1)Rich
Nitrogen0.00370.001850.000
Methane0.95890.923450.888
Ethane0.02960.04280.056
Propane0.00720.02210.037
n-Butane0.00030.00490.0095
i-Butane0.00030.00490.0095
(1) The normal composition is the average value of lean and rich feed streams.
Table 3. Particle swarm optimization algorithm parameters used in this study.
ParametersValue
Number of particles10 × the number of decision variables
Maximum iteration200
Self-adjustment weight1.49
Social-adjustment weight1.49
Stop criteria1.0 × 10−6
Table 4. Assumptions for economic analysis.
Assumptions
  • All costs are presented in USD (2017).
  • Plant availability of 95% corresponds to an operation time of 8322 h/year [49].
  • Total equipment cost (TEC) is evaluated using Aspen process economic analyzer (2017) [49,50].
  • As the land and labor costs vary depending on the scenario; they are not considered in this study.
  • Total raw material costs include the initial charge and make-up costs of the material: the compressor leakage rate of 0.05 wt. % is assumed [32,33,34].
  • Electricity costs are based on the average retail electricity prices in the US ($0.1048 per kWh) in 2017 [51].
Table 5. Execution time comparison of optimization algorithms for the base case.
Optimization AlgorithmExecution Time (Min.)
Patter search241.8
Genetic algorithm533.2
Particle swarm optimization132.2
Table 6. Summary of the cost analysis results.
SMRDual Nitrogen ExpansionPropane Pre-Cooled Self-Refrigeration
Total capital cost (TCC, MM USD)4.3945.47710.568
Direct cost3.3294.1498.006
Indirect cost0.6660.8301.601
Contingency0.3990.4980.961
Total operating cost (TOC, MM USD/yr)0.7120.9861.756
Variable cost0.1820.3260.483
Raw material cost0.0140.0210.004
Energy cost0.1680.3050.479
Fixed cost0.4630.5771.113
Maintenance0.0670.0830.160
Total annualized cost (TAC, MM USD/yr)0.8881.2052.179
Product cost (USD/tpa)4162.55645.410213.5

