Article

Event Detection and Spatio-temporal Analysis of Low-Altitude Unstable Approach

1
Engineering and Technical Research Center of Civil Aviation Safety Analysis and Prevention, China Academy of Civil Aviation Science and Technology, Beijing 100028, China
2
School of Remote Sensing and Information Engineering, Wuhan University, Wuhan 430072, China
*
Authors to whom correspondence should be addressed.
Appl. Sci. 2020, 10(14), 4934; https://doi.org/10.3390/app10144934
Submission received: 1 June 2020 / Revised: 12 July 2020 / Accepted: 14 July 2020 / Published: 17 July 2020
(This article belongs to the Special Issue Spatial Modeling in Environmental Analysis and Civil Engineering)

Abstract

:

Featured Application

Low-Altitude Unstable Approach Detection and Risk Evaluation.

Abstract

Low-altitude unstable approach (UA) is one of the crucial risks that threaten flight safety. In this study, we proposed a technical program for detecting low-altitude UA events. The detection logic was to optimize the step-wise regression model with iterative surveys with more than 20 experienced pilots. Accordingly, the frequencies of UA events occurring around each airport in January 2018 were calculated for all the airports within mainland China. Finally, the spatial distribution characteristics of UA events were analyzed via exploratory spatial data analysis. In addition, Pearson’s correlation coefficient and the geographically weighted correlation coefficient were used to explore the correlations between UA frequency and the altitude elevation, wind level, and bad weather. The experimental results revealed that the proposed method can accurately detect the occurrence of low-altitude UA and quantitatively characterize risks. It was found that UA exhibits obvious differences in spatial distribution. Moreover, significantly strong correlations were found between UA and altitude elevation, wind level, and bad weather, and correlation differences were also reflected in different regions in China.

1. Introduction

A stable approach is a flying stage during which the pilot establishes and maintains a constant angle glidepath towards a predetermined point on the landing runway [1]. For a safe flight, it is necessary for a flight to keep stabilized by 1000 feet above airport elevation in instrument meteorological conditions and by 500 feet in visual meteorological conditions [2]. An unstable approach (UA) can happen when the pilot fails to plan, prepare and conduct a stable approach. Although the approach process only accounts for about 4% of the entire flight process, unsafe incidents occurring during this process account for up to 49.1% of total flight accidents [3]. In particular, UA was a causal factor in 66% of 76 approach-and-landing accidents or serious incidents all over the world in 1984 through 1997 [4]. Therefore, it is of great practical significance to explore and analyze the spatio-temporal distribution of UA events and their influencing factors.
A number of studies using physical methods have been conducted to explore the criteria of a stable approach and identify UA events. Wang et al. [5] proposed a method for analyzing the criteria of a stable approach with surveillance track data. Moreover, they also explored aborted approaches and their underlying factors [6]. Rao and Puranik [7] presented a retrospective approach to explore the causes of UA events with historical accident data. Yan and Lv [8] presented a possibility measure-based model for the detection of UA via flight data analysis. Li et al. [9] proposed a Gaussian Mixture Model-based cluster analysis approach to detect abnormal flights with elevated risks. Campbell et al. [10] developed go-around decision making criteria for avoiding UA risks via simulation studies. These studies largely concerned mechanical factors of UA events, but ignored the flying experience of pilots, particularly for evaluating their potential risks. In this paper, a detection model based on extensive questionnaires of more than 20 experienced pilots is proposed.
Moreover, previous studies on UA primarily focused on artificial [11], meteorological, and mechanical [12] influencing factors, such as the impact of sudden low-altitude wind shear [13]. Risks potentially caused by UA have also been widely evaluated via the gray clustering method [14], approaching angle and trajectory analysis [15], K-means clustering [13], and neural networks [16]. However, UA events and relative factors have rarely been studied from spatial and temporal perspectives [17,18]. In this study, spatio-temporal patterns and relative factors of UA events are explored with the risk of low-altitude UA events detected and evaluated.
In this study, with data collected from quick access recorders (QARs) [19,20,21], a program for detecting low-altitude UA events with their risks evaluated was developed. The spatio-temporal analyses of detected UA events were conducted via exploratory spatial data analysis (ESDA) techniques [22]. Moreover, relationships between the influencing factors of UA events were further explored to develop models for prediction and explanation of UA events. The exploratory analysis of the UA events presented in this article provides an important research basis and guidance for future quantitative causal analysis, and also shows practical significance for predicting and avoiding UA events.
The remainder of this paper is organized as follows. Section 2 presents the methodology and data used in this study. In Section 3, results of UA detection and exploratory factors are presented with a case study. Finally, this study is summarized and future work on this topic is also anticipated in Section 4.

2. Methodology

2.1. Data

A database station was constructed by the China Academy of Civil Aviation Science and Technology to collect all the QAR data of domestic flights for flight operations quality assurance (FOQA). The conduction of a wide range of flight risk studies with this QAR data is important for promoting civil aviation safety. In total, QAR data of over 3500 aircraft or airlines are aggregated daily into the base station, and up to 2000 parameters are recorded in the data records, including the time, latitude and longitude, flight altitude, flight speed, wind speed, temperature, ground proximity warnings, and flight attitude. These parameters comprehensively reflect the characteristics of a flight by recording its time, space, pilot control, and engine performance. Most of the parameters are recorded every second, while some sensitive parameters are recorded as often as every 1/8 second. QAR data can be widely applied in condition monitoring, fault diagnosis, flight quality assessment, flight process visualization, mechanics maintenance, and fuel consumption control.
In this work, QAR data collected from more than 10,000 flights from 1 January to 30 June 2018 were utilized. The UA events were explored with the proposed method, and it was found that approximately 5000 flights seemed to be affected by UA. Moreover, the spatio-temporal patterns of UA events during January 2018 were explored via ESDA techniques, as well.

2.2. Methods and Models

The trigger frequency was calculated as the ratio of the number of UA events divided by the total amount of air traffic of each airport, and it was modeled as a spatial analysis unit in this paper. The spatio-temporal distribution patterns of UA events were explored by temporal heatmaps, spatial distribution maps, and spatio-temporal cubes. Correlation analysis was used to make a preliminary analysis of the potential influencing factors of UA events, such as airport terrain and meteorological factors.

2.2.1. Unstable Approach Detection

More than 20 experienced pilots were surveyed, and flight parameters such as the airspeed, descent rate, configuration, heading, glide path, and slope were considered for the detection of UA events; these parameters are interpreted and presented in Table 1 and Table 2, respectively. All the parameter thresholds were iteratively verified with empirical data collected from 10,000 flights via the analysis ground station (AGS) platform. When the data satisfied one of the conditions, it was empirically recognized as a suspicious UA event. In particular, a radio height under 200 feet was chosen in this study, as UA events occurring under this condition could be highly risky and cause a real accident.
According to the rules in Table 2, all the UA events could be preliminarily detected via the empirical rules. In this study, QAR data from 10,000 flights were utilized, of which UA events were found to occur in 5000. We then distributed them randomly in the questionnaire for the pilots to mark their risks. As an output, a score ranging from 0 to 1 was provided for each suspicious UA event. A score close to 1 means a high risk potentially caused by UA, and a score equal to 1 indicates a UA accident.

2.2.2. Quantitative Risk Evaluation Model

In this study, an empirical data set was produced via questionnaire survey with experienced pilots. To quantitatively evaluate the risk of UA events, we adopted the multiple linear regression technique to explore the relationships between the risk scores of UA events and relative flight parameters. In the first place, step-wise regression was adopted to specify a proper regression model [23]. Its workflow was designed as follows:
STEP 1: Select one of the available variables that produces the smallest Akaike information criterion (AIC) value to form a one-way regression equation;
STEP 2: Select one of the remaining independent variables, along with the regression equation in STEP 1, to form a binary regression equation. The binary regression equation should have a smaller AIC value;
STEP 3: Repeat while selecting one variable each iteration until all the variables are introduced. If the first variable is no longer important due to the introduction of some variable, then remove the first variable;
STEP 4: The model is optimized when no variables need to be introduced or eliminated.
Repeat STEP 1 to STEP 4 until an overrun model for all 5 parameters is obtained. Note that this procedure was tried several times with scores amended and outliers excluded so that the models could be developed optimally.
The stepwise regression equation of pitch overrun modeling is as follows,
S C O R E = 0.4946 + 0.1213 × PITCH + 0.01042 × ROLL 0.0001017 × IVV
where S C O R E is the risk score marked optimally for each UA event.
The results of the stepwise regression demonstrate that the track deviation and airspeed were deleted in the process of stepwise regression, which indicates that airspeed is not a statistically significant factor in the modeling of pitch overrun.
The stepwise regression equation of track deviation modeling is as follows,
S C O R E = 0.2982 + 0.00007 × F l i g h t _ s p e e d + 0.003271 × PITCH 0.003429 × ROLL 0.00001623 × IVV + 0.08546 × A l i g n m e n t _ T R D
where F l i g h t _ s p e e d means the flight speed by (Reference speed − Indicated airspeed, (VREF − IAS)), and A l i g n m e n t _ T R D means the alignment of track and runway direction.
The stepwise regression equation of excessive airspeed modeling is as follows:
S C O R E = 0.2410498 0.0019022 × A l i g n m e n t _ T R D   + 0.0501647 × F l i g h t _ s p e e d
The results of the stepwise regression demonstrate that the excessive airspeed limit is only related to airspeed and track deviation.
The stepwise regression equation of slope overrun modeling is as follows:
S C O R E = 0.4631086 + 0.0584883 × ROLL
The stepwise regression equation of the rate reduction overrun modeling is as follows:
S C O R E = 1.018 0.00975 × IVV
With the above models, the UA events happening at each airport could be chosen carefully and evaluated quantitatively. These models could play important roles in evaluating risk scores of detected suspicious UA events. We incorporated them in a toolkit for UA risk evaluation with the parameters in Table 1 as input, which will allow users to select the triggering reason and relevant parameters to obtain the UA risk score with QAR records. In this sense, the frequencies of UA events occurring around each airport can be calculated accordingly. In this study, all the UA events triggered by Chinese civil aircraft in January 2018 concern airports within mainland China.

3. Results and Discussion

3.1. Temporal Heatmap Analysis

In this study, the spatio-temporal statistics of all the UA events triggered by Chinese civil aircraft in January 2018 were analyzed. A temporal heatmap is presented in Figure 1 to show the temporal distribution characterization of UA events. The results indicate that UA was highly likely to occur from the 8th to the 10th or in late January, and the occurrence time was mainly between 11 am to 5 pm. Observe that this period was just one week before Chinese New Year, known as “Spring Festival travel season”, so the number of flights could be the highest of the year. Furthermore, the period (11 am to 5 pm) corresponds to the busiest time with the most flights landing during a day. The results indicate that UA events should be noted for busy airports, but fail to provide detailed information for better risk management. Thus, spatial analyses with long time series data are needed for future studies.

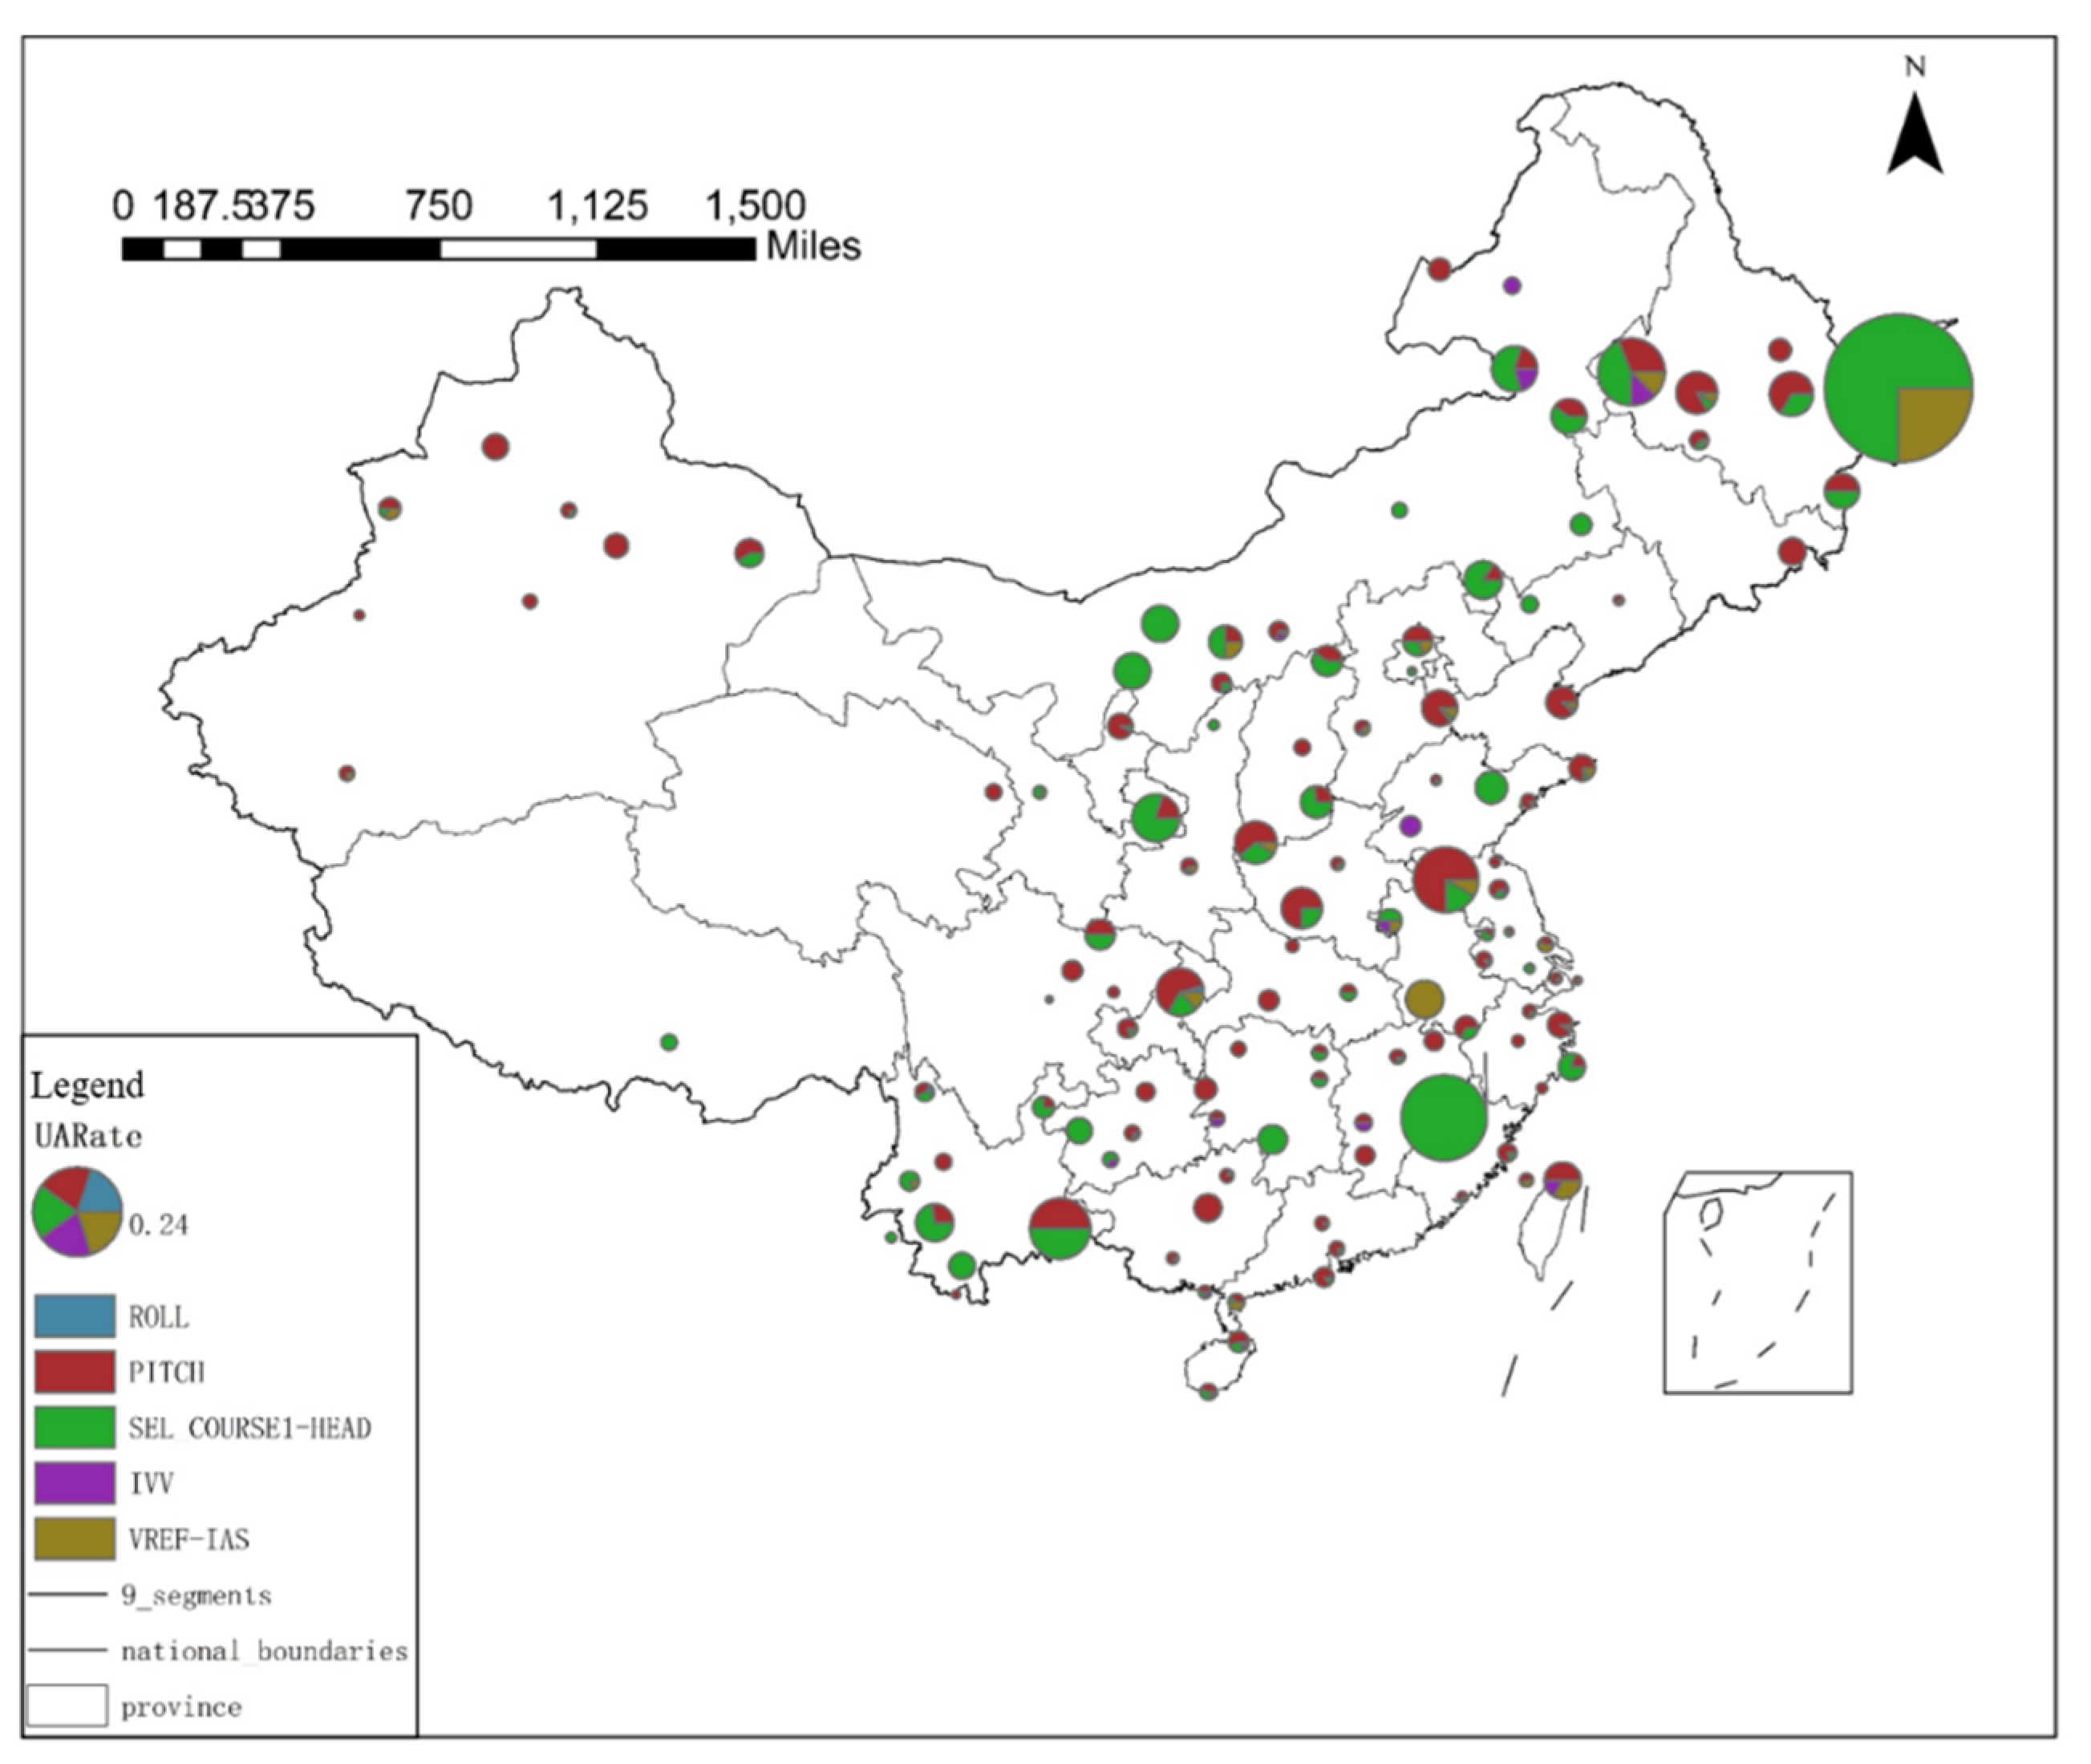
3.2. Spatial Distribution Analysis

The spatial distribution processing steps were as follows:
(1)
Count the number of UA events occurring at each airport;
(2)
Count the monthly throughput of the airport;
(3)
Calculate the frequency of UA using the number of UA events and the throughput;
(4)
Conduct spatial correlation analysis to match the segment of the UA and airports.
The frequency of UA events was visually analyzed, and the results are presented in Figure 2. As shown in Figure 2, UA events were found to occur frequently in the eastern part of China, where airports are always busy. This pattern is consistent with the result presented in Figure 1. In particular, dramatic changes in terrain seem to be highly correlated with UA event frequencies, as in the northeastern and midwestern areas. Note that high frequencies appear in high-altitude areas, such as Yunnan. This observation indicates that the occurrence of UA is correlated with high-altitude terrain or its changes. In Xinjiang Province and most of the eastern regions, UA events were found to occur with different frequencies in different time periods, which could be related to the local meteorological conditions in January.
From the distribution of the triggering causes of UA presented in Figure 3, the UA incidents that happened in the northeastern and southern regions of China were mainly caused by track deviations, while pitch overruns were found to be more prominent causes of UA in the eastern and northwestern regions of China.

3.3. Correlation Analysis between Influential Factors

3.3.1. Pearson’s Correlation Coefficient

Pearson’s correlation coefficient is used to analyze the correlations of parameters, and the correlation analysis is performed on two parameters. The calculation formula is as follows:
r = i = 1 n ( X i X ¯ ) ( Y i Y ¯ ) i = 1 n ( X i X ¯ ) 2 i = 1 n ( Y i Y ¯ ) 2
Figure 4 illustrates the correlations between pitch angle of flight (PITCH) and other factors. The upper-right triangle of the matrix presented in Figure 4 presents the correlation coefficients corresponding to the row and column numbers; the greater the correlation coefficient, the stronger the correlation. The lower-left triangle corresponds to the scatter plot between parameters. For example, the correlation coefficient between instantaneous vertical velocity (IVV) and PITCH is 0.88.
PITCH was found to be highly correlated with IVV, and it tended to be the most significant correlated factor, as the correlation coefficient is always large when pitch overrun occurs.

3.3.2. Geographically-weighted Correlation Coefficient

The geographically-weighted correlation coefficient (GWCC) [24,25,26] is an indicator used to explore the spatial heterogeneity of correlations between variables. The GWCC is calculated using the following formula:
ρ ( x , y ) ( u i , v i ) = C o v ( x , y ) ( u i , v i ) S D x ( u i , v i ) S D y ( u i , v i ) ,
where ( u i , v i ) is the spatial coordinate, and S D x ( u i , v i ) and C o v ( x , y ) ( u i , v i ) are the geographically-weighted standard deviation and covariance, respectively. C o v ( x , y ) ( u i , v i ) is calculated using the following equation:
C o v ( x i , y i ) = j = 1 n x i j { ( x j μ ( x i ) ) ( y j μ ( y i ) ) } j = 1 n w i j ,
where w i j is the weighting factor of observation point j at calculation point i and can be calculated using the kernel function. In Table 3, we present four common kernel functions.
In Equations (9–12), d i j is the distance between the location points i and j, and b is the bandwidth, which can be either fixed-type or adaptive-type. Fixed bandwidth takes a constant value as the distance threshold, while the adaptive bandwidth takes an integer N, and uses the distance value to the N-th nearest neighbor as the specific bandwidth value for each location-wise solution. In this work, the Gaussian kernel function and adaptive bandwidth were used to calculate the GWCC. Choosing the appropriate bandwidth is very important for GWCC calculation, as the size of the bandwidth will determine the spatial variation scale of the coefficient, which can be optimized using the cross-validation (CV) method.
The local correlations between UA events and meteorological and topographical factors were analyzed with GWCCs, which embody typical regional differences, especially for factors such as wind level and weather parameters.
Pearson’s correlation coefficient was firstly calculated by analyzing the correlation between the number of days corresponding to the wind level at each airport in January and the triggering frequency of UA during the same period, as shown in Table 4. The correlation coefficients reveal that the triggering frequency of the UA of the aircraft and the number of days of each wind level have a relatively positive correlation, especially for wind of levels 4–5.
The correlations between the number of days of bad weather conditions (rain, clouds, and snow) and the triggering frequency of corresponding UA events in January were also analyzed. The results are exhibited in Table 4, where a positive correlation was also found between the triggering frequency of UA events and bad weather. Observe that the strongest correlation appears for wind of levels 4–5, instead of levels 5–6 as anticipated empirically. We presume that a very bad weather condition (meaning strong winds of levels 5–6 or even higher) might lead to strict air traffic control or even cancellation. The correlation coefficient between UA triggering frequency and wind of levels 4–5 up to 0.69 is sufficient to demonstrate that windy weather plays a vital role in UA risks.
In addition, digital elevation model (DEM) data were used to analyze the correlation between the triggering frequency of UA and the elevations of the corresponding airports. As shown in Figure 5, Boeing aircraft were found to exhibit an insignificant anomalous negative correlation. This is mainly attributable to the performance of Boeing aircraft and the limitation of the oxygen supply, and the fact that a very small number of Boeing aircraft are employed to execute flights in high-altitude areas, like the western part of China. In this sense, this insignificant finding here does not necessarily mean that the correlation between UA events and elevation is irrelevant, but more detailed analysis should be done from a spatial perspective.
In general, the analysis of global correlation provides a macroscopic view of the relationships between the triggering frequency of UA events and meteorological and topographical factors. However, the analysis results are relatively singular and absolute, and therefore lack a guiding significance for the refined analysis of UA events.
It was found that the mean value of the GWCC is positively correlated with the wind level. This is in accordance with the empirical causes of UA events, and indicates that the local correlation coefficients that consider spatial heterogeneity characteristics can better reflect the correlation.
Figure 6 presents the estimates of the GWCCs between the triggering frequency of UA and wind levels 5–6. The triggering frequency of the UA of aircraft was found to be correlated to wind levels 5–6 in the Bohai coastal area. In the case of high winds, such conditions would demand an immediate go-around, and a pilot experienced in manual flying can effectively avoid UA events.
Figure 7 presents the distribution of the GWCCs between the trigger frequency of UA events and elevation. It was found that the trigger frequency of UA events that affect Airbus aircraft tended to be more correlated with the altitude elevation; the higher the altitude, the higher the trigger frequency of UA events, especially in the western part of China. This phenomenon is in accordance with previous inferences.
GWCC, as compared to the traditional global correlation coefficient, can reflect the correlations between factors and can be used to more precisely and objectively analyze the relationships between the objective factors of UA from a local perspective. However, only ESDA methods were utilized in the present work. Detailed phenomena and incentives, such as the use of geographically-weighted models, e.g., geographically-weighted regression [21,22], must be further studied and explored for the diversified analysis of relative factors.

4. Conclusions

In this study, a technical program for the detection of UA events was proposed via step-wise regression with pilot survey data, and its relative factors were quantitatively explored. Moreover, ESDA methods, namely a temporal heatmap and spatial distribution map, were utilized for spatio-temporal distribution analysis. The relationships between the triggering frequency of UA events and the relative meteorological and topographical factors were studied with both global and local correlation analysis methods. The results demonstrate that the spatio-temporal characteristics of UA events and relative factors including wind level, bad weather, and elevation reflect diverse correlations.
In addition, as compared with the traditional Pearson’s correlation coefficient, the GWCC can reflect the correlative relationships between UA events and relative factors from a local perspective. The results yielded by this study provide an important research basis and guidance for future quantitative causal analysis, as well as for the effective avoidance of such risks and the improvement of prediction accuracy.
Notably, this study makes a preliminary attempt at understanding the underlying factors of UA events, and much more work is needed in the future. For instance, the period of data collection is limited to January, which corresponds to weather conditions in winter time, but complex conditions may also appear in summer time. In this sense, long time series analysis should be conducted. Moreover, some other potential factors, such as pilot workload [27], level of automation (LOA) [28], and airmanship [29], could be also incorporated.

Author Contributions

Conceptualization, H.S. and B.L.; methodology, B.L.; software, J.X.; validation, Y.J., B.L. and J.X.; formal analysis, J.X.; investigation, B.L.; resources, H.S.; data curation, H.S.; writing—original draft preparation, H.S.; writing—review and editing, B.L.; visualization, J.X.; supervision, R.H.; project administration, R.H.; funding acquisition, R.H. All authors have read and agreed to the published version of the manuscript.

Funding

This work was supported by the National Natural Science Foundation of China under Grant No. U1833201.

Conflicts of Interest

The authors declare no conflict of interest.

References

  1. Federal Aviation Administration. Approaches and landings. In Airplane Flying Handbook; United States Department of Transportation, Federal Aviation Administration, Airman Testing Standards Branch: Oklahoma City, OK, USA, 2016; pp. 1–36. [Google Scholar]
  2. Flight Safety Foundation. Stabilized approach. In FSF ALAR Briefing Note; Flight Safety Foundation: Alexandria, VA, USA, 2000; pp. 134–140. [Google Scholar]
  3. Huo, Z.; Luo, F. Statistic analysis on accidents and incidents in the last decade in china civil aviation. Chin. Saf. Sci. J. 2006, 12, 65–71. [Google Scholar]
  4. Khatwa, R.; Helmreich, R.L. Killers in aviation: Fsf task force presents facts about appraoch-and-landing and controlled-flight-into-terrian accidents. Flight Safety Digest 1998, 17, 1–256. [Google Scholar]
  5. Wang, Z.; Sherry, L.; Shortle, J. Airspace risk management using surveillance track data: Stabilized approaches. In Proceedings of the 2015 Integrated Communication, Navigation and Surveillance Conference (ICNS), Herdon, VA, USA, 21–23 April 2015; p. W3-1. [Google Scholar]
  6. Abdulganiev, I.; Agafonov, A. In Automatic checking of road network models. CEUR Workshop Proc. 2016, 1638, 249–255. [Google Scholar] [CrossRef]
  7. Rao, A.; Puranik, T. Retrospective Analysis of Approach Stability in General Aviation Operations. In Proceedings of the 2018 Aviation Technology, Integration, and Operations Conference, Atlanta, GA, USA, 25–29 June 2018. [Google Scholar] [CrossRef]
  8. Yang, R.; Lv, R. Detection strategy of unstable approach based on possibility measure. In Proceedings of the 31st Chinese Control and Decision Conference (2019 CCDC), Nanchang, China, 3–5 June 2019; pp. 6259–6263. [Google Scholar]
  9. Li, L.; Hansman, R.J.; Palacios, R.; Welsch, R.E. Anomaly detection via a Gaussian Mixture Model for flight operation and safety monitoring. Transp. Res. Part C Emerg. Technol. 2016, 64, 45–57. [Google Scholar] [CrossRef]
  10. Campbell, A.; Zaal, P.; Schroeder, J.A.; Shah, S. Development of Possible Go-Around Criteria for Transport Aircraft. In Proceedings of the 2018 Aviation Technology, Integration, and Operations Conference, Atlanta, GA, USA, 25–29 June 2018. [Google Scholar]
  11. Li, J.-Q.; Zhang, H.-Y.; Zhang, Y.; Liu, H.-T. Systematic assessment of intrinsic factors influencing visual attention performances in air traffic control via clustering algorithm and statistical inference. PLoS ONE 2018, 13, e0205334. [Google Scholar] [CrossRef] [PubMed]
  12. Payan, A.P.; Lin, P.-N.; Johnson, C.; Mavris, D.N. Helicopter Approach Stability Analysis Using Flight Data Records. In Proceedings of the 17th AIAA Aviation Technology, Integration, and Operations Conference, Denver, CO, USA, 5–9 June 2017. [Google Scholar]
  13. Qian, S.; Zhou, S.; Chang, W. An improved aircraft hard landing prediction model based on panel data clustering. In Proceedings of the 29th Chinese Control And Decision Conference (CCDC), Chongqing, China, 28–30 May 2017; pp. 438–443. [Google Scholar]
  14. Hanifa, A.; Akbar, S. Detection of unstable approaches in flight track with recurrent neural network. In Proceedings of the International Conference on Information and Communications Technology 2018 (ICOIACT 2018), Yogyakarta, Indonesia, 6–7 March 2018; pp. 735–740. [Google Scholar]
  15. Wang, Z.; Sherry, L.; Shortle, J. Feasibility of using historical flight track data to nowcast unstable approaches. In Proceedings of the 2016 Integrated Communications Navigation and Surveillance (ICNS), Herndon, VA, USA, 19–21 April 2016; p. 4C1-1. [Google Scholar] [CrossRef]
  16. Tang, X.; Chen, P.; Zhang, Y. 4D trajectory estimation based on nominal flight profile extraction and airway meteorological forecast revision. Aerosp. Sci. Technol. 2015, 45, 387–397. [Google Scholar] [CrossRef]
  17. Wu, C.; Sun, H.; Jiao, Y.; Xie, J.; Lu, B. In Detecting and analyzing flight unstable approaches with qar big data. In Proceedings of the 2018 26th International Conference on Geoinformatics, Kunming, China, 28–30 June 2018; pp. 1–6. [Google Scholar] [CrossRef]
  18. Moriarty, D.; Jarvis, S. A systems perspective on the unstable approach in commercial aviation. Reliab. Eng. Syst. Saf. 2014, 131, 197–202. [Google Scholar] [CrossRef]
  19. Huang, R.; Sun, H.; Wu, C.; Wang, C.; Lu, B. Estimating Eddy Dissipation Rate with QAR Flight Big Data. Appl. Sci. 2019, 9, 5192. [Google Scholar] [CrossRef] [Green Version]
  20. Wu, M.; Sun, H.; Wang, C.; Lu, B. In Detecting and analysing spatial-temporal aggregation of flight turbulence with the qar big data. In Proceedings of the 2018 26th International Conference on Geoinformatics, Kunming, China, 28–30 June 2018; pp. 1–6. [Google Scholar] [CrossRef]
  21. Wang, L.; Ren, Y.; Wu, C. Effects of flare operation on landing safety: A study based on ANOVA of real flight data. Saf. Sci. 2018, 102, 14–25. [Google Scholar] [CrossRef]
  22. Erba, S.D. Exploratory Spatial Data Analysis. In International Encyclopedia of Human Geography; Elsevier: Amsterdam, The Netherlands, 2009; pp. 683–690. [Google Scholar]
  23. Scialfa, C.T.; Games, P.A. Problems With Step-Wise Regression in Research on Aging and Recommended Alternatives. J. Gerontol. 1987, 42, 579–583. [Google Scholar] [CrossRef] [PubMed]
  24. Brunsdon, C.; Fotheringham, A.; Charlton, M. Geographically weighted summary statistics—A framework for localised exploratory data analysis. Comput. Environ. Urban Syst. 2002, 26, 501–524. [Google Scholar] [CrossRef] [Green Version]
  25. Gollini, I.; Lu, B.; Charlton, M.; Brunsdon, C.; Harris, P. Gwmodel: An r package for exploring spatial heterogeneity using geographically weighted models. arXiv 2014, arXiv:1306.0413. [Google Scholar] [CrossRef] [Green Version]
  26. Lu, B.; Harris, P.; Charlton, M.; Brunsdon, C. The GWmodel R package: Further topics for exploring spatial heterogeneity using geographically weighted models. Geo-spatial Inf. Sci. 2014, 17, 85–101. [Google Scholar] [CrossRef]
  27. Lee, Y.-H.; Liu, B.-S. Inflight workload assessment: Comparison of subjective and physiological measurements. Aviat. Space, Environ. Med. 2003, 74, 1078–1084. [Google Scholar]
  28. Endsley, M.R. Level of Automation: Integrating Humans and Automated Systems. Proc. Hum. Factors Ergon. Soc. Annu. Meet. 1997, 41, 200–204. [Google Scholar] [CrossRef]
  29. Haavik, T.; Kongsvik, T.; Bye, R.J.; Røyrvik, J.; Almklov, P.G. Johnny was here: From airmanship to airlineship. Appl. Ergon. 2017, 59, 191–202. [Google Scholar] [CrossRef] [PubMed]
Figure 1. Temporal heatmap of unstable approach (UA) events.
Applsci 10 04934 g001
Figure 2. Spatial pattern analysis of UA frequencies.
Applsci 10 04934 g002
Figure 3. Different causes of UA events for different airports.
Applsci 10 04934 g003
Figure 4. Schematic representation of factor correlation. “***” means the corresponding correlation coefficient is significant at a level close to 0.
Applsci 10 04934 g004
Figure 5. Correlation between UA triggering frequency (Boeing aircraft) and elevation.
Applsci 10 04934 g005
Figure 6. Geographically-weighted correlation coefficients (GWCCs) between UA triggering frequency and wind levels 5–6.
Applsci 10 04934 g006
Figure 7. GWCCs between UA triggering frequency and elevation.
Applsci 10 04934 g007
Table 1. Interpretations of flight parameters in the quick access recorder (QAR) data.
Flight IndicatorInterpretation
ROLLGradient angle of flight
PITCHPitch angle of flight
HEADNGHeading angle of flight
IVVInstantaneous vertical velocity
VRTGVertical acceleration
VREFReference speed
IASIndicated airspeed
FLAPAngle of left and right flap
LGDLeft and right main gear AIR/GND
Table 2. Detection program triggering logic.
Flight ParameterUA Triggering Logic
Gradient|ROLL| > 20
Pitch anglePITCH > 10 or < −5
Alignment of track and runway direction|HEADNG−CRSSEL| > 15;
|HEADNG−alignment| > 15
Descent rateIVV > 2000, last time ≥ 2 s
Flight speedVREF−IAS > 20
Landing patternFLAP < 28 or LGD = “UP”
Table 3. Kernel function equations.
Function NameFunction
Box car w i j = 1   if   d i j < r , w i j = 0   otherwise (9)
Bi-square w i j = ( 1 ( d i j r ) 2 ) 2   if   d i j < r , w i j = 0   otherwise (10)
Gaussian w i j = exp ( d i j 2 2 b 2 ) (11)
Exponential w i j = exp ( d i j b ) (12)
Table 4. Correlation coefficients between UA triggering frequency and wind levels.
Wind LevelCorrelation Coefficient
Breeze0.35
Levels 1–20.5
Levels 3–40.48
Levels 4–50.69
Levels 5–60.38

