Article

Rapid and Positive Effect of Bicarbonate Addition on Growth and Photosynthetic Efficiency of the Green Microalgae Chlorella Sorokiniana (Chlorophyta, Trebouxiophyceae)

Dipartimento di Biologia, Università di Napoli Federico II, Via Cinthia 21, 80126 Napoli, Italy
*
Author to whom correspondence should be addressed.
Both authors contributed equally to this work.
Appl. Sci. 2020, 10(13), 4515; https://doi.org/10.3390/app10134515
Submission received: 26 May 2020 / Revised: 26 June 2020 / Accepted: 27 June 2020 / Published: 29 June 2020
(This article belongs to the Special Issue New Challenges in the Biodiversity and Ecosystem of Phytoplankton)

Abstract

:
Bicarbonate ions are the primary source of inorganic carbon for autotrophic organisms living in aquatic environments. In the present study, we evaluated the short-term (hours) effects of sodium bicarbonate (NaHCO3) addition on the growth and photosynthetic efficiency of the green algae Chlorella sorokiniana (211/8k). Bicarbonate was added to nonaxenic cultures at concentrations of 1, 2, and 3 g L−1 leading to a significant increase in biomass especially at the highest salt concentration (3 g L−1) and also showing a bactericidal and bacteriostatic effect that helped to keep a reduced microbial load in the algal culture. Furthermore, bicarbonate stimulated the increase in cellular content of chlorophyll a, improving the photosynthetic performance of cells. Since microalgae of genus Chlorella spp. show great industrial potential for the production of biofuels, nutraceuticals, cosmetics, health, and dietary supplements and the use of bicarbonate as a source of inorganic carbon led to short-term responses in Chlorella sorokiniana, this method represents a valid alternative not only to the insufflation of carbon dioxide for the intensive cultures but also for the production of potentially bioactive compounds in a short period.

1. Introduction

Research studies on microalgae have increased in the last decades due to the wide range of applications associated with these photosynthetic microorganisms that can be utilized as sources of biofuels, pharmaceuticals, cosmetics, health, and dietary supplements [1,2,3,4,5,6]. Microalgal photosynthesis is similar to that of higher plants, although characterized by a higher yield compared to terrestrial crops as it is more efficient in converting solar into chemical energy [7]. Due to their high growth rate, these organisms can be easily cultured in closed bioreactor systems reaching high biomass yields [4,8]. Since the microalgae cultivation does not compete with that of terrestrial plants thanks to different resources use, the cultivation and exploitation of microalgae biomass represent an excellent opportunity for the development of alternative compounds for different bio-applications. The biological carbon pump is a major component of the global carbon cycle, which regulates atmospheric CO2 levels and transfers both organic and inorganic carbon fixed by primary producers in terrestrial and aquatic ecosystems [9].
While terrestrial photosynthetic organisms utilize the atmospheric carbon dioxide (CO2) as a source of inorganic carbon (Ci) into Calvin-Benson cycle directly [10], aquatic photosynthetic organisms are adapted to use bicarbonate ions as an inorganic carbon source [10,11,12] since the carbonate/bicarbonate system converts CO2 into carbonate (CO32−) and bicarbonate (HCO3) ions. For this reason, the total inorganic carbon or dissolved inorganic carbon (DIC) in the aquatic environment is considered as the sum of inorganic carbon species in a solution, and it varies from less than 20 μM, in acidic soft waters, to more than 5 Μ, in highly alkaline hard waters [13].
Both freshwater and marine microalgae are able to absorb HCO3 from the external environment into the cell through active membrane pumps [14]. The bicarbonate transferred into the cytosol is then converted by carbonic anhydrase enzyme (EC: 4.2.1.1) in CO2 usable in chloroplasts by Rubisco (EC: 2.1.1.127) for the Calvin–Benson cycle to produce 3-phosphoglycerate [15,16]. Microalgae have developed a carbon concentrating mechanism (CCM) which pumps extracellular bicarbonate ions into cells and raises the intracellular levels of CO2, promoting the carboxylation reaction and suppressing the oxygenase reaction of Rubisco, as well as the photorespiration [16,17,18]. Zaho et al. [19] demonstrated that HCO3 is also an important constituent of the water-oxidizing complex of photosystem II (PSII), by binding other components of PS II and influencing the molecular processes associated with the electron acceptor and electron donor sides of PS II.
Generally, insufflating pure CO2 in microalgae cultivation is a system used to obtain a high level of biomass, although this process could be expensive [20] and inefficient due to the loss of CO2 in the atmosphere [21]. For this reason, the use of sodium bicarbonate (NaHCO3) as algal feedstock may be a cheaper and more sustainable alternative, considering its better solubility in aqueous solution than CO2 (9.21% (w/w) at 25 °C) [22,23]. In the last years, several studies demonstrated that bicarbonate has a positive outcome on growth and metabolite accumulation as lipids, starch, and pigments in numerous microalgae [15,22,23,24,25,26,27,28,29].
Chlorella spp. (Chlorophyta, Trebouxiophyceae) is a genus of green microalgae without flagella that shows spherical shape (ø ~2 to 10 μm). Chlorella spp. has few and small vacuoles in the cytoplasm and a single and huge chloroplast in the shape of a cup with a starch granule. The chloroplast contains the green photosynthetic pigments chlorophyll-a and -b, β-carotene, and xanthophyll. Through photosynthesis, Chlorella multiplies rapidly, requiring only carbon dioxide, water, sunlight, and a small amount of minerals to reproduce.
Chlorella spp. (Chlorophyta, Trebouxiophyceae) are one of the most widely used microalgae in the industrial sector, with an annual production of about 2000 t [1]. In the last decade, microalgae belonging to genus Chlorella have caught scientific attention for their ability to synthesize important nutritional compounds, such as essential amino acids, polyunsaturated fatty acids, carotene, and vitamins [30,31,32]. Microalgae have been consumed in the human diet for thousands of years, and Chlorella spp. represents one of the few species utilized as an effective supplementary food [30,33]. Several species of Chlorella have been extensively used commercially over the past 40 years as a food and feed supplement and nutraceuticals [33,34]. The interest in these species is due to their high productivity, high lipid content, and resistance to the high light conditions typical of photobioreactors [34,35].
Recently, several studies on Chlorella spp. focused on the impact of CO2-gas, rather than bicarbonate, on growth and metabolites of these species [15,21,33,35,36,37]. Nevertheless, to date, no research has deepened the short-term (hours) physiologic and metabolic effects of bicarbonate addition on this genus. The main object of this study is to evaluate the immediate effects of bicarbonate additions on both growth and photosynthetic efficiency of the green microalga Chlorella sorokiniana (211/8k) cultivated in a nonaxenic culture under different bicarbonate concentrations.

2. Materials and Methods

2.1. Algal Strains and Growth Conditions

Chlorella sorokiniana Shihira and Krauss, strain 211/8k (CCAP of Cambridge University) was grown in a batch cultured at 32 ± 2.5 °C, under continuously light (LED in red and blue spectra, 200 µmol photons m−2 s−1) with no CO2 insufflation except that normally present in the flushed air. The basal medium (pH 6.5) reported by Salbitani and colleagues [38] had the following composition: 13 mM KH2PO4, 4.3 mM K2HPO4, 0.35 mM NaCl, 1.2 mM MgSO4, 0.35 μM Fe-EDTA, 0.18 mM CaCl2, 5 mM KNO3, oligo-elements (0.31 μM Cu, 0.1 μM Mo, 9.1 μM Mn, 0.76 μM Zn, 46 μM B). Cultures of C. sorokiniana were grown at different concentrations of NaHCO3 (0, 1, 2, 3 g L−1), added in a single administration at T0, when cultures were into the lag phase (~2.5 × 10⁶ cell mL−1). All treatments were monitored daily, and the growth was evaluated spectrophotometrically by measuring optical density (OD) at 800 nm. The cell number and average cell diameter (cellular size) were determined by a Countess II FL Automated Cell Counter (Thermo Fisher Scientific ).
The growth rate was calculated using the following formula: μ = 1/t (lnN2 lnN1), where t is the time (days) of observation, N2 is the cell concentration (cell mL−1) at the beginning of the experiment period (0 h), and N1 is the cell concentration at the end of the experiment period (72 h). The doubling time or time required to achieve a doubling of the number of viable cells was calculated according to the following equation: µ = ln 2/td, where: µ is the growth rate, td is the doubling time.

2.2. Pigment Contents

To evaluate the effects of bicarbonate additions on chlorophyll a (Chl-a) and phaeopigments (Phaeo) concentration at different treatments, 2 mL of culture were filtered through Whatman GF/F filters (25 mm diameter) and spectrofluorometric analyses were made within a maximum of 12 h after collection using a Shimadzu spectrofluorometer [39]. The instrument was calibrated and checked with a solution of Chl-a extracted from spinach (Sigma). In addition, to contribute to the definition of the pigments’ composition of different treatments, in terms of ratios pigment:Chl-a, an HPLC analysis has been performed at time 0 and at the end of the experiment (Supplementary Materials, Table S2). To this aim, 10 mL of culture were filtered onto Whatman GF/F filters (47 mm diameter) and stored at −80 °C until the HPLC analysis was performed [40]. Pigments’ separations were made on an Agilent 1100 HPLC according to the method outlined in Vidussi et al. [41], as modified by Brunet and Mangoni [42]. The system was equipped with an HP 1050 photodiode array detector.

2.3. Photosynthetic Efficiency

The maximum PSII photochemical efficiency (Fv/Fm) and the maximum PSII effective absorption cross-section (σPSII), which describes the functional ‘target area’ of the light-harvesting antenna that is energetically coupled to the O2-evolving reaction centers (RCIIs) (σPSII) [43,44], have been determined using a Phyto_PAM II compact unit (Walz) [45]. All samples were acclimated in the dark for 30 min before the analysis to minimize the nonphotochemical dissipation of excitation, and measurements were blank corrected using the culture media without cells [46]. As regards Fv/Fm, samples were illuminated with a saturating pulse, according to Maxwell and Jonson [47], and values derived from the formula Fv/Fm = (Fm − F0)/Fm. For the determination of σPSII at 440 nm, we used the fast kinetics windows (Phyto Win_3 software) for the analysis of the wavelength-dependent O-I1 fluorescence rise kinetics upon onset of pulses of strong actinic light. All samples were far-red pre-illuminated before the analysis to inhibit the PS I response [48].

2.4. Evaluation of Microbial Load Reduction

Aliquots from control and sodium bicarbonate (NaHCO3 3g L−1) added cultures were collected and underwent microbiological analysis to determine the total bacterial load. The microbial load was evaluated employing the spread plating method on agarized growth medium. In aseptic conditions, aliquots of 100 µL were collected at 3 different times: 0, 3, and 48 h. Specimens were transferred in 90 mm Petri dishes containing Plate Count Agar (Plate Count Agar-Thermo Scientific) using a sterile spatula. Samples were serially diluted, and serial decimal dilutions were spread-plated on Plate Count Agar dishes (UNI EN ISO 7218:2013, [49]). Plates were incubated in aerobic conditions at 30 ± 2.5 °C for 72 h. Analyses were performed in triplicate. Results were expressed by reporting colony-forming units mL−1 (CFU mL−1) grown in each sample, considering the performed dilutions [50].

2.5. Statistical Analysis

The statistical analysis was performed by one-way analysis of variance (ANOVA) with a Tukey post-hoc test to determine differences between experimental cultures. To define in detail the relationship among all considered variables over the entire duration of the experiment, we performed a multivariate analysis (principal component analysis (PCA) and Biplot graph) using XLSTAT 2019 software. Data for the mean ± standard deviation of 3–5 independent experiments are presented.

3. Results

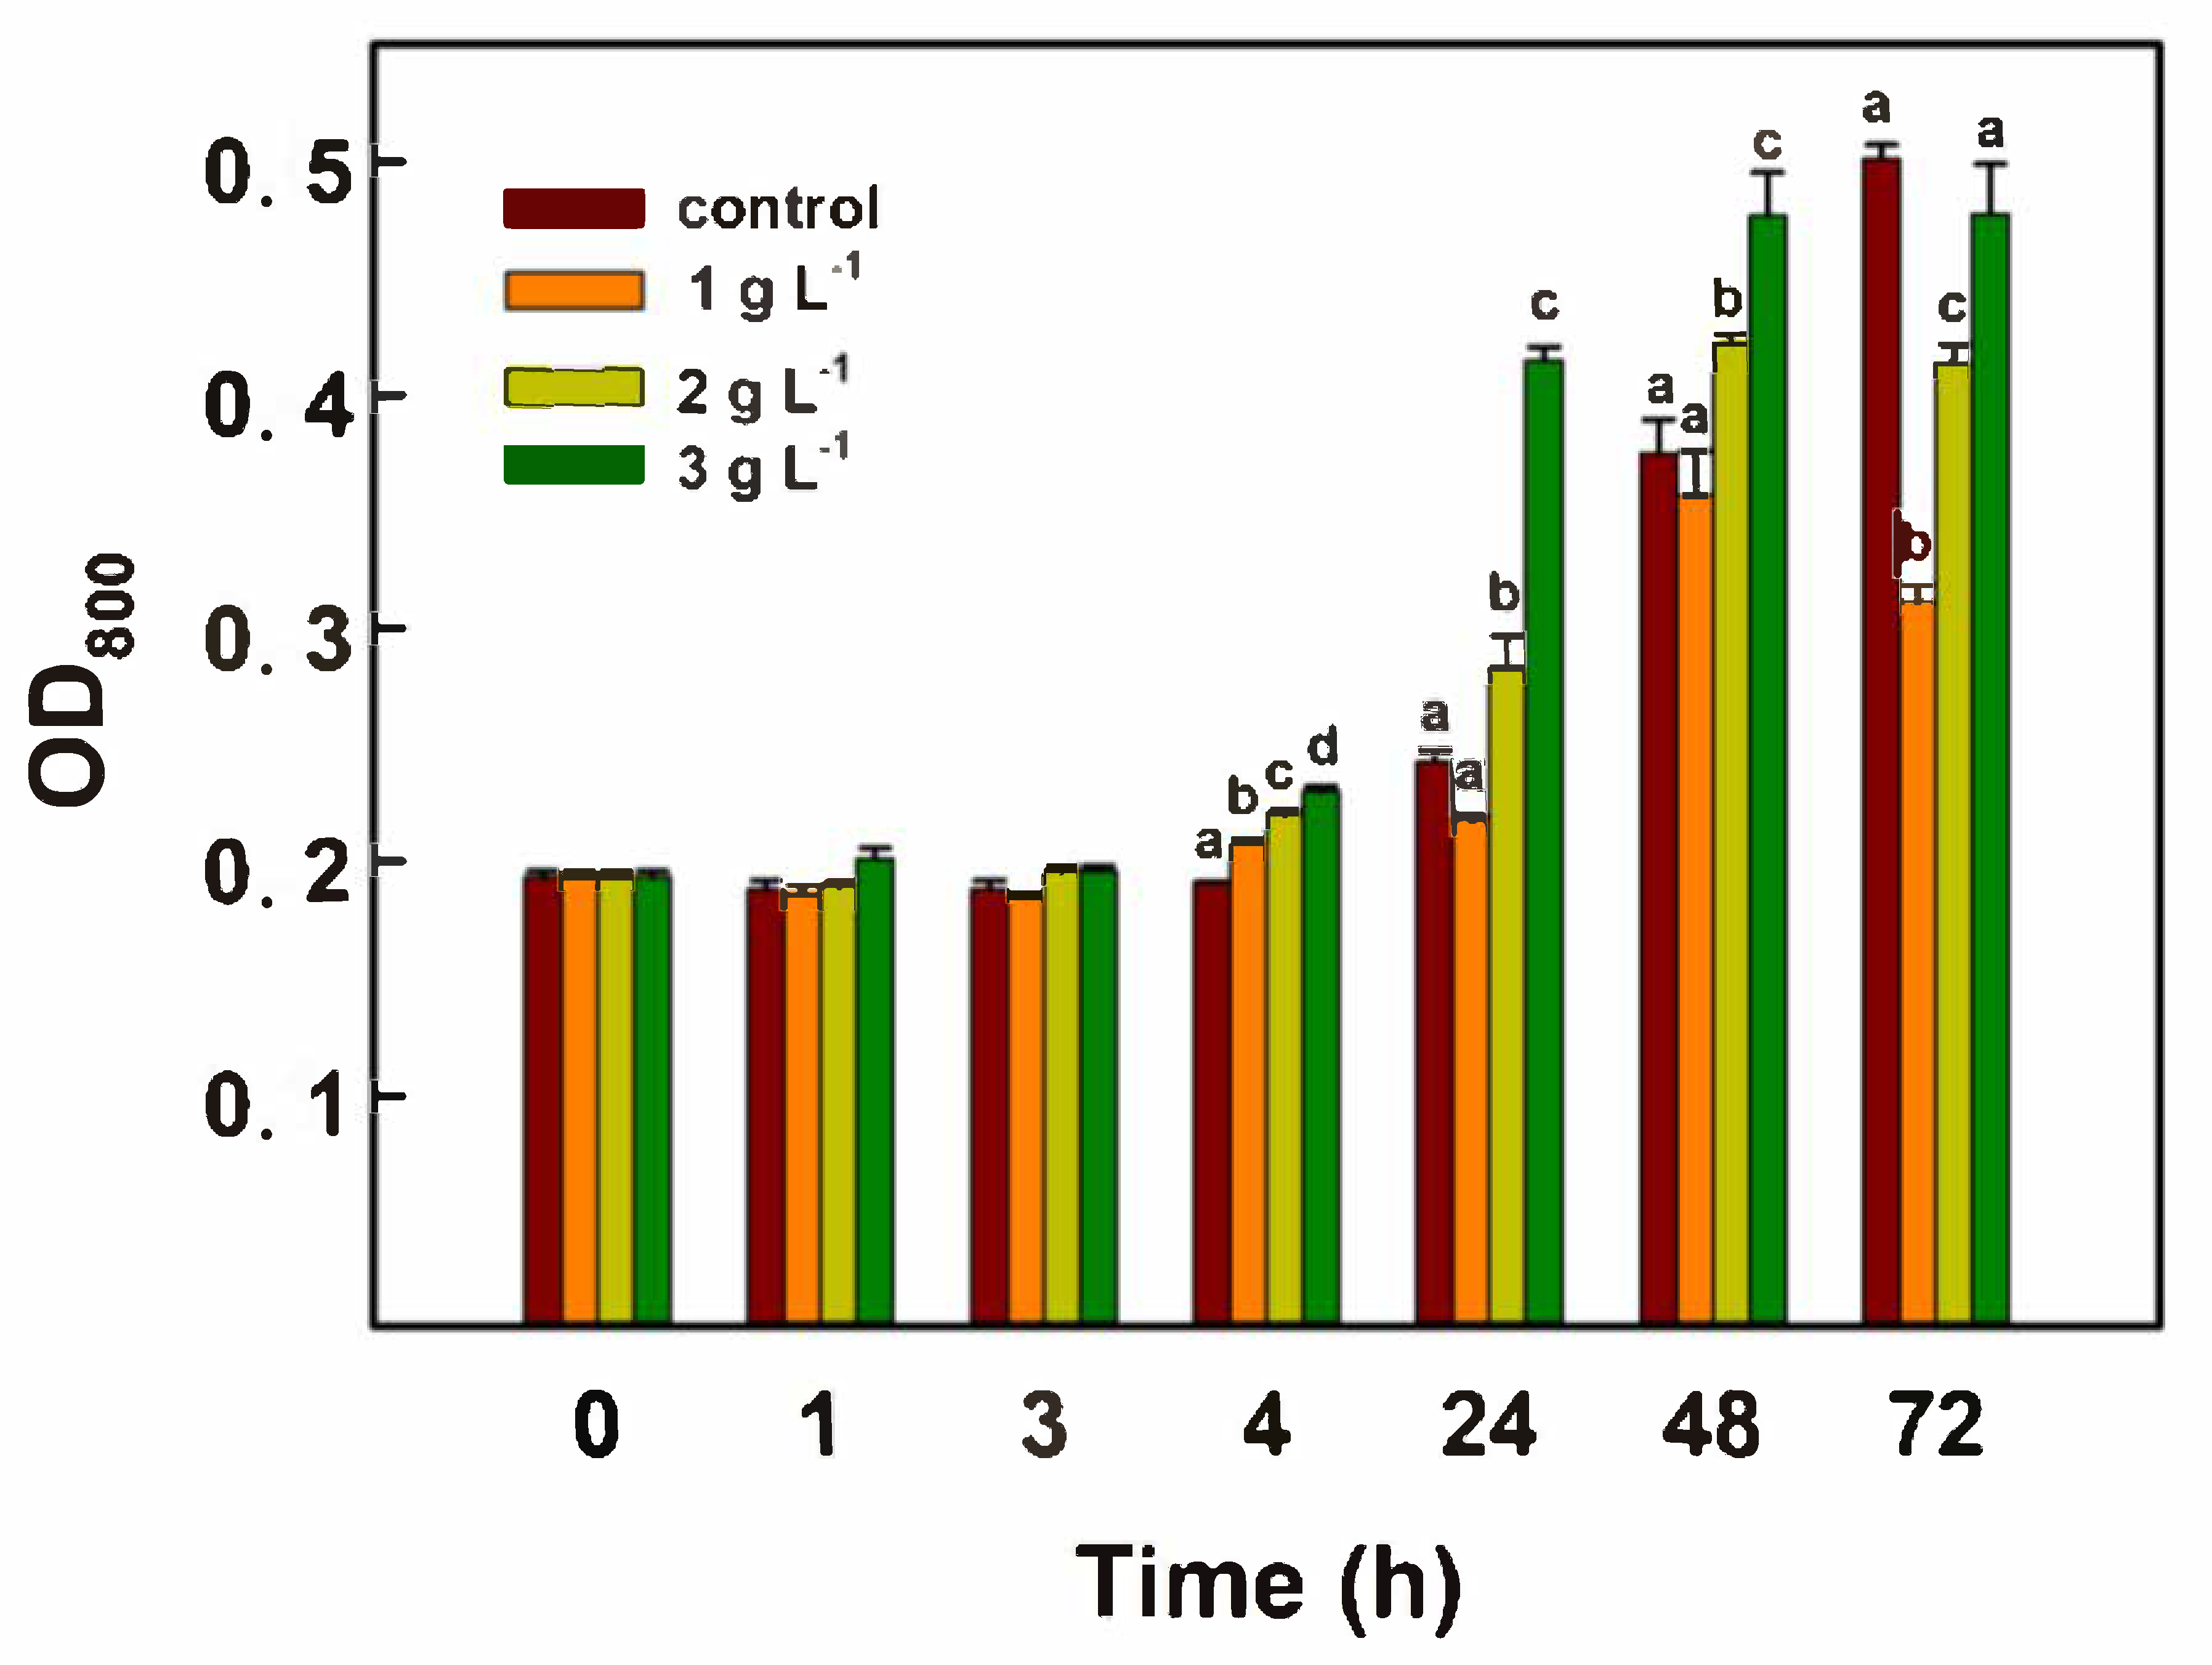
3.1. Impact of Sodium Bicarbonate Supplementation on Chlorella Growth

The growth of Chlorella sorokiniana was monitored for 72 h as changes in optical density (OD800), cell number, and cellular size. The addition of sodium bicarbonate (NaHCO3) as 1, 2, and 3 g L−1, occurred in a single administration at T0 (lag phase). At T0 the number of cells for each culture treatment was about 2.5 × 10⁶ cell mL−1 so that the administration of a different amount of NaHCO3 (1, 2, and 3 g L−1) corresponded to 0.4, 0.8, 1.2 ng NaHCO3 cell−1, respectively.
Based on the optical density (Figure 1), during the first three hours, no significant change was observed among experimental conditions. After 24 h, the treatment NaHCO3 3 g L−1 showed the highest growth. After 48 h, treatments 2 and 3 NaHCO3 g L−1 showed a significant increase in biomass compared to the control. However, at 72 h, both 1 and 2 g L−1 treatments displayed even a significantly lower OD as the control, while 3 g L−1 treatment showed a value similar to that of control cells.
In terms of the number of cells (Figure 2), no significant differences emerged in the first 4 h. After 24 h, the control showed the highest number of cells with a strong difference with other treatments, among which NaHCO3 3 g L−1 displayed higher values. After 48 h, the control was still characterized by the highest number of cells, but NaHCO3 3 g L−1 showed a net increase with a value similar to that of the control. Treatments 1 and 2 g L−1 presented a lower number of cells, with 1 g L−1 being the lowest. At the end of the experiment, the treatment with the highest number of cells was 3 g L−1 that exceeded the control. As regards 1 g L−1 and 2 g L−1, both displayed the same pattern observed at 48 h, with 2 g L−1 characterized by a higher number of cells. The difference in the average cells’ size is shown in Figure 3. Already after 1 h from NaHCO3 addition, the size of cells supplemented with 3 g L−1 appeared larger (3.0 ± 0.03 µm) with respect to control (2.4 ± 0.3 µm) and to the other conditions. Until 24 h, the cells added with NaHCO3 3 g L−1 showed a larger diameter than the cells of the other conditions. From 48 to 72 h, the cells of the other two experimental conditions (NaHCO3 1 and 2 g L−1) also increased their diameter compared to the control (Figure 3). In Table S1, the data concerning the variations of growth rate and doubling time in the control cells and in the experimental cultures are shown.

3.2. Impact of Sodium Bicarbonate Supplementation on Pigments

The chlorophyll a (Chl-a) content per cell was determined during 72 h of the experiment in each treatment (Figure 4). While the control did not show any increase in Chl-a for the overall duration of the experiment, the amount of Chl-a in other treatments increased up to 50%–65% after 1 h later from the NaHCO3 administration, remaining high until 4 h. After 24 h, the Chl-a content was different among the treatments. NaHCO3 2 g L−1 and NaHCO3 3 g L−1 showed the highest values of Chl-a, almost two times more than NaHCO3 1 g L−1. At 72 h, in the culture enriched with NaHCO3 3 g L−1, Chl-a content reached 10.7 ± 0.3 pg cell−1, followed by NaHCO3 2 g L−1 (9.3 ± 0.3 pg cell−1), and 1g L−1 (3.7 ± 0.3 pg cell−1). The Phaeo/Chl-a ratio (Table 1), calculated as a proxy of active chlorophyll [51,52], remained constant (~1) in the control treatment for the entire duration of the experiment (72 h). In bicarbonate treatments, the ratio Phaeo/Chl-a slightly increased after 3 h, then values tended to decrease, showing a weak difference between the control and NaHCO3 (2 and 3 g L−1) supplemented after 72 h. Further details on the effect of bicarbonate addition on the concentration of other photosynthetic pigments have been reported in the Supplementary Materials (Table S2) as pigment:Chl-a ratios. Although additional analyses are required, these preliminary data seem to suggest that the lutein:Chl-a ratio slightly increased in bicarbonate treated cells, particularly those supplemented with 3 g L−1. A typical chromatogram of photosynthetic pigments extracted in Chlorella sorokiniana cells is shown in the Supplemental Material (Figure S1).

3.3. Impact of Sodium Bicarbonate Supplementation on Pigments Photosystem II Efficiency

The maximum quantum yield [Fv/Fm = (Fm − F0)/Fm] increased over 24 h for all treatments (Figure 5). In the first 4 h, Fv/Fm changed from 0.2 to 0.32 ± 0.027 in 1 g L−1, to 0.36 ± 0.024 in 2 g L−1 and to 0.37 ± 0.024 in 3 g L−1 supplemented, while the control slightly increased up to 0.24 ± 0.014 (Figure 5). After 24 h, algal cells supplemented with bicarbonate reached their maximum Fv/Fm values but later, while NaHCO3 3 g L−1 remained high until the end of the experiments, NaHCO3 1 g L−1 and 2 g L−1 both decreased to the values of about 0.32. Control cells, instead, showed lower Fv/Fm for the entire period, reaching a relative maximum of 0.28 ± 0.012 after 72 h. The maximum PSII effective absorption cross-section (σPSII) of the control cells differed significantly from bicarbonate treatments after 72 h (Figure 6). While in the first 2 h, σPSII of NaHCO3 1, 2, 3 g L−1 supplemented cells were similar to that observed in the control, after 4 h NaHCO3 2 and 3 g L−1 supplemented cells showed a sensible decrease to 4.88 ± 0.06 and 3.57 ± 0.05, respectively. After 24 h, bicarbonate treated cells displayed a visible and significant difference in σPSII compared to the control (6.57 ± 0.11).

3.4. Evaluation of Microbial Load Reduction

Data concerning the evaluation of microbial load in the control and 3 g L−1 bicarbonate added cultures are reported in Figure 7. Starting from an initial concentration of ~ 3.0 × 10⁶ UFC/mL microbial load, samples containing NaHCO3 presented a reduced microorganisms concentration compared to control cultures after 3 h, showing 1 log decrease from 3.0 × 10⁶ CFU mL−1, to 3.02 × 10⁵ CFU mL−1. After 48 h, a 34.21% microbial load increase was observed in control, while an 11.62% growth was evidenced in NaHCO3 samples.

3.5. Statistical Analysis

The results obtained using a PCA explained 78.19% of the total variance, with the F1 axis accounting for 53.10% and the F2 axis for 25.09% of the total variance (Figure 8). All variables were positively correlated with the positive F1 axis except the ratio Phaeo/Chl-a and, to a lesser extent, σPSII that was negatively correlated with F1. Cell mL−1, time, and OD variables were positioned in the first quadrant, while Chl-a, cell size, Fv/Fm, and Treatment showed a negative correlation with F2 axis, being positioned in the second quadrant. The Phaeo/Chl-a ratio was instead positioned in the third quadrant, almost overlapping the negative F2 axis, while σPSII was positioned in the fourth quadrant with a higher correlation with the positive F2 axis. To investigate the influence of bicarbonate addition on the considered variables, we performed a PCA, coloring the observation by treatment, with ellipses of confidence of 95%. The light blue point and line represent the 1 g L−1 treatment; the yellow color represents 2 g L−1 treatment, the purple 3 g L−1 treatment, and the dark blue the control one. The biplot graph shows clear differences between the control and all bicarbonate treatments, with ellipses highlighting the effect of bicarbonate addition already at low concentrations and control treatment, clearly different from others. Moreover, the amplitude of the ellipses increased with bicarbonate addition.

4. Discussion

Despite the wide range of applications, microalgal production is not economically viable yet. Several research pathways have been explored to improve the economics of the process [53]. Among these, recent studies on the effects of bicarbonate in microalgae cultivation aimed to improve biomass production or content of functional molecules [23,26,28,29]. The bicarbonate salt, as an extra source of inorganic carbon for microalgal cultures, has been proposed due to the possibility of being produced by hydration of CO2 present in polluting fumes, reducing CO2 emissions into the atmosphere, besides economic advantages [27,54,55,56].
According to our data, after 24 h, cultures supplemented with bicarbonate showed a clear increase in the optical density compared to the control. However, the OD increase was not accompanied by an increase in the number of cells. Interestingly, an increase in the cells’ diameter in bicarbonate treated cells, even 50–60% higher after 48 h, was observed. This increase in cell diameter size probably could be related to starch or lipid accumulation as cellular carbon storage. In fact, in microalgae, Ci availability represents an important metabolic regulator that controls the carbohydrate and lipid synthesis [25]. According to some studies, lipid accumulation and a larger cellular diameter correlate with a decreased growth [35,58]. In fact, in some microalgae, bicarbonate addition induced a change in metabolism, shifting the cell from a growth state to a carbon-containing-product formation [24]. Cellular replication considerably stopped at the time of bicarbonate addition in Chlorella vulgaris [36].
According to Peng and colleagues [57], appropriate concentrations of NaHCO3 caused the decline of protozoa in cultures, perhaps due to the water efflux affected by rose osmotic pressure. In this study, we focused attention on the short-term physiological and metabolic alterations occurring in algal cells after bicarbonate addition in Chlorella sorokiniana cells.
However, the addition of bicarbonate has not always brought positive effects in microalgae cultures, especially in freshwater species [54]. In fact, adding bicarbonate leads to Na+ ions rise in the growth medium, and although marine species tolerate them, most freshwater ones do not [54,59]. In Chlorella vulgaris, a supply of a high concentration of bicarbonate (160 mM) inhibited cell growth leading to the formation of numerous colonial cells [35]. Furthermore, according to de Farias Silva et al. [22], in Synechococcus sp., an excess of NaHCO3 caused salt stress, ROS (reactive oxygen species) production, and a decrease in photosynthetic efficiency caused by damage to PSII complex. Our data, however, did not indicate any damage to Chlorella sorokiniana cells treated with bicarbonate, suggesting that the concentrations we used were under the threshold of tolerability.
In Chlorella sorokiniana, the addition of bicarbonate led to an increase in Chl-a for the entire duration of the experiment, with the highest values in cells supplemented with NaHCO3 3 g L−1. The increase in Chl-a contents per cell in the experimental cultures may be due to the greater availability of inorganic carbon in the growth medium that supports synthesizing the pigment. Since chlorophyll contents represent a valid indicator of the physiological status in microalgae [26,37], the high levels found in bicarbonate treatments are a signal of good cell health. Moreover, the lower Phaeo:Chl-a ratio in the NaHCO3 3 g L−1 treatment between 24 and 72 h indicates a greater presence of active chlorophyll compared to the control. Since in plant cells, the amount of phaeopigments usually increases with abiotic stress (pH, temperature, etc.) or with increasing age [60,61,62], we can deduce that the addition of bicarbonate at the used concentrations did not prejudice the photosynthetic performance of the algal cells. The capability of active fluorescence for rapidly assessing the photosynthetic physiology of phytoplankton live species has been well demonstrated by many studies [63,64,65]. Conceptually, the fluorescence measurements of the active chlorophyll a evaluate the efficiency by which absorbed light is utilized by photosynthesis [66]. In this study, the maximum photosynthetic efficiency of photosystem II (Fv/Fm) for different treatments was measured over time for the entire duration of the experiments. Interestingly, cells supplemented with NaHCO3 3 g L−1 showed a progressively significant increase in Fv/Fm values, up to 95% higher than the control at 72 h, indicating a strong photosynthetic performance. The increase in Fv/Fm could indicate an increase in photosynthetic carbon fixation level and metabolic activity. In PSII, the quanta of excitation light are absorbed and transferred to reaction centers, and the whole efficiency of light trapping and energy transfer is explained by the functional absorption cross-section (σPSII). In general, thylakoids of photosystems are dynamic membranes that are subjected to reorganization for the number and size of the stacks, volume of the lumen, and place of the complexes [67], based on the growing conditions or metabolic status in which the organism is located. The σPSII, values observed in this study, showed a sensible decrease in treatments enriched with bicarbonate. σPSII for NaHCO3 3 g L−1 was, in fact, ~20% lower than the control at 72 h, with maximum differences observed between these two cases at 4 h, when σPSII NaHCO3 3 g L−1 was ~40% lower than the control. These results suggest that the increased photosynthetic efficiency in bicarbonate-enriched cells was accompanied by a reduction in σPSII area. Probably, the reduction in the surface of the photosystem II directly depended on the excellent photosynthetic performance that the cells from bicarbonate enriched cultures showed. The overall data emerging from this study demonstrate that in Chlorella sorokiniana, the supplementation of bicarbonate, whose accurate concentration must be considered taking into account the cell density of the culture, led to a significant immediate improvement in the cultures. These benefic and rapid dose-dependent effects on the growth, photosynthetic efficiency, and pigment contents, together with a bactericidal and bacteriostatic effect of sodium bicarbonate addition to the culture medium, indicate this salt as an excellent substitute for gaseous CO2.

5. Conclusions

The use of sodium bicarbonate as a Ci source, in concentrations up to 3 g L−1, clearly affects both growth and photosynthetic efficiency in Chlorella sorokiniana 24 h after its addition. Bicarbonate administration leads to an increase in cellular size, probably related to starch or lipid accumulation, improving the photosynthetic efficiency in a linear way with the increase in the amount of bicarbonate added to the culture.
This trend was also observed in the amount of pigment per cell. Another aspect that should be taken into account is that bicarbonate addition inhibits bacterial growth, also demonstrating bacteriostatic and bactericide activity. All these results suggest that the use of bicarbonate in Chlorella culture can be a valid and alternative method to CO2 insufflation not only for intensive culture growth but also for the production of potentially bioactive compounds in a short time due to its rapid dose-dependent effect.

Supplementary Materials

The following are available online at https://www.mdpi.com/2076-3417/10/13/4515/s1, Figure S1: Pigment composition of Chlorella sorokiniana. Chromatogram in absorbance of eluted pigments, Table S1: Growth rate and doubling time in control and in sodium bicarbonate enriched cultures, Table S2. Time course of changes in pigments:chlorophyll a ratio in control and in sodium bicarbonate enriched cultures.

Author Contributions

Conceptualization, G.S., S.C.; methodology, G.S., F.B., M.A., F.C.; writing—original draft preparation, G.S., S.C., F.B., O.M. All authors have read and agreed to the published version of the manuscript.

Funding

This research was carried out in the frame of Programme STAR, financially supported by UniNA and Compagnia di San Paolo (Bando STAR-2018).

Conflicts of Interest

The authors declare that the research was conducted in the absence of any commercial or financial relationships that could be construed as a potential conflict of interest.

References

  1. Priyadarshani, I.; Rath, B. Commercial and industrial applications of micro algae—A review. J. Algal Biomass Utl. 2012, 3, 89–100. [Google Scholar]
  2. Barros, A.I.; Gonçalves, A.L.; Simões, M.; Pires, J.C.M. Harvesting techniques applied to microalgae: A review. Renew. Sustain. Energy Rev. 2015, 41, 1489–1500. [Google Scholar] [CrossRef] [Green Version]
  3. Carfagna, S.; Salbitani, G.; Bottone, C.; Vona, V. Galdieria sulphuraria as a Possible Source of Food Colorant. J. Nutr. Ecol. 2016, 3, 78–81. [Google Scholar] [CrossRef] [Green Version]
  4. Vona, V.; Di Martino Rigano, V.; Andreoli, C.; Lobosco, O.; Caiazzo, M.; Martello, A.; Carfagna, S.; Salbitani, G.; Rigano, C. Comparative analysis of photosynthetic and respiratory parameters in the psychrophilic unicellular green alga Koliella antarctica, cultured in indoor and outdoor photo-bioreactors. Physiol. Mol. Biol. Plants 2018, 24, 1139–1146. [Google Scholar] [CrossRef] [PubMed]
  5. Carfagna, S.; Landi, V.; Coraggio, F.; Salbitani, G.; Vona, V.; Pinto, G.; Pollio, A.; Ciniglia, C. Different characteristics of C-phycocyanin (C-PC) in two strains of the extremophilic Galdieria phlegrea. Algal. Res. 2018, 31, 406–412. [Google Scholar] [CrossRef]
  6. Bottone, C.; Camerlingo, R.; Miceli, R.; Salbitani, G.; Sessa, G.; Pirozzi, G.; Carfagna, S. Antioxidant and anti-proliferative properties of extracts from heterotrophic cultures of Galdieria sulphuraria. Nat. Prod. Res. 2019, 15, 1–5. [Google Scholar] [CrossRef] [PubMed]
  7. Giuliano, G.; Demurtas, O.; Ferrante, P. Le microalghe come bio-fabbriche per composti ad elevato valore aggiunto. ENEA Magazine, EAI Speciale. Biotecnologie per lo Sviluppo Sostenibile 2013, I, 61–66. [Google Scholar]
  8. Serive, B.; Kaas, R.; Bérard, J.B.; Pasquet, V.; Picot, L.; Cadoret, J.P. Selection and optimisation of a method for efficient metabolites extraction from microalgae. Bioresour. Technol. 2012, 124, 311–320. [Google Scholar] [CrossRef]
  9. Basu, S.; Mackey, K.R.M. Phytoplankton as Key Mediators of the Biological Carbon Pump: Their Responses to a Changing Climate. Sustainability 2018, 10, 869. [Google Scholar] [CrossRef] [Green Version]
  10. Poschenrieder, C.; Fernandez, J.A.; Rubio, L.; Perez, L.; Teres, J.; Barcelo, J. Transport and use of bicarbonate in plants: Current knowledge and challenges ahead. Int. J. Mol. Sci. 2018, 19, 1352. [Google Scholar] [CrossRef] [Green Version]
  11. Santamaria, L. Why are most aquatic plants widely distributed? Dispersal, clonal growth and small-scale heterogeneity in a stressful environment. Acta Oecol. 2002, 23, 137–154. [Google Scholar] [CrossRef]
  12. Hussner, A.; Mettler-Altmann, T.; Weber, A.P.M.; Sand-Jensen, K. Acclimation of photosynthesis to supersaturated CO2 in aquatic plant bicarbonate users. Freshw. Biol. 2016, 61, 1720–1732. [Google Scholar] [CrossRef]
  13. Cole, J.J.; Prairie, Y.T. Dissolved CO2. In Encyclopedia of Inland Waters; Likens, G.E., Ed.; Elsevier: Oxford, UK, 2009; Volume 2, pp. 30–34. [Google Scholar]
  14. Huertas, I.E.; Colman, B.; Espie, G.; Lubian, L.M. Active transport of CO2 by three species of marine microalgae. J. Phycol. 2000, 36, 314–320. [Google Scholar] [CrossRef]
  15. White, D.A.; Pagarette, A.; Rooks, P.; Ali, S.T. The effect of sodium bicarbonate supplementation on growth and biochemical composition of marine microalgae cultures. J. Appl. Phycol. 2012, 25, 153–165. [Google Scholar] [CrossRef]
  16. Mondal, M.; Khanra, S.; Tiwari, O.N.; Gayen, K.; Halder, G.N. Role of carbonic anhydrase on the way to biological carbon capture through microalgae-A mini review. Environ. Prog. Sustain. Energy 2016. [Google Scholar] [CrossRef]
  17. Giordano, M.; Beardall, J.; Raven, J.A. CO2 concentrating mechanisms in algae: Mechanisms, environmental modulation, and evolution. Annu. Rev. Plant. Biol. 2005, 56, 99–131. [Google Scholar] [CrossRef] [Green Version]
  18. Reinfelder, J.R. Carbon concentrating mechanisms in eukaryotic marine phytoplankton. Ann. Rev. Mar. Sci. 2011, 3, 291–315. [Google Scholar] [CrossRef] [Green Version]
  19. Zhao, K.; Wu, Y. Effects of Zn Deficiency and Bicarbonate on the Growth and Photosynthetic Characteristics of Four Plant Species. PLoS ONE 2017, 12, e0169812. [Google Scholar] [CrossRef]
  20. Acièn, F.G.; Gonz’alez, C.V.; Fern´andez, J.M.; Molina, E. Conversion of CO2 into biomass by microalgae: How realistic a contribution may it be to significant CO2 removal? Appl. Microbiol. Biotechnol. 2012, 96, 577–586. [Google Scholar] [CrossRef]
  21. Nunez, M.; Quigg, A. Changes in growth and composition of the marine microalgae Phaeodactylum tricornutum and Nannochloropsis salina in response to changing sodium bicarbonate concentrations. J. Appl. Phycol. 2015, 28, 2123–2138. [Google Scholar] [CrossRef]
  22. De Farias Silva, C.E.; Grisa, B.; Sforza, E.; La Rocca, N.; Bertucco, A. Effects of Sodium Bicarbonate on Biomass and Carbohydrate Production in Synechococcus PCC 7002. Chem. Eng. Trans. 2016, 49, 241–246. [Google Scholar]
  23. Kim, G.Y.; Roh, K.; Han, J.I. The use of bicarbonate for microalgae cultivation and its carbon footprint analysis. Green Chem. 2019, 21, 5053–5062. [Google Scholar] [CrossRef]
  24. Gardner, R.D.; Lohman, E.; Gerlach, R.; Cooksey, K.E.; Peyton, B.M. Comparison of CO2 and bicarbonate as inorganic carbon sources for triacylglycerol and starch accumulation in Chlamydomonas reinhardtii. Biotechnol. Bioeng. 2012, 110, 87–96. [Google Scholar] [CrossRef] [PubMed]
  25. Pancha, I.; Chokshi, K.; Ghosh, T.; Paliwal, C.; Maurya, R.; Mishra, S. Bicarbonate supplementation enhanced biofuel production potential as well as nutritional stress mitigation in the microalgae Scenedesmus sp. CCNM 1077. Bioresour. Technol. 2015, 193, 315–323. [Google Scholar] [CrossRef] [PubMed]
  26. Srinivasan, R.; Mageswari, A.; Subramanian, P.; Suganthi, C.; Chaitanyakumar, A.; Aswini, V.; Gothandam, K.M. Bicarbonate supplementation enhances growth and biochemical composition of Dunaliella salina V-101 by reducing oxidative stress induced during macronutrient deficit conditions. Sci. Rep. 2018, 8, 1–14. [Google Scholar] [CrossRef] [PubMed] [Green Version]
  27. Salbitani, G.; Barone, C.M.A.; Carfagna, S. Effect of bicarbonate on growth of the oleaginous microalga Botryococcus braunii. Int. J. Plant Biol. 2019, 10, 8273. [Google Scholar] [CrossRef] [Green Version]
  28. Zhang, R.L.; Wang, J.H.; Cheng, L.Y.; Tang, Y.J.; Chi, Z.Y. Selection of microalgae strains for bicarbonate based integrated carbon capture and algal production system to produce lipid. Int. J. Green Energy 2019, 16, 825–833. [Google Scholar] [CrossRef]
  29. Salbitani, G.; Del Prete, S.; Bolinesi, F.; Mangono, O.; De Luca, V.; Carginale, V.; Donald, W.A.; Supuran, C.T.; Carfagna, S.; Capasso, C. Use of an immobilized thermostable α-CA (SspCA) for enhancing the metabolic efficiency of the freshwater green microalga Chlorella sorokiniana. J. Enzyme Inhib. Med. Chem. 2020, 35, 913–920. [Google Scholar] [CrossRef] [Green Version]
  30. De Andrade, C.J.; De Andrade, L.M. An overview on the application of genus Chlorella in biotechnological processes. J. Adv. Res. Biotechnol. 2017, 2, 1–9. [Google Scholar] [CrossRef]
  31. Sampathkumar, S.J.; Gothandam, K.M. Sodium bicarbonate augmentation enhances lutein biosynthesis in green microalgae Chlorella pyrenoidosa. Biocatal. Agric. Biotechnol. 2019, 22, 101406. [Google Scholar] [CrossRef]
  32. Vadlamani, A.; Pendyala, B.; Viamajala, S.; Varanasi, S. High Productivity Cultivation of Microalgae without Concentrated CO2 Input. ACS Sustain. Chem. Eng. 2019, 7, 1933–1943. [Google Scholar] [CrossRef]
  33. Guccione, A.; Biondi, N.; Sampietro, G.; Rodolfi, L.; Bassi, N.; Tredici, M. Chlorella for protein and biofuels: From strain selection to outdoor cultivation in a Green Wall Panel photobioreactor. Biotech. Biofuels 2014, 7, 84. [Google Scholar] [CrossRef] [Green Version]
  34. Cazzaniga, S.; Dall’Osto, L.; Szaub, J.; Scibilia, L.; Ballottari, M.; Purton, S.; Bassi, R. Domestication of the green alga Chlorella sorokiniana: Reduction of antenna size improves light-use efficiency in a photobioreactor. Biotechnol. Biofuels 2014, 7, 157. [Google Scholar] [CrossRef] [PubMed] [Green Version]
  35. Li, J.; Li, C.; Lan, C.Q.; Liao, D. Effects of sodium bicarbonate on cell growth, lipid accumulation, and morphology of Chlorella vulgaris. Microb. Cell Fact. 2018, 17, 111. [Google Scholar] [CrossRef] [PubMed]
  36. Lohman, E.; Gardner, R.D.; Pedersen, T.; Peyton, B.M.; Cooksey, K.E.; Gerlach, R. Optimized carbon regime for enhanced growth and lipid accumulation in Chlorella vulgaris. Biotech. Biofuel 2015, 8, 82. [Google Scholar] [CrossRef] [Green Version]
  37. Jayasankar, R.; Valsala, K.K. Influence of different concentrations of bicarbonate on growth rate and chlorophyll content of Chlorella salina. J. Mar. Biol. Assoc. India 2008, 50, 74–78. [Google Scholar]
  38. Salbitani, G.; Wirtz, M.; Hell, R.; Carfagna, S. Affinity purification of O-acetylserine (thiol) lyase from Chlorella sorokiniana by recombinant proteins from Arabidopsis thaliana. Metabolites 2014, 4, 629–639. [Google Scholar] [CrossRef]
  39. Holm-Hansen, O.; Lorenzen, C.J.; Holmes, R.W.; Strickland, J.D. Fluorometric determination of chlorophyll. J. Cons. Int. Explor. Mer. 1965, 30, 3–15. [Google Scholar] [CrossRef]
  40. Bolinesi, F.; Arienzo, M.; Donadio, C.; Ferrara, L.; Passarelli, A.; Saggiomo, M.; Saggiomo, V.; Stanislao, C.; Trifuoggi, M.; Mangoni, O. Spatial and temporal variation of phytoplankton community structure in a coastal marine system subjected to human pressure. Reg. Stud. Mar. Sci. 2020, 35, 101198. [Google Scholar] [CrossRef]
  41. Vidussi, F.; Claustre, H.; Bustillos-Guzman, J.; Cailliau, C.; Marty, J.C. Determination of chlorophylls and carotenoids of marine phytoplankton: Separation of chlorophyll a from divinylchlorophyll a and zeaxanthin from lutein. J. Plankton Res. 1996, 18, 2377–2382. [Google Scholar] [CrossRef] [Green Version]
  42. Brunet, C.; Mangoni, O. Determinazione quali-quantitativa dei pigmenti fitoplanctonici mediante HPLC. In Metodologie di Studio del Plancton Marino; Socal, G., Buttino, I., Cabrini, M., Mangoni, O., Penna, A., Totti, C., Eds.; Istituto Superiore per la Protezione e la Ricerca Ambientale: Roma, Italy, 2010; Volume 56, pp. 379–385. [Google Scholar]
  43. Mauzerall, D.; Greenbaum, N.L. The absolute size of a photosynthetic unit. Biochim. Biophys. Acta 1989, 974, 119–140. [Google Scholar] [CrossRef]
  44. Falkowski, P.; Raven, J. Aquatic Photosynthesis, 2nd ed.; Princeton University Press: Princeton, NJ, USA, 2007; p. 448. [Google Scholar]
  45. Mangoni, O.; Saggiomo, V.; Bolinesi, F.; Margiotta, F.; Budillon, G.; Cotroneo, Y.; Misic, C.; Rivaro, P.; Saggiomo, M. Phytoplankton blooms during austral summer in the Ross Sea, Antarctica: Driving factors and trophic implications. PLoS ONE 2017, 12, e0176033. [Google Scholar] [CrossRef] [PubMed] [Green Version]
  46. Cullen, J.J.; Davis, R.F. The blank can make a big difference in oceanographic measurements. Limnol. Oceanogr. Bull. 2003, 12, 29–355. [Google Scholar] [CrossRef]
  47. Maxwell, K.; Johnson, G.N. Chlorophyll fluorescence—A practical guide. J. Exp. Bot. 2000, 51, 659–668. [Google Scholar] [CrossRef]
  48. Schreiber, U.; Klughammer, C.; Kolbowski, J. Assessment of wavelength-dependent parameters of photosynthetic electron transport with a new type of multi-color PAM chlorophyll fluorometer. Photosynth. Res. 2012, 113, 127. [Google Scholar] [CrossRef] [Green Version]
  49. International Organization for Standardization. Microbiology of Food and Animal Feeding Stuffs—General Requirements and Guidance for Microbiological Examinations—Amendment 1; ISO 7218:2007/Amd 1:2013, Corrected Version 15 April 2014; International Organization for Standardization: Geneva, Switzerland, 2014. [Google Scholar]
  50. APHA; AWWA; WEF. Standard Methods for the Examination of Water and Wastewater, 20th ed.; American Public Health Association: Washington, DC, USA, 1998. [Google Scholar]
  51. Schumann, F.K.; Lorenzen, C.J. Quantitative degradation of chlorophyll by a marine herbivores. Limnol. Oceanogr. 1975, 2, 580–586. [Google Scholar] [CrossRef] [Green Version]
  52. Collos, Y.; Husseini-Ratrema, J.; Bec, B.; Vaquer, A.; Hoai, T.L.; Rougier, C.; Pons, V.; Souchu, P. Pheopigment dynamics, zooplankton grazing rates and the autumnal ammonium peak in a Mediterranean lagoon. Hydrobiologia 2005, 550, 83–93. [Google Scholar] [CrossRef] [Green Version]
  53. Richmond, A.; Hu, Q. Handbook of Microalgal Culture: Applied Phycology and Biotechnology; Wiley Blackwell: Hoboken, NJ, USA, 2013. [Google Scholar] [CrossRef]
  54. Chi, Z.; Elloy, F.; Xie, Y.; Hu, Y.; Chen, S. Selection of microalgae and cyanobacteria strains for bicarbonate-based integrated carbon capture and algae production system. Appl. Biochem. Biotechnol. 2014, 172, 447–457. [Google Scholar] [CrossRef]
  55. Russo, M.E.; Bareschino, P.; Olivieri, G.; Chirone, R.; Salatino, P.; Marzocchella, A. Modeling of slurry staged bubble column for biomimetic CO2 capture. Int. J. Greenh Gas Con. 2016, 47, 200–209. [Google Scholar] [CrossRef]
  56. Peirce, S.; Perfetto, R.; Russo, M.E.; Capasso, C.; Rossi, M.; Salatino, P.; Marzocchella, A. Characterization of technical grade carbonic anhydrase as biocatalyst for CO2 capture in potassium carbonate solutions. Green Gas Sci. Technol. 2018, 8, 279–291. [Google Scholar] [CrossRef]
  57. Peng, L.; Lan, C.Q.; Zhang, Z. Cultivation of Freshwater Green Alga Neochloris oleoabundans. Can. J. Chem. Eng. 2016, 94, 439–445. [Google Scholar] [CrossRef]
  58. Work, V.H.; Randor Radakovits, R.; Jinkerson, R.E.; Meuser, J.E.; Elliott, L.J.; Vinyard, D.J.; Laurens, L.M.; Dismukes, G.C.; Posewitz, M.C. Increased Lipid Accumulation in the Chlamydomonas reinhardtii sta7-10 Starchless Isoamylase Mutant and Increased Carbohydrate Synthesis in Complemented Strains. Eukaryot. Cell. 2010, 9, 1251–1261. [Google Scholar] [CrossRef] [PubMed] [Green Version]
  59. Chen, H.; Jiang, J.G. Osmotic responses of Dunaliella to the changes of salinity. J. Cell Physiol. 2009, 219, 251–258. [Google Scholar] [CrossRef]
  60. Hörtensteiner, S. Chlorophyll degradation during senescence. Annu. Rev. Plant Biol. 2006, 57, 55–77. [Google Scholar] [CrossRef]
  61. Borghini, F.; Colacevich, A.; Bergamino, N.; Micarelli, P.; Dattilo, A.M.; Focardi, S.; Loiselle, S. The microalgae Tetraselmis suecica in mesocosms under different light regimes. Chem. Ecol. 2009, 25, 345–357. [Google Scholar] [CrossRef]
  62. Sade, N.; Rubio-Wilhelmi, M.; Umnajkitikorn, K.; Blumwald, E. Stress-induced senescence and plant tolerance to abiotic stress. J. Exp. Bot. 2018, 69, 845–853. [Google Scholar] [CrossRef]
  63. Kolber, Z.; Wyman, K.D.; Falkowsky, P.G. Natural variability in photosynthetic energy conversion efficiency: A field study in the Gulf of Maine. Limnol. Oceanogr. 1990, 35, 72–79. [Google Scholar] [CrossRef]
  64. Geider, R.J.; Greene, R.M.; Kolber, Z.; MacIntyre, H.L. Falkowski, P.G. Fluorescence assessment of the maximum quantum efficiency of photosynthesis in the western North Atlantic. Deep-Sea Res. 1993, 1, 1205–1224. [Google Scholar] [CrossRef]
  65. Greene, R.I.M.; Kolber, Z.S.; Swift, D.G.; Tindale, N.W.; Falkowski, P.G. Physiological limitation of phytoplankton photosynthesis in the Equatorial Pacific determined from natural variability In the quantum yield of fluorescence. Limnol. Oceanogr. 1994, 39, 1061–1064. [Google Scholar] [CrossRef]
  66. Sugget, D.J.; MacIntyre, H.L.; Kana, T.M.; Geider, R.J. Comparing electron transport with gas exchange: Parameterising exchange rates between alternative photosynthetic currencies for eukaryotic phytoplankton. Aquat. Microb. Ecol. 2009, 56, 147–162. [Google Scholar] [CrossRef] [Green Version]
  67. Caffarri, S.; Tibiletti, T.; Jennings, R.C.; Santabarbara, S.A. Comparison Between Plant Photosystem I and Photosystem II Architecture and Functioning. Curr. Protein Pept. Sci. 2014, 15, 296–331. [Google Scholar] [CrossRef] [PubMed]
Figure 1. Chlorella sorokiniana growth determined by optical density (OD800) estimation in control cells and after different bicarbonate addition NaHCO3 1 g L−1, 2 g L−1, and 3 g L−1. Error bars represent SD (n = 3). The values with the same letter were not significantly different (p ≤ 0.001, ANOVA, Tukey’s multiple comparison).
Applsci 10 04515 g001
Figure 2. Cellular density (cells mL−1) in Chlorella sorokiniana control and bicarbonate enriched cultures (NaHCO3 1 g L−1, 2 g L−1, and 3 g L−1). Error bars represent SD (n = 3). The values with the same letter were not significantly different (p ≤ 0.001, ANOVA, Tukey’s multiple comparison).
Applsci 10 04515 g002
Figure 3. Average cell diameter of Chlorella sorokiniana control and bicarbonate enriched cultures cells (NaHCO3 1 g L−1, 2 g L−1, and 3 g L−1). Error bars represent SD (n = 3). The values with the same letter were not significantly different (p ≤ 0.001, ANOVA, Tukey’s multiple comparison).
Applsci 10 04515 g003
Figure 4. Chlorophyll a content in Chlorella sorokiniana control and in bicarbonate enriched cultures cells (NaHCO3 1 g L−1, 2 g L−1, and 3 g L−1). Error bars represent SD (n = 3).
Applsci 10 04515 g004
Figure 5. Maximum quantum yield (Fv/Fm) in Chlorella sorokiniana control cells and in bicarbonate 1 g L−1, 2 g L−1, and 3 g L−1 enriched cultures. Error bars represent SD (n = 3).
Applsci 10 04515 g005
Figure 6. Maximum photosystem II (PSII) effective absorption (440 nm) cross-section (σPSII) in Chlorella sorokiniana control cells and in cells grown in bicarbonate 1 g L−1, 2 g L−1, and 3 g L−1 enriched medium. Error bars represent SD (n = 3).
Applsci 10 04515 g006
Figure 7. Microbial contamination reduction in Chlorella sorokiniana cultured with 0 or 3 g L−1 of sodium bicarbonate. Analysis performed three times, after 0, 3, and 48 h after bicarbonate addition.
Applsci 10 04515 g007
Figure 8. Principal component analysis (PCA): Distribution of treatments grouped according to different bicarbonate concentration. Control (orange color), 1 g L−1 (blue color), 2 g L−1 (green color), and 3 g L−1 (pink color).
Applsci 10 04515 g008
Table 1. Time course of changes in phaeopigments vs. chlorophyll a ratio ([Phaeo]/[Chl-a]) in control and in sodium bicarbonate enriched cultures. Values are means (n = 3) ± standard deviation. The superscript letters indicate the statistical significance: identical letters identify means that are not significantly different; different letters identify statistically different means (p ≤ 0.001). Upper case letters indicate the comparison between the experimental conditions (control, 1, 2, and 3 g L−1).
Time (h)
0134244872
Control0.99 ± 0.08 Aa1.01 ± 0.01 Aa1.00 ± 0.02 Aa1.02 ± 0.05 Aa0.96 ± 0.06 Aa0.97 ± 0.02 Aa1.00 ± 0.04 Aa
1 g L−11.00 ± 0.01 Aa0.98 ± 0.07 Aa1.31 ± 0.07 Bb0.94 ± 0.03 Aa0.83 ± 0.07 Cc0.88 ± 0.03 Aab0.98 ± 0.02 Aa
2 g L−10.99 ± 0.07 Aa1.04 ± 0.04 Aa1.28 ± 0.08 Bb0.96 ± 0.04 Aa0.81 ± 0.08 Cac0.79 ± 0.02 Cc0.90 ± 0.05 Cc
3 g L−10.99 ± 0.08 Aa0.99 ± 0.02 Aa1.22 ± 0.06 Bb1.00 ± 0.02 Aa0.63 ± 0.02 Dd0.76 ± 0.01 Cc0.78 ± 0.02 Cc

