Article

A Measurement Software for Professional Training in Early Detection of Melanoma

1
Section of Dermatology, Department of Clinical Medicine and Surgery, University of Naples Federico II, 5, 80131 Naples, Italy
2
Department of Industrial Engineering, University of Salerno Via Giovanni Paolo II, 132, 84084 Fisciano, Italy
*
Author to whom correspondence should be addressed.
Appl. Sci. 2020, 10(12), 4351; https://doi.org/10.3390/app10124351
Submission received: 19 May 2020 / Revised: 16 June 2020 / Accepted: 22 June 2020 / Published: 24 June 2020
(This article belongs to the Special Issue Computer-aided Biomedical Imaging 2020: Advances and Prospects)

Abstract

:

Featured Application

An original software measurement system has been developed as a digital tool supporting the training of physicians during post-graduate courses in dermatology and corresponding clinical activity in order to increase the diagnostic performance (mainly in terms of sensitivity) regarding the early detection of cutaneous melanoma when suspicious pigmented lesions are to be examined. To pursue this goal the system is able to automatically process the ELM images of melanocytic lesions (acquired through digital dermoscopy) according to a well-known diagnostic method. As an outlook, in order to boost massive screening campaigns, the results of the automatic image processing could be adopted as a dermoscopic triage carried out in suitable tele-medicine projects involving general practitioners and/or pharmacists (for real-time image acquisition) and young dermatologists (for off-line lesion classification).

Abstract

Software systems have been long introduced as support to the early detection of melanoma through the automatic analysis of suspicious skin lesions. Nevertheless, their behavior is not yet similar to the performance exhibited by expert dermatologists in terms of diagnostic accuracy. Instead, a software system should be adopted by non-experienced dermatologists in order to improve the measurement and detection results for skin atypical patterns and the accuracy of the corresponding second opinion. This paper describes an image-based measurement and classification system able to score pigmented skin lesions according to the Seven-Point Check-list diagnostic method. Focus is devoted to the measurement procedure of biological structures more closely related to the atypical character of the nevus. Moreover, the performances of the measurement system are evaluated by considering the support to dermatologists with different experiences during the clinical activity.

1. Introduction

One of the leading cancers around the world is represented by the malignant melanoma, whose dramatic number of diagnoses seems to be also influenced by both the change in recreational behavior and increasing ultraviolet radiation. According to the World Health Organization (WHO), there are more new cases of skin cancer than the combined incidence of cancers of the breast, prostate, lung, and colon [1]. In detail, melanoma is characterized by a biphasic growth which, at the beginning, evolves “horizontally“, forming a stratified lesion above the basement membrane (intra-epidermal phase, without metastatic potential), and in a second time, increases “vertically“ by penetrating deep into the dermis (invasive phase with high metastatic risk).
Retrospective epidemiological studies have shown that if the melanoma is diagnosed early, with a thickness less than 1 millimeter (thin melanoma), the survival rate approaches 100% of cases (investigations have shown that the curability rate of thin melanomas is between 91.8% and 98.1% [2]). For this reason, preventive and screening campaigns for increasing public awareness and improving the early diagnosis of melanoma by identifying its precursors and early warning signs are today becoming more important [3].
One of the most useful diagnostic tools in the identification of atypical melanocytic lesions is dermoscopy (also known as epiluminescence microscopy (ELM) [4]. In detail, dermoscopy is a noninvasive technique that allows the morphological features of skin layers to be identified by suitable magnification and lighting systems [5,6]. With respect to the clinical inspection by the naked eye, the adoption of dermoscopy allows the diagnosis accuracy of pigmented skin lesions to be improved from 10% to 27% [7]. The images seen through a dermatoscope are, therefore, very different from both the clinical and the histopathological images. Dermoscopy is an ideal interface between these two areas. The major limitation of this method is its dependence on the experience of the observer [8]. The sensitivity of diagnostic accuracy of dermoscopy is closely related to the specific experience of the investigator and may be significantly lower in observers who are not formally trained. Not surprisingly, Binder et al. [9] have shown that the patterns of analysis of dermoscopic images on one hand improves the diagnostic performance of experienced dermatologists, but on the other, worsens that of non-expert ones. These data were largely confirmed by a more recent review [10]. In order to overcome this problem, new diagnostic strategies have been proposed with the aim to ensure greater “objectivity” in the early detection of suspicious melanocytic lesions, especially for dermatologists not so experienced in dermoscopy. Among these, the introduction of digital systems for the acquisition and analysis of images represents an additional useful tool for the early diagnosis of melanoma. With these methods, it is possible to analyze images using defined algorithms that process the dermoscopic images, identifying features that can discriminate melanoma from other pigmented skin lesions. Dermatologists expert in dermoscopy have a greater diagnostic sensitivity and specificity compared to non-expert ones [11].
This is a very promising field of non-invasive diagnostics, although not without its difficulties, especially arising from the complexity of design and application in daily clinical practice. Several studies have evaluated and demonstrated the possibility to reach, with these systems, diagnostic accuracy levels similar to those of experienced dermatologists [12]. Until now, the data obtained in these studies, based on clinical diagnoses made in experimental conditions, should be interpreted with caution and, in our opinion, are not sufficient to demonstrate the ability of any automated diagnostic system to replace the diagnostic capacity of the specialist’s eye. Instead, they are a valuable support to the diagnosis, based on validated and widely accepted dermoscopic algorithms. In the studies published to date, different dermoscopic algorithms have been used, but no automated system capable of detecting the parameters of the Seven-Point Checklist has so far been devised.
The aim of the present study includes:
  • Design and training of a new measurement system able to identify, in dermoscopic images, the seven parameters of the Seven-Point Checklist;
  • Evaluation of the diagnostic reliability guaranteed by the developed system, compared to the reliability of the expert dermatologists (DE) and the non-expert (NED) groups;
  • Evaluation of the capability by the automated system to improve the diagnostic confidence of NED, when used for the analysis of dermoscopic images (“semi-automatic“ diagnosis).
The paper organization is the following: An overview of the automated system proposed in scientific literature is provided in Section 2. Then, the developed measurement and classification system is described with details about the proposed image processing techniques. The experimental results are disclosed in Section 4. The final section reports the concluding remarks of the study.

2. Materials and Methods

The automatic system depicted in Figure 1 has been developed by the authors to identify all the Seven-Point Checklist criteria in digital dermoscopic images.
The measurement and classification software include the most outstanding literature results, as well as the authors’ proposal [13,14,15,16,17,18,19] regarding the adoption of feature extraction techniques, classification methods, and statistical analysis of suspicious skin lesions.
Regarding the training and testing of the automatic system, the dermoscopic image set counting more than 600 skin lesions was adopted; it includes both items randomly extracted by the reference atlas [20] and cases examined and recorded during the clinical activity at the Department of Clinical Medicine and Surgery, University of Naples Federico II. As a result, the main biological structures (corresponding to the dermoscopic criteria included in the 7-Point Checklist) are highlighted by applying to each lesion the image processing techniques briefly reported in Table 1 and Table 2. As a further step, a statistical analysis is performed with the aim of providing the measurement information about the reliability of the adopted procedure for each criterion detection. Thus, a label (low, medium, or high) is assigned to each dermoscopic structure detected according to different ranges for the corresponding metric value, which is introduced for qualifying the processing algorithm. In the following section, the ad-hoc classification algorithms are briefly reported for all the dermoscopic criteria, as well as the statistical analysis proposed to evaluate the reliability of the automatic detection.

2.1. Color-Based Detection of Dermoscopic Criteria

The automatic measurement and classification of the dermoscopic structures most dependent on the chromatic distribution of the image pixels (i.e., blue-whitish veil, regression, and irregular pigmentation) is performed through the adoption of suitable logistic model trees (LMTs) [21]. In detail, the machine learning technique is adopted to classify the lesion map, i.e., the set of the chromatically homogeneous regions (low-level structures) resulting from segmentation performed through either principal component analysis (PCA) [15] or statistical region merging (SRM) [22]. The vector x of the feature descriptors for each region includes the red, green, and blue (RGB), hue, saturation, and intensity (HSI), and CIELUV components of the corresponding pixels; in addition, the percentage ratio of the regional pixels with respect to the total number of the lesion map pixels is considered.
The result of the LMT training is depicted in Figure 2a regarding the automatic detection of the blue-whitish veil criterion: According to different ranges for the hue mean value of the region to be analyzed, three patterns (blue, red, or polychromatic) are highlighted by the corresponding logistic regression models.
On the basis of the mean and standard deviation for the hue ( σ H ), saturation ( μ S ,   σ S ), and intensity ( μ I ,   σ I ) components, the functions F i ( x ) are adopted to compute the probability P i that each segment of the lesion map (see Figure 2b) belongs to an area characterized by the blue-whitish veil according to:
P i = e F i ( x ) j = 1 2 e F j ( x )
where the classes i = 1 and i = 2 correspond respectively to presence and absence of the dermoscopic criterion. An example of detection result is depicted in Figure 2c.
The segments of the lesion map not associated with the blue-whitish veil are then classified by further LMT models as area of either regression (see Figure 3) or irregular pigmentation.
The former model computes the corresponding probability for each chromatically homogeneous region by adopting the following simple logistic regression:
F 1 ( x ) = 2.5 [ l ] + 0.1 [ i d ] + 0.2 [ s d ] 0.4 [ A % ] 1.9
which takes into account only the mean value ( l ) for the L component, the neighbor difference for intensity ( i d ) and saturation ( s d ) components, and the area percentage A % as truly significant attributes.
In detail, irregular pigmentation is detected (see Figure 4) if P 1 > 0.5 for (at least) one segment of the lesion map (that is classified as irregular); then, the reliability of the automatic detection is evaluated by considering the probability P 1 , S i r r associated with the widest irregular segment S i r r according to the following ranges:
L o w     i f     0.5 < P 1 , S i r r   <   0.65 M e d i u m     i f    0.65     P 1 , S i r r   <   0.85 H i g h     i f    0.85     P 1 , S i r r     1
Analogous computation and thresholds concerned with the probability P 1 associated with the widest color segment have been adopted to provide the reliability of the automatic detection for the blue-whitish veil and the regression.

2.2. Texture-Based Detection of Dermoscopic Criterion

A vector x of 69 structural, geometric, and chromatic features was extracted to describe the lesion texture of interest by adopting the graph-based approach (introduced in [23]) and the iterative loop counting algorithm suggested in [24]. As an example, Figure 5 highlights the darker mesh of the pigmented network (the “net”) and the lighter colored areas (the “holes”) surrounded by the net.
Thus, the automatic detection of the dermoscopic criterion appears as a three-class problem (absent/typical/atypical classification). Again, the logistic model tree approach is adopted as the solution to compute the probabilities P i for the pigmented network according to the generalization of Equation (1) with i = 1 ,   2 , and 3 corresponding respectively to the atypical, typical, and absent classes.
The atypical pigmented network is detected if:
arg   max i P i = 1
whereas, the detection reliability is estimated by considering the following labels:
L o w     i f     0.34   <   P 1   <   0.65 M e d i u m     i f   0.65     P 1   <   0.85 H i g h     i f     0.85     P 1     1

2.3. Atypical Vascular Pattern(AVP)

Automatic detection of the dermoscopic criterion integrates structural analysis and chromatic measurement of the lesion: The main linear/globular structures are selected through image enhancing as the tubularness filter response [25], and matched with the red segments resulting from the application of the statistical region merging at a fine level ( Q = 256 ) to the inner area (see Figure 6).
The spatial distribution of the candidate low-level features is then evaluated with respect to the main symmetry axes of the lesion. Indeed, the binomial distribution is expected when the red linear/globular structures are randomly scattered in each of 4 quadrants (resulting from drawing the major and minor axis of the ellipse characterized by the same normalized second central moments as the lesion). Thus, the analysis of the atypical vascular pattern is carried out by performing a binomial test for the N-highlighted linear/globular objects. If, in any quadrant and/or couple of quadrants, the paucity or plenty (with respect to expected value) of the low-level features are measured, the null hypothesis (i.e., the casual distribution of N linear/globular objects) may be refused with the accepted risk α of Type I Error and the atypical vascular pattern detected.
Moreover, the reliability of the classification procedure can be labeled according to the following scheme:
L o w     i f     N   <   15 M e d i u m     i f     15      N   <   30 H i g h     i f     N     30

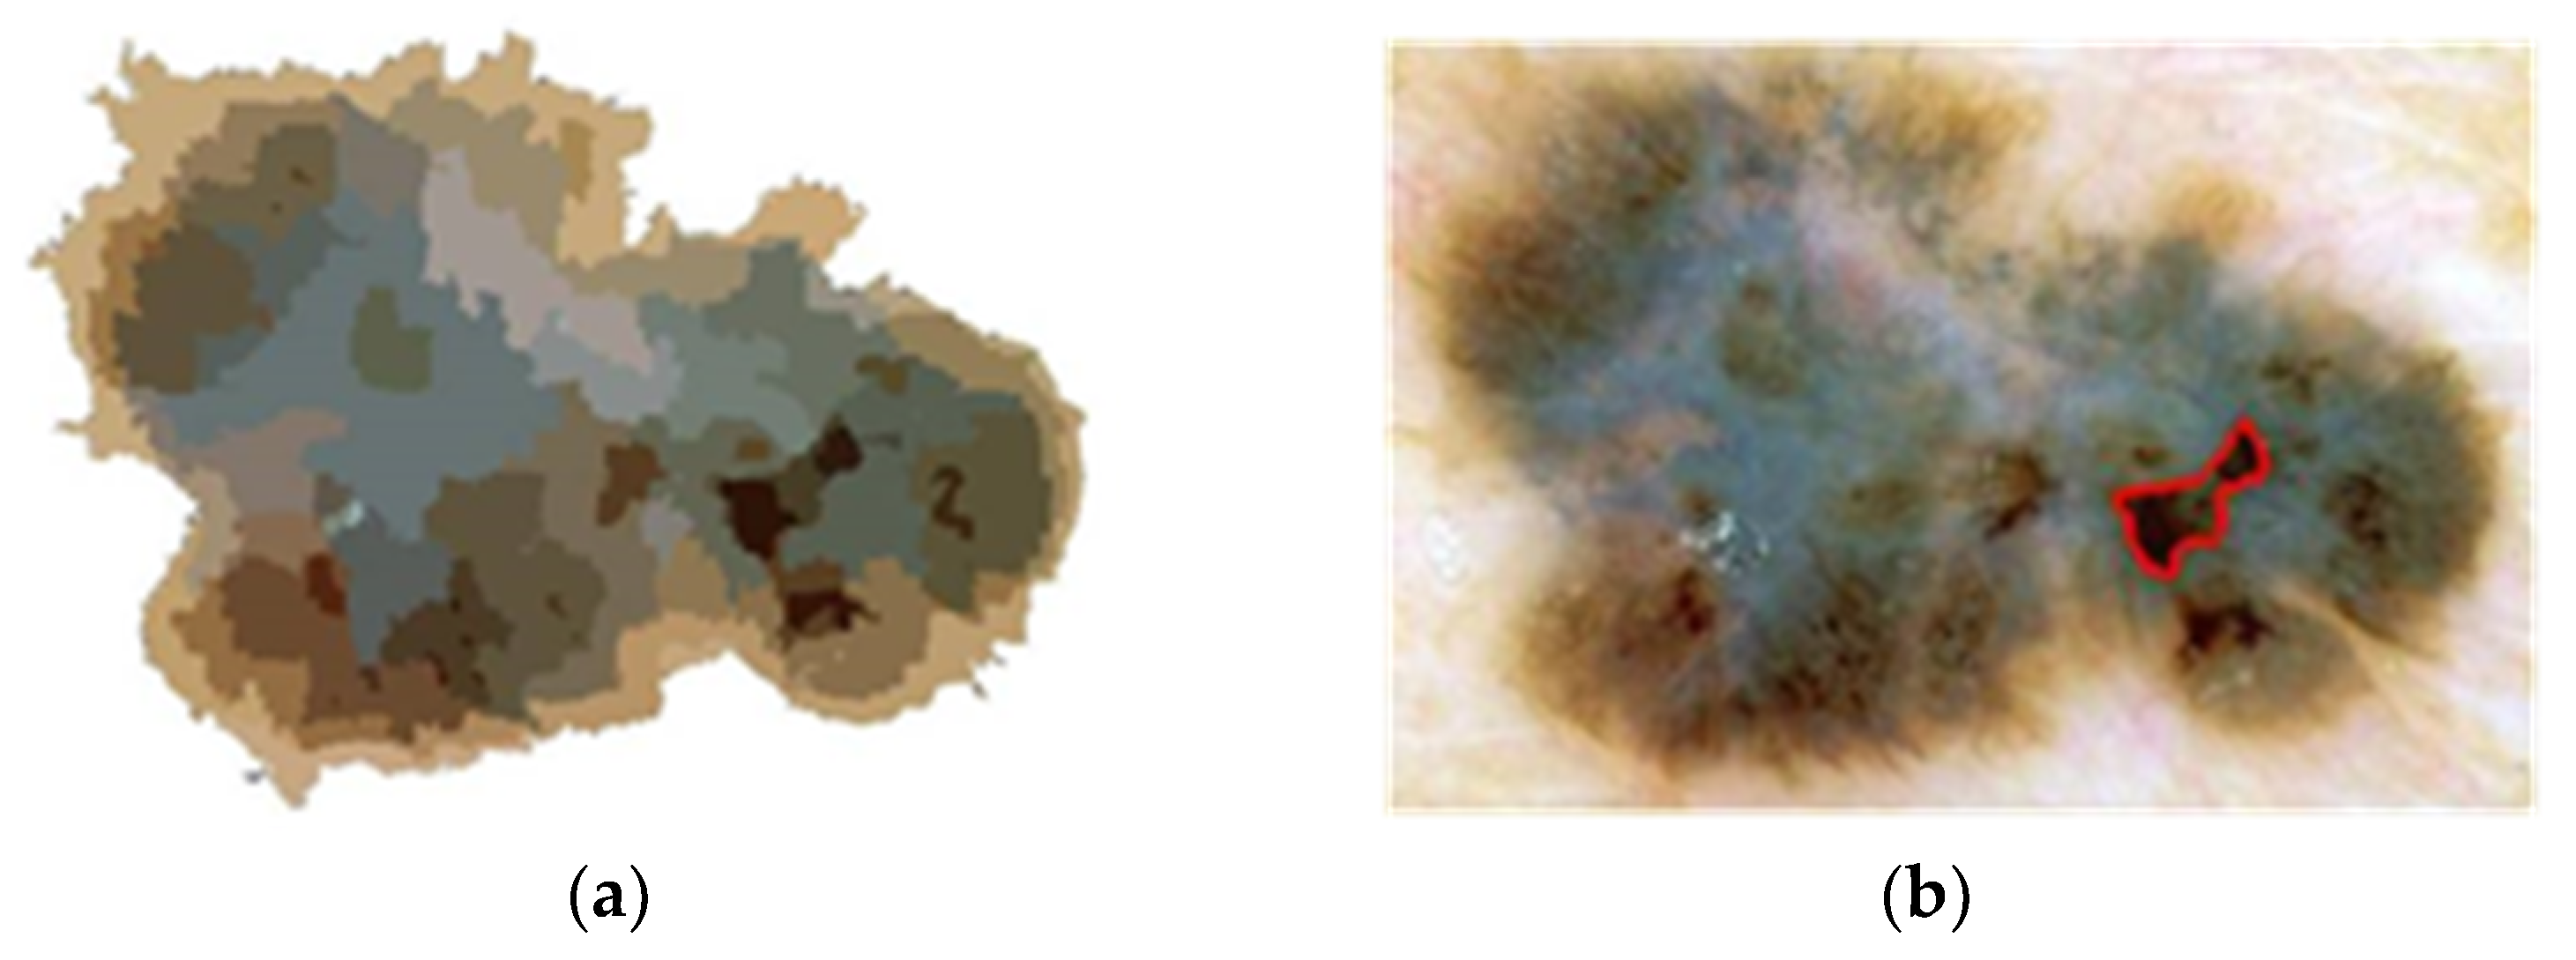
2.4. Irregular Dots and Globules

Automatic detection of small dark areas within the lesion is provided through the analysis of the chromatic and morphological measurement about the segments highlighted, as previously introduced, by the statistical region merging at fine level. In detail, the chromatically uniform regions (low-level features) are ordered according to the (increasing) value of the intensity value, within a suitable range for the hue component. Then, based on the experimental testing and tuning activity, thresholding operation is performed with respect to the morphological feature descriptors represented by the region percentage area A % and eccentricity e , in order to select N significant rounded objects inside the lesion. Again, the casual (spatial) distribution of the observed items is analyzed with respect to the main symmetry axes of the lesion. If the number of the dark round objects in each quadrant is out of the expected range from the binomial distribution, the null hypothesis of the uniform distribution is refused, and the corresponding low-level features are classified as irregular dots and globules.
The reliability of the automatic detection is estimated as follows:
L o w     i f     N   <   20 M e d i u m     i f     20     N   <   50 H i g h     i f     N     50

2.5. Irregular Streaks

Two approaches, both based on the adoption of color segmentation and structural analysis, are provided for the automatic detection of linear or bulbous extensions asymmetrically arranged at the edge of the lesion.
The former approach (depicted in Figure 7) is able to: (i) Detect the black/brown pigmentation localized along the lesion periphery (through the statistical region merging, see Figure 7b); and (ii) track the finger-like contour of the highlighted structure (which is split into 10 equal-length segments). Finally, a morphological irregularity index is determined as the ratio of the number of pixels constituting the lesion contour and the shortest path (i.e., the set of points belonging to the line that connects the farther contour pixels in the region, see Figure 7c) and compared with a suitable threshold (experimentally estimated during the training phase) to determine the set S I R R   of candidate segments with streaks.
According to the latter approach, the flux analysis of the streaks’ principle curvature vectors [26] is performed by adopting the Frangi filter [25]. In detail, the parallel and perpendicular flow for the streak vector field are measured over the equal-length segments of the lesion border. The candidate segments with streaks are included in an S F R A N G I   set by comparing the corresponding mean values and variances of the measured flows with experimentally tuned thresholds.
The presence of irregular streaks and the reliability of the corresponding procedure are provided by combining the introduced approaches according to the following scheme:
L o w     i f     0 = dim {   S F R A N G I   } < dim {   S I R R   } = 1 M e d i u m   i f    dim {   S F R A N G I       S I R R    }   = 1 H i g h     i f    dim {   S F R A N G I     S I R R    }   > 1

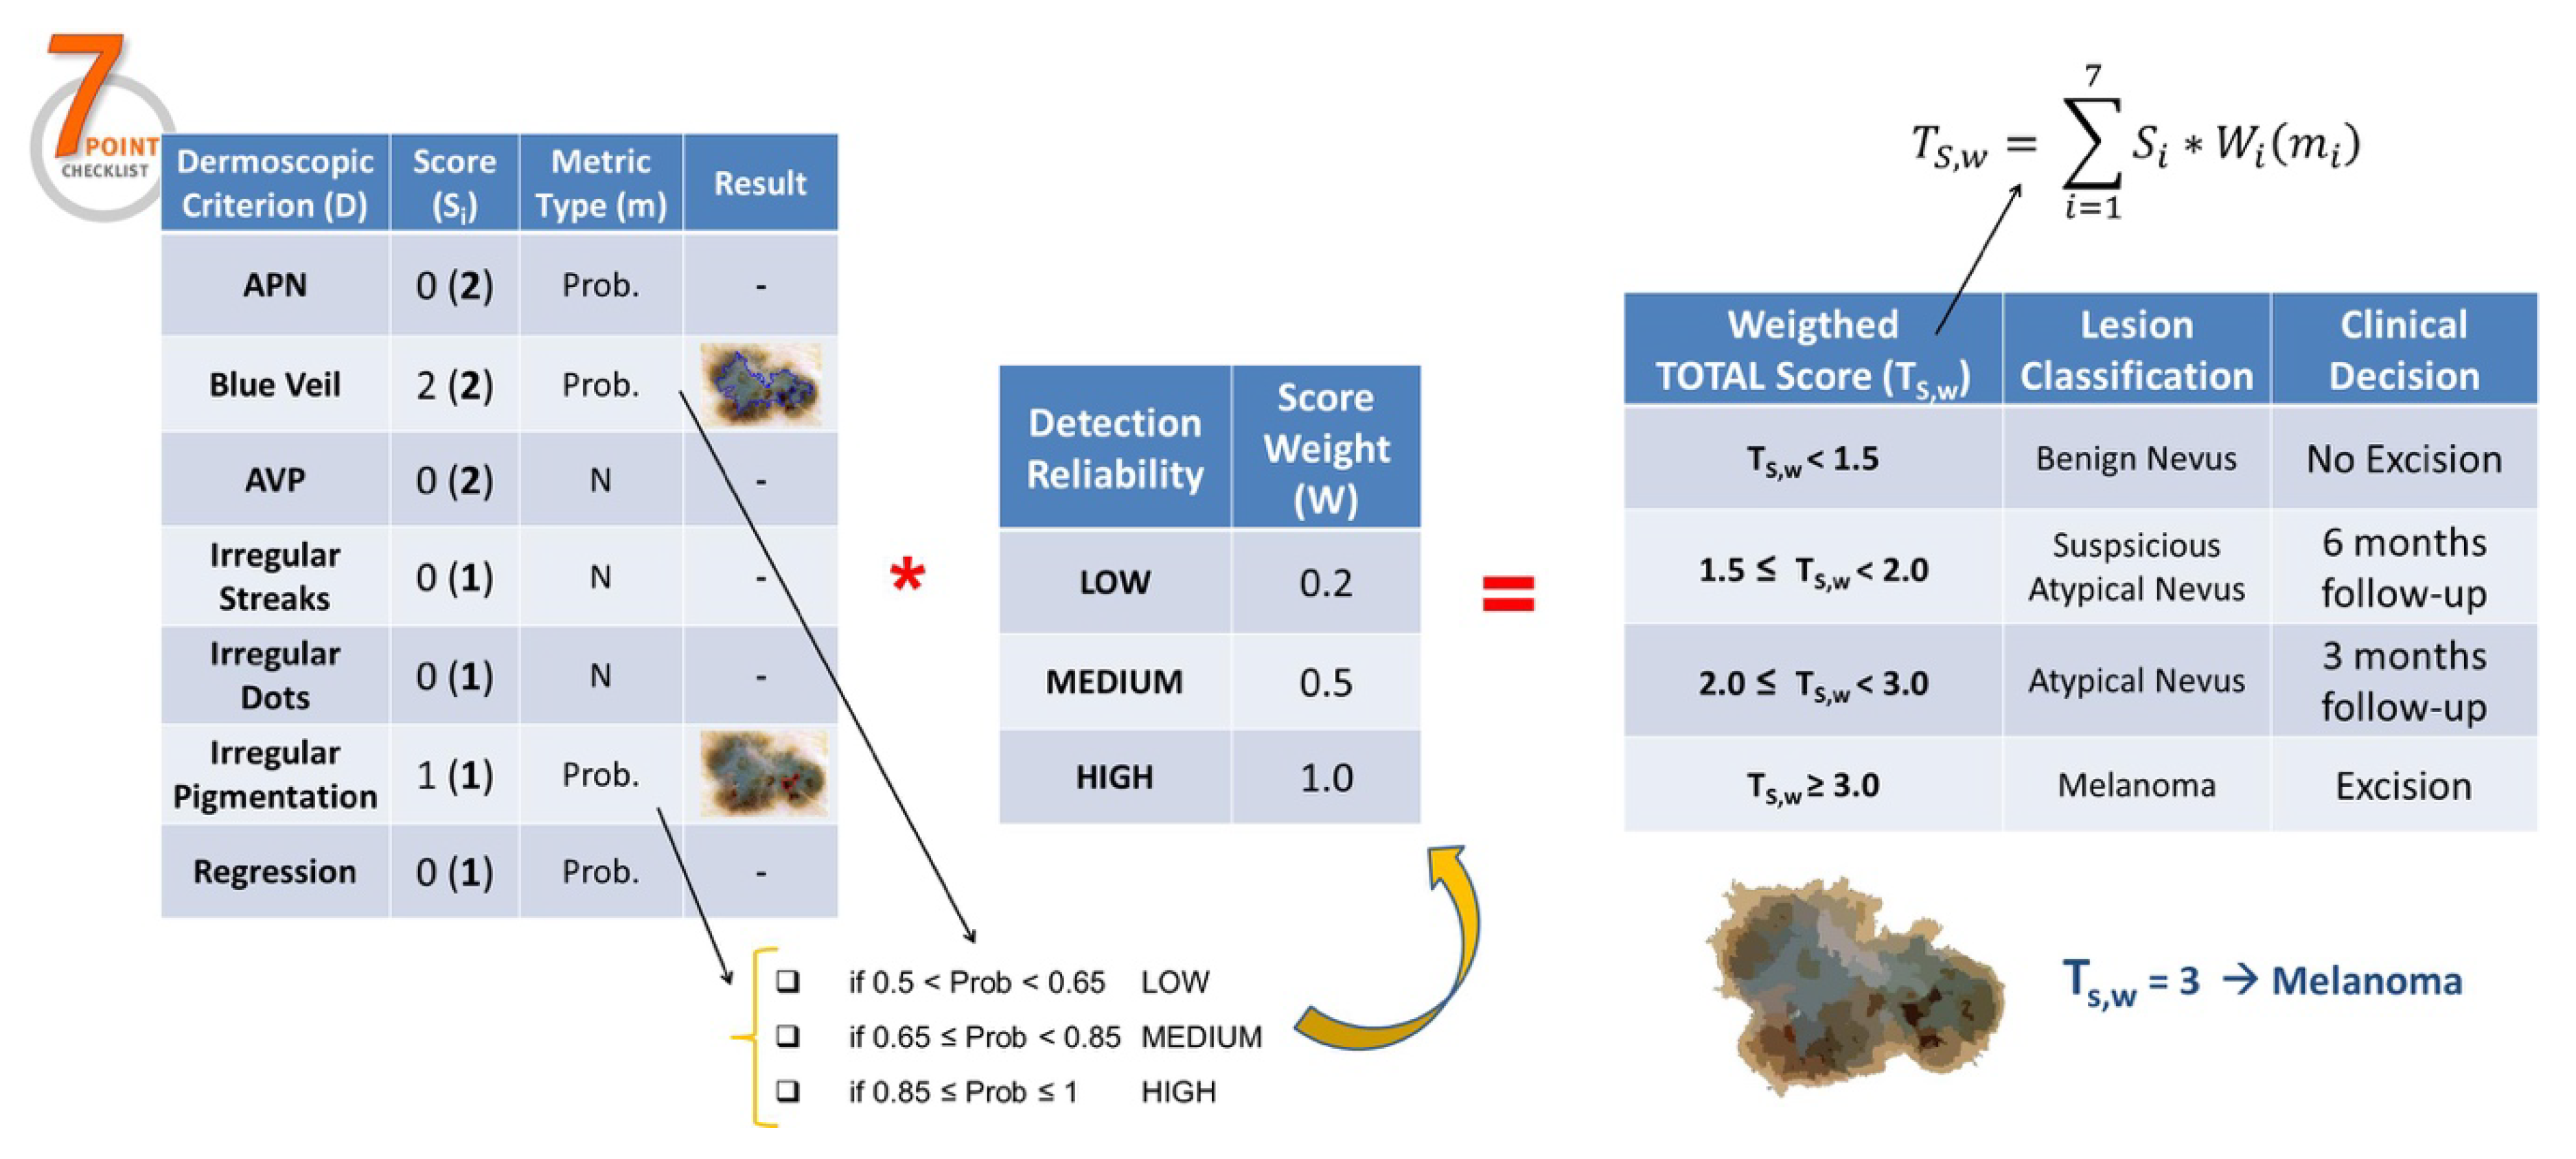
2.6. Lesion Classification

A weighted version of the 7-Point Checklist scoring system is suggested for the automatic lesion classification, which takes into account the detection algorithms previously described and the corresponding reliability. In detail, 3 constants have been associated experimentally to the reliability of the detection procedures (0.2, 0.5, and 1.0, corresponding to the low, medium, and high labels, respectively) and are adopted to weight the partial scores according to the detection uncertainty. Finally, the total score for the skin lesion is achieved by summing up the seven weighted scores, and the clinical decision is provided for the following-up or excision tasks, as briefly reported in Table 3.
The application of the authors’ proposal to an example of a dermoscopic image is depicted in Figure 8.

3. Results

A database including 270 ELM images of skin lesions and corresponding information (such as patient age and sex, lesion position, histology after excision) was collected during the continuous screening campaign by the Section of Dermatology, University Federico II of Naples, Italy, under the two-year tele-medicine project, “Di che segno è il tuo neo?” (2018–2019), which involved more than 200 patients and 25 local general practitioners. On the basis of a-posteriori analysis (biopsy) the dermoscopic database includes:
  • 107 benign nevi;
  • 99 atypical nevi (73 suspicious nevi);
  • 64 melanomas.
The corresponding digital images were acquired through iPhone 6/7 smartphones furnished with two dermoscope models (DermLite DL1 and MetaOptima Molescope I): Dimensions of the JPEG color images range from 700 × 447 to 2272 × 1520 pixels.
Aiming to estimate the performance of the proposed measurement and classification system, two groups of physicians were selected:
  • The expert dermatologists (ED) group including 3 physicians (B.B., S.C., M.A.) with clinical activity <10 years;
  • The non-expert dermatologists (NED) group including 3 physicians (C.C., A.M., F.C.) with less than 3 years’ experience in dermoscopy;
and the diagnosis, as well as the application of the Seven-Point Checklist method to each record of the database, were requested to the single dermatologist.
In detail, both the diagnostic and clinical accuracy have been evaluated by weighting the corresponding computation according to different class dimensions:
  • The former performance represents the weighted mean of sensitivity (i.e., the ratio of the correct detection of melanoma and the corresponding class dimension, 64) and specificity (i.e., the ratio of the correct detection of the benign/atypical nevi and the number of lesions not classified as melanoma, 206);
  • The latter performance takes into account the correct decision of both excisions (with respect to the group of lesions including melanomas and strongly atypical nevi) and of following-up/ignoring (with respect to the group of benign and suspicious nevi).
The automatic measurement and classification system (MS) has been implemented as Matlab routines at the different stages (image pre-processing, contour extraction, measurement of low-level feature, detection of dermoscopic structures, lesion classification) and executed as distributed code (jobs with multiple parallel tasks) on 64-bit Microsoft Windows computer, featured with Intel Core i7 CPU at 2.67 GHz and 6 GB RAM.
To evaluate the quality of the developed automatic system, the reference detection for the dermoscopic structures of each image was achieved by matching the biopsy results with the Seven-Point Checklist filed by the expert dermatologist (S.C.) who exhibited the best diagnostic and clinical accuracy. In detail, every dermoscopic structure should be detected if the corresponding lesion belongs to either a melanoma or strongly atypical nevus group.
The authors first evaluated the diagnostic concordance between the two dermatologist groups with different degrees of dermoscopy experience and the MS. Then, they considered the same parameters to evaluate the diagnostic performance of NED when helped by the MS during the dermoscopic diagnosis. In detail, after three months, the NED group was asked to re-examine the database which also included both the detection results (images highlighting the dermoscopic structures) corresponding to the single criterion and the overall lesion classification provided by the MS.
Table 4, Table 5 and Table 6 report, respectively, the Seven-Point Checklist scores and the diagnostic/clinical accuracy achieved by the dermatologist groups and the automatic measurement system.

4. Discussion

The different levels of experience are evident in the great amount of atypical dermoscopic structures detected by the NED group that did not lead to high diagnostic performance. Indeed, the results showed that in terms of the mean sensitivity (>87%), specificity (>92%), and therefore diagnostic accuracy (>92%), ED was the most reliable, forming the “ideal” reference. NED’s diagnostic performance gap compared with that of ED is much more important than the mean value of diagnostic accuracy (less than 7% compared to ED). This can be easily understood by observing the mean value of NED’s specificity (90%), which was maintained at a significantly lower sensitivity price (69% compared to 87% of ED), resulting in more lost melanomas.
It is interesting to note that the behavior of the automatic measurement system was similar, but specular to that of NED: Diagnostic accuracy was almost overlapping, but in this case, its value was guaranteed by good performance in terms of sensitivity (90%) with a significant loss of specificity (surplus excisions), with a value of 74% over 90% of the ED. The low specificity observed for the MS was in agreement with the literature data that identifies, like the main limit of the automated systems, the trend of excessive false positives, confirming, in our opinion, the impossibility to use any software system as a totally autonomous and independent diagnostic tool.
This limitation, however, was considerably reduced by the semi-automatic approach (see performance reported in Table 7 and Table 8), as a result of the effect of reciprocal compensation between sensitivity (better in MS vs. NED) and specificity (better in NED than MS). This compensation was also favored by the interaction of the diagnostic decision process, guaranteed by the fact that the MS underlined to the NED, for each identified parameter, the areas of the lesion in which each of the seven parameters of the Seven-Point Checklist had been recognized, meaning the dermatologist was able to agree or not with the obtained final score. This explains why, when assisted by MS, NED greatly improved its diagnostic sensitivity, without compromising its specificity and resulting in gain in diagnostic accuracy. The latter went from 85% for NED to 88% for NED + MS, reaching a value of only 4 percentage points less than the accuracy of ED.
Similar improvements also hold for clinical accuracy. Cohen’s Kappa test allowed us to verify the statistical validity of this data, excluding that the variation of diagnostic accuracy between NED and NED + MS had been purely random. It is important to point out that the MS was, from the beginning, designed with the aim of assisting and not replacing the clinician in the diagnosis of suspected pigmented lesions.
On the basis of the data in the literature, we concluded that an automated system cannot be considered as a totally independent diagnostic tool, but that a non-expert clinician could improve their own diagnostic performance if supported by a system that can overcome its limits, especially in terms of sensitivity.
Since its introduction in dermatology in 1950, dermatoscopy has spread widely in clinical practice, thanks to its non-invasiveness and easy accessibility. Numerous studies have shown that dermoscopy is able to improve the diagnostic performance of an expert dermatologist “like a bridge” between the clinic and histopathology [27,28]. The definition of dermoscopic criteria has led to the establishment of a real “dermoscopic semeiotic” in which each ELM criteria correlates to specific morphological and histopathological parameters. However, it has been shown that dermoscopy is a counter-productive tool for diagnostic accuracy when used by a NED [10,11]. In fact, dermatoscopy remains a highly operator-dependent method, despite the various dermoscopic algorithms (ABCD, Menzies method, Seven-Point Checklist, Three-Point Checklist) developed in order to simplify and standardize the diagnostic procedures to follow during a dermoscopic examination.
For this reason, in the last twenty years, an increasing interest in automated analysis of dermoscopic images of pigmented skin lesions has been developed to discriminate between melanoma and other pigmented skin lesions [29].
Several research groups have dedicated time to develop automated diagnostic systems capable of identifying dermoscopic criteria indicating malignancy [30]. Many of these systems are based on the ABCD algorithm. For example, Umbaugh et al. [31] developed an automated color segmentation algorithm used to identify the characteristics of cutaneous tumors. In 1999, Schmid and Schmid-Saugeon [32,33] proposed a pattern-based color segmentation without extraction. Two years later, Ganster and co. [34] developed an automated recognition system for melanoma, in which 21 different parameters were extracted from the images. More recently, Grana and colleagues [35] introduced a new algorithm based on the comparison by a gray scale of points extracted from the ELM images of pigmented lesions. In [12], an algorithm was described to diagnose pigmented lesions, by taking into account 64 analytical parameters, while a software for automatically evaluating 50 objective parameters of skin lesions (divided into 3 categories: Geometry, texture, and pigmented areas) was proposed in [29]. More than 400 further studies about automated diagnostic systems have been published since 2002: The review in [36] shows that computerized diagnosis systems have more diagnostic sensitivity than diagnostic specificity, which is less than classical dermoscopy practiced by experienced dermatologists, with a total diagnostic performance that can be overlapped. Other reviews about the automated melanoma diagnosis were published in 2011 and 2012 [37,38], and confirmed the high diagnostic accuracy and remarkable potential application of them in the clinical field. No previously published study has analyzed the application of automated systems to the Seven-Point Checklist diagnostic algorithm. The Seven-Point Checklist is still one of the most widely used algorithms in the clinical field [39] for the early detection of melanoma. We preferred using the classic Seven-Point Checklist to the revised one, for higher sensitivity. Thus, the classic Seven-Point Checklist would be more suitable processed by an automated software, which by itself tends to over-detect.

5. Conclusions

An image-based measurement system is proposed for the automatic detection of melanomas according to a well-known diagnostic method as support to the dermatologist activity. It adopts advanced statistical techniques to perform the main tasks (automatic recognition of the skin lesion within the dermoscopic image, measurement of morphological and chromatic parameters, detection of the dermoscopic structures included in the Seven-Point Checklist method, overall classification of the lesion) necessary for providing a second opinion about the clinical decision.
Main research efforts were addressed both to provide the reliability measurement about the intermediate results (in order to improve the lesion classification capability) and to validate the performance of the measurement system during clinical practice in dermatology departments. As a result, the automatic measurement system was not able to outperform the expert dermatologist group in terms of the diagnostic capabilities. However, it allowed the dermatologists with low dermoscopic experience (<3 years) to improve the sensitivity and overall diagnostic accuracy.
Although further studies are needed to confirm the validity of the preliminary results, the measurement system that we designed could be a valid support tool for the diagnostic process of dermatologists with low dermoscopy experience, increasing their diagnostic accuracy to that of an experienced dermatologist, resulting in a significant reduction in the number of melanomas left in place, especially in situ melanomas, with ambiguous and often misleading dermoscopic features, especially for non-expert dermatologists.
To further improve the automatic application of the Seven-Point Checklist, the next research will deeply investigate the dermoscopic structures’ correlations among the different classes of skin lesions, and take into account the measurement uncertainty associated with the multi-scale application of the proposed techniques for measuring low-level features. Moreover, the newly introduced convolutional neural networks (CNNs) will be also investigated to reduce the classification uncertainty associated with the dermoscopic criteria included in the 7-Point Checklist [40,41] and consequently improve the specificity of the measurement system.

Author Contributions

Conceptualization, C.L.; Data curation, A.M.; Investigation, S.C. and P.S.; Methodology, S.C., G.D.L. and P.S.; Project administration, G.F.; Software, G.D.L. and M.F.; Supervision, G.F.; Validation, M.S.; Visualization, M.F. All authors have read and agreed to the published version of the manuscript.

Funding

This research was funded by Regione Campania, grant number 5348 in the framework of POR FESR CAMPANIA 2014/2020 “Prevenzione e e diagnosi precoce attraverso networking digitale di patologie oncologiche cutanee”.

Conflicts of Interest

The authors declare no conflict of interest.

References

  1. American Cancer Society. Cancer Facts & Figures. 2019. Available online: https://www.cancer.org/content/dam/cancer-org/research/cancer-facts-and-statistics/annual-cancer-facts-and-figures/2019/cancer-facts-and-figures-2019.pdf (accessed on 21 January 2019).
  2. Glocker-Reis, L.A.; Melber, D.; Krapcho, M. SEER Cancer Statistics Review 1975–2005. National Cancer Institute. 2008. Available online: https://seer.cancer.gov/csr/1975_2005/ (accessed on 23 January 2020).
  3. Parkin, D.M.; Bray, F.; Ferlay, J. Global cancer statistics, 2002. CA: Cancer J. Clin. 2005, 55, 74–108. [Google Scholar] [CrossRef]
  4. Stolz, W.; Bilek, P.; Landthaler, M. Skin surface microscopy. Lancet 1989, 2, 864–865. [Google Scholar] [CrossRef]
  5. Clark, W.H.; From, L.; Bernardino, E.A. The histogenesis and biologic behaviour of primary human malignant melanomas of the skin. Cancer Res. 1969, 29, 705–727. [Google Scholar]
  6. Mihm, M.C.; Clark, W.H.; From, L. The clinical diagnosis, classification and histogenetic concepts of the early stages of cutaneous malignant melanomas. N. Engl. J. Med. 1971, 284, 1078–1082. [Google Scholar] [CrossRef] [PubMed]
  7. De Vries, E.; Bray, F.L.; Coebergh, J.W. Changing epidemiology of malignant cutaneous melanoma in Europe 1953–1997: Rising trends in incidence and mortality but recent stabilizations in western Europe and decreases in Scandinavia. Int. J. Cancer 2003, 107, 119–126. [Google Scholar] [CrossRef] [PubMed]
  8. Tromme, I.; Sacré, L.; Hammouch, F. Availability of digital dermoscopy in daily practice dramatically reduces the number of excised melanocytic lesions: Results from an observational study. Br. J. Dermatol. 2012, 167, 778–786. [Google Scholar] [CrossRef] [PubMed]
  9. Binder, M.; Schwarz, M.; Winkler, A. Epiluminescence microscopy. A useful tool for the diagnosis of pigmented skin lesions for formally trained dermatologists. Arch. Dermatol. 1995, 131, 286–291. [Google Scholar] [CrossRef]
  10. Kittler, H.; Pehamberger, H.; Wolff, K.; Binder, M. Diagnostic accuracy of dermoscopy. Lancet Oncol. 2002, 3, 159–165. [Google Scholar] [CrossRef]
  11. Piccolo, D.; Ferrari, A.; Peris, K. Dermoscopic diagnosis by a trained clinician vs. a clinician with minimal dermoscopy training vs. computer-aided diagnosis of 341 pigmented skin lesions: A comparative study. Br. J. Dermatol. 2002, 147, 481–486. [Google Scholar] [CrossRef]
  12. Blum, A.; Luedtke, H.; Ellwanger, U.; Schwabe, R. Digital image analysis for diagnosis of cutaneous melanoma. Development of a highly effective computer algorithm based on analysis of 837 melanocytic lesions. Br. J. Dermatol. 2004, 151, 1029–1038. [Google Scholar] [CrossRef]
  13. Betta, G.; Di Leo, G.; Fabbrocini, G.; Paolillo, A.; Sommella, P. Dermoscopic image-analysis system: Estimation of atypical pigment network and atypical vascular pattern. In Proceedings of the IEEE International Workshop on Medical Measurement and Applications, MeMeA 2006, Benevento, Italy, 20–21 April 2006. [Google Scholar]
  14. Di Leo, G.; Liguori, C.; Paolillo, A.; Sommella, P. An Improved procedure for the automatic detection of dermoscopic structures in digital ELM images of skin lesion. In Proceedings of the 2008 IEEE International Conference on Virtual Environments, Human-Computer Interfaces, and Measurement Systems, Istanbul, Turkey, 14–16 July 2008. [Google Scholar]
  15. Di Leo, G.; Fabbrocini, G.; Paolillo, A.; Rescigno, O.; Sommella, P. Towards an automatic diagnosis system for skin lesions: Estimation of blue-whitish veil and regression structures. In Proceedings of the 2009 6th International Multi-Conference on Systems, Signals and Devices, Djerba, Taiwan, 23–26 March 2009. [Google Scholar]
  16. Fabbrocini, G.; Betta, G.; Di Leo, G.; Liguori, C.; Paolillo, A.; Pietrosanto, A.; Sommella, P.; Rescigno, O.; Cacciapuoti, S.; Pastore, F.; et al. Epiluminescence image processing for melanocytic skin lesion diagnosis based on 7-Point Check-list: A preliminary discussion on three parameters. Open Dermatol. J. 2010, 4, 110–115. [Google Scholar] [CrossRef] [Green Version]
  17. Di Leo, G.; Paolillo, A.; Sommella, P.; Fabbrocini, G.; Rescigno, O. A software tool for the diagnosis of melanomas automatic implementation of the 7-Point Check list method. In Proceedings of the 2010 IEEE International Instrumentation and Measurement Technology Conference, Austin, TX, USA, 3–6 May 2010. [Google Scholar]
  18. De Vita, V.; Di Leo, G.; Fabbrocini, G.; Paolillo, A.; Sommella, P. Statistical image processing for the detection of dermoscopic criteria. In Proceedings of the 18th IMEKO TC4 Symposium on Measurement of Electrical Quantities 2011, Natal, Brazil, 27–30 September 2011. [Google Scholar]
  19. Di Leo, G.; Paolillo, A.; Pietrosanto, A.; Sommella, P.; Fabbrocini, G.; Cacciapuoti, S. A distributed measurement system for dermoscopic analysis of pigmented skin lesions. In Proceedings of the 2015 IEEE International Instrumentation and Measurement Technology Conference, Pisa, Italy, 11–14 May 2015. [Google Scholar]
  20. Argenziano, G.; Soyer, H.P.; De Giorgi, V. Interactive Atlas of Dermoscopy; EDRA Medical Publishing & New Media: Milan, Italy, 2002. [Google Scholar]
  21. Landwehr, N.; Hall, M.; Frank, E. Logistic Model Trees. Mach. Learn. 2003, 59, 161–205. [Google Scholar] [CrossRef] [Green Version]
  22. Nock, R.; Nielsen, F. Statistical Region Merging. IEEE Trans. Pattern Anal. Mach. Intell. 2004, 26, 1452–1458. [Google Scholar] [CrossRef] [PubMed]
  23. Sadeghi, M.; Razmara, M.; Wighton, P.; Lee, T.K.; Atkins, M.S. A Novel Method for Detection of Pigment Network in Dermoscopic Images Using Graphs. Comput. Medi-cal Imaging Graph. 2011, 35, 137–143. [Google Scholar] [CrossRef] [PubMed] [Green Version]
  24. Kirk, J. Count Loops in a Network. Available online: http://www.mathworks.com/matlabcentral/fx_files/10722/1/content/html/run_loops_html.html (accessed on 12 May 2009).
  25. Frangi, A.; Niessen, W.J.; Vincken, K.L.; Viergever, M.A. Multiscale vessel enhancement filtering. In Proceedings of the Medical Image Computing and Computer-Assisted Intervention, Cambridge, MA, USA, 11–13 October 1998. [Google Scholar]
  26. Mirzaalian, H.; Lee, T.K.; Hamarneh, G. Learning Features for Streak Detection in Dermoscopic Color Images using Localized Radial Flux of Principal Intensity Curvature. In Proceedings of the IEEE Workshop on Mathematical Methods in Biomedical Image Analysis 2012, Breckenridge, CO, USA, 9–10 January 2012. [Google Scholar]
  27. Argenziano, G.; Soyer, H.P. Dermoscopy of pigmented skin lesions—A valuable tool for early diagnosis of melanoma. Lancet Oncol. 2001, 2, 443–449. [Google Scholar] [CrossRef]
  28. Mayer, J. Systematic review of the diagnostic accuracy of dermatoscopy in detecting malignant melanoma. Med J. Aust. 1997, 167, 206–210. [Google Scholar] [CrossRef]
  29. Burroni, M.; Corona, R.; Dell’Eva, G. Melanoma computer-aided diagnosis: Reliability and feasibility study. Clin. Cancer Res. 2004, 10, 1881–1886. [Google Scholar] [CrossRef] [Green Version]
  30. Rubegni, P.; Cevenini, G.; Burroni, M. Automated diagnosis of pigmented skin lesions. Int. J. Cancer 2002, 101, 576–580. [Google Scholar] [CrossRef] [Green Version]
  31. Umbaugh, S.E.; Moss, R.H.; Stoecker, W.V.; Hance, G.A. Automatic color segmentation algorithms with application to skin tumor feature identification. IEEE Eng. Med. Biol. Mag. 1993, 12, 75–82. [Google Scholar] [CrossRef]
  32. Schmid, P. Segmentation of digitized dermatoscopic images by two-dimensional color clustering. IEEE Trans. Med. Imaging 1999, 18, 164–171. [Google Scholar] [CrossRef] [Green Version]
  33. Schmid-Saugeona, P.; Guillodb, J.; Thirana, J.P. Towards a computer-aided diagnosis system for pigmented skin lesions. Comput. Med. Imaging Graph. 2003, 27, 65–78. [Google Scholar] [CrossRef] [Green Version]
  34. Ganster, H.; Pinz, A.; Röhrer, R. Automated melanoma recognition. IEEE Trans. Med. Imaging 2001, 20, 233–239. [Google Scholar] [CrossRef]
  35. Grana, C.; Pellacani, G.; Cucchiara, R.; Seidenari, S. A new algorithm for border description of polarized light surface microscopic images of pigmented skin lesions. IEEE Trans. Med. Imaging 2003, 22, 959–964. [Google Scholar] [CrossRef] [PubMed]
  36. Rajpara, S.M.; Botello, A.P.; Townend, J.; Ormerod, A.D. Systematic review of dermoscopy and digital dermoscopy/artificial intelligence for the diagnosis of melanoma. Br. J. Dermatol. 2009, 161, 591–604. [Google Scholar] [CrossRef] [PubMed]
  37. Korotkov, K.; Garcia, R. Computerized Analysis of Pigmented Skin Lesions: A Review. Artif. Intell. Med. 2012, 56, 69–90. [Google Scholar] [CrossRef] [PubMed]
  38. Celebi, M.E.; Stoecker, W.V.; Moss, R.H. Advances in Skin Cancer Image Analysis. Comput. Med. Imaging Graph. 2011, 35, 83–84. [Google Scholar] [CrossRef] [PubMed]
  39. Argenziano, G.; Fabbrocini, G.; Carli, P. Epiluminescence microscopy for the diagnosis of doubtful melanocytic skin lesions. Comparison of the ABCD rule of dermatoscopy and a new 7-Point Checklist based on pattern analysis. Arch. Dermatol. 1998, 134, 1563–1570. [Google Scholar] [CrossRef] [Green Version]
  40. Kawahara, J.; Daneshvar, S.; Argenziano, G.; Hamarneh, G. Seven-point checklist and skin lesion classification using multitask multimodal neural nets. IEEE J. Biomed. Health Inform. 2019, 23, 538–546. [Google Scholar] [CrossRef]
  41. Alzahrani, S.; Al-Nuaimy, W.; Al-Bander, B. Seven-point checklist with convolutional neural networks for melanoma diagnosis. In Proceedings of the 2019 8th European Workshop on Visual Information Processing (EUVIP), Roma, Italy, 28–31 October 2019. [Google Scholar]
Figure 1. The software system for automatic diagnosis of melanoma.
Applsci 10 04351 g001
Figure 2. Detection of the blue-whitish veil: (a) Logistic model tree with regression models Fi(x) (with i = 1, blue-veil region, and i = 2, no blue-veil region); (b) lesion map (feature extraction); (c) regions classified as blue-whitish veil.
Applsci 10 04351 g002
Figure 3. (a) Logistic model tree (LMT) for classification with respect to regression; (b) epiluminescence microscopy (ELM) image and contour; (c) lesion map; (d) detection results.
Applsci 10 04351 g003
Figure 4. Detection of irregular pigmentation: (a) Lesion map; (b) area of interest.
Applsci 10 04351 g004
Figure 5. Detection of atypical pigmented network: (a) Lesion and superimposed contour; (b) result of the graph-based approach; (c) highlight of the atypical pigmented network (with high probability).
Applsci 10 04351 g005
Figure 6. (a) ELM image and lesion contour; (b) statistical region merging (SRM) segmentation of the lesion area; (c) automatic detection of AVP.
Applsci 10 04351 g006
Figure 7. Detection of irregular streaks: (a) ELM image and lesion contour; (b) the lesion area next to the border segment (blue line) is investigated (color segmentation based on SRM) searching for darkest regions; (c) finger-like structures are detected through; (d) automatic detection of Irregular Streaks.
Applsci 10 04351 g007
Figure 8. Application of the classification scheme for the clinical decision.
Applsci 10 04351 g008
Table 1. The automatic system based on Seven-Point Checklist: Definition and detection methods of major dermoscopic criteria.
ELM
Criterion
Atypical Pigment NetworkBlue-Whitish
Veil
Atypical Vascular Pattern
Score2
DefinitionProminent (hyperpigmented and broad) and irregular networkIrregular, confluent, gray-blue to whitish-blue pigmentation not associated with red-blue lacunes or maple leaf pigmentationLinear, dotted, or globular red structures irregularly distributed outside areas of regression
Histological correlatesHyperpigmented or broadened ridges with irregular shape or distributionPigmented melanophages or melanocytes of mid-reticular dermis locationNeovascularization or vascularized nets of amelanotic cells
Main featuresTextureColorStructures/color
Feature extractionStructural analysisPrincipal component analysis
2D thresholding
SRM
structural analysis
Feature classificationLogistic model treeLogistic model treeStatistical analysis
Table 2. The automatic system based on Seven-Point Checklist: Definition and detection methods of minor dermoscopic criteria.
ELM
Criterion
Irregular
Streaks
Regression StructuresIrregular PigmentationIrregular Dots/Globules
Score1
DefinitionRadially and asymmetrically arranged linear or extensions at the edge of the lesionWhite and gray-blue areas, peppering, multiple blue-gray dots associatedBrown, gray, and black areas of diffuse pigmentation with irregular shape or disruption and abrupt endBlack, brown, or blue round structures irregularly distributed within the lesion
Histological correlatesConfluent radial junctional nests of melanocytesAreas of loss of pigmentation and fibroplasias, with scattered melanophagesHyperpigmentation throughout all levels of epidermis or upper dermisAggregates of pigment of stratum corneum, junctional, or dermis location
Main featuresStructuresColorColorStructures
Feature extractionStructural analysis
SRM
SRMSRMSRM
structural analysis
Feature classificationStatistical analysisLogistic model treeLogistic model treeStatistical analysis
Table 3. Automatic classification according to the weighted scoring system.
Weighted TOTAL ScoreLesion ClassificationClinical Decision
T S , w < 1.5 Benign nevusNo excision
1.5      T S , w    < 2.0 Suspicious atypical nevus6-month follow-up
2.0      T S , w    < 3.0 Atypical nevusExcision
T S , w   > 3.0 MelanomaExcision
Table 4. Comparison of detection results by expert (ED)/non-expert (NED) dermatologist groups and automatic measurement system (MS).
EXAMINER

Dermoscopic Criterion
EDNEDMSBiopsy/
Reference
S.C.B.B.M.A.C.C.A.M.F.C.MS
Atypical pigment network86718593891069272
Blue-whitish veil54324710574355853
Atypical vascular pattern1528121937182818
Irregular streaks2411161819233223
Regression structures7415766635918768
Irregular pigmentation7453561221141034665
Irregular dots/globules6051557071638053
Table 5. Comparison of lesion classification results by expert (ED)/non-expert (NED) dermatologist groups and automatic measurement system (MS).
EXAMINER Performance IndexEDNEDMSBiopsy/
Reference
S.C.B.B.M.A.C.C.A.M.F.C.MS
Correct (/classified) melanoma (MN)59/6955/6854/6746/6742/6145/6655/10964
Correct (/classified) atypical nevus (AN)64/6765/7063/6853/6355/6453/6146/5273
Correct (/classified)
suspicious nevus (SN)
25/2621/2523/2725/3026/3525/3322/2426
Correct (/classified) benign nevus (BN)107/108107/107107/108107/110106/110107/11084/85107
Table 6. Performance of comparison of lesion classification results by expert (ED)/non-expert (NED) dermatologist groups and automatic measurement system (MS).
EXAMINER Performance IndexEDNEDMSBiopsy/
Reference
S.C.B.B.M.A.C.C.A.M.F.C.MS
Sensitivity %
[MNcorr_classif/MNReference]
92868472667086-
Specificity %
[(AN + SN + BN)corr_classif/(data − MNReference)]
96949490919074-
Diagnostic Accuracy %95929286858577-
Clinical Accuracy %94929186858577-
Table 7. Comparison of lesion classification by non-expert (NED) dermatologist group and semi-automatic approach (NED + MS).
EXAMINER Performance IndexNEDNED + MSMSBiopsy/
Reference
C.C.A.M.F.C.C.C.A.M.F.C.MS
Correct (/classified) melanoma (MN)46/6742/6145/6655/7753/7554/7655/10964
Correct (/classified)
atypical nevus (AN)
53/6355/6453/6152/5855/5853/5746/5273
Correct (/classified)
suspicious nevus (SN)
25/3026/3525/3324/2726/3124/3022/2426
Correct (/classified)
benign nevus (BN)
107/110106/110107/110107/108106/106106/10784/85107
Table 8. Performance comparison of lesion classification by non-expert (NED) dermatologist group and semi-automatic approach (NED + MS).
EXAMINER Performance IndexNEDNED + MSMSBiopsy/
Reference
C.C.A.M.F.C.C.C.A.M.F.C.MS
Sensitivity %
[MNcorr_classif/MNReference ]
72667086838486-
Specificity %
[(AN + SN + BN)corr_classif/(data − MNReference)]
90919089918974-
Diagnostic Accuracy %86858588898877-
Clinical Accuracy %86858588898877-

