Article

Vision-Based Sorting Systems for Transparent Plastic Granulate

1
Faculty of Mechanical Engineering, University of Maribor, Smetanova ulica 17, 2000 Maribor, Slovenia
2
Plastika Skaza d.o.o., Selo 22, 3320 Velenje, Slovenia
*
Author to whom correspondence should be addressed.
Appl. Sci. 2020, 10(12), 4269; https://doi.org/10.3390/app10124269
Submission received: 23 April 2020 / Revised: 16 June 2020 / Accepted: 18 June 2020 / Published: 22 June 2020
(This article belongs to the Special Issue Applications of Computer Vision in Automation and Robotics)

Abstract

:
Granulate material sorting is a mature and well-developed topic, due to its presence in various fields, such as the recycling, mining, and food industries. However, sorting can be improved, and artificial intelligence has been used for this purpose. This paper presents the development of an efficient sorting system for transparent polycarbonate plastic granulate, based on machine vision and air separation technology. The developed belt-type system is composed of a transparent conveyor with an integrated vision camera to detect defects in passing granulates. The vision system incorporates an industrial camera and backlight illumination. Individual particle localization and classification with the k-Nearest Neighbors algorithm were performed to determine the positions and conditions of each particle. Particles with defects are further separated pneumatically as they fall from the conveyor belt. Furthermore, an experiment was conducted whereby the combined performances of our sorting machine and classification method were evaluated. The results show that the developed system exhibits promising separation capabilities, despite numerous challenges accompanying the transparent granulate material.

1. Introduction

Plastic waste is present almost all over the planet and poses serious problems to living organisms and the environment. Such types of waste have decomposition periods in the environment of more than 100 years [1]. Therefore, they should be introduced into the environment as little as possible. Waste plastic decomposes into fragments under five millimeters in size. Such particles are microplastics and are ubiquitous in marine and terrestrial environments, and even in the water we drink [2]. They are also present in other organisms, particularly in marines, which is undesirable. Therefore, plastic waste must be managed correctly to prevent it from reaching the environment [3].
Recycling and reuse are more effective ways to reduce the accumulation of plastic waste, including plastic products that have lost their functionality or have defects from their manufacture. Such products could be of different colors or have some patterns on them, but they can also be transparent. When reusing transparent plastic products, all of the impurities must be removed. Potential impurities have a strong impact on recycled products. They affect their mechanical and visual properties. To this end, sorting machines are used to remove impurities from the mix of used ground plastic [4]. The classification of plastics is essential in the recycling industry, because only in this way can different plastics be separated from one another [5,6]. The sorting machines are of many configurations and operate on different principles for the detection of recycled materials.
There are various techniques for identifying and sorting polymers. Some of these techniques include manual sorting, density separation, electrostatic processes, and various optical systems, including optical inspection using photodiodes or charge-coupled device (CCD) machine vision, near infrared (NIR), ultraviolet (UV), X-ray analysis, and fluorescent light or laser radiation [7].
The most basic non-automated sorting is manual sorting. Manual sorting is prone to error, expensive, tedious, and can be unsafe [7].
Density separation systems are used to separate particles with higher densities than water from buoyant ones. Here, the density of particles must significantly differ [7,8].
Electrostatic separation systems are used to separate a mixture of plastics that can acquire different charges through triboelectrification. It is not suitable for sorting complex mixtures and the particles must be clean and dry [7,9].
Optical systems, which are based on color imaging (Visible light—VIS) sensors can separate different plastics, primarily by color [10]. Problems only arise when the difference between the different colors is very small [11]. In that case, more advanced methods should be used.
Spectrometer and Hyperspectral Imaging are used with a wavelength above a visible range. The former only captures the point and the latter captures the entire line [4]. The most used ranges are VNIR (Visible and near infrared light; 400–1000 nm) and NIR (Near infrared; 800–2500 nm) [10,12]. The purity of the material in reuse is related to the quality of the product. A lot of research has been done to separate the various types of plastics, such as acrylonitrile butadiene styrene (ABS), polystyrene (PS), polypropylene (PP), polyethylene (PE), polyethylene terephthalate (PET), and polyvinyl chloride (PVC). These plastics can be separated from each other completely by spectrography [12,13]. Information on the composition of the material can also be obtained by using spectrometry [14,15]. For better performance, NIR hyperspectral methods are integrated with artificial intelligence methods [16]. These methods are very effective in separating different materials from one another. When looking for differences in the same material with different colors, these methods are less accurate.
X-ray is suitable for the identification of polyvinyl chloride (PVC) from polyethylene terephthalate (PET). X-ray may involve higher system complexity and also health risk [10].
Laser technique offers less-than-a-microsecond fast identification of plastic based on atomic emission spectroscopy. A laser is used to release excited ions and atoms from the material surface, and these can then be identified through spectral analysis to provide polymer type and additives present [7,17,18].
Sorters based on CCD cameras and machine vision occur mainly in sorters of various objects. Support vector machines and artificial neural networks are popular choices for classifiers. Thus, a sorter was developed that separates various objects, such as gears, coins, and connectors [19].
Methods of machine vision, such as deep learning, are emerging in waste sorting. With such methods it is possible to classify and detect various objects, such as glass bottles, paper boxes, paper cups, ceramic plates, and so on [20].
Most of the methods of machine vision in sorting occur in food production. Thus, various defects on crops, such as tomatoes, oranges, lemons, eggs, seeds, and almonds, are inspected with deep learning [21,22,23], support vector machines [24], neural networks [25], and k-Nearest Neighbors [26].
These methods are also used in the processing of foods, such as fish and chicken. The quality is checked or certain parts of the animal are identified [27,28].
There are also simpler methods for checking seed coloration by counting pixels of a particular color [29].
Researching the sorting machines, it was found that there were different manipulators for the physical separation of particles. These are various pneumatic, electrical, and hydraulic manipulators for sorting larger objects. Ejecting with compressed air and pneumatic nozzles for smaller objects is also widely used [30,31,32]. There are also advanced algorithms for tracking and simulating single particle excretion. These algorithms are able to track objects on the conveyor belt and separate them from other objects with great precision [33,34,35].
In this research, the development of a real-time sorting machine for sorting transparent plastic granulate with a lot of different defects was presented. These defects are different black dots, blurs, burns, etc. These products are unusable. This can be done by turning the product into base material for new plastics. In the recycling process, defects caused by product injection molding must be eliminated. For this purpose, a polycarbonate (PC) granulate sorting machine was developed, which removes particles with these defects.
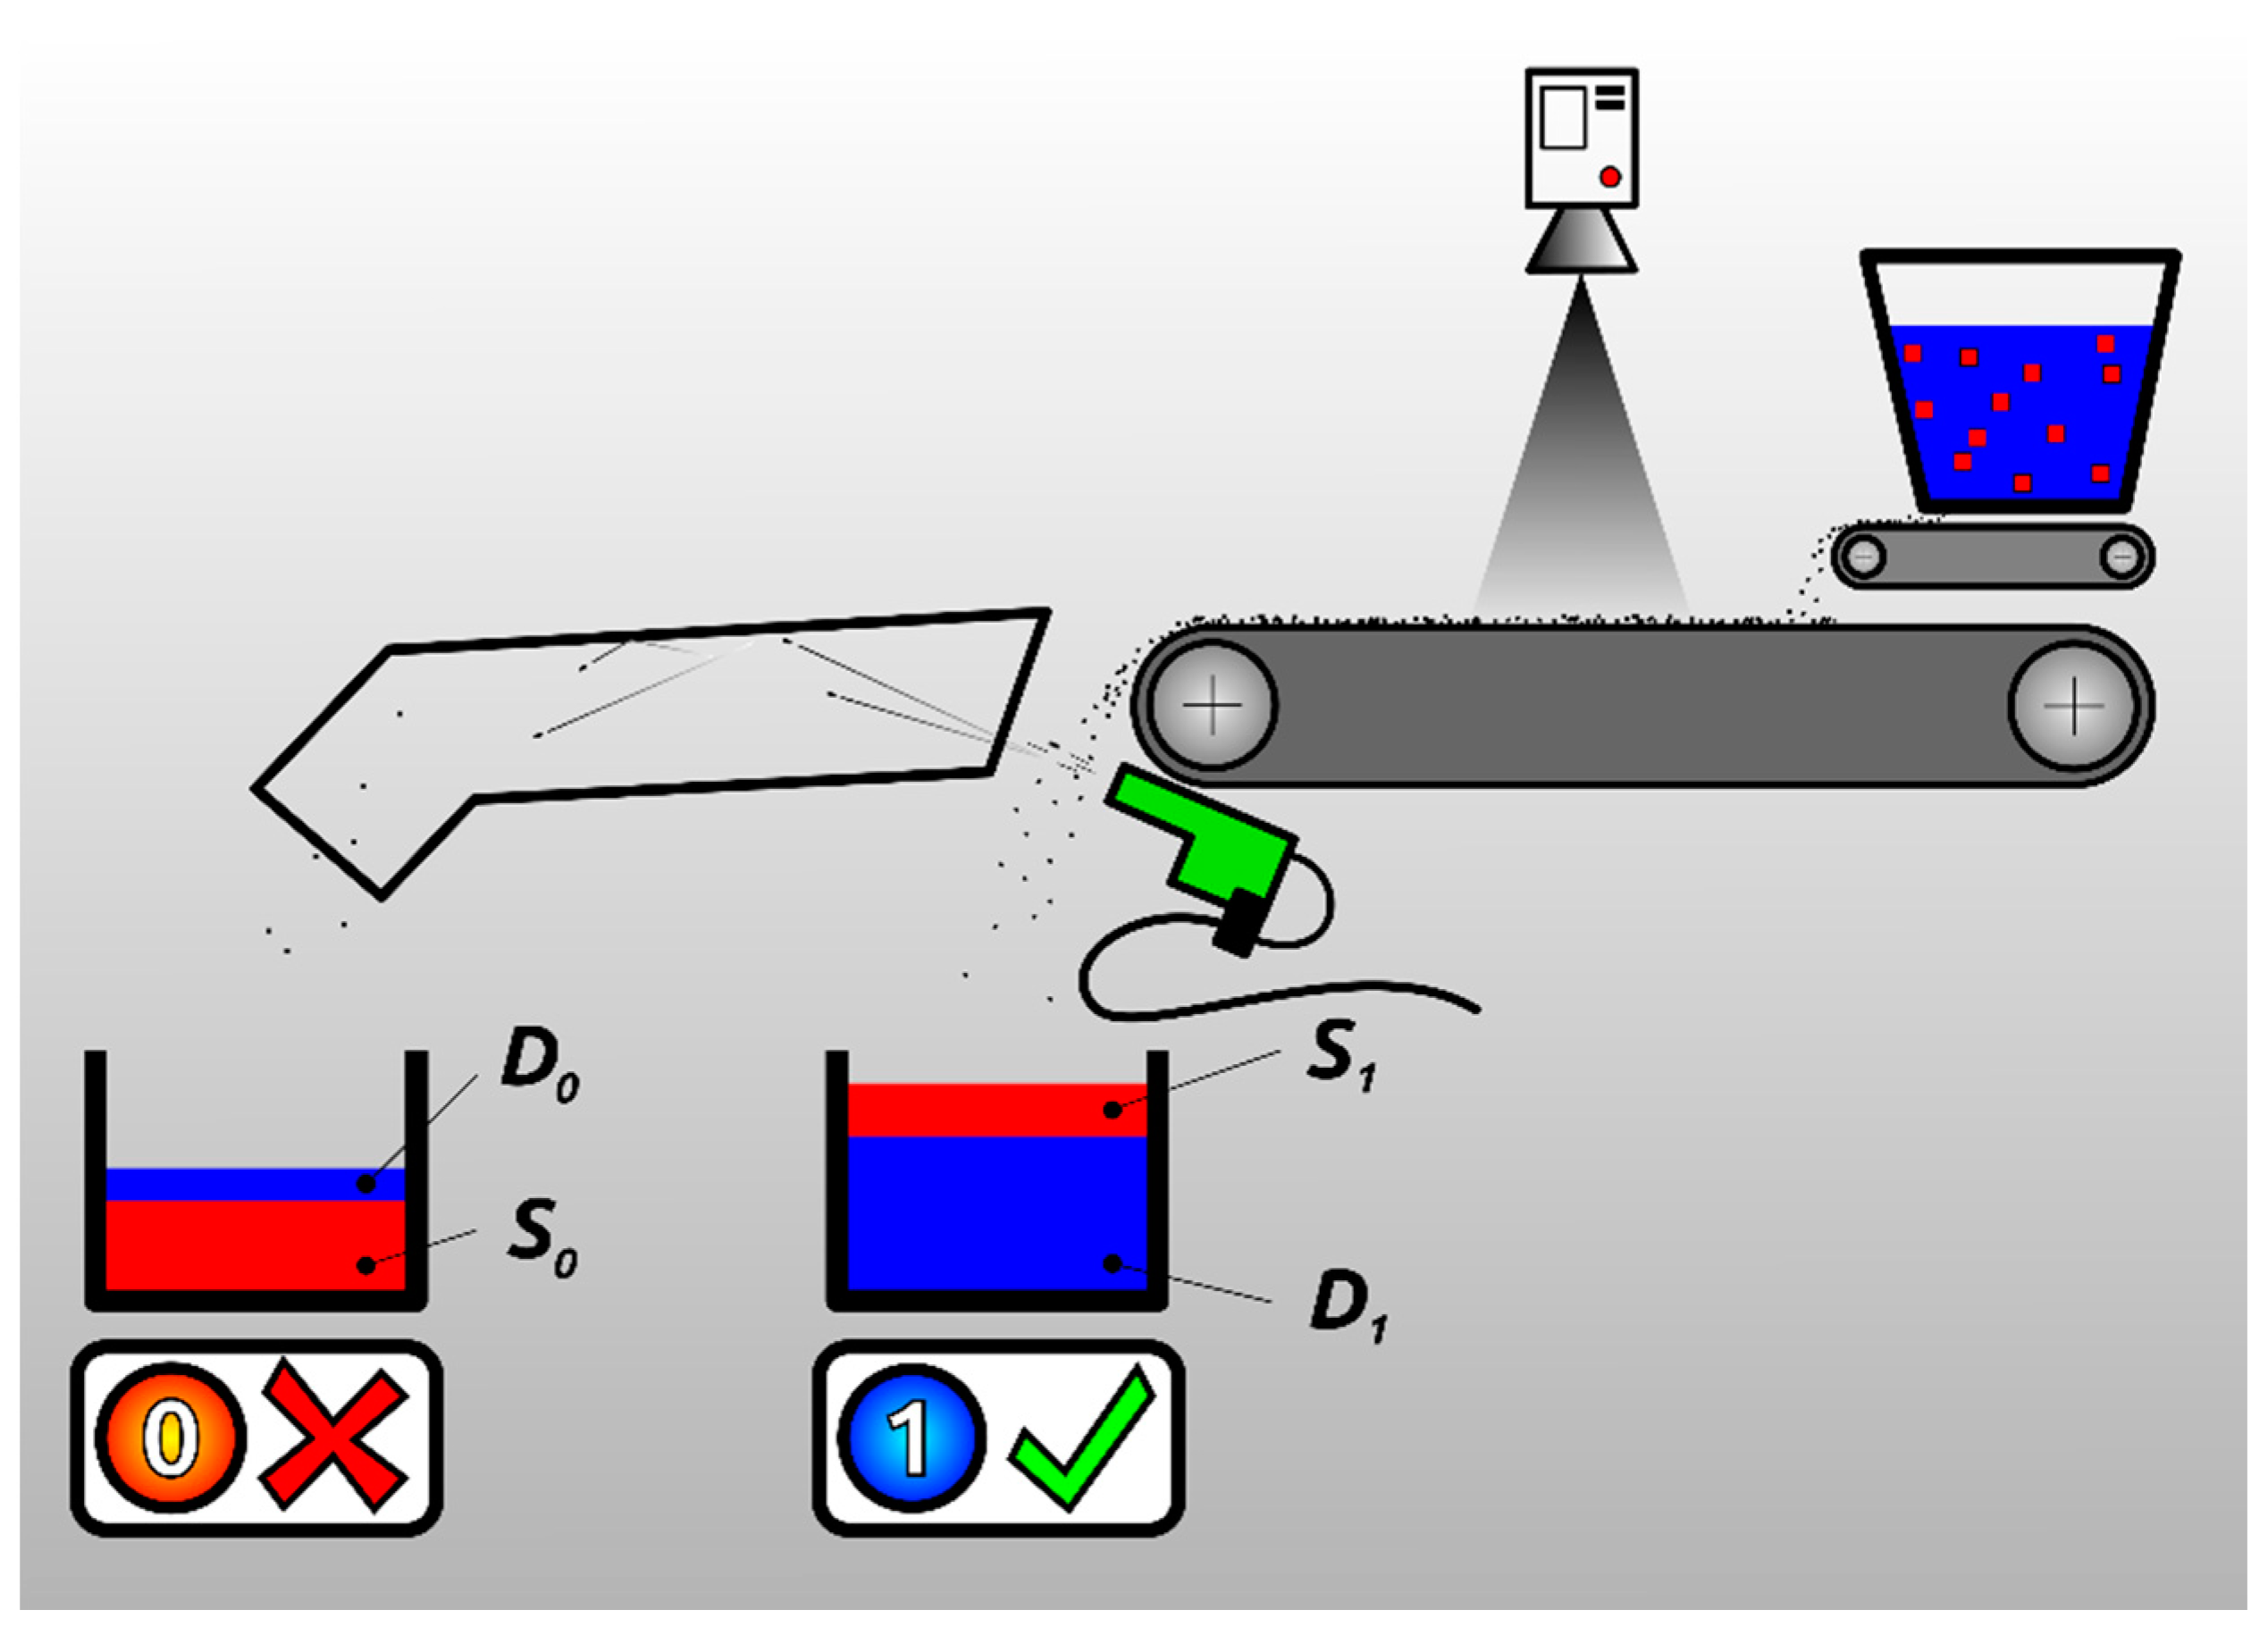
The developed sorting machine made an optical control of the granules with the help of a camera operating in the visible range of light. The particles needed to be inspected, so machine vision was used. Machine vision searched for each individual granule in the image and classified it using the k-Nearest Neighbors (k-NN) method. This method was chosen based on the datatype and application requirements. The images to be processed were of size (40 × 40 pixels), which is very small in comparison to images used in conventional machine vision applications. Granule classification requires real-time processing, so a fast and efficient algorithm is needed. The physical sorting of the granules was performed with air nozzles.
Existing sorters offer the sorting of particles by color and size, and some can even determine the composition of the material the particle is made of. The developed prototype sorter uses machine vision and artificial intelligence methods. With these methods, each individual transparent particle can be classified according to the training database so one can determine whether they are to be ejected. The sorting machine can check their color and any irregularities that may appear in a particle.

2. Materials and Methods

2.1. Materials

2.1.1. Hardware of the Sorting Machine

The development of the sorting machine began in Solidworks 3D modeler. The 3D model was always changing throughout the development, and the final version is presented in Figure 1. The sorting machine hardware consisted of a mechanical part and a control part.
The main part of the mechanical part was a conveyor with a transparent conveyor belt, as shown in Figure 1. The belt was 3 mm thick and made of polyurethane. The width of the belt was 140 mm, the length was 600 mm, and the diameter of the conveyor rollers was 50 mm. The conveyor was driven by a three-phase electro motor with a power of 0.37 kW and a speed of 1370 rpm. Engine speed could be adjusted with the Mitsubishi FR-S520SE-0.2K-EC (Mitsubishi Electric, Tokyo, Japan) inverter. The speed of the belt could be adjusted from 0 to 0.55 m/s.
A feeder oversaw the dosing of the granules to the main conveyor. It consisted of a smaller conveyor on which the granule tank was mounted, as shown in Figure 1. The conveyor was powered by a three-phase electro motor with a power of 0.09 kW and a speed of 1360 rpm. The gearbox ensured the proper speed. Engine speed could be adjusted with the Mitsubishi FR-S520SE-0.2K-EC inverter. The material quantity that was being filled onto the conveyor varied, depending on the speed of the feeder belt and the size of the tank opening.
The material sorting air nozzles consisted of nozzles 1 mm in diameter and 5 mm in spacing, as shown in Figure 1. The air nozzles were connected by pneumatic tubes to a valve block, on which each nozzle had its own pneumatic valve SMC SX11F-GH (SMC Corporation, Tokyo, Japan). The air nozzles were located under the conveyor belt and required a compressed air source and a pressure regulator.
An Industrial Controller managed the entire sorting machine. A camera was mounted above the conveyor to capture the images of material lying on it, as shown in Figure 1. The illumination was positioned below the conveyor in the background configuration, as shown in Figure 1. An encoder with a resolution of 1024 signals per rotation RLS RE22IC0410B30F2C00 (RLS, Pod vrbami, Slovenia) was mounted on the conveyor for position measurement. Both 24 V and 5 V power supplies were required to power the components. A catcher of separated and ejected material, as shown in Figure 1, and adaptive circuits for switching the valves and motors were needed.
Image processing was performed on an Industrial Controller (IC) National Instruments IC-3173 (National Instruments, Austin, Texas, ZDA). The controller had an Intel Core i7-5650U processor; 2.2 GHz, 8 GB RAM. The Industrial Controller also had Field-Programmable Gate Array (FPGA) Xilinx Kintex-7 XC7K160T for the faster processing of lower-level algorithms. A Basler CMOS camera (Basler, Ahrensburg, Germany), model acA2500-14uc was used for image capture. The camera was capable of recording at 14 frames per second at a 2590 × 1942 pixels (5 MP) resolution, and was used with an Opto Engineering 5 Megapixel 12 mm lens.

2.1.2. Samples

The sorting material comprised transparent polycarbonate (PC) in the granules, as shown in Figure 2. The granules were 3 mm wide, 4 mm high, and 2 mm thick. The granules were of different colors. Other defects on the granules were spots that represent burns that can form during the plastic injection process. Through sorting, all of the granules with impurities must be ejected. Only completely transparent material, as shown in Figure 2a, is acceptable for reuse.
An image database was created for learning and testing the classifier. All 9 classes are listed in Table 1. For each class, 1000 images of individual granules were made, as shown in Figure 2. This database was used to train and test the classifier.

2.2. Methods

2.2.1. Image Acquisition

The camera was triggered by a hardware trigger from the controller. The camera sent the captured image to the controller where the machine vision was executed. A universal serial bus (USB) 3.0 was used for image transfer. The Region of Interest (ROI) size was 57 × 77 mm.
A key part of the machine vision system was lighting. Without consistent illumination quality, images could not be captured. A 48 W light emitting diode (LED) light with color temperature 6000 K was used to illuminate the granules. Granulate illumination is specific, because of reflection on its surface. Therefore, illumination was placed under the conveyor belt in a backlight configuration. Two diffusers were used for more even light. One was mounted directly on the light, the other below the conveyor belt, as shown in Figure 1.

2.2.2. Image Processing

Before processing, the image was captured and stored in a buffer. The images were processed with delay to save time. This means that, while one image was captured, the other was processed. In classic processing, the image would be captured and processed immediately. Thus, the time it took to capture a camera image and transfer the image to a computer was lost. This time would be difficult to save in real-time applications of image processing.
The overall image processing was separated into two main parts. These were the localization and classification of the granules.
At localization, the originally captured images were reduced to 37% of their original size, as shown in Figure 3a, to speed up the image processing time. Then, the RGB green color extraction was performed and the correct brightness was set, as shown in Figure 3b. We then applied a Modified Sauvola threshold [36,37], which makes a binary image with only granules, and some small regions which do not represent granules, as shown in Figure 3c. The processed image was sent to a filter to remove small regions of the image that did not represent granules, as shown in Figure 3d. Finally, the Particle Analysis method from LabVIEW National Instruments software was carried out, which gave us the x and y coordinates of the granules that were in the image. The x and y coordinates of the granules represented the center of mass of the object in the image. The Particle Analysis method takes some time to implement but it is critical to the operation of the sorter.
At the conveyor’s full speed, image processing took up to 100 ms. The actual time needed for processing depended on the number of particles in the image. Image capture, granule localization and classification were performed during this time. When a new image capture was triggered, the image capture was started, and the previous image was processed. Thus, the image capture and the processing were performed in parallel. The image buffer and image minimization saved 92 ms in image processing time. Without the implementation of the described procedure, the total image processing time would have been almost 200 ms.
Only granules which were completely transparent and error-free were accepted. Therefore, a color classifier was used. All the granules found in the image were examined by the classifier. The granule location data from Particle Analysis were taken, and the granule image was cut at the granule location and sent to the classifier. The cropped image size was 40 × 40 pixels. Each cropped image was converted to the HSL color space. Then, the hue, saturation, and luminance histograms of the color sample were calculated. The hue and saturation histograms each contained 256 values, and the luminance histogram was reduced to 8 values. Combined, the 520 hue, saturation, and luminance values produced a high-resolution color feature vector. Because very fast real-time processing is required, the dimensions of the feature vector were reduced using a dynamic mask. A reduced color feature vector contains 128 hue and saturation values and 8 luminance values—for a total of 136 values—and represents the input to the classifier. By suppressing the luminance histogram into eight values (12.5% reduction), the algorithm accentuated the color information for the sample.
Color feature vector of granule image was sent to color classifier, which was based on the k-NN algorithm. This is a statistical method for classification based on the nearest neighbor [38]. This method was characterized by Lazy Learner, because it does not learn in advance, but only when it receives a classification requirement. When a method receives a classification request, it compares the data obtained with those of its database. It finds the closest or k-Nearest Neighbors (k-NN) based on Euclidean distance [39]. The accuracy of the k-NN classification changes as the number of neighbors change and varies from case to case.
The granules were ejected based on the classification results. If a granule was detected as an error granule, its coordinates were stored in the circular buffer for ejecting.

2.2.3. Evaluating the Classifier

A confusion matrix was used to demonstrate the effectiveness of the classification. Table 2 presents the confusion matrix for classification into several classes. For example, a classifier sorts a problem into specific classes. The output of the classifier may be one of the following possible cases. For example, if particle belongs to the class C2 and is classified as of class C2, the result is a True Positive. If the classifier predicts a C2 particle to be of some other class than C2, the result is a False Negative, designated by β in Table 2. If the classifier predicts a non C2 particle to be of class C2, the result is a False Positive (α) [40,41]. While making predictions on C2 particles, we did not provide data from any other classes, so each particle that was not analyzed and not classified as C2 was a True Negative (γ).
The performance of our classifier was evaluated by three metrics which determined its positive predictive value (1), hit rate (2), and accuracy (3). The precision of the class tells us how many predictions, which the model considered positive, were actually positive. It was calculated as a ratio between True Positives and all positive predictions for the class in question. Ideally, the precise model would never falsely classify other particles to be of the class in question (i.e., no False Positive predictions). However, even an ideally precise model can still make an error of not recognizing that a particle belongs to the certain class. That is the reason for a metric called recall. This tells us how many of class C particles were correctly classified. This was calculated as the ratio between the True Positives and all samples of the class in question. The model with the ideal recall would never make a mistake of falsely predicting a class C particle to be of some other class (i.e., no False Negative predictions). Lastly, we have the metric accuracy, which provided overall prediction quality for each class. It was calculated as a ratio between all true predictions and a total population.
Precision:
p r e c i s i o n = T P T P + F P
Recall:
r e c a l l = T P T P + F N  
Accuracy for one class:
a c c u r a c y = T P + T N P + N
Accuracy for the whole confusion matrix:
A C C = Σ   T r u e   P o s i t i v e + Σ   T r u e   N e g a t i v e Σ   T o t a l   p o p u l a t i o n

2.2.4. Sorting Procedure

The sorting algorithm worked based on a circular buffer. The location information of the granules was obtained from the particle analysis. The coordinate x was used (by the width of the image) to determine which valve should activate and eject the granule. The y coordinate (image length) was used to determine the moment of opening of the pneumatic valve to eject the granule, as shown in Figure 4.
The distance between the granule in the image to be ejected and the nozzle was measured by an encoder. The encoder was mounted on a driven conveyor roller. The belt moves were determined by the encoder pulses. The y coordinate of the granulate, which represented the distance from the image edge, is Yr. Yr was converted from the pixel value to the number of encoder pulses and added to a constant Ye, representing the number of pulses from the image to the air nozzles, as shown in Figure 4. The value of pulses for ejecting Ys was written to the circular buffer running on the FPGA. The FPGA monitored the encoder value, and opened the air valve for the nozzle, according to the values in the circular buffer.

3. Results and Discussion

The chapter, Results and Discussion, is divided into two parts. The first part presents the in silico results of the classification of the granules into nine classes and into two classes. In the second part, the in vivo results of physical sorting on the prototype sorting machine are presented.

3.1. Classification Results

3.1.1. Classification into Nine Classes

Classification was done with the composite image database. The granulate images were uploaded into a k-Nearest Neighbors algorithm (k-NN) color classifier. The classes were designated by numbers 1–9. The class names are listed in Table 1. A set of 850 learning and 150 testing images were used for each class. Only one nearest neighbor (k = 1) was used. With the current image database, the k-NN algorithm with one neighbor got the best results. The same applied for the classification into two classes.
Table 3 shows the result of the classifications. They are represented in the confusion matrix. The columns for each class indicate how many granules were allocated to each class.
Calculation of the classification accuracy into nine classes, according to Equation (3). The calculated average accuracy (ACC) was 90.5%.
The results from Table 3 show that all the granules in class 1 (clean) were classified correctly. In testing other classes, only in one case was the granule recognized as clean, but was not clean. When sorting, it is important to classify clear granules and defective granules precisely, because the sorting machine also separates the material into clean granules and defective granules.

3.1.2. Classification into Two Classes

The sorting algorithm sorts the material into clean granules and defective granules, so, classification was made on clean and defective granules. A set of 850 learning and 150 testing images were used for each class. Only one nearest neighbor (k = 1) was used, as with the nine-class classification. Images of clean granules without defects were used in the clean (OK) class. A mix of other images with defectives granules were used in the defective (NOK) class. Table 4 shows the results of the classifications. All the granules were classified correctly.
Calculation of the classification accuracy into two classes was performed using Equation (3). The calculated accuracy was 100%.
Table 4 shows the results of k-NN classifications on clean (OK) and defective (NOK) granules. The classifier was capable of separating granules with 100% accuracy. Because the classification worked with 100% accuracy, any errors that occurred in sorting were the result of other influences. These were the physical effects of the adhesion of the granules to the conveyor and cohesion forces between the granules.

3.2. Sorting Results

The classifier was tested on a prototype sorting machine. A test mixture of granules was prepared, into which clear granules and defective granules were placed. Defective granules represented 10% of the total mixture.
Testing was performed with five different settings for the feeder and the conveyor. The settings are given in Table 5. The parameters are explained in Table 6. Table 7 shows the sorting results.
Three repetitions of the test with the same sorting machine settings were made with the granule test mixture. Table 7 provides averages of the results of these three tests. The variable parameters were the speed of the conveyor and the speed of the feeder belt. The influence of how densely the granules were arranged on the conveyor was changed by adjusting these two parameters. The size of the opening on the feeder was constant.
Adjusting the conveyor speed also affected how many frames per second should be captured, and in what arc the granules would fall past the air nozzles unit below the conveyor. The faster the conveyor, the faster the image processing should be. At the full speed of the conveyor, image processing took up to 100 ms. This was 10 frames per second, so the camera was fast enough for image capturing.
A schematic presentation of the testing system is shown in Figure 5. The clean granules are represented by the representatives of the clean granules class. Defective granules are a mixture of all other classes. Figure 5 shows two boxes for sorted material. After sorting, Box 1 would ideally contain only clean material. Box 0 contains defective ejected granules.
After examining Table 7, the following was determined:
  • Sorting speed was measured and depends exclusively on the speed of the feeder belt. The faster the feeder belt rotates, the faster the test is completed.
  • The parameter λ tells us how densely granules are arranged on the conveyor. Table 7 shows that they were most densely bulked in test 2, And most sparsely in test 1, which also had the highest sorting quality.
  • The sorting capacity (kg/h) depends on the speed of the feeder belt.
  • The highest quality of the separated granules (ni_1) and the quality of the ejected granules (ni_0) was achieved with the parameters of test 1—this means at maximum conveyor speed and minimum feeder belt speed. The quality of the separate granules (ni_1) is the most important parameter, because it tells us how clean the material is after sorting.

4. Conclusions

A prototype sorting machine for the rejection of defective plastic granulates has been developed. Research started with capturing images of samples and preparing a training–testing database. There were nine classes in the database. Each class had 850 images to teach and 150 images to test the k-NN classifier. The classification performance in nine grades was 90.52%.
The classification of only two classes was initially carried out. These were defective granules (NOK) and clean granules (OK). Only clear transparent granules were in the OK class. In the NOK class was a mix of defective granules. The classification accuracy, using a k-NN classifier of backlit optical images for the two classes, was 100%. This means that the sorting machine was capable of at least separating the granules theoretically with 100% accuracy.
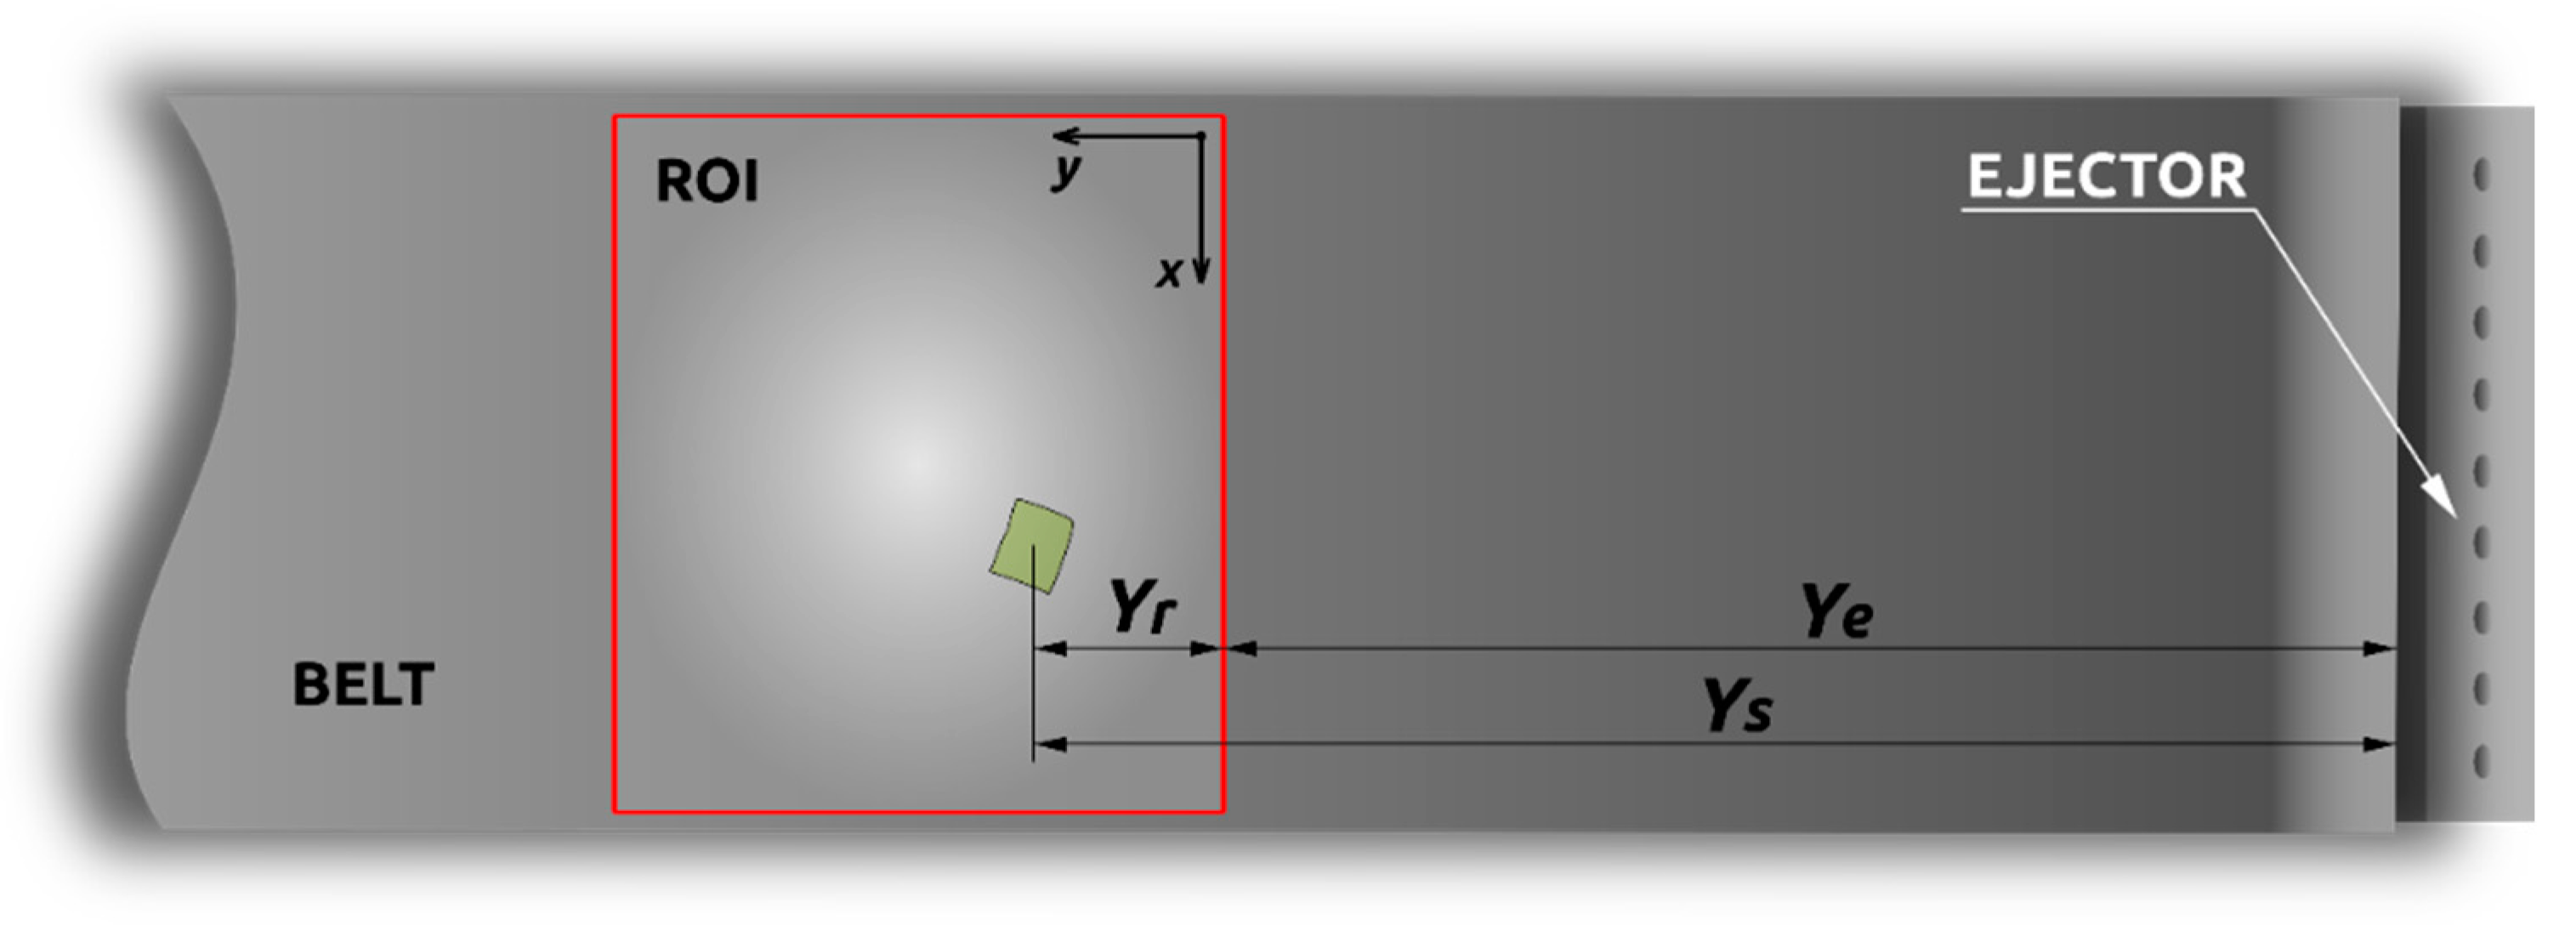
Particle localization was performed using the Modified Sauvola threshold algorithm. The location of the granulate is important for the operation of the sorting machine, as it is used to send individual granules to the classifier and possibly to eject the granules with air nozzles.
A classifier on a sorting machine was used in the second part. The testing of sorting accuracy was performed on the test samples. The highest purity of the accepted material (defect free) class contained 99.81% pure material (contamination by defective materials was 0.19%).
Classification OK/NOK worked with 100% accuracy, so the conclusion is that all sorting errors are possible due to other influences. These influences can be inaccurate air nozzles separation, error on the determination of granulate location, granule migration on conveyor during moving between camera, and air nozzles and possible software bugs.
The illumination could be more even using better lighting. Better lighting could only improve already good results. The lighting must be very intensive so that the exposure time of the camera can be very short. The speed of the conveyor affects the image quality in the case of too dim lighting and if the camera is rolling the shutter.
Further work could be performed to improve separate ejecting. As the results show, the classification works well, and all errors resulted from the physical manipulation of the granules. Ejecting logic software and hardware could be improved as it could eject the individual granules more accurately. To this end, the possible effects affecting sorting errors should be improved. The main influences are determining the location of the granule and transporting the granules from the feeder to the air nozzles.
Later, the classifier could be adapted for other materials in similar forms. The regrind polycarbonate, which has a very undefined shape, could be also sorted. With this material, the color of the material depends on the particle thickness, which further complicates the classification. The quality of the captured image can also be improved, by improving the illumination and using a telecentric lens. In this way, the images will be of better quality and can determine the location of the granule more precisely. The classification of granules, which is already good, could also be improved.
Other methods of artificial intelligence could be used to classify the granules. These are, for example, neural networks and deep learning. Since a large database for training and testing was made, these methods could be of use, but only major changes to the sorting machine software should be made.
The use of a sorting machine in an industrial environment would be possible. The capacity needs to be increased largely, while maintaining the sorting efficiency. The increase in capacity should follow the example of larger industrial sorting machines, which adjust the sorting capacity with the help of several cameras installed in parallel on the conveyor. So, a wider conveyor should be used and more cameras in parallel should be installed. Depending on the width of the conveyor, the air nozzles should also be adjusted.
Another way to increase the capacity of the sorting machine is the faster movement of the conveyor. However, then the camera must also capture images with more images per second, which also need to be processed. Thus, the speed of image processing must also be increased.

Author Contributions

Conceptualization, T.P. and S.K.; software, T.P. and J.H.; writing—original draft preparation, T.P.; writing—review and editing, T.P., J.H., S.K., and B.V.; project administration, S.K and B.V.; funding acquisition, S.K. and B.V. All authors have read and agreed to the published version of the manuscript.

Funding

This research was funded by the European Regional Development Fund.

Acknowledgments

The authors acknowledge the financial support from the Slovenian Research Agency (Research Core Funding No. P2-0157).

Conflicts of Interest

The authors had no conflicts of interest in this article.

References

  1. Chen, X.; Yan, N. A brief overview of renewable plastics. Mater. Today Sustain. 2020, 7–8, 100031. [Google Scholar] [CrossRef]
  2. Wong, J.K.H.; Lee, K.K.; Tang, K.H.D.; Yap, P.-S. Microplastics in the freshwater and terrestrial environments: Prevalence, fates, impacts and sustainable solutions. Sci. Total Environ. 2020, 719, 137512. [Google Scholar] [CrossRef] [PubMed]
  3. Li, C.; Busquets, R.; Campos, L.C. Assessment of microplastics in freshwater systems: A review. Sci. Total Environ. 2020, 707, 135578. [Google Scholar] [CrossRef]
  4. Wu, X.; Li, J.; Yao, L.; Xu, Z. Auto-sorting commonly recovered plastics from waste household appliances and electronics using near-infrared spectroscopy. J. Clean. Prod. 2020, 246, 118732. [Google Scholar] [CrossRef]
  5. Straka, M.; Khouri, S.; Rosova, A.; Caganova, D.; Culkova, K. Utilization of computer simulation for waste separation design as a logistics system. Int. J. Simul. Model. 2018, 17, 583–596. [Google Scholar] [CrossRef]
  6. Tange, L.; Van Houwelingen, J.A.; Peeters, J.R.; Vanegas, P. Recycling of flame retardant plastics from weee, technical and environmental challenges. Adv. Prod. Eng. Manag. 2013, 8, 67–77. [Google Scholar] [CrossRef] [Green Version]
  7. Niaounakis, M. Biopolymers: Reuse, Recycling, and Disposal; William Andrew: Amsterdam, The Netherlands, 2013. [Google Scholar]
  8. Wangrakdiskul, U.; Teammoke, P.; Laoharatanahirun, W. Recycled plastic beads sorting machine for polypropylene and acrylonitrile butadiene styrene type with difference of density. Appl. Mech. Mater. 2017, 871, 230–236. [Google Scholar] [CrossRef]
  9. Zeghloul, T.; Mekhalef Benhafssa, A.; Richard, G.; Medles, K.; Dascalescu, L. Effect of particle size on the tribo-aero-electrostatic separation of plastics. J. Electrost. 2017, 88, 24–28. [Google Scholar] [CrossRef]
  10. Brunner, S.; Fomin, P.; Kargel, C. Automated sorting of polymer flakes: Fluorescence labeling and development of a measurement system prototype. Waste Manag. 2015, 38, 49–60. [Google Scholar] [CrossRef]
  11. Spiga, P.; Bourely, A. Application of visible spectroscopy in waste sorting. Proc. SPIE 2011, 8172, 817212. [Google Scholar] [CrossRef]
  12. Zheng, Y.; Bai, J.; Xu, J.; Li, X.; Zhang, Y. A discrimination model in waste plastics sorting using nir hyperspectral imaging system. Waste Manag. 2018, 72, 87–98. [Google Scholar] [CrossRef] [PubMed]
  13. Bonifazi, G.; Capobianco, G.; Serranti, S. A hierarchical classification approach for recognition of low-density (ldpe) and high-density polyethylene (hdpe) in mixed plastic waste based on short-wave infrared (swir) hyperspectral imaging. Spectrochim. Acta Part A 2018, 198, 115–122. [Google Scholar] [CrossRef] [PubMed]
  14. Shameem, K.; Choudhari, K.; Bankapur, A.; Kulkarni, S.; Unnikrishnan, V.; George, S.; Kartha, V.; Santhosh, C. A hybrid libs-raman system combined with chemometrics: An efficient tool for plastic identification and sorting. Anal. Bioanal. Chem. 2017, 409, 3299–3308. [Google Scholar] [CrossRef]
  15. Juan, H.; Susu, Z.; Bingquan, C.; Xiulin, B.; Qinlin, X.; Chu, Z.; Jinyan, G. Nondestructive determination and visualization of quality attributes in fresh and dry chrysanthemum morifolium using near-infrared hyperspectral imaging. Appl. Sci. 2019, 9, 1959. [Google Scholar] [CrossRef] [Green Version]
  16. Galdón-Navarro, B.; Prats-Montalbán, J.M.; Cubero, S.; Blasco, J.; Ferrer, A. Comparison of latent variable-based and artificial intelligence methods for impurity detection in pet recycling from nir hyperspectral images. J. Chemom. 2018, 32, e2980. [Google Scholar] [CrossRef]
  17. Brunnbauer, L.; Larisegger, S.; Lohninger, H.; Nelhiebel, M.; Limbeck, A. Spatially resolved polymer classification using laser induced breakdown spectroscopy (libs) and multivariate statistics. Talanta 2020, 209, 120572. [Google Scholar] [CrossRef]
  18. Junjuri, R.; Zhang, C.; Barman, I.; Gundawar, M.K. Identification of post-consumer plastics using laser-induced breakdown spectroscopy. Polym. Test. 2019, 76, 101–108. [Google Scholar] [CrossRef]
  19. Joshi, K.D.; Chauhan, V.; Surgenor, B. A flexible machine vision system for small part inspection based on a hybrid svm/ann approach. J. Intell. Manuf. 2020, 31, 103–125. [Google Scholar] [CrossRef]
  20. Sousa, J.; Rebelo, A.; Cardoso, J.S. Automation of waste sorting with deep learning. In Proceedings of the 2019 XV Workshop de Visão Computacional (WVC), São Bernardo do Campo, Brazil, 9–11 September 2019; pp. 43–48. [Google Scholar]
  21. da Costa, A.Z.; Figueroa, H.E.H.; Fracarolli, J.A. Computer vision based detection of external defects on tomatoes using deep learning. Biosyst. Eng. 2020, 190, 131–144. [Google Scholar] [CrossRef]
  22. Nasiri, A.; Omid, M.; Taheri-Garavand, A. An automatic sorting system for unwashed eggs using deep learning. J. Food Eng. 2020, 283, 110036. [Google Scholar] [CrossRef]
  23. Heo, Y.J.; Kim, S.J.; Kim, D.; Lee, K.; Chung, W.K. Super-high-purity seed sorter using low-latency image-recognition based on deep learning. IEEE Robot. Autom. Lett. 2018, 3, 3035–3042. [Google Scholar] [CrossRef]
  24. Dhakshina Kumar, S.; Esakkirajan, S.; Bama, S.; Keerthiveena, B. A microcontroller based machine vision approach for tomato grading and sorting using svm classifier. Microprocess. Microsyst. 2020, 76, 103090. [Google Scholar] [CrossRef]
  25. Narendra Veeranagouda, G.; Amithkumar Vinayak, G. Intelligent computer vision system for vegetables and fruits quality inspection using soft computing techniques. Agric. Eng. Int. 2019, 21, 171–178. [Google Scholar]
  26. Nasirahmadi, A.; Miraei Ashtiani, S.-H. Bag-of-feature model for sweet and bitter almond classification. Biosyst. Eng. 2017, 156, 51–60. [Google Scholar] [CrossRef] [Green Version]
  27. Nagaoka, Y.; Miyazaki, T.; Sugaya, Y.; Omachi, S. Automatic mackerel sorting machine using global and local features. IEEE Access. 2019, 7, 63767–63777. [Google Scholar] [CrossRef]
  28. Teimouri, N.; Omid, M.; Mollazade, K.; Mousazadeh, H.; Alimardani, R.; Karstoft, H. On-line separation and sorting of chicken portions using a robust vision-based intelligent modelling approach. Biosyst. Eng. 2018, 167, 8–20. [Google Scholar] [CrossRef]
  29. Kanjanawanishkul, K.; Chupawa, P.; Nuantoon, T. Design and assessment of an automated sweet pepper seed sorting machine. Eng. Agric. Environ. Food 2018, 11, 196–201. [Google Scholar] [CrossRef]
  30. Li, H.X.; Li, B.; Choi, J.; Heo, J.; Kim, I. Analysis of a novel nozzle used for pulse jet filtration using cfd simulation method. Int. J. Simul. Model. 2016, 15, 262–274. [Google Scholar] [CrossRef]
  31. Skews, B.W.; Moss, E.A. Supersonic pulsed jets for material sorting. Exp. Fluids 2001, 31, 681. [Google Scholar] [CrossRef]
  32. Tourlomousis, F.; Chang, R.C. Dimensional metrology of cell-matrix interactions in 3d microscale fibrous substrates. Procedia CIRP 2017, 65, 32–37. [Google Scholar] [CrossRef]
  33. Maier, G.; Pfaff, F.; Becker, F.; Pieper, C.; Gruna, R.; Noack, B.; Kruggel-Emden, H.; Längle, T.; Hanebeck, U.D.; Wirtz, S.; et al. Motion-based material characterization in sensor-based sorting. De Gruyter 2018, 85, 202–210. [Google Scholar] [CrossRef]
  34. Pieper, C.; Pfaff, F.; Maier, G.; Kruggel-Emden, H.; Wirtz, S.; Noack, B.; Gruna, R.; Scherer, V.; Hanebeck, U.D.; Längle, T.; et al. Numerical modelling of an optical belt sorter using a dem–cfd approach coupled with particle tracking and comparison with experiments. Powder Technol. 2018, 340, 181–193. [Google Scholar] [CrossRef]
  35. Anh, N.T.; Anh, N.H.; Dat, N.T. Development of a framework for ballistic simulation. Int. J. Simul. Model. 2018, 17, 623–632. [Google Scholar] [CrossRef]
  36. Xiaowei, Z.; Wei, T.; Jianhong, D. A fast adaptive binarization method based on sub block ostu and improved sauvola. In Proceedings of the 2011 7th International Conference on Wireless Communications, Networking and Mobile Computing, Wuhan, China, 23–25 September 2011; pp. 1–5. [Google Scholar] [CrossRef]
  37. Luo, W.; Sun, L. An improved binarization algorithm of wood image defect segmentation based on non-uniform background. J. For. Res. (1007662X) 2019, 30, 1527. [Google Scholar] [CrossRef]
  38. Han, J.; Kamber, M. Data Mining: Concepts and Techniques, 3rd ed.; Morgan Kaufmann: Burlington, MA, USA, 2011. [Google Scholar]
  39. Anton, H. Elementary Linear Algebra, 10th ed.; J. Wiley & Sons: Hoboken, NJ, USA, 2010. [Google Scholar]
  40. Tom, F. An introduction to roc analysis. Pattern Recognit. Lett. 2006, 27, 861–874. [Google Scholar] [CrossRef]
  41. David, M.W.P. Evaluation: From precision, recall and f-measure to roc, informedness, markedness & correlation. J. Mach. Learn. Technol. 2011, 2, 37–63. [Google Scholar] [CrossRef]
Figure 1. Sorting machine prototype with marked components: 1. Feeder, 2. Camera, 3. Illumination, 4. Conveyor, 5. Air nozzles and valves block, 6. Catcher of ejected material, 7. Catcher of separated material.
Applsci 10 04269 g001
Figure 2. Representatives of each granule class: (a) Clean; (b) Blur; (c) Black dots; (d) More black dots; (e) Dark; (f) Pink; (g) Green; (h) Yellow (i) Material mix.
Applsci 10 04269 g002
Figure 3. Image processing operations: (a) Original image; (b) RGB green color extraction and brightness settings; (c) Modified Sauvola threshold; (d) Particle filter. Blue color indicates marked pellets with color defects and red color indicates pellets with structural defects.
Applsci 10 04269 g003
Figure 4. The process of determining which pneumatic valve to open and when to eject the granule.
Applsci 10 04269 g004
Figure 5. Schematic presentation of the system prototype. The feeder, conveyor and air nozzles are shown. Below are the boxes to catch the material. A “separate” box for non-defective material (Box 1) and an “ejected” box for defective material (Box 0).
Applsci 10 04269 g005
Table 1. List of used samples.
NumberClassAccept/Reject
1CleanAccept
2BlurReject
3Black dotsReject
4More black dotsReject
5DarkReject
6PinkReject
7GreenReject
8YellowReject
9Material mixReject
Table 2. Representation of the confusion matrix.
Considering Class C2:Actual Class
C1C2C3C4C5
PREDICTED CLASSC1γβγγγ
C2αTPααα
C3γβγγγ
C4γβγγγ
C5γβγγγ
Positives, P: True Positives: TP = designated in the Table; False Positives: FP = ∑ α. Negatives, N: True Negatives: TN = ∑ γ; False Negatives: FN = ∑ β.
Table 3. Confusion matrix of sorting results into nine classes.
TRUE
PREDICTEDClass123456789
115000000001
201459030007
3029417700012
4009126100000
501351280000
600000150001
700000015000
800000001500
9023522000129
150150150150150150150150150
Precision99.3488.4171.2186.993.4399.3410010075.88
Recall10096.6762.678485.3310010010086
Table 4. Confusion matrix of results for two classes.
TRUE
PREDICTEDClassOKNOK
OK1500
NOK0150
150150
Precision100100
Recall100100
OK: clean; NOK: defective.
Table 5. The settings of the feeder and the conveyor when testing the sorting efficiency.
Test NameSc—Conveyor Belt Speed (m/s)Sf—Feeder Belt Speed (m/s)
Test 10.5450.006
Test 20.5450.024
Test 30.4190.013
Test 40.3080.006
Test 50.3690.006
Table 6. Parameters’ interpretations in sorting machine testing.
DataUnitEquationDescriptionAcquisition
ts Sorting timeMeasurement
m_D1g Weighing of good granules in Box 1Measurement
S1piece Counting defect granules in Box 1Measurement
λ Sc/SfBulk density on conveyorCalculation
S0piece Bad granules in Box 0Calculation
D1piece Good granules in Box 1Calculation
D0piece Good granules in Box 0Calculation
m.kg/h Sorting capacity (granular mass flow rate)Calculation
ni_0 S0/(S0 + D0)The quality of the ejected granules (percentage of defect granules in Box 0)Calculation
ni_1 D1/(D1 + S1)Quality of separated granules (percentage of good granules in Box 1)Calculation
Table 7. Sorting results on sorting machine.
DataTest 1Test 2Test 3Test 4Test 5
t236.74365.7234222.7
m_D157.551.655.257.657.2
S16.311.745.749.742
λ90.822.732.251.361.5
S0408.7403.3369.3365.3373
D133242983319133303307
D0203544336197220
m.1.0115.5673.6441.0231.075
ni_066.8142.5752.3664.9762.9
ni_199.8199.6198.5998.5398.75

