Article

Finding Minimal Optimal Indent Separation for Polystyrene via Instrumental Nanoindentation and FEA Method

School of Mechanical and Design Engineering, University of Portsmouth, Portsmouth PO1 3DJ, UK
*
Author to whom correspondence should be addressed.
Appl. Sci. 2020, 10(12), 4262; https://doi.org/10.3390/app10124262
Submission received: 18 May 2020 / Revised: 12 June 2020 / Accepted: 18 June 2020 / Published: 22 June 2020

Abstract

:
Nanoindentation became a standard non-destructive technique to measure mechanical properties at the submicron scale of various materials. A set of empirical rules were established to guarantee the validity of the results. One of those rules is the separation between individual indents that should be 20–30 times maximum indentation depth. This paper investigates the influence of the distance between indents on the accuracy of mechanical properties for polystyrene with a view to determine minimum optimal separation that is needed to measure various material properties. A series of different depths with three different orientations was considered through both the experimental and finite element method to explore the relationship between the distance and indentation depth. Both methods demonstrated that hardness and modulus values for polystyrene keep stable with the distance approximately 15 times the maximum indentation depth for the matrix type set up, and nominal separation of 10 is enough when indents are executed in a single row or column.

Graphical Abstract

1. Introduction

Nanoindentation has become a standard non-destructive technique to measure mechanical properties of materials and their phases at the submicron scale, especially when standard methods such as tensile, three-point-bending, and other tests cannot be used. The technique is successfully applied in industry and research, and is used to characterize metals, ceramics, minerals, thin films and coatings, polymers, composites, natural materials, biological tissues, and many more [1,2,3,4,5,6]. To guarantee the validity of results, a set of empirical rules were established. Those include the 10% rule for indentation depth on coatings and thin films, 5% surface roughness, 1 degree for surface tilt and alignment [7], as well as spacing between the indents. In the literature about nanoindentation, a distance of at least 30 times the maximum indentation depth is suggested to avoid interference for Vickers and Berkovich tips in real tests [8,9]. The validity of those rules was investigated to some extent experimentally and in combination with finite element analysis (FEA). Probably the most investigated is the 10% rule. A systematic experimental study of mechanical properties dependence on indentation depth of soft and hard coatings on various substrates showed that the rule very much depends on the properties of the substrate [10]. The validity of this rule was further investigated with the help of FEA studies [11,12].
The finite element method combined with nanoindentation experimental data became a popular technique to support the investigation of the mechanical behavior of materials. Yangyi Xiao et al. [13] used nanoindentation with a conical indenter to investigate the failure properties of a DLC/steel system. Finite element simulation under the ideal situation was applied to acquire coating fracture and interfacial bonding strengths as well as evolutions of failures in the coating-substrate system [13]. A deconvolution method was proposed to develop elastic modulus of thin films in a film-substrate bilayer system. This method optimized the load–displacement (P-h) cycle obtained from a finite element nanoindentation model towards the experimentally measured curve [14]. The relationship between the shape of the normalized loading P-h cycle and the indenter tip rounding radius was investigated through theoretical analysis and FEA [15]. Mojumder et al. [16] studied the effects of crystallographic orientation, indentation speed, indentation depth, and indenter size for pure aluminum using both nanoindentation and the finite element method. The stress–strain behavior of ferrite and austenite in a commercial 2205 duplex stainless steel had been explored by both experimental and FEA methods in [17]. A proposed reverse algorithm with spherical indentations was confirmed by the load–displacement curve to simulate the deformation and load resistance for SiC in nanoindentation process using finite element method [18]. Another technique is proposed to combine the results of continuous stiffness measurements with spherical indenters, Hertzian theory and Berkovich nanoindentations to obtain load–displacement of indentation curves to their corresponding indentation stress–strain curves [19]. The technique was implemented to fused silica, aluminum, iron and single crystals of sapphire and ZnO. The effects of roughness on the reduced modulus of contact was explored using 3D FEA modeling to map the apparent modulus on a real rough surface as measured by atomic force microscopy [20].
Very limited work was done on finding the optimal indent spacing. When investigating bulk materials with large surface areas, to have large spacing between indents is not so important. The spacing becomes a problem when small volumes of materials with specific features have to be measured. Using finite element analysis and an analytical solution, Zhao and Ovaert [21] revealed that an accurate modulus can be obtained with a distance greater than 40 times the indentation depth for a spherical indenter and 10 times the indentation depth for a Berkovich tip on titanium and steel alloys. Sudharshan Phani and Oliver [22] also found that a minimum indent spacing of 10 times the indentation depth can offer highly accurate results for a Berkovich indenter on several materials like silica, aluminum, polycarbonate, and copper. The authors also argued that there are no obvious differences in hardness values as a function of indenter orientation and the number of neighboring indents.
No or very little FEA research considered the influence on the mechanical behavior due to pileup, sink-in, and crack formation during nanoindentation, especially for polymer materials. To our knowledge, no papers presently exist for analysis of the stress and strain based on the nanoindentation with Berkovich tip for polymers without considering uniaxial test. In Xu’s and Chen’s work [23], the accuracy of indentation stress–strain for Tabor’s and their method was confirmed by contrasting against the uniaxial stress–strain results. Although they applied the spherical tip and only considered metals, these two methods were applied in this paper due to the high result validity and the adjustable parameters.
In this work, we investigate the influence of the separation and orientation between indents on the accuracy of mechanical properties for polystyrene at three different maximum depths with a view to find the minimum optimal separation. Both experimental and finite element methods were applied in these studies. An indentation stress constraint factor is introduced to define stress and strain directly from nanoindentation experiments. The loading–unloading curve from the finite element method was compared against that from the experiment to prove the accuracy.

2. Materials and Methods

2.1. Materials and Nanoindentation Experiment

The nanoindentation experiments were performed on 1.2 mm thick amorphous and transparent polystyrene (PS) sheets (GoodFellow, Cambridge, UK) with a tensile modulus of E = 2.3 – 4.1 GPa. PS sheets were cut into samples with sizes of 20 × 20 mm, to be able to fully support them on the indenter sample holder.
Nanoindentation experiments were done using NanoTest Platform 3 instrument from Micromaterials Ltd. (Wrexham, UK). Indentation was done using Berkovich diamond tip in a depth-controlled mode. Maximum depth was set to 1, 5, and 10 µm, loading and unloading rate was set to 10 s each, and holding/dwell time at maximum was 30 s. Three indents with different separations were performed in a single row (0° orientation), in a single column (90° orientation), and a matrix of 3 × 3 indents was also executed to investigate the influence of neighboring indents at defined distances and three orientations (Figure 1). The normalized spacing between indents was defined as a ratio of indent spacing (d) to maximum indentation depth (h), d/h, and varied from 1 to 30. At least 3 sets of experiments for each orientation, depth, and spacing was executed. Optical images were obtained using Leica Olympus PX 40 Microscope.
All experimental data were analyzed using the Oliver and Pharr method [24] with integrated analytical software provided by nanoindentation instrument manufacturer. Hardness, H, (Equation (1)) and reduced modulus, Er, (Equation (2)) for polystyrene were calculated from loading–unloading curves:
H = P m a x A c ,
where P m a x is the maximum load, and A c is the contact area at maximum load.
The Oliver and Pharr method [24] provides the elastic modulus, E, as follows:
1 E r = 1 υ 2 E + 1 υ i 2 E i ,
where υ is the Poisson’s ratio of the sample (0.34 was used for PS), E r is the reduced modulus of the sample, υ i is the Poisson’s ratio of the diamond indenter (0.07), and E i is the Young’s modulus for the indenter (1141 GPa).

2.2. Modeling Plastic Behavior/Region During Indentation

2.2.1. Determination of Plastic Properties for FEA

Loading–unloading curves from nanoindentation were used to calculate the hardness and modulus. Plastic behavior is another important property that had to be considered in the modeling. Due to the unavailability of uniaxial testing for our samples, stress and strain were determined through the loading–unloading curve from nanoindentation testing. Considering the research from Xu and Chen [23], the effective indentation stress is expressed as:
σ e f f = 1 α P π a c 2
and the effective indentation strain as:
ε e f f = β 1 ( a c / R ) 2 a c R ,
where α is an indentation stress constraint factor, β is an indentation strain constraint factor, P is the force acting on the indenter, a c is the radius of the contact, and R is the radius of indenter. This method consists of two unknown parameters (α and β ) to be determined using uniaxial true stress and strain data. Two unknown parameters make it difficult to find the best match between experimental and modeled loading–unloading curves. Taking this into account, as well as the fact that uniaxial stress data were unavailable, the Tabor’s method of calculating indentation strain was considered to eliminate the unknown parameter β and simplify the modeling process. The indentation strain is defined as [25]:
ε ind = 0.2 a c R .
To model the indentation process, ABAQUS version 2019 software was used. The Young’s modulus of polystyrene required for nanoindentation modeling was calculated from experimental data using Equation (2). The plastic property, yield stress, and plastic strain, applied to ABAQUS were obtained from indentation strain ε i n d and effective indentation stress σ e f f which were calculated from Equations (3) and (5) using the indentation stress constraint factor α determined from the loading–unloading curve. To simplify procedure, the indenter was assumed to have a conical shape with radii of R = 250 nm, and total included angle of 142.3° that gives the same nominal contact area per unit depth as a Berkovich indenter.
Indentation strain, ε i n d , and effective indentation stress, σ e f f , with different indentation stress constraint factor α were applied to finite element analysis in order to define the satisfactory indentation curve. An example of obtaining most fitted parameters for ABAQUS analysis with h = 5 µm is presented in Table 1 and Figure 2. The Young’s modulus of polystyrene, EPS = 4.495 GPa was obtained from experimental interfacial modulus, Er = 4.866 GPa using Equation (2). Indentation strain ε i n d and effective indentation stress σ e f f with different indentation stress constraint factor, α , obtained from Equations (3) and (5) are shown in Table 1. The loading–unloading curves from ABAQUS compared with the experimental curve are shown in Figure 2. The indentation strain and effective indentation stress with α = 2.5 showed the highest accuracy at maximum indentation load/depth and was chosen for finite element analysis for depth h = 5 µm. The yield stress and plastic strain calculated from ε i n d and σ e f f that were obtained at α = 2.5 were applied as the plastic property for further ABAQUS modeling.
Detailed information on strain–stress values with different values as well as ABAQUS modeled curves for h = 1 µm and 10 µm can be found in Supporting Information S1. The indentation strain and effective indentation stress with indentation stress constraint factor that showed the highest accuracy, were chosen for further finite element analysis. Table 2 summarizes results used for FEA at various depth.

2.2.2. Finite Element Modeling

The Berkovich-like shape indenter was applied in the finite element modeling using ABAQUS to investigate von Misses stress distribution. The indenter was assumed as a three-sided pyramid in shape with a sharp tip at the end. The size of the plate sample has been set large enough to simulate the realistic situation, and ignore the effect on the surrounding and bottom surfaces in the analysis. An example of the ABAQUS model with mesh is depicted in Figure 3. The indenter was modeled as a discrete rigid body using C3D10 quadratic elements with a reference point to control the indentation process through defined displacement. The plate was meshed using C3D8R linear elements with the bottom surface fixed in all directions. The surface-to-surface contact between the rigid indenter and the plate sample was set with a friction coefficient of 0.3. The model followed von Mises yield criteria with isotropic hardening and rate-independent. The constitutive model was assumed to be elastic–plastic with linear elastic behavior up to the yield stress and plastic strain determined through the process described in Section 2.2.1.
Considering the accuracy of the result and computational resources, mesh size, one-fifth of the depth, (e.g., mesh size = 0.2 µm for depth = 1 µm) was applied to numerical analysis. More detailed information about mesh size selection can be found in Supporting Information S2.

3. Results and Discussion

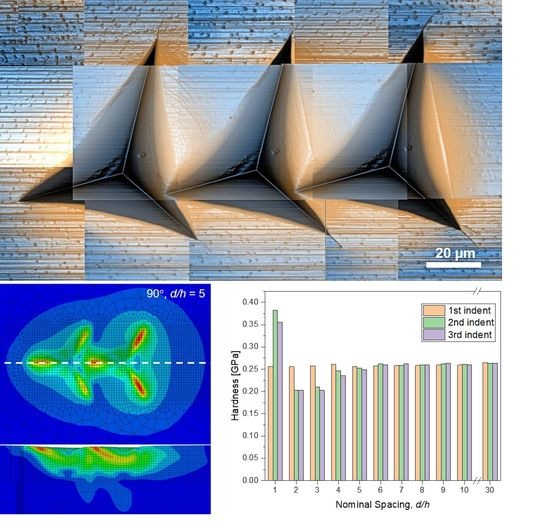
3.1. Experimental Analysis for Indents in a Row with Orientations 0° and 90°

The experimental hardness and modulus values for all three indents done in a single row with varying spacing at different depth are given in Figure 4. The average percentage difference values for three indents obtained at the same distance, D ¯ % , shown in Figure 5, were calculated using Equation (6):
D ¯ % = 1 n i = 1 n | x i D ¯ | ,
where n is the number of the data points and the average of the set D ¯ = 1 n i = 1 n x i .
When comparing absolute values of single indents at different spacing (Figure 4), graphs clearly show that once the spacing, d/h, is around 10, the hardness and modulus values between three indents remain more or less constant independent on the maximum indentation depth. In addition, from d/h ~ 10, the properties do not change with spacing for depth 1 and 5 µm. For h = 10 µm, with the account for deviation, mechanical properties do not differ with spacing from d/h ~ 15. Furthermore, the average percentage difference between indents of less than 2% was obtained from nominal spacing as small as 5 times the indentation depth (Figure 5). Figure 5a,b also illustrates property dependence as a function of indent orientation. The influence of orientation is strong only at separations up to 4–5 times, and becomes ineffective at larger spacing if indents were done in a single row or column.
The closer the indent spacing is, the more affected the next indent will be, thus reducing the validity of obtained data. The results for the first indent remain constant as it is done on a non-disturbed surface, unless the indentation occurs at some defect point. The second indent will be influenced by the first, and the third will be affected by both indents until d/h ~ 3–4, depending on the maximum depth. Optical images demonstrating indent overlapping and corresponding typical load–displacement curves for small separations for h = 5 µm are given in Figure 6a and Figure 7, respectively. In general, hardness and modulus values are lower for indents 2 and 3 at the spacing d/h < 5–6 when compared with the first indent, but they increase with increased separation. The exception is spacing d/h = 1, where values for indent 2 and 3 are higher or close to indent 1. PS is a glassy, brittle polymer that during indentation deforms elastic-plastically inducing chain displacement, possible strain hardening, creating some degree of pile-up and crazes. The variation in values at small indentation separation will depend on the position of the next indent with respect to the first and the local surface changes created during the process. With increasing indentation depth, and thus volume, those defects are increasing, creating larger overlapping of the plastic zone. In addition, the degree of indent overlapping will depend on the measurements set-up, i.e., single line vs. matrix, as demonstrated in Figure 6.
During the plastic deformation at temperatures that are below glass transition, the chains of glassy polymers obtain a limited degree of mobility under the applied stress, and the strain hardening will depend on the degree of cross linking [26]. A molecular dynamic simulation study of indentation on PS [27] demonstrated that during the plastic indentation stage, the movement of polymer chains was restricted, providing a low atomic-level strain and very small volume affected region in terms of chain slipping. It was attributed to the presence of benzene rings that restrict chain movement that allow PS to withstand great loading forces. The most displaced and affected areas were close to the edge with the top polymer surface. They also demonstrated that the indenter bluntness and loading rates have a strengthening effect on PS. Considering all above, and taking into account that the material surface adjacent to the indenter hardens during the deformation [28], it explains the higher or unchanged hardness and modulus values at a separation of 1. At d/h = 1, the second indent takes place on one of the imprinted faces of the pyramid, and depending on the indent orientation might be close to the pyramid edge (Figure 6a). The load–displacement curves (Figure 7) corresponding to d/h = 1 clearly show the displacement to be smaller for the indents 2 and 3 at the same recorded loading force, indicating the presence of a harder surface.
The materials that tend to work harden during the indentation, such as glasses and ceramics, usually preferentially sink-in. The pile-up is largest for those that have little or no capacity to work harden [29,30]. The experimentally measurable ratio of the final depth, hf, to the maximum depth, hmax, was introduced to identify the threshold value at which the material will pile-up or sink-in. It was found that irrespective of work-hardening characteristics and penetration depth, pile-up occurs when hf/hmax > 0.7 [30]. In our case, the ratio of hf/hmax is 0.65 for a depth of 1 µm and 0.70 for a depth 5 and 10 µm, yet the pile-up of material is observed at all indentation depths on all three sides of the pyramid imprint. It seems that this ratio is not the best indicator to determine material behavior in the case of polymers, as was also shown in [31]. The pile-up, together with the formation of radial crazes or crack type defects, is mostly prominent on the right side where the next indent will take place (Figure 6). In the nanoindentation studies of polymeric scratched surfaces [32,33], it was noted that the indenter encountered less resistance on the damaged surface than that of undeformed glassy polymers like PS and PMMA. This “softening” was attributed to the presence of subsurface voids in the form of crazes that were formed during the scratching. Our results indicate, that even though PS might experience strain hardening during the indentation, there is still some degree of upward material flow that can induce certain subsurface defects, with the not-so-closely packed chains that have softer regions. At d/h = 2, the apex of the next indent will start on the edge (or close to it) of the imprint within the piled-up, cracked/crazed region (Figure 6a). Loading–displacement curves (Figure 7) at these depths show larger displacements due to the softer nature of the surface, with respect to the first indent obtained at the same load. At this separation, the lowest mechanical properties were recorded for almost all depths (Figure 4).
Irrespective of material work-hardening, piling-up, or sinking-in, permanent deformation occurs, creating a plastic zone with certain shape and radius surrounding the indent. For piling-up and non-strain hardening materials, the plastic zone will extend outside the radius of contact, while for sinking-in materials, the zone will most likely be contained within the boundary of the indent [30]. In the case of materials with significant strain hardening, material within the plastic zone becomes “harder” and subsequent indents will show an increase in hardness if plastic zones overlap [22]. From d/h = 3–4, material properties start to increase, at this spacing, the next indents will move away from the piled-up area and will be indenting in the middle of a crazed region, or at the interface with a piled/crazed and undisturbed region (Figure 6a), but still within the overlapping plastic zones. Typical indentation curves for individual indents at d/h = 4 are shown (Figure 7). From d/h = 5, indents take place away from the visually deformed surface, but the very corner of the pyramid still imprints on the previous indent, or the piled-up/crazed region (Figure 6a). However, the loading curves for individual indents from d/h = 5 become aligned with one another (Figure 7), giving relatively high accuracy measurements for hardness and reduced modulus. In any case, the plastic zones of individual indents overlap until d/h ~ 10–15 (Chapter 3.3, Supporting Information S4), yet the deviation in results is below 1% (Figure 5). Sudharstan Pani and Oliver [22] stated that the strength distribution that resulted from the deformation by the neighboring indent defined minimum spacing rather than strain-based criteria due to the overlapping plastic zones. It was shown that, the highest normalized strength of 50 is concentrated around the contact, which quickly reduces to 10 just outside the contact, and is negligible at the plastic zone boundary.

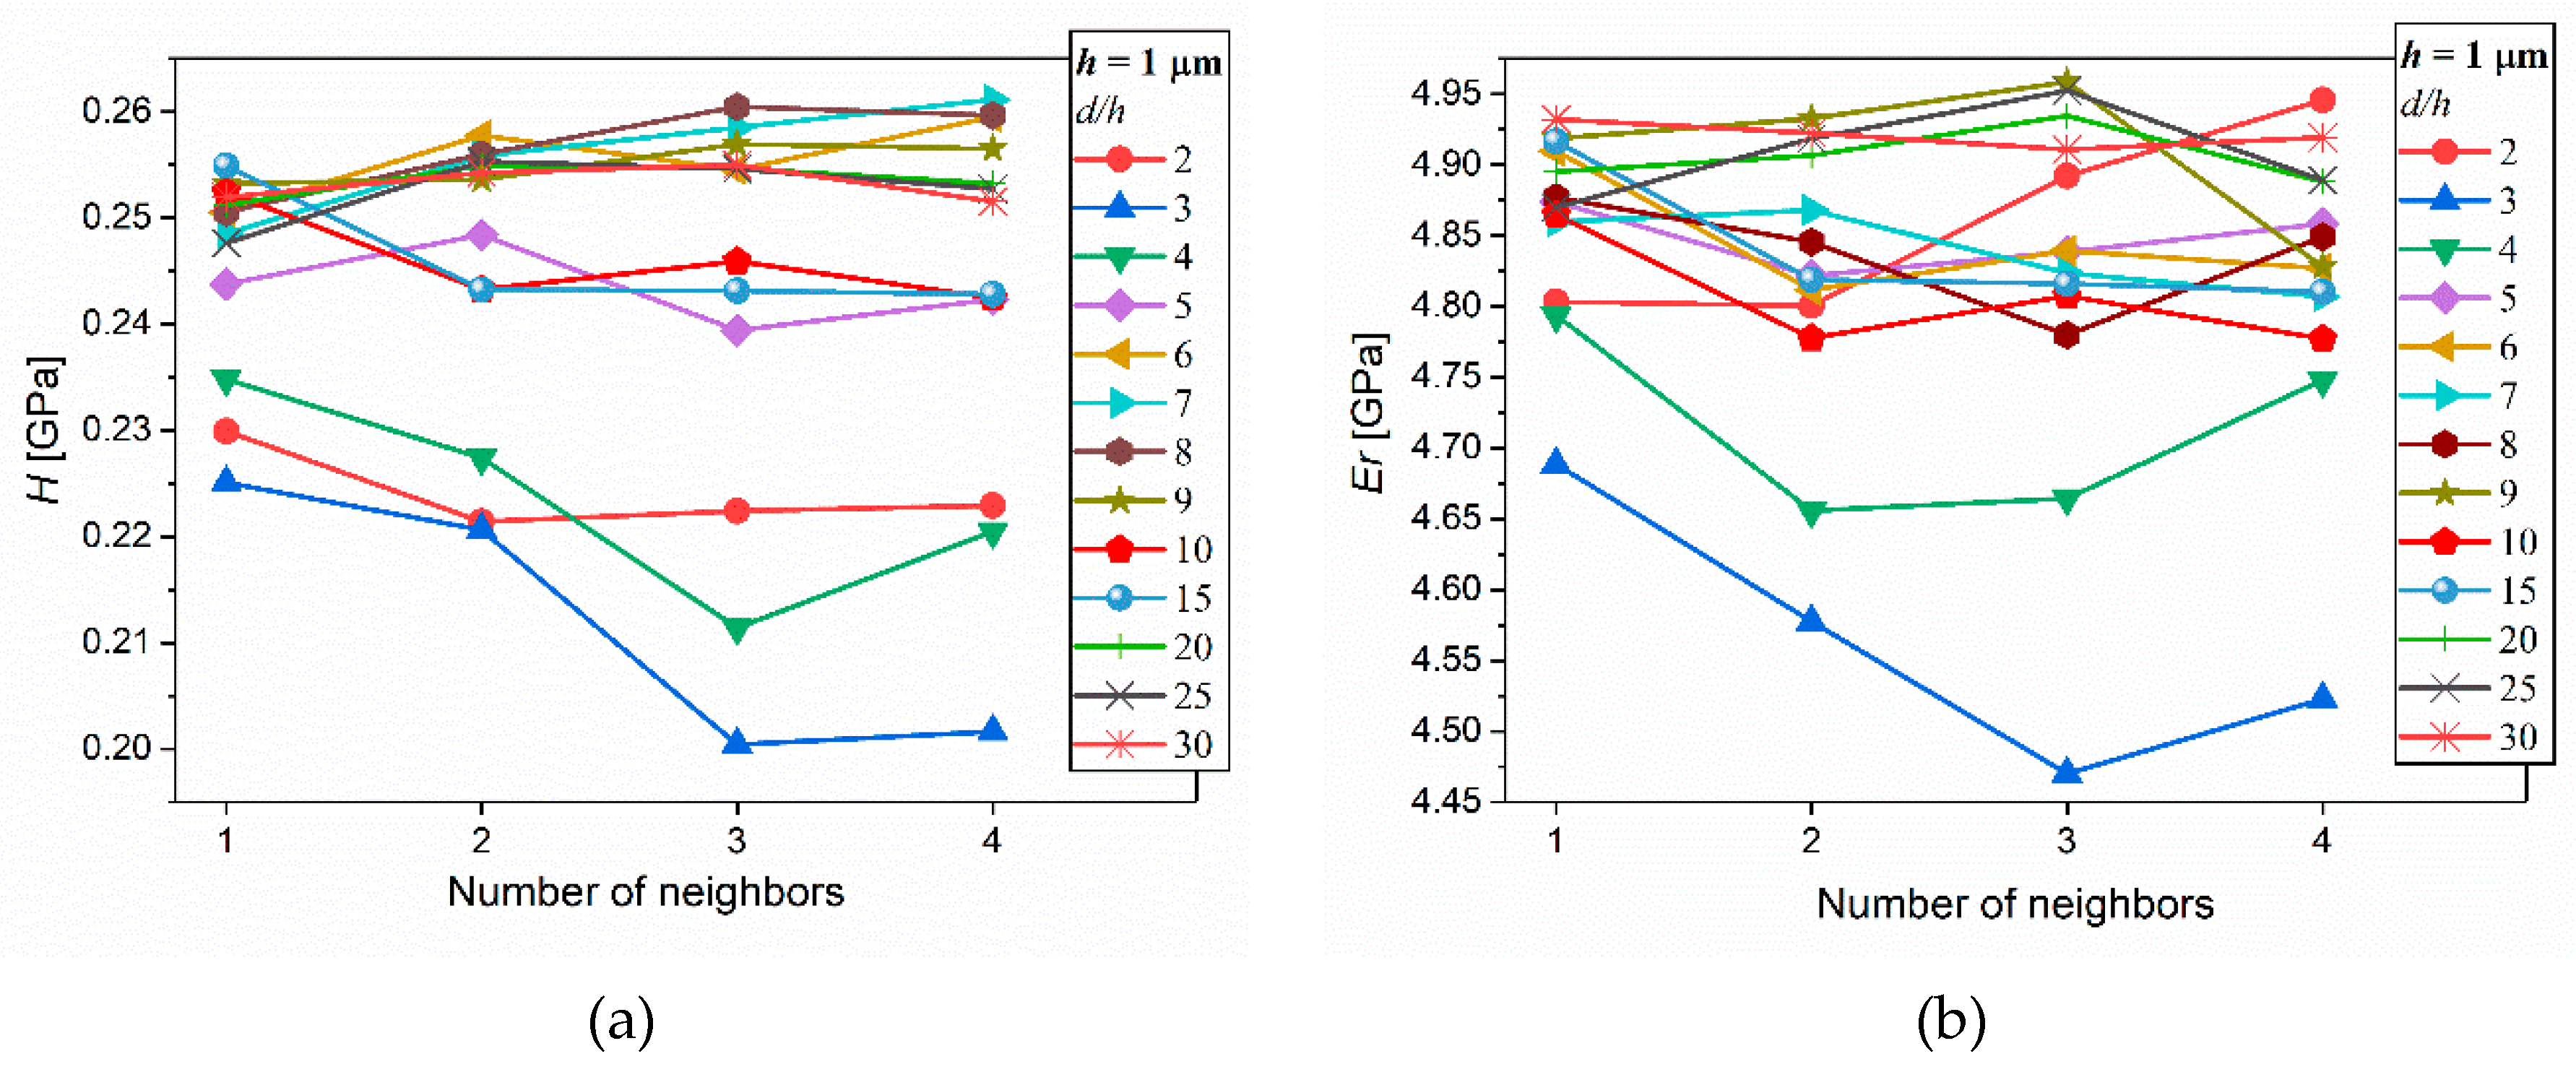
3.2. Experimental Analysis of Indents in a Matrix

During the experimental indentation, usually matrix with a certain number of indents is set up. Thus, it is of an interest to explore the influence of the distance between indents with different orientations and a number of neighbors. Here, three different orientations (0°, 90° and 45°) as shown in Figure 1 are considered for a 3 by 3 matrix.
The average percentage difference values for three indents in the same row or column, D ¯ % , with different orientations are shown in Figure 8. As per the schematics presented in Figure 1, for 0° orientation, the three groups are defined as: the first group includes 1st, 2nd, and 3rd indent, the second group—4th, 5th, and 6th indent, and the third group—7th, 8th, and 9th indents. While the groups for 90° orientation are following: the first group—1st, 4th, and 7th indents, the second group—2nd, 5th, and 8th indents, and the third group—3rd, 6th, and 9th indents. As expected, the hardness and reduced modulus become stable with increasing separation and reduced indent overlap. Less than 1% average difference between each indent was measured when the d/h ~ 7–8 for, h = 5 µm (Figure 8c,e) and 10 µm (Supporting Information S3, Figure S3.1). Optical images of matrix indentation indicate that d/h = 7–8 is already the first spacing where indents hardly touch with pyramidal shape corners. However, it is also evident that a small portion of the indent will still be imprinted on the piled-up or crazed part of the PS sample at nominal separation of 7 (Figure 6b), which was not observed for indents performed in a single row (Figure 6a). This is expected, as with the matrix method in total larger area and volume of material is disturbed during the indentation. The absolute values (Figure 9; Figure S3.2) become more or less constant when d/h = 10, where indents are completely separated. As in the case of indents in a single rows or columns, indent orientation does not show any significant influence at large separations. However, is it highly affected when indents are close, with the highest deviation in values observed at orientation of 0° for h = 5 µm and 10 µm. The influence of orientation at 45° was not determined experimentally, as the matrix was too small to have sufficient data, but it is expected to show a similar response as for the horizontal and vertical values. The effect of 45° orientation was investigated with FEA and will be presented in the next chapter.
In the case of h = 1 µm, H and Er values between the indent sets show a higher deviation (~1–2%) even at large separations. In addition, the influence of orientation is more pronounced in this case even if it is not very significant at larger separations. Why the values deviate so much, is not clear. Depth of 1 µm for the nanoindentation is deep enough to be considered as measuring “bulk”, tip apex imperfections can be ignored, and the diamond contact area approach the ideal equation. There might be some influence of the indentation size effect for PS [34,35], as measured values tend to differ with increasing depth, as shown in Table 2. The larger deviation at smaller depth might be related to the sample itself. In this work, commercial flat polystyrene sheets were used. As samples are transparent, visual inspection did not show any external or internal flaws. A closer look at the surface with optical microscope showed only flat surfaces with no defects. Yet, it is not clear how the sheets were manufactured, if plasticizers were used, and how all of it might affect the surface layer. The sample ageing also cannot be excluded, even if they were kept in a closed container at room temperature away from any heat sources. The influence of surface treatment on mechanical properties is not the scope of the current article, and we leave this discussion for another work.
What is also important in matrix type measurements is the number of neighboring indents. It does not matter how large the matrix is, the maximum number of 4 neighbors can be achieved (Figure 1 and Figure 6b). The results on hardness and reduced modulus for two different depths as a function of the number of neighbors and spacing is shown in Figure 9 for h = 1 µm and 5 µm, Figure S3.2 for h = 10 µm.
In general, the influence of nearby indents reduces with increasing separation, implying that spacing affects the values more rather than the number of neighbors. When comparing the properties behavior between different depths for PS, one can notice that with increasing depth, the constant H and Er values between neighboring indents can be achieved at small separations. Similarly as reported in [22], hardness and modulus for each neighboring indent become constant with d/h = 5–6 for a maximum depth of 5 µm (Figure 9c,d) and 10 µm (Support Information S3, Figure S3.2). The average absolute mechanical property values are more or less constant at d/h = 10 and above for h = 5 µm (Figure 9c,d). For a depth of 10 µm, hardness between each indent and overall values behave in a similar way, but modulus results approach consistency at d/h > 15 (Figure S3.2). This might be because when indents were done at a depth of 10 µm, more piling up was observed and the deformed area surrounding the indent increased. When one compares results at maximum depth of 1 µm, the larger data scatter is observed. Figure 9a,b shows that for depth of 1 µm, constant results between neighboring indents as well as average values are achieved at d/h > 15 for PS when two dimensional arrays are set. The need for larger spacing for PS at lower depths might be because of the higher influence of the strain-hardening effect [34] that results in the overlap of plastic zones of neighboring indents at those depths, even though optical images showed that each indent was well separated at depths of d/h = 10 (Figure 6b). Although, as already mentioned above, a depth of 1 µm is deep enough and, yet for PS, the values of H and Er are still changing with the indentation depth. Nevertheless, overall minimum separation found through experimental studies is lower than the advised 30 times maximum indentation depth.

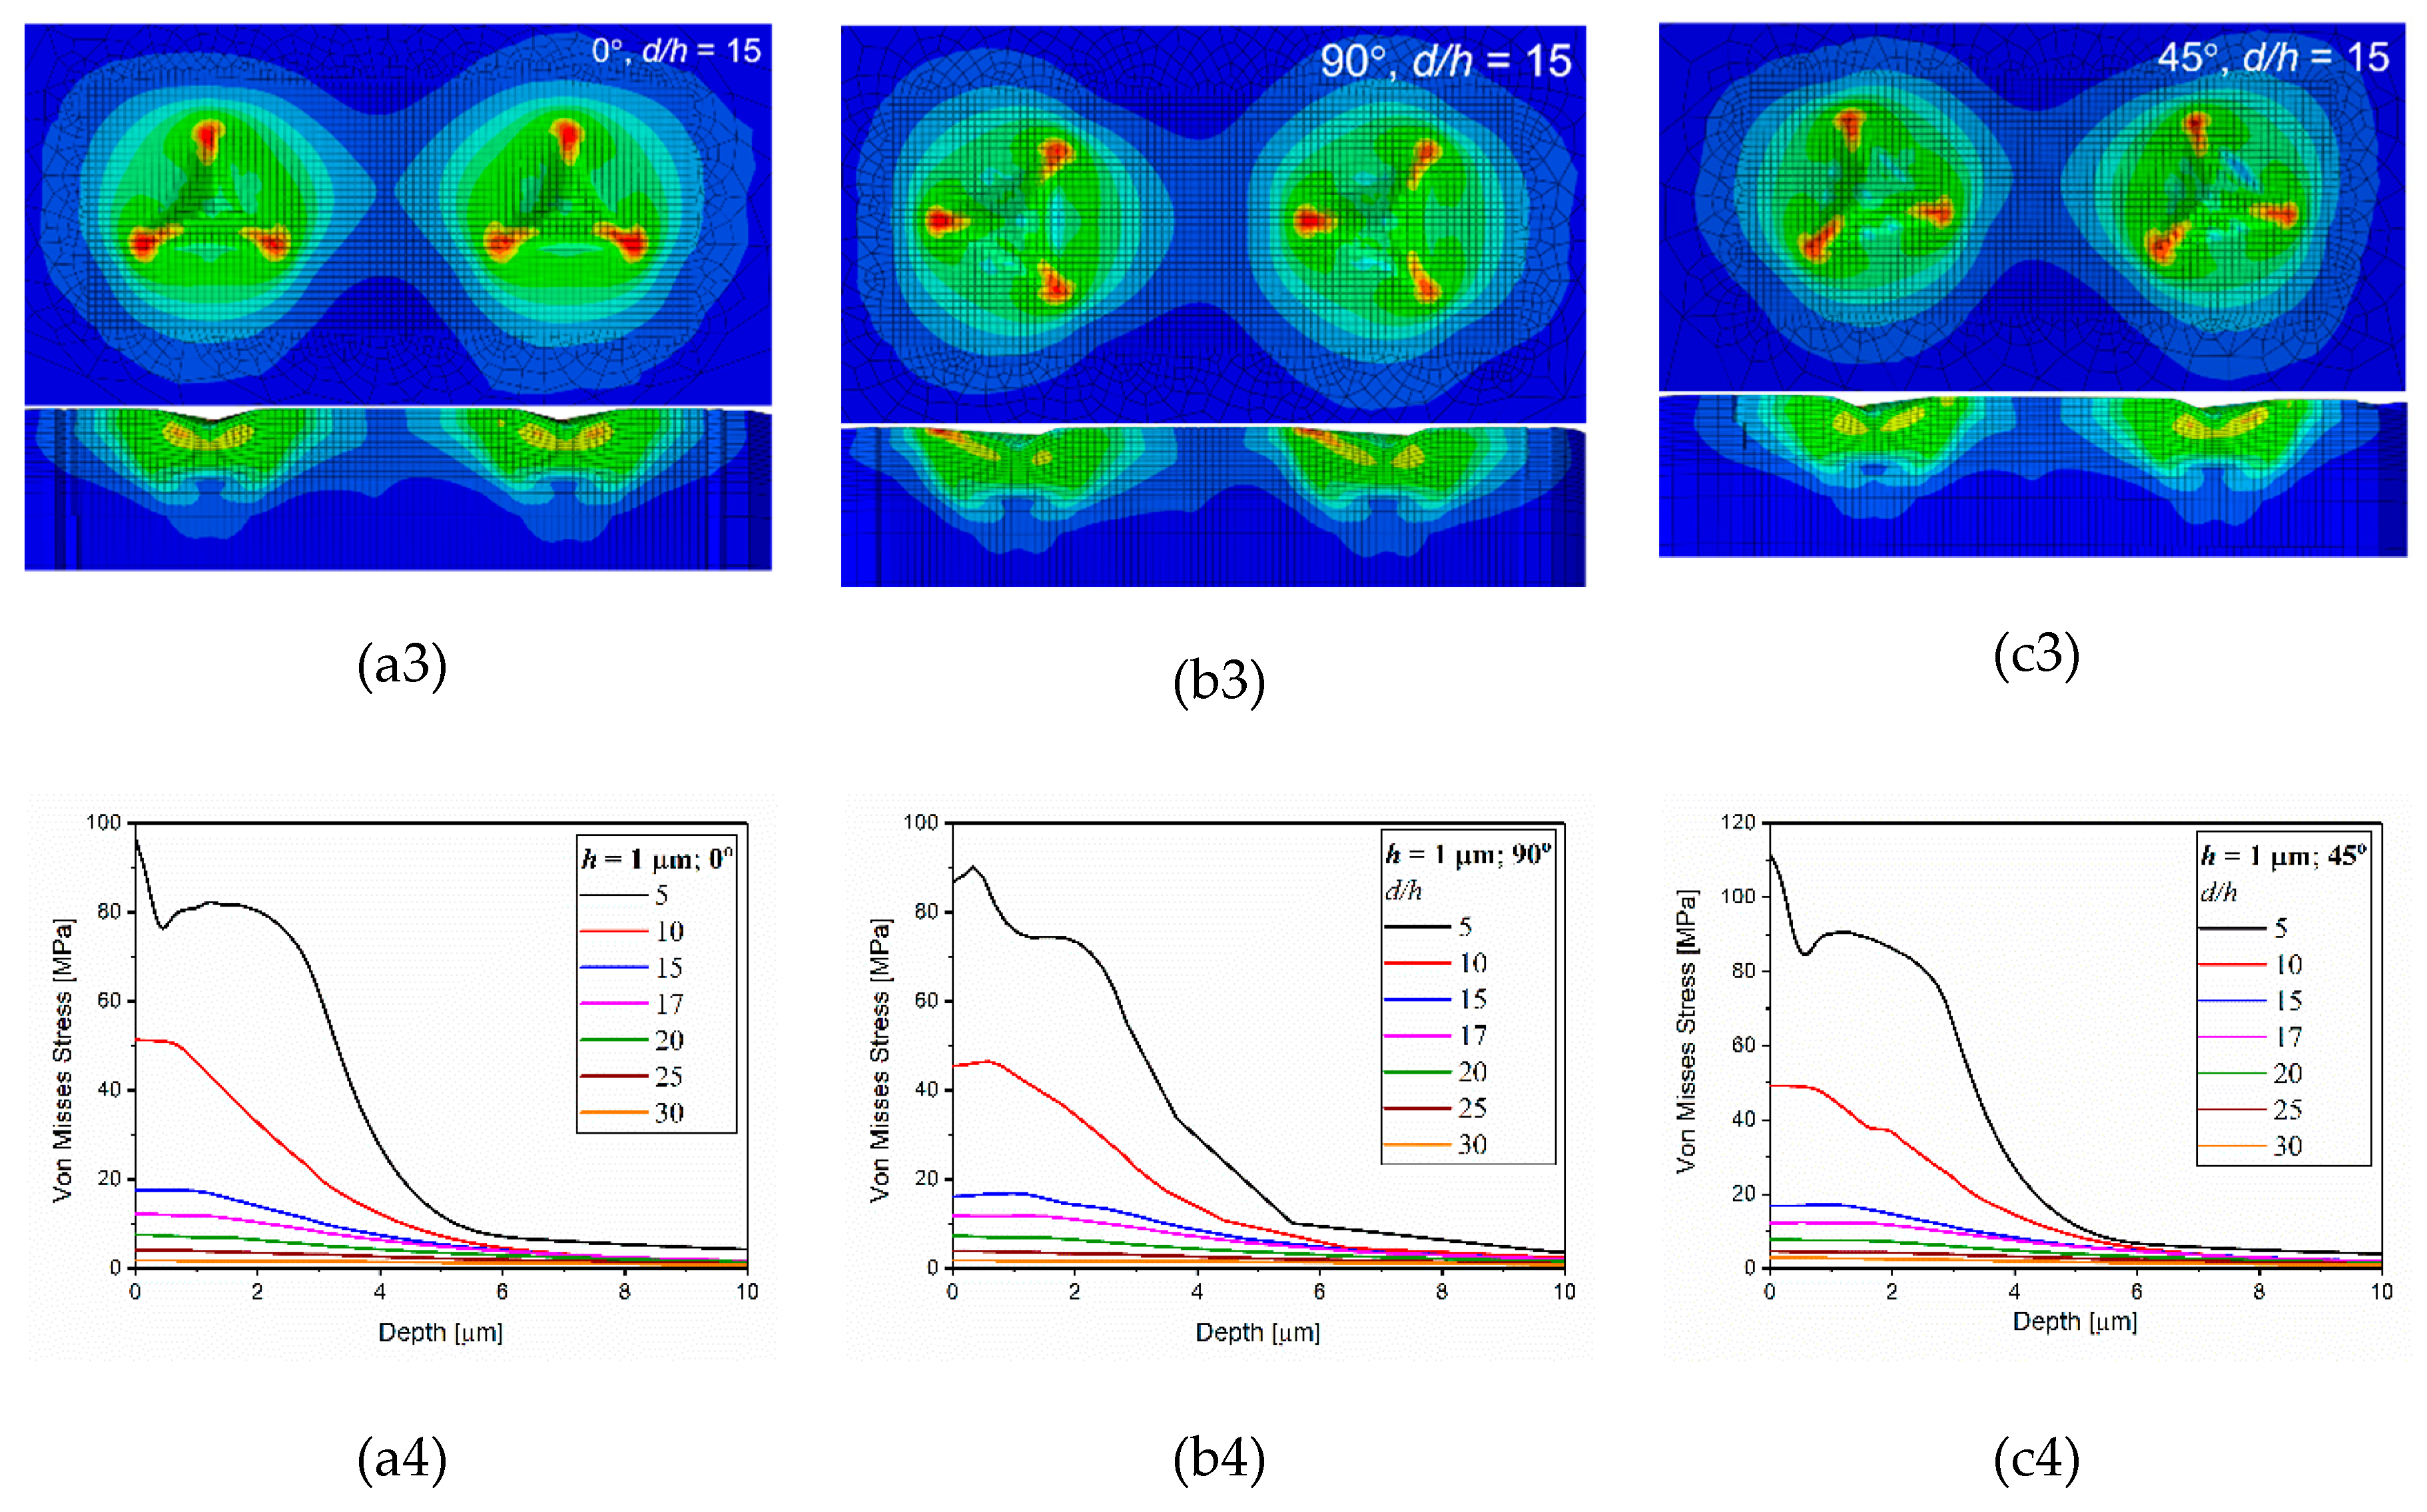
3.3. Finite Element Analysis for h = 1 µm with Three Different Orientations

To investigate the influence of plastic zone, FEA analysis was performed based on experimental data. Only two indents with different orientation are considered in ABAQUS due to its high computational resources. The von Mises stress distributions with different orientations and selected separation for depth, h = 1 µm, are presented in Figure 10. The figure shows the top view and cross-section, cut through the center of the max depth as indicated with a dotted line in the images in the first row. In the last row, a von Mises stress vs. depth taken from FEA cross-section at the center between two indents is provided. The depth in this case means the distance taken from the very top surface going towards the sample bulk. Similar analysis was done for h = 5 µm (Figure S4.1) and 10 µm (Figure S4.2), given in Supporting Information S4.
As shown in Figure 10, for a nominal separation of 5, the two indentations and their plastic zones overlap significantly and von Mises stress is affected by both indents. The difference of hardness and modulus values of PS when compared to those obtained at recommended distances (30 times the maximum indent depth) is only about 4% and 2.7%, respectively. The difference of 3.5% for H holds for d/h = 10–15, for modulus it drops to 2%. Hardly any deviation (< 0.5%) is measured at d/h = 20 and above. As shown in Figure 10, the stress contours of two indents start to separate at d/h = 15, yet there is still a low von Mises stress at the regions present. The von Mises stress would overlap until the separation between indents reaches at least 19 for all three different orientations. The stress plots shown in the last row of Figure 10, also indicate that constant low stresses in PS can be achieved at separations above 20 at maximum depth of 1 µm independent on indent orientation.
Another two depths, h = 5 µm and 10 µm, with different orientation are also investigated and presented in Supporting Information S4. Interestingly, the FEA is somewhat different. In those cases, the plastic zone and large stress overlap is observed till d/h = 7–8. Although the indentations are away from each other with a distance of 10 times maximum depth, it provides that the von Mises stress would overlap until the distance between indentations reaches 15 times the maximum indentation depth. The von Mises stress plots indicate that the stress stays stable from the distance above 15. The difference in hardness values changes from 6% at d/h = 5, to below 1% at d/h = 10 and above. While modulus difference values change from ~10% at d/h = 5, to 3% at d/h = 10, and below 1% at d/h > 15 and above.
Comparing PS properties at various depth, it was observed that at maximum depth of h = 1 µm, the difference of the hardness values is higher than that of modulus. This might be explained as strain hardening affect, as well as specific surface effects like ageing. Furthermore, FEA analysis clearly indicates that there is still a very strong von Mises stress overlapping up to a separation of 15. Based on the experimental and FEA results, d/h should be at least 15 to ensure H and Er data consistency for low depths. When the indent depth increases, the difference in modulus values is higher that than of hardness, for both h = 5 µm and 10 µm. In this case, H values become constant at d/h = 10 when indents are fully separated and plastic zones are hardly overlapping (Supporting Information S4, Figures S4.1 and S4.2), but modulus will be affected until d/h = 15. As discussed in Section 3.1, overlap of plastic zone might not be the correct criterion for determining minimum separation, however in this case, FEA analysis and experimental results agree that separation of 15 provides the most constant results.
Polymers are viscoelastic materials, meaning that material behavior is time-dependent. Furthermore, different types of polymers will behave differently under the same experimental conditions [34,36,37]. It was shown that hardness and modulus for the glassy polymer tend to decrease with slower loading time and increased holding time at maximum load [34,36]. It was also demonstrated that the rate at which indents are performed and/or hold time at defined maximum conditions can change the indent area by 20–40% for polymer materials [34,36], this in turn will increase the deformed area/volume around the indent and influence the minimum spacing. In the majority of cases, experiments usually are set up as matrix in a load-controlled mode, and because of the dwell time added to compensate creep, the final depth, and thus indent area, will be larger than the estimated one. For the indent example shown in Figure 6, d/h = 10, it was estimated that if the indent area increases by 40% because of loading rate and creep set up, but the nominal separation between indents will be set as 10, the actual indent separation will look like as so it is 7–8. For the matrix set up, the distance is too close (Figure 6b), especially for polymers with high pile-up preferences, the deviation in hardness and modulus in general is still large (Figure 9). Therefore, the recommendation would be to have spacing of at least 15 for all polymeric materials independent on indentation depth. Furthermore, for very soft polymers, the Berkovich tip might not be the best choice to execute these tests and flat punch or spherical tips have to be utilized, and therefore, the optimal spacing will differ greatly than the results reported here.

4. Conclusions

This paper explores the influence of distance between indentation on the material properties for polystyrene through experimental nanoindentation and finite element method by using ABAQUS. Considering different depths and orientation, the results presented in Section 3 confirm that the properties are affected by the separation, and show little influence of orientation. The following conclusions can be drawn:
  • The Tabor’s method allows to obtain the stress–strain through the loading–unloading curve from the nanoindentation experiment directly using the finite element method. The material properties will change according to the maximum indentation depth.
  • Berkovich tip orientation does not influence modulus or hardness values at separation above 5, thus removing the importance of the alignment.
  • Experimentally and through FEA, it was shown that for PS, the minimum required spacing to measure properties accurately is d/h ~ 10–15, depending if indents are performed in a single line or matrix. When indents are executed in a single line or column, the nominal spacing of 10 is sufficient for separate indents to have similar hardness and modulus values and is independent on indentation depth. When a matrix set-up is used, d/h > 15 is required for a depth of 1 µm, and at least 10 for deeper indents.
  • At separations below 10–15, hardness and modulus values were lower when compared to those obtained at larger separations or with the first indent. PS tends to form pile-up and crazes when it is plastically deformed, as well as strain harden. The properties will depend on the location of the next indent: the areas having “softer” regions are those close to the pile-up, the “hardest” areas are close to the apex of the first indent. No or little difference in properties is observed when the indent takes place on optically undamaged surface, even though indents edges and plastic zones overlap.
  • Taking into account the viscoelastic nature of polymer materials and their time-dependent behavior that may increase the indent area for up to 40%, separation of at least 15 is recommended for polymers at all indentation depths for single line or column, or matrix arrangement. Overall, the required minimum spacing is lower than the original 30 times maximum depth rule.

Supplementary Materials

The following are available online at https://www.mdpi.com/2076-3417/10/12/4262/s1, S1. Stress-Strain determination (Tables S1.1; S1.2; S1.3, Figures S1.1; S1.2; S1.3); S2. Mesh Convergence Study (Table S2, Figures S2.1, S2.2, S2.3); S3. Experiment Analysis of Indents in a Matrix for h = 10 µm (Figures S3.1, S3.2); S4. Finite element analysis the maximum depth h = 5 µm and 10 µm with three different orientations (Figures S4.1, S4.2)

Author Contributions

C.J.—investigation, FEA, formal data analysis, visualization, writing–original draft preparation; M.D.—optical and scanning images, graphical abstract, visualization, writing–proof read, and review; J.Z.—project lead and administration, supervision, investigation, visualization, writing–review, and editing. All authors have read and agreed to the published version of the manuscript.

Funding

This research received no external funding.

Conflicts of Interest

The authors declare no conflict of interest.

References

  1. Fischer-Cripps, A.C. Nanoindentation. In Mechanical Engineering Series, 3rd ed.; Springer: New York, NY, USA, 2011; Volume 2. [Google Scholar]
  2. Bull, S.J. Nanoindentation of coatings. J. Phys. D. Appl. Phys. 2005, 38, R393–R413. [Google Scholar] [CrossRef]
  3. Tiwari, A.; Natarajan, S. (Eds.) Applied Nanoindentation in Advanced Materials; John Wiley & Sons, Ltd.: Chichester, UK, 2017. [Google Scholar]
  4. Ebenstein, D.M.; Pruitt, L.A. Nanoindentation of biological materials. Nano Today 2006, 1, 26–33. [Google Scholar] [CrossRef]
  5. Beake, B.D.; Chen, S.; Hull, J.B.; Gao, F. Nanoindentation Behavior of Clay/Poly (Ethylene Oxide) Nanocomposites. J. Nanosci. Nanotechnol. 2002, 2, 73–79. [Google Scholar] [CrossRef] [PubMed]
  6. Beake, B.D.; Goodes, S.R.; Smith, J.F.; Gao, F. Nanoscale repetitive impact testing of polymer films. J. Mater. Res. 2004, 19, 237–247. [Google Scholar] [CrossRef]
  7. Indentation Rules of Thumb—Applications and Limits; Application Note 5990-5700EN; Agilent Technologies Inc.: Santa Clara, CA, USA, 2010.
  8. Hay, J. Introduction to instrumented indentation testing. Exp. Tech. 2009, 33, 66–72. [Google Scholar] [CrossRef]
  9. Zhang, W.; Chou, X.; Shi, T.; Ma, Z.; Bao, H.; Chen, J.; Chen, L.; Li, D.; Xue, C. Mechanical Characteristics Measurements. In Measurement Technology for Micro-Nanometer Devices; John Wiley & Sons, Ltd.: Hoboken, NJ, USA, 2016; pp. 121–190. [Google Scholar]
  10. Saha, R.; Nix, W.D. Effects of the substrate on the determination of thin film mechanical properties by nanoindentation. Acta Mater. 2002, 50, 23–38. [Google Scholar] [CrossRef]
  11. Kietzke, T.; Neher, D.; Landfester, K.; Montenegro, R.; Güntner, R.; Scherf, U. Novel approaches to polymer blends based on polymer nanoparticles. Nat. Mater. 2003, 2, 408–412. [Google Scholar] [CrossRef]
  12. Chen, J.; Bull, S.J. On the relationship between plastic zone radius and maximum depth during nanoindentation. Surf. Coatings Technol. 2006, 201, 4289–4293. [Google Scholar] [CrossRef]
  13. Xiao, Y.; Shi, W.; Wan, Q.; Luo, J. Evaluation of failure properties of a DLC/steel system using combined nanoindentation and finite element approach. Diam. Relat. Mater. 2019, 93, 159–167. [Google Scholar] [CrossRef]
  14. Liu, S.; Huang, H.; Gu, Y. Deconvolution of mechanical properties of thin films from nanoindentation measurement via finite element optimization. Thin Solid Film. 2012, 526, 183–190. [Google Scholar] [CrossRef]
  15. Li, Y.G.; Kanouté, P.; François, M.; Chen, D.; Wang, H.W. Inverse identification of constitutive parameters with instrumented indentation test considering the normalized loading and unloading P-h curves. Int. J. Solids Struct. 2019, 156–157, 163–178. [Google Scholar] [CrossRef]
  16. Mojumder, S.; Mahboob, M.; Motalab, M. Atomistic and finite element study of nanoindentation in pure aluminum. Mater. Today Commun. 2020, 23, 100798. [Google Scholar] [CrossRef]
  17. Tao, P.; Gong, J.M.; Wang, Y.F.; Jiang, Y.; Li, Y.; Cen, W.W. Characterization on stress-strain behavior of ferrite and austenite in a 2205 duplex stainless steel based on nanoindentation and finite element method. Results Phys. 2018, 11, 377–384. [Google Scholar] [CrossRef]
  18. Long, X.; Jia, Q.P.; Li, Z.; Wen, S.X. Reverse analysis of constitutive properties of sintered silver particles from nanoindentations. Int. J. Solids Struct. 2020, 191–192, 351–362. [Google Scholar] [CrossRef]
  19. Basu, S.; Moseson, A.; Barsoum, M.W. On the determination of spherical nanoindentation stress-strain curves. J. Mater. Res. 2006, 21, 2628–2637. [Google Scholar] [CrossRef] [Green Version]
  20. Charvátová Campbell, A.; Buršíková, V.; Martinek, J.; Klapetek, P. Modeling the influence of roughness on nanoindentation data using finite element analysis. Int. J. Mech. Sci. 2019, 161–162. [Google Scholar] [CrossRef]
  21. Zhao, Y.; Ovaert, T.C. Error estimation of nanoindentation mechanical properties near a dissimilar interface via finite element analysis and analytical solution methods. J. Mater. Res. 2010, 25, 2308–2316. [Google Scholar] [CrossRef] [Green Version]
  22. Sudharshan Phani, P.; Oliver, W.C. A critical assessment of the effect of indentation spacing on the measurement of hardness and modulus using instrumented indentation testing. Mater. Des. 2019, 164, 107563. [Google Scholar] [CrossRef]
  23. Xu, B.; Chen, X. Determining engineering stress-strain curve directly from the load-depth curve of spherical indentation test. J. Mater. Res. 2010, 25, 2297–2307. [Google Scholar] [CrossRef]
  24. Oliver, W.C.; Pharr, G.M. An improved technique for determining hardness and elastic modulus using load and displacement sensing indentation experiments. J. Mater. Res. 1992, 7, 1564–1583. [Google Scholar] [CrossRef]
  25. Tabor, D. The hardness of solids. Rev. Phys. Technol. 1970, 1, 145–179. [Google Scholar] [CrossRef]
  26. Van Melick, H.G.H.; Govaert, L.E.; Meijer, H.E.H. On the origin of strain hardening in glassy polymers. Polymer 2003, 44, 2493–2502. [Google Scholar] [CrossRef] [Green Version]
  27. Peng, C.; Zeng, F. A molecular simulation study to the deformation Behaviors and the size effect of polyethylene during nanoindentation. Comput. Mater. Sci. 2017, 137, 225–232. [Google Scholar] [CrossRef]
  28. Oliver, W.C.; Pharr, G.M. Measurement of hardness and elastic modulus by instrumented indentation: Advances in understanding and refinements to methodology. J. Mater. Res. 2004, 19, 3–20. [Google Scholar] [CrossRef]
  29. Bull, S.J. Mechanical response of atomic layer deposition alumina coatings on stiff and compliant substrates. J. Vac. Sci. Technol. A Vac. Surf. Film. 2012, 30, 01A160. [Google Scholar] [CrossRef]
  30. Bolshakov, A.; Pharr, G.M. Influences of pileup on the measurement of mechanical properties by load and depth sensing indentation techniques. J. Mater. Res. 1998, 13, 1049–1058. [Google Scholar] [CrossRef]
  31. Tranchida, D.; Piccarolo, S.; Loos, J.; Alexeev, A. Mechanical characterization of polymers on a nanometer scale through nanoindentationn. A study on pile-up and viscoelasticity. Macromolecules 2007, 40, 1259–1267. [Google Scholar] [CrossRef]
  32. Iqbal, T.; Yasin, S.; Zafar, M.; Zahid, S.; Ishteyaque, S.; Briscoe, B.J. Nanoindentation Response of Scratched Polymeric Surfaces. Tribol. Trans. 2015, 58, 801–806. [Google Scholar] [CrossRef]
  33. Bonne, M.; Briscoe, B.J.; Lawrence, C.J.; Manimaaran, S.; Parsonage, D.; Allan, A. Nano-indentation of scratched poly(methyl methacrylate) surfaces. Tribol. Lett. 2005, 18, 125–133. [Google Scholar] [CrossRef]
  34. Briscoe, B.J.; Fiori, L.; Pelillo, E. Nano-indentation of polymeric surfaces. J. Phys. D Appl. Phys. 1998, 31, 2395–2405. [Google Scholar] [CrossRef]
  35. Bucsek, A.N.; Alisafaei, F.; Han, C.S.; Lakhera, N. On thresholds in the indentation size effect of polymers. Polym. Bull. 2016, 73, 763–772. [Google Scholar] [CrossRef]
  36. Oyen, M.L. Analytical techniques for indentation of viscoelastic materials. Philos. Mag. 2006, 86, 5625–5641. [Google Scholar] [CrossRef]
  37. Flores, A. Mechanical properties of poly (ethylene terephthalate) at the near surface from depth-sensing experiments. Philos. Mag. A 1998, 78, 1283–1297. [Google Scholar] [CrossRef]
Figure 1. Schematics of indentation orientation and indent position in a single row (orientation 0°), column (orientation 90°), and 3 × 3 matrix. d—spacing between indents.
Applsci 10 04262 g001
Figure 2. Loading–unloading curves with h = 5 µm from experiment and ABAQUS with different α .
Applsci 10 04262 g002
Figure 3. 3D model and meshing arrangement for one indent.
Applsci 10 04262 g003
Figure 4. Hardness (H) and reduced modulus (Er) for each indent measured in a single row (orientation 0°) at different indentation depth and spacing. (a,b) h = 1 µm; (c,d) h = 5 µm; (e,f) h = 10 µm.
Applsci 10 04262 g004
Figure 5. The average percentage difference values for three indents obtained at the same spacing (a) orientation 0°, h = 1 µm; (b) orientation 90°, h = 1 µm; (c) orientation 0°, h = 5 µm; (d) orientation 0°, h = 10 µm.
Applsci 10 04262 g005
Figure 6. Optical microscope images of Berkovich indentation with h = 5 µm and different spacing (a) indents in a single row; (b) indents in a 3 × 3 matrix. Scale bar is 50 µm.
Applsci 10 04262 g006aApplsci 10 04262 g006b
Figure 7. Typical load–displacement curves at low nominal separations. Example is given for h = 5 µm recorded at constant load of 140 mN.
Applsci 10 04262 g007
Figure 8. Average percentage difference of hardness and modulus values for three indents within a group for various maximum indentation depth and separation. (a) orientation 0°, h = 1 µm; (b) orientation 90°, h = 1 µm; (c) orientation 0°, h = 5 µm; (d) orientation 90°, h = 5 µm.
Applsci 10 04262 g008
Figure 9. (a,c) hardness and (b,d) reduced modulus as a function of the number of neighboring indents and spacing for maximum depth of (a) and (b) 1 µm; (c) and (d) 5 µm.
Applsci 10 04262 g009aApplsci 10 04262 g009b
Figure 10. Von Mises stress [MPa] distributions for h = 1 µm with different orientations and different nominal separations. (a) 0°, (b) 90°, and (c) 45°; (1) d/h = 5, (2) d/h = 10, (3) d/h = 15, and (4) von Misses stress vs. depth taken from the finite element modelling cross-section at the center between two indents.
Applsci 10 04262 g010aApplsci 10 04262 g010b
Table 1. Effective indentation stress and indentation strain with different indentation stress constrain factor, α, at h = 5 µm.
ε i n d σ e f f   ( MPa )
α = 2.6 α = 2.5 α = 2.4
0111
0.004151617
0.011434446
0.017666972
0.023929599
0.028109114118
0.034134139145
0.040157163170
0.046181188196
0.051201209217
0.057224233243
0.060236246256
Table 2. Experimental hardness, modulus, and indentation stress constraint factor, α , as a function of maximum depth.
Depth, h [µm]Hardness, H, [GPa]Reduced Modulus, Er [GPa]Young’ s Modulus, E p s [GPa]Constraint Factor, α
10.255 ± 0.0434.924 ± 0.0454.3541.87
50.260 ± 0.0354.886 ± 0.0314.3222.50
100.246 ± 0.0274.342 ± 0.0353.8403.00

