Article

Deep Learning-Based Wrapped Phase Denoising Method for Application in Digital Holographic Speckle Pattern Interferometry

1
Department of Precision Mechanical Engineering, Shanghai University, Shanghai 200072, China
2
Institute of Electronic Structure and Laser-Foundation for Research and Technology Hellas, N. Plastira 100, Voutes, Heraklion, 70013 Crete, Greece
*
Author to whom correspondence should be addressed.
Appl. Sci. 2020, 10(11), 4044; https://doi.org/10.3390/app10114044
Submission received: 24 April 2020 / Revised: 26 May 2020 / Accepted: 3 June 2020 / Published: 12 June 2020
(This article belongs to the Special Issue Intelligent Processing on Image and Optical Information, Volume II)

Abstract

:
This paper presents a new processing method for denoising interferograms obtained by digital holographic speckle pattern interferometry (DHSPI) to serve in the structural diagnosis of artworks. DHSPI is a non-destructive and non-contact imaging method that has been successfully applied to the structural diagnosis of artworks by detecting hidden subsurface defects and quantifying the deformation directly from the surface illuminated by coherent light. The spatial information of structural defects is mostly delivered as local distortions interrupting the smooth distribution of intensity during the phase-shifted formation of fringe patterns. Distortions in fringe patterns are recorded and observed from the estimated wrapped phase map, but the inevitable electronic speckle noise directly affects the quality of the image and consequently the assessment of defects. An effective method for denoising DHSPI wrapped phase based on deep learning is presented in this paper. Although a related method applied to interferometry for reducing Gaussian noise has been introduced, it is not suitable for application in DHSPI to reduce speckle noise. Thus, the paper proposes a new method to remove speckle noise in the wrapped phase. Simulated data and experimental captured data from samples prove that the proposed method can effectively reduce the speckle noise of the DHSPI wrapped phase to extract the desired information. The proposed method is helpful for accurately detecting defects in complex defect topography maps and may help to accelerate defect detection and characterization procedures.

1. Introduction

Protecting cultural relics and advocating for the protection of artworks with high artistic value is a mandatory aspect of cultural heritage management to secure the very existence of valuable cultural wealth for future generations. The timely inspection and repair of potential defects in cultural relics are of great significance for long-term preservation. In the last decades, many studies based on holographic interference have been proposed as a means for the implementation of new structural diagnosis tools, skills, and practices in heritage conservation [1,2,3,4,5,6,7,8,9,10,11,12]. Digital holographic speckle pattern interferometry (DHSPI) geometry has been proved to be an important technique applied in contactless art diagnostics non-destructive testing (NDT), since it provides high-resolution imaging of surface optical displacement, which can be used out of the laboratory for direct on-field non-destructive visualization and diagnosis of invisible structural alterations. Correspondingly, a fully portable DHSPI system providing high-density information and high fringe contrast data has been designed and developed for application in the remote examination of cultural heritage [13]. Methods of recovering data from speckle interferograms formed from another portable system based on digital speckle pattern interferometry were presented by Memmolo et al. [14].
Since artworks measured with DHSPI are usually complex, multilayered and inhomogeneous structures deteriorating with time and environmental conditions, starting from inside and affecting the precious surface [15,16,17,18,19], the resulting DHSPI wrapped phase is complicated, carrying complex fringe pattern changes and containing severe speckle noise. In many antique and heavily deteriorated artworks, the resulting interferograms may carry extremely discontinuous or even difficult to resolve fringe patterns. Noise can cause discontinuities in the fringes, making them appear to be interrupted. In this way, to properly process and evaluate the interferograms, tedious long-term fringe skeleton corrections and software for interactive interventions in the fringe pattern reconstruction process necessitating a priori knowledge are required [20,21]. Therefore, the denoising process is necessary in order to accurately observe and evaluate the state of the defects in artworks.
Many methods have been reported to denoise speckle noise from digital holography [22,23,24]. Phase-shifting technology provides the wrapped phase distributed in ( π , π ] , and a sine/cosine average filter (SCAF) [25] is proposed to denoise the numerator (sine fringes) and denominator (cosine fringes) of arctangent for processing noise and 2 π discontinuities in the wrapped phase. Windowed Fourier transform (WFT) [26] is an effective method to denoise the wrapped phase, but it requires a long-processing time and adjusts the parameters to process data. The regularized quadratic cost function (RQCF) [27] is proposed by Jesús Villa et al. to denoise the wrapped phase, but this method requires the estimation of fringe orientation. There are still many efforts to automatically denoise the wrapped phase map while achieving high accuracy and fast processing. Recently, optical image denoising using deep learning has shown excellent processing speed and accuracy including fringe pattern denoising [28,29,30] and wrapped phase denoising [31]. Deep learning has demonstrated effective performance for reducing Gaussian noise in the wrapped phase [31], but the proposed method in [31] does not process the speckle noise of the wrapped phase for application in DHSPI.
In this paper, a deep learning method is further proposed for denoising DHSPI wrapped phase to help the structural diagnosis of artworks. In phase-shifting technology, the sine and cosine fringes are calculated by arctangent function to obtain the wrapped phase distributed in ( π , π ] . In order to address noise and 2 π discontinuities of the wrapped phase, we present a deep learning method to denoise the sine and cosine fringes, and the filtered sine and cosine fringes are further calculated by arctangent to give an enhanced wrapped phase. Simulation results show that the proposed method can effectively reduce speckle noise and provide high-quality phase maps. The proposed method is verified by captured data from the portable DHSPI system. By comparing the high-frequency region of the phase map, the proposed method is shown to be superior to the post-processing of portable DHSPI systems and demonstrates a useful processing method for accurately assessing defects in artworks.
The rest of this paper is arranged as follows. Section 2 introduces the speckle fringe simulation method and phase retrieval method, which provide a theoretical basis for establishing a database. Section 3 presents the proposed method. Subsequently, Section 4 demonstrates the denoising performance from simulated data and real data. Section 5 concludes the paper.

2. Computer Simulation for Speckle Fringe and Phase Map

The schematic of the DHSPI system is shown in Figure 1, and the laser is divided into an object beam and a reference beam by a beam splitter. The object beam is driven by mirrors, and eventually illuminates the surface of the rough object. After the reference beam passes through a series of optical devices, the reference beam is combined with the object beam by a collimated beam combiner. The combined beam is recorded by a charge-coupled device (CCD) sensor. In the reference beam path, a mirror on a piezoelectric transducer is used for generating the optic path difference.
Assume that the object beam U O ( u , v ) and the reference beam U R ( u , v ) are described by
U O ( u , v ) = a O ( u , v ) e x p [ i ϕ O ( u , v ) ] ,
U R ( u , v ) = a R ( u , v ) e x p [ i ϕ R ( u , v ) ] ,
where ( u , v ) are spatial coordinates, a O ( u , v ) and a R ( u , v ) are the corresponding amplitudes of beam, and ϕ O ( u , v ) and ϕ R ( u , v ) are the phase terms. Before the surface of the object is deformed, the resulting intensity I 1 ( u , v ) of the speckle pattern on the detector can be written as
I 1 ( u , v ) = | U O ( u , v ) + U R ( u , v ) | 2 ,
and we can further derive that
I 1 ( u , v ) = a 2 O ( u , v ) + a 2 R ( u , v ) + 2 a 2 O ( u , v ) a 2 R ( u , v ) cos [ φ 1 ( u , v ) ] ,
where φ 1 ( u , v ) = ϕ O ( u , v ) ϕ R ( u , v ) . When the surface of the object is deformed, the resulting optical intensity I 2 ( u , v ) on the detector is defined as
I 2 ( u , v ) = a 2 O ( u , v ) + a 2 R ( u , v ) + 2 a 2 O ( u , v ) a 2 R ( u , v ) cos [ φ 2 ( u , v ) ] .
The phase difference between I 1 ( u , v ) and I 2 ( u , v ) can be expressed as
Δ φ ( u , v ) = φ 1 ( u , v ) φ 2 ( u , v ) ,
and the subtraction operation between I 1 ( u , v ) and I 2 ( u , v ) can be expressed as a speckle fringe pattern,
I d ( u , v ) = | I 1 ( u , v ) I 2 ( u , v ) | .
The establishment of the database is necessary to train the model. In this work, the method of manipulating the spectrum of the light field by imitating the 4f system is used to generate a speckle pattern, and a low-pass filter d ( k 1 , k 2 ) is simulated to be applied in object beams to imitate an aperture [32,33]. An object beam can be written as
U O ( u , v ) = F 1 { d ( k 1 , k 2 ) × F { a O ( u , v ) e x p [ i ϕ O ( u , v ) ] } } ,
where F represents the Fourier transform and F−1 represents the inverse Fourier transform. For simulation, the phase ϕ O ( u , v ) as a random variable is uniformly distributed in ( π , π ] , and the amplitude a O ( u , v ) is set to a constant of 1. The undeformed intensity I 1 ( u , v ) can be generated by Equation (3), where U R ( u , v ) = 1 for simulation. After the object deformation, the phase term ϕ O ( u , v ) of the object beam is changed into ϕ O ( u , v ) + Δ φ ( u , v ) . Similarly, the deformed intensity I 2 ( u , v ) can also be simulated by Equation (3). According to Equation (7), the speckle fringe pattern can be computed by the subtraction operation between I 1 ( u , v ) and I 2 ( u , v ) .
The speckle fringe pattern with the different speckle sizes can be generated by adjusting the aperture size d ( k 1 , k 2 ) according to Equation (8). An example with simulated data is shown in Figure 2, and the peaks function as the phase difference Δ ϕ ( u , v ) is simulated. The speckle fringes (500 × 500 pixels) with the different aperture sizes generate different speckle sizes, where the smaller selected aperture produces a larger speckle size.
The wrapped phase can be estimated from the undeformed and deformed state of the intensity maps by a phase-shifting algorithm [34], and the wrapped phase is obtained by
ϕ N ( u , v ) = atan 2 [ S N ( u , v ) , C N ( u , v ) ] ,
where S N ( u , v ) are sine fringe patterns, and C N ( u , v ) are cosine fringe patterns. ϕ N ( u , v ) is the wrapped phase containing speckle noise, which is distributed in ( π , π ] . Figure 3 indicates the estimated wrapped phases under different aperture sizes. Here, the wrapped phase maps reveal the evident noise, which may produce errors in assessing defects of artworks. Therefore, effective filtering of the noisy wrapped phase map is important to help the structural diagnosis of artworks.

3. Deep Neural Network for DHSPI Wrapped Phase Denoising

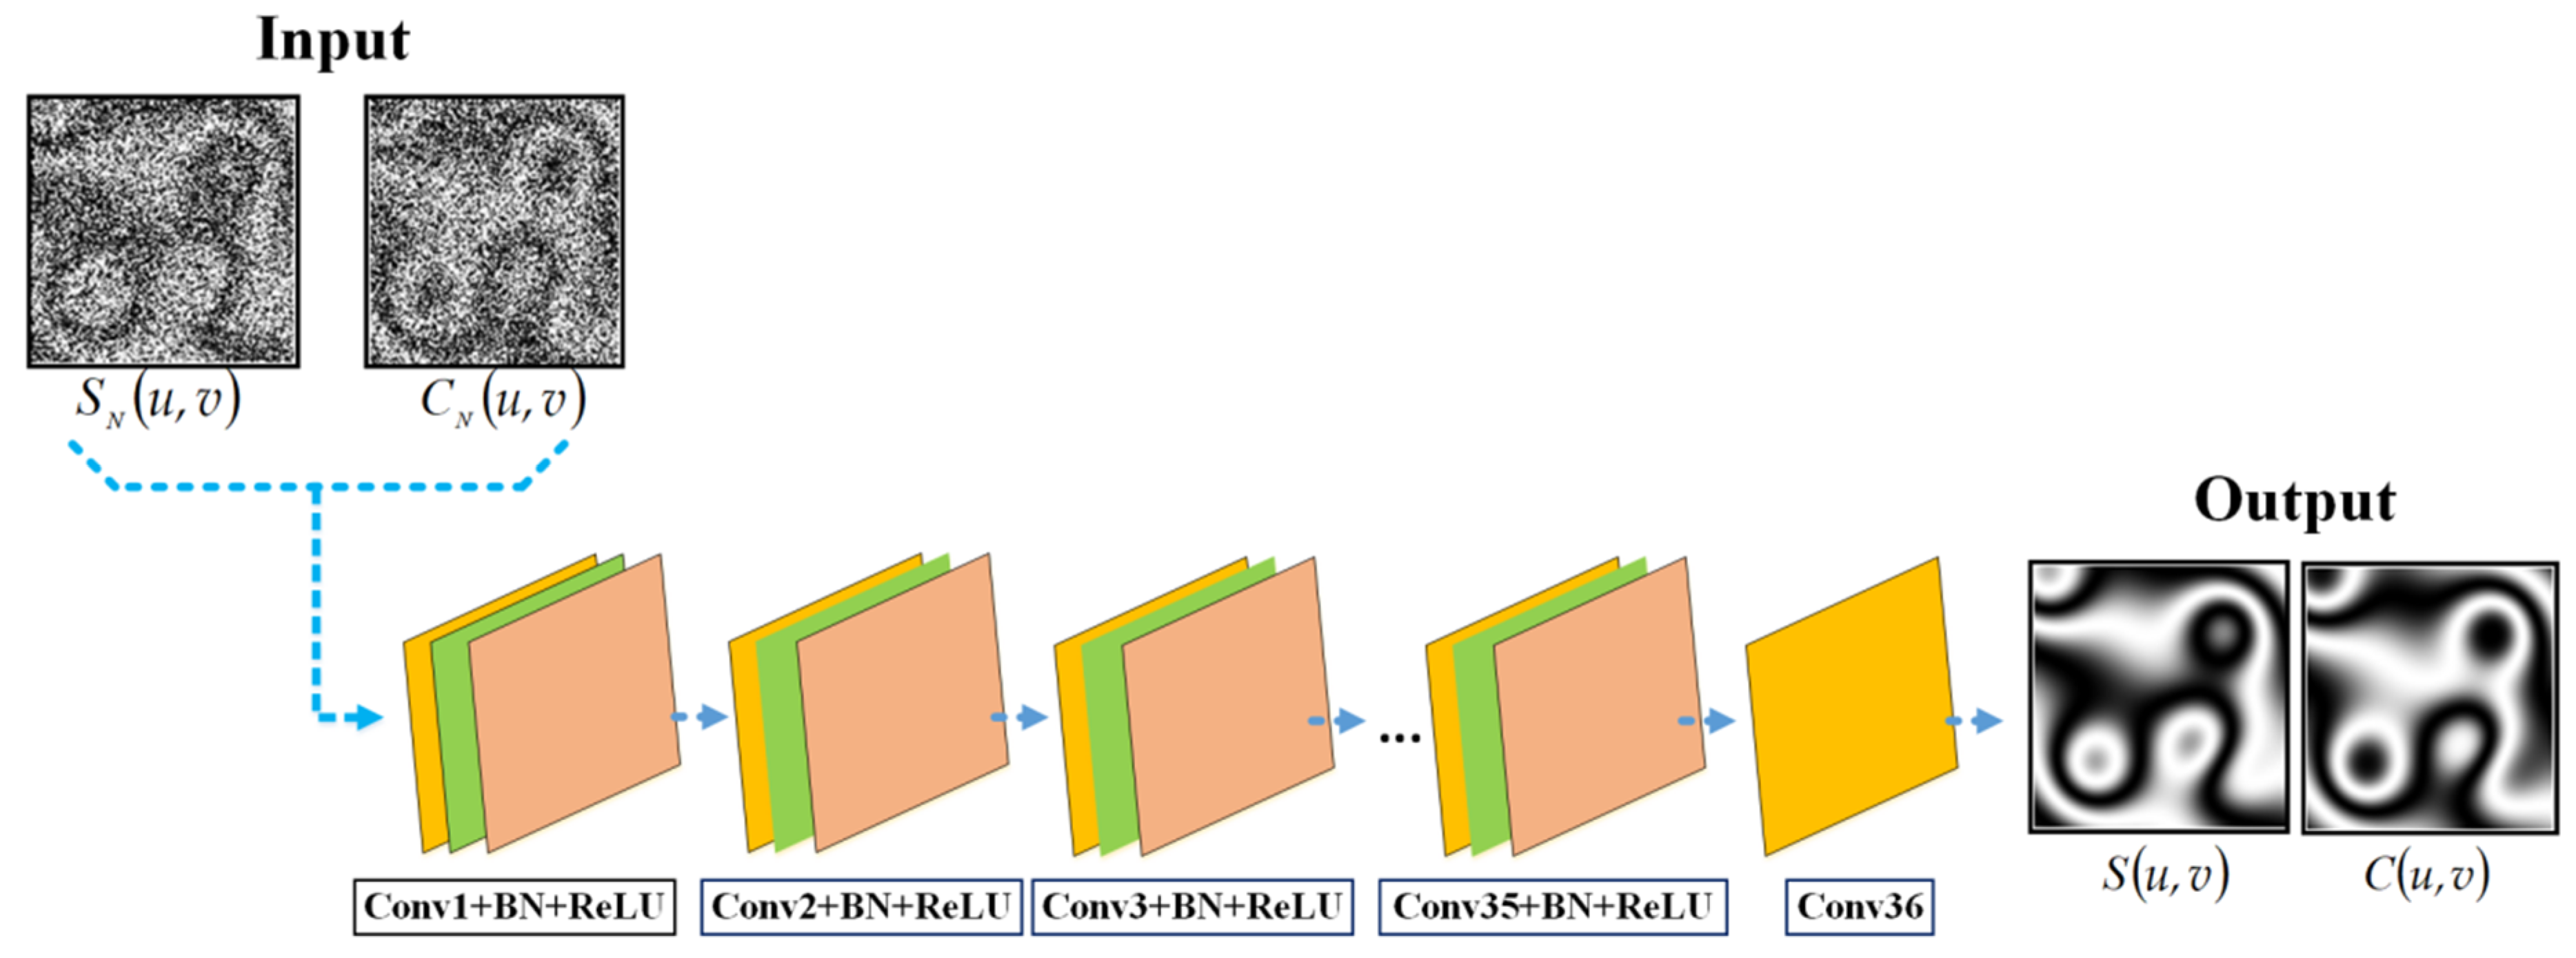
3.1. Denoising Method

Convolutional neural networks (CNN) have been successful in processing various visual tasks and have demonstrated effective performance in handling Gaussian denoising [35]. In this work, the proposed network for DHSPI wrapped phase denoising is based on improved denoising convolutional neural networks (DnCNNs) [35]. The deeper neural network architecture for DHSPI wrapped phase denoising is illustrated in Figure 4.
In the proposed method, the noisy sine and cosine fringe patterns are denoising by CNN for solving the 2 π discontinuities in the noisy wrapped phase. As can be seen from Figure 4, the noisy sine S N ( u , v ) and cosine C N ( u , v ) fringe patterns are input data. The input data are first computed by 35 convolutional layers, and the rectified linear unit (ReLU) [36] for non-linear mapping and batch normalization (BN) layers [37] for easier training are used after each convolutional layer. Each convolutional layer (from the 1st to 35th layer) has 32 filters of size 3 × 3 × 32. Supposing that the input data of each layer (from 1st to 35th) is β i , the learned features Z i ( β i ) on each layer are expressed mathematically as [38]
Z i ( β i ) = R e L U [ B N ( β i * W i ) ] , i = 1 , 2 35
where W i represents the weights, and the * represents convolution operation.
The 36th layer is the convolutional layer, which outputs the denoised sine S ( u , v ) and cosine C ( u , v ) fringe patterns. Then, an enhanced wrapped phase map ϕ ( u , v ) can be provided by arctangent function
ϕ ( u , v ) = atan 2 [ S ( u , v ) , C ( u , v ) ] .
Network training is performed by finding the minimum loss function between the output data O ( k , r ) and the ground truth G ( k , r ) . The adaptive moment estimation (Adam) optimizer [39] is chosen as the optimization method. A mini-batch size is expressed in b , and the used loss function L is as follows
L = i = 1 b O ( k , r ) G ( k , r ) 2 b .
In this work, the learning rate is set to 1   × 10 4 . The weights are automatically updated after each iteration, and the training is completed after 100 epochs. Pytorch framework is used to perform network training, and the training process is processed on Ubuntu 14.04 with an Intel® CoreTM i7-7820X CPU@3.66GHz × 13 using the NVIDIA GTX 1080.

3.2. Data Set Preparation

To generate a data set for training the model, a simulation method of phase change Δ φ ( u , v ) is further presented here. The phase change Δ φ ( u , v ) is related to the out-of-plane displacement H ( u , v ) as shown in Equation (13) [34], where λ is wavelength (532 nm). First, the displacement H ( u , v ) with size 80 × 80 pixels is simulated based on Gaussian function as shown in Equation (14). The arithmetic operations of addition and subtraction on 8 sets of Gaussian surfaces with the different mean value η (from 1 to 80) and the different standard deviation ε (9, 13, and 18) are executed to obtain the displacement H ( u , v ) . Subsequently, phase changes with size 80 × 80 pixels are produced according to Equation (13), and 30,000 wrapped phases are generated using the simulation method mentioned in Section 2. Finally, the noisy sine and cosine fringe patterns and the corresponding noise-free data are obtained to train the model.
Δ φ ( u , v ) = 4 π × H ( u , v ) λ ,
H ( u , v ) = 600 × 1 2 π ε 2 exp ( ( u η ) 2 + ( v η ) 2 2 ε 2 ) .

4. Evaluation Performance

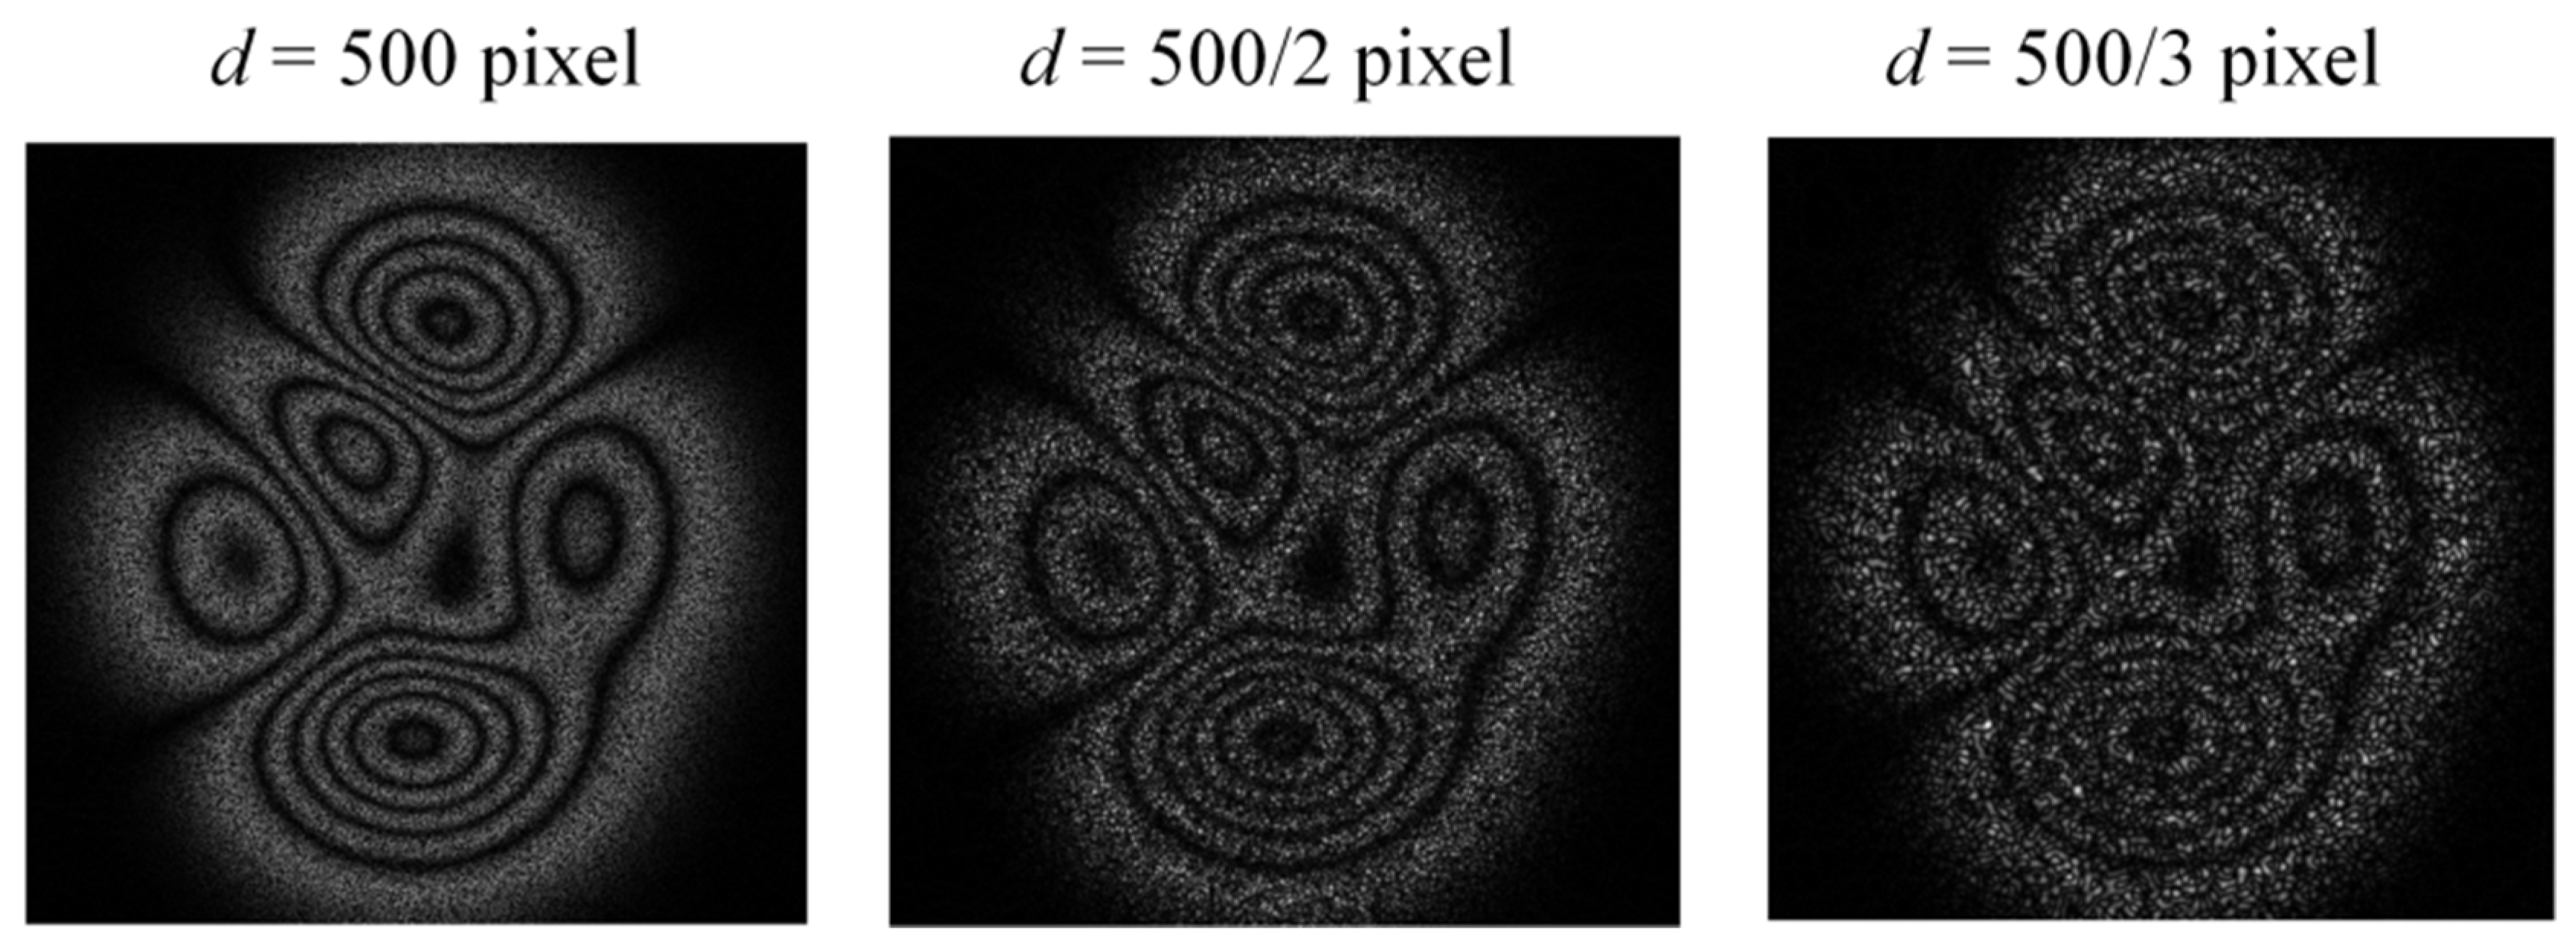
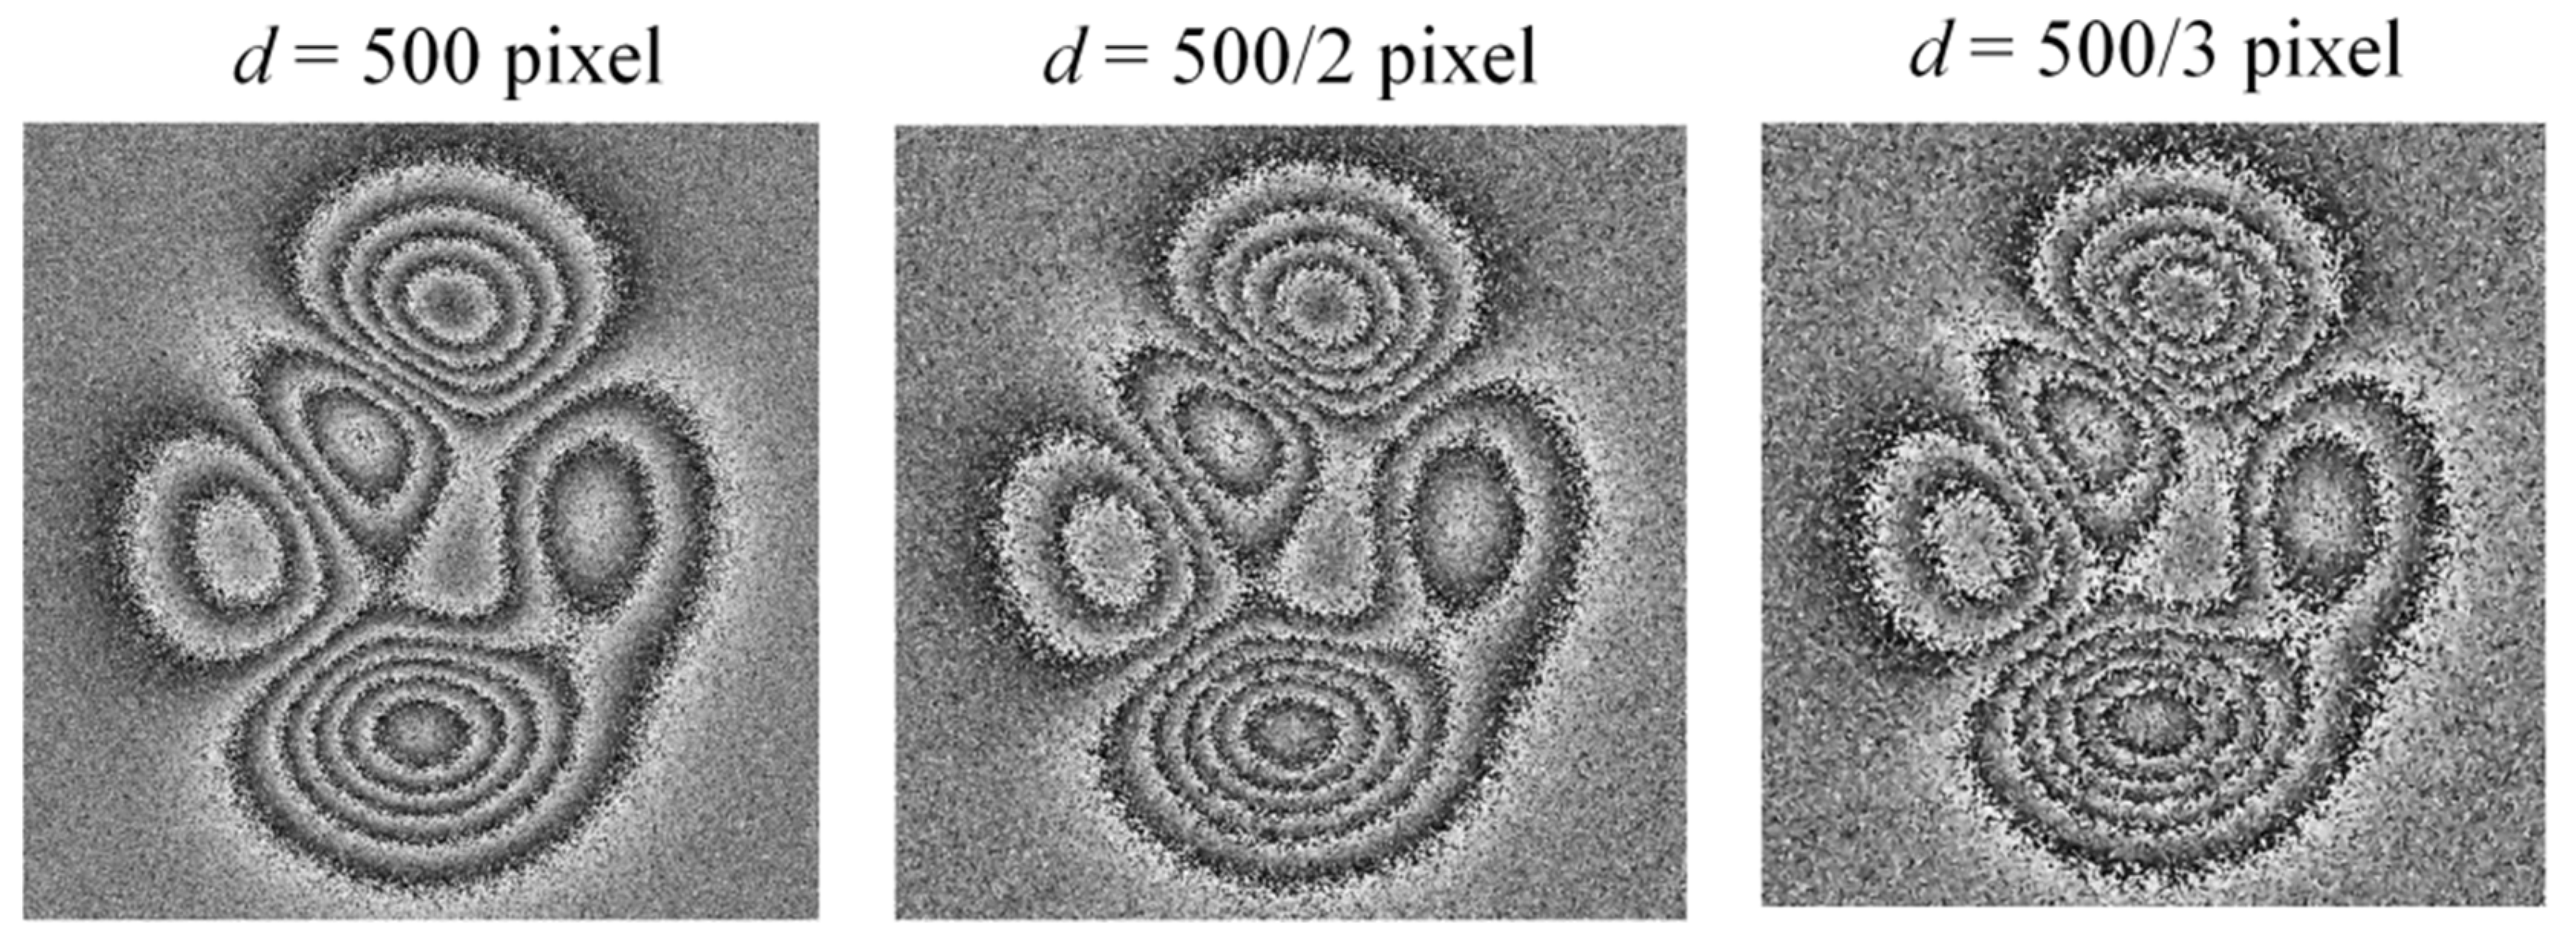
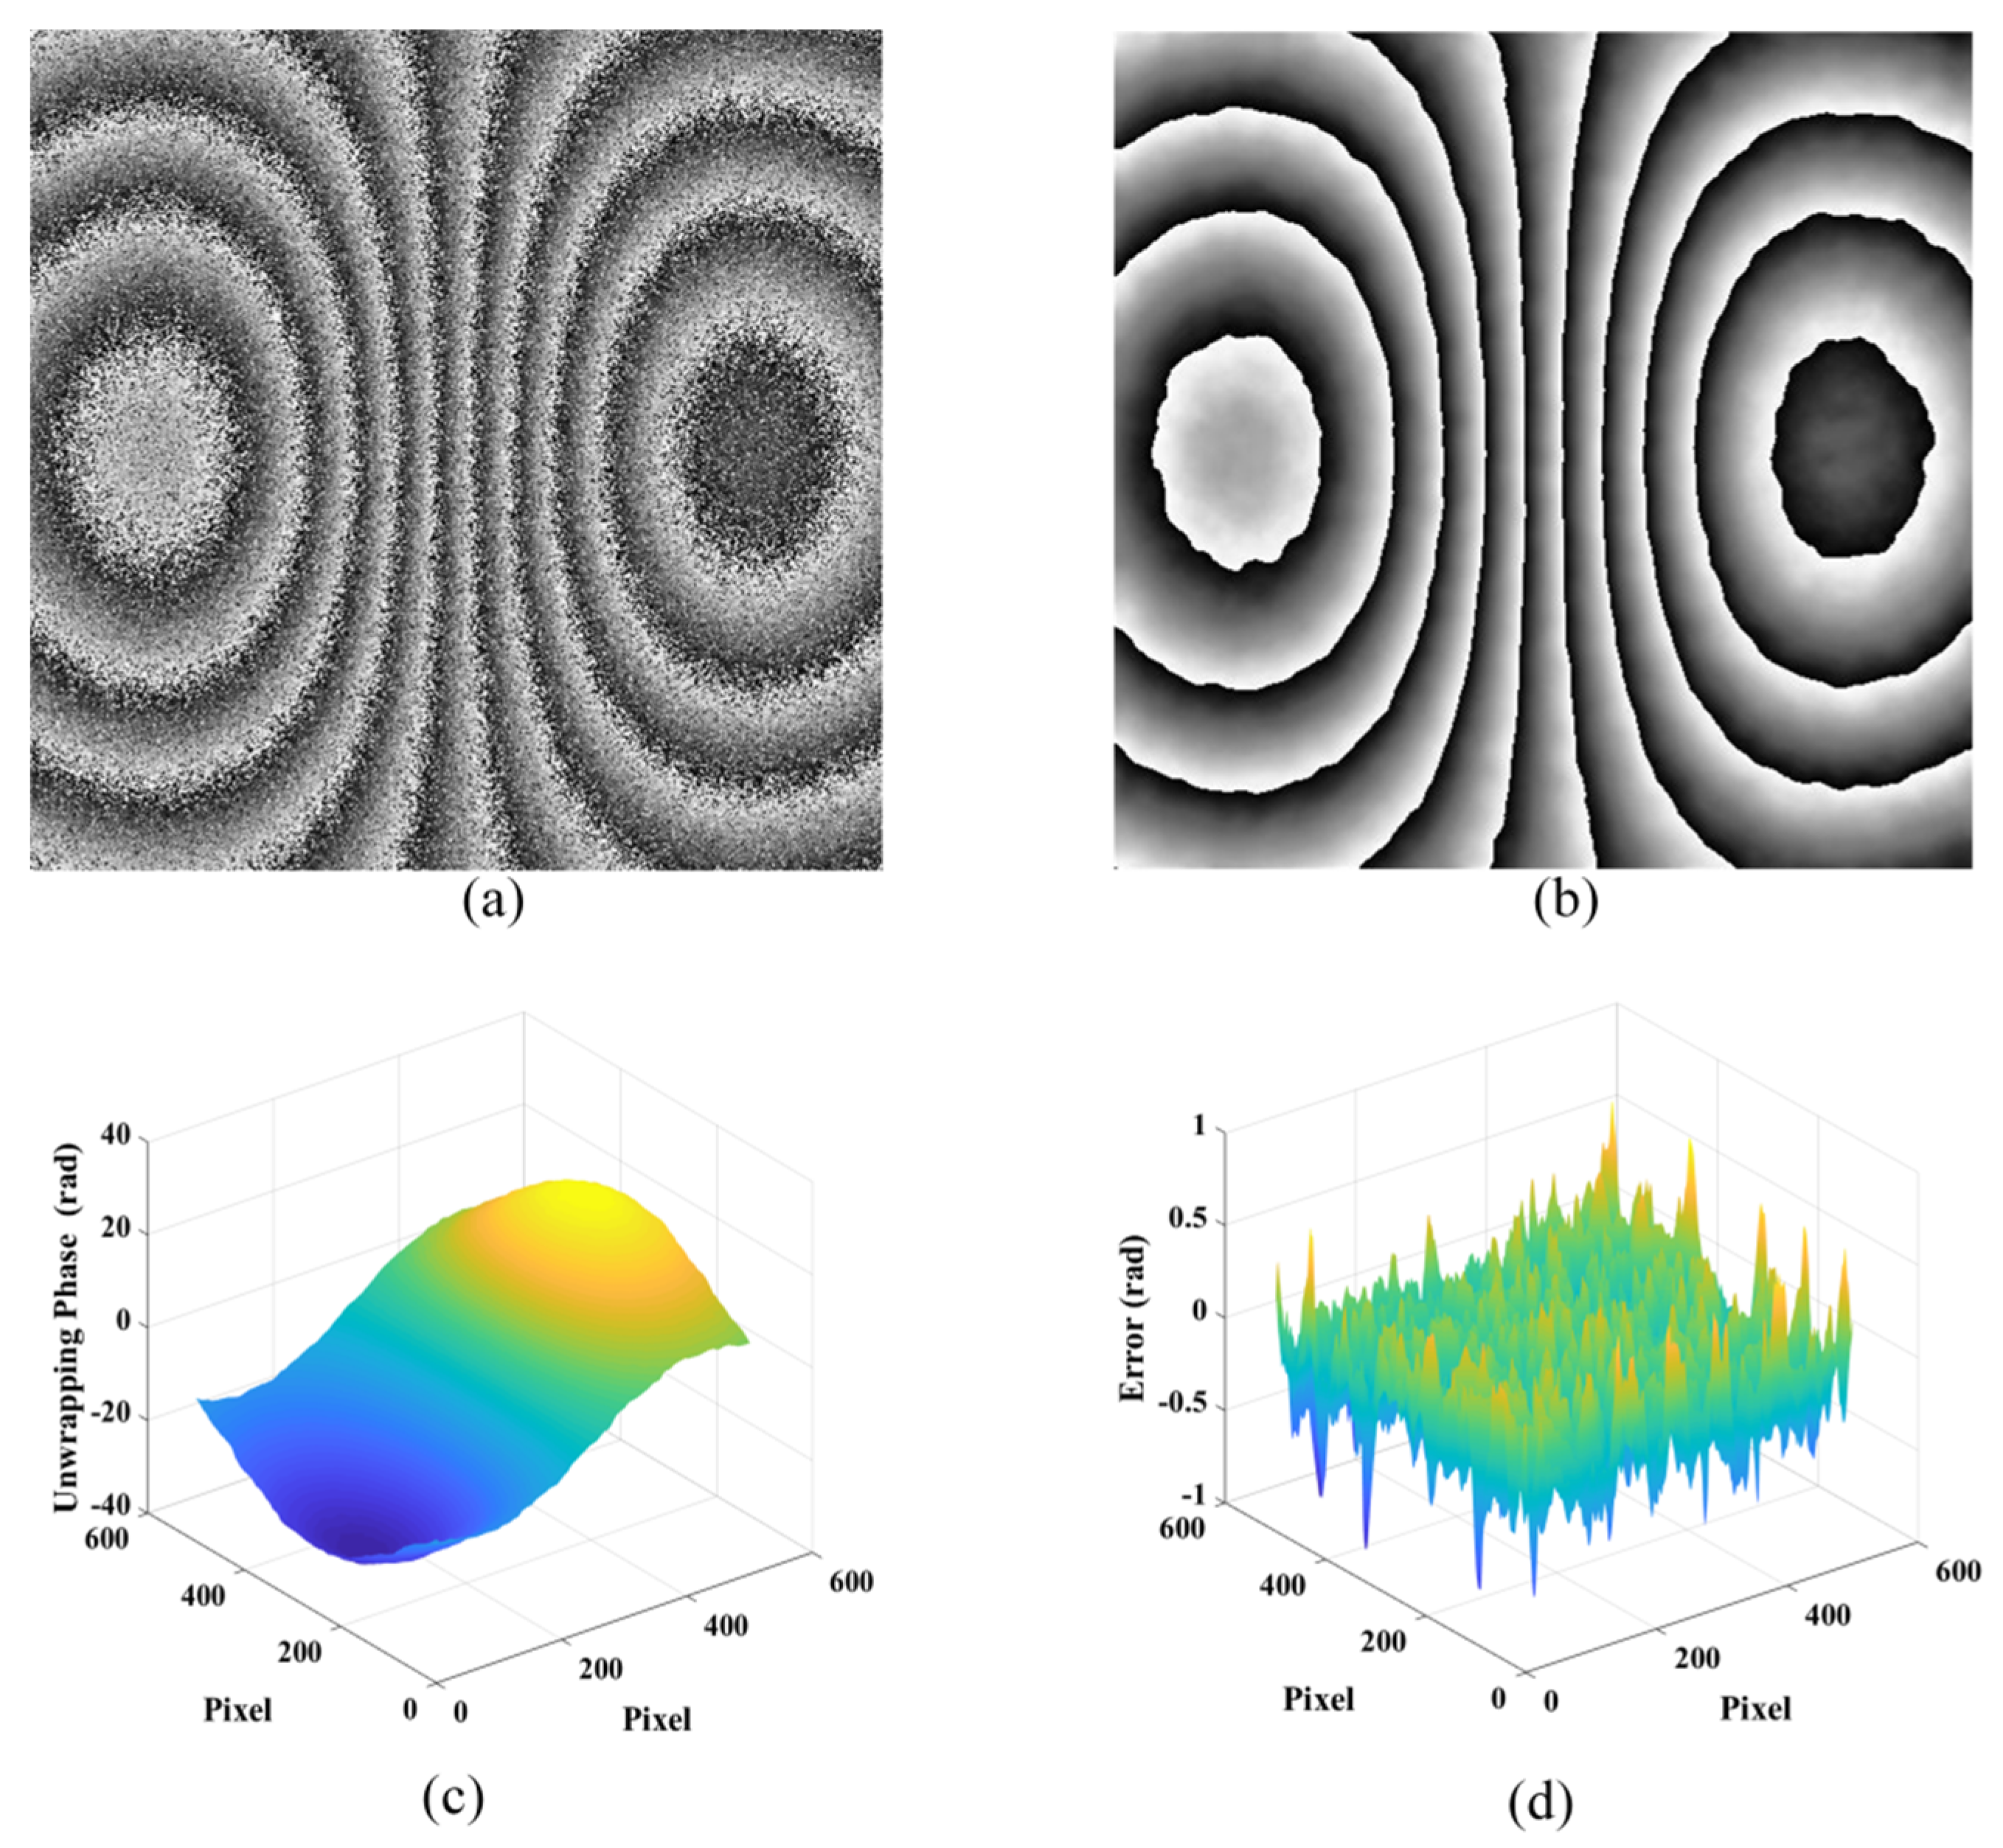
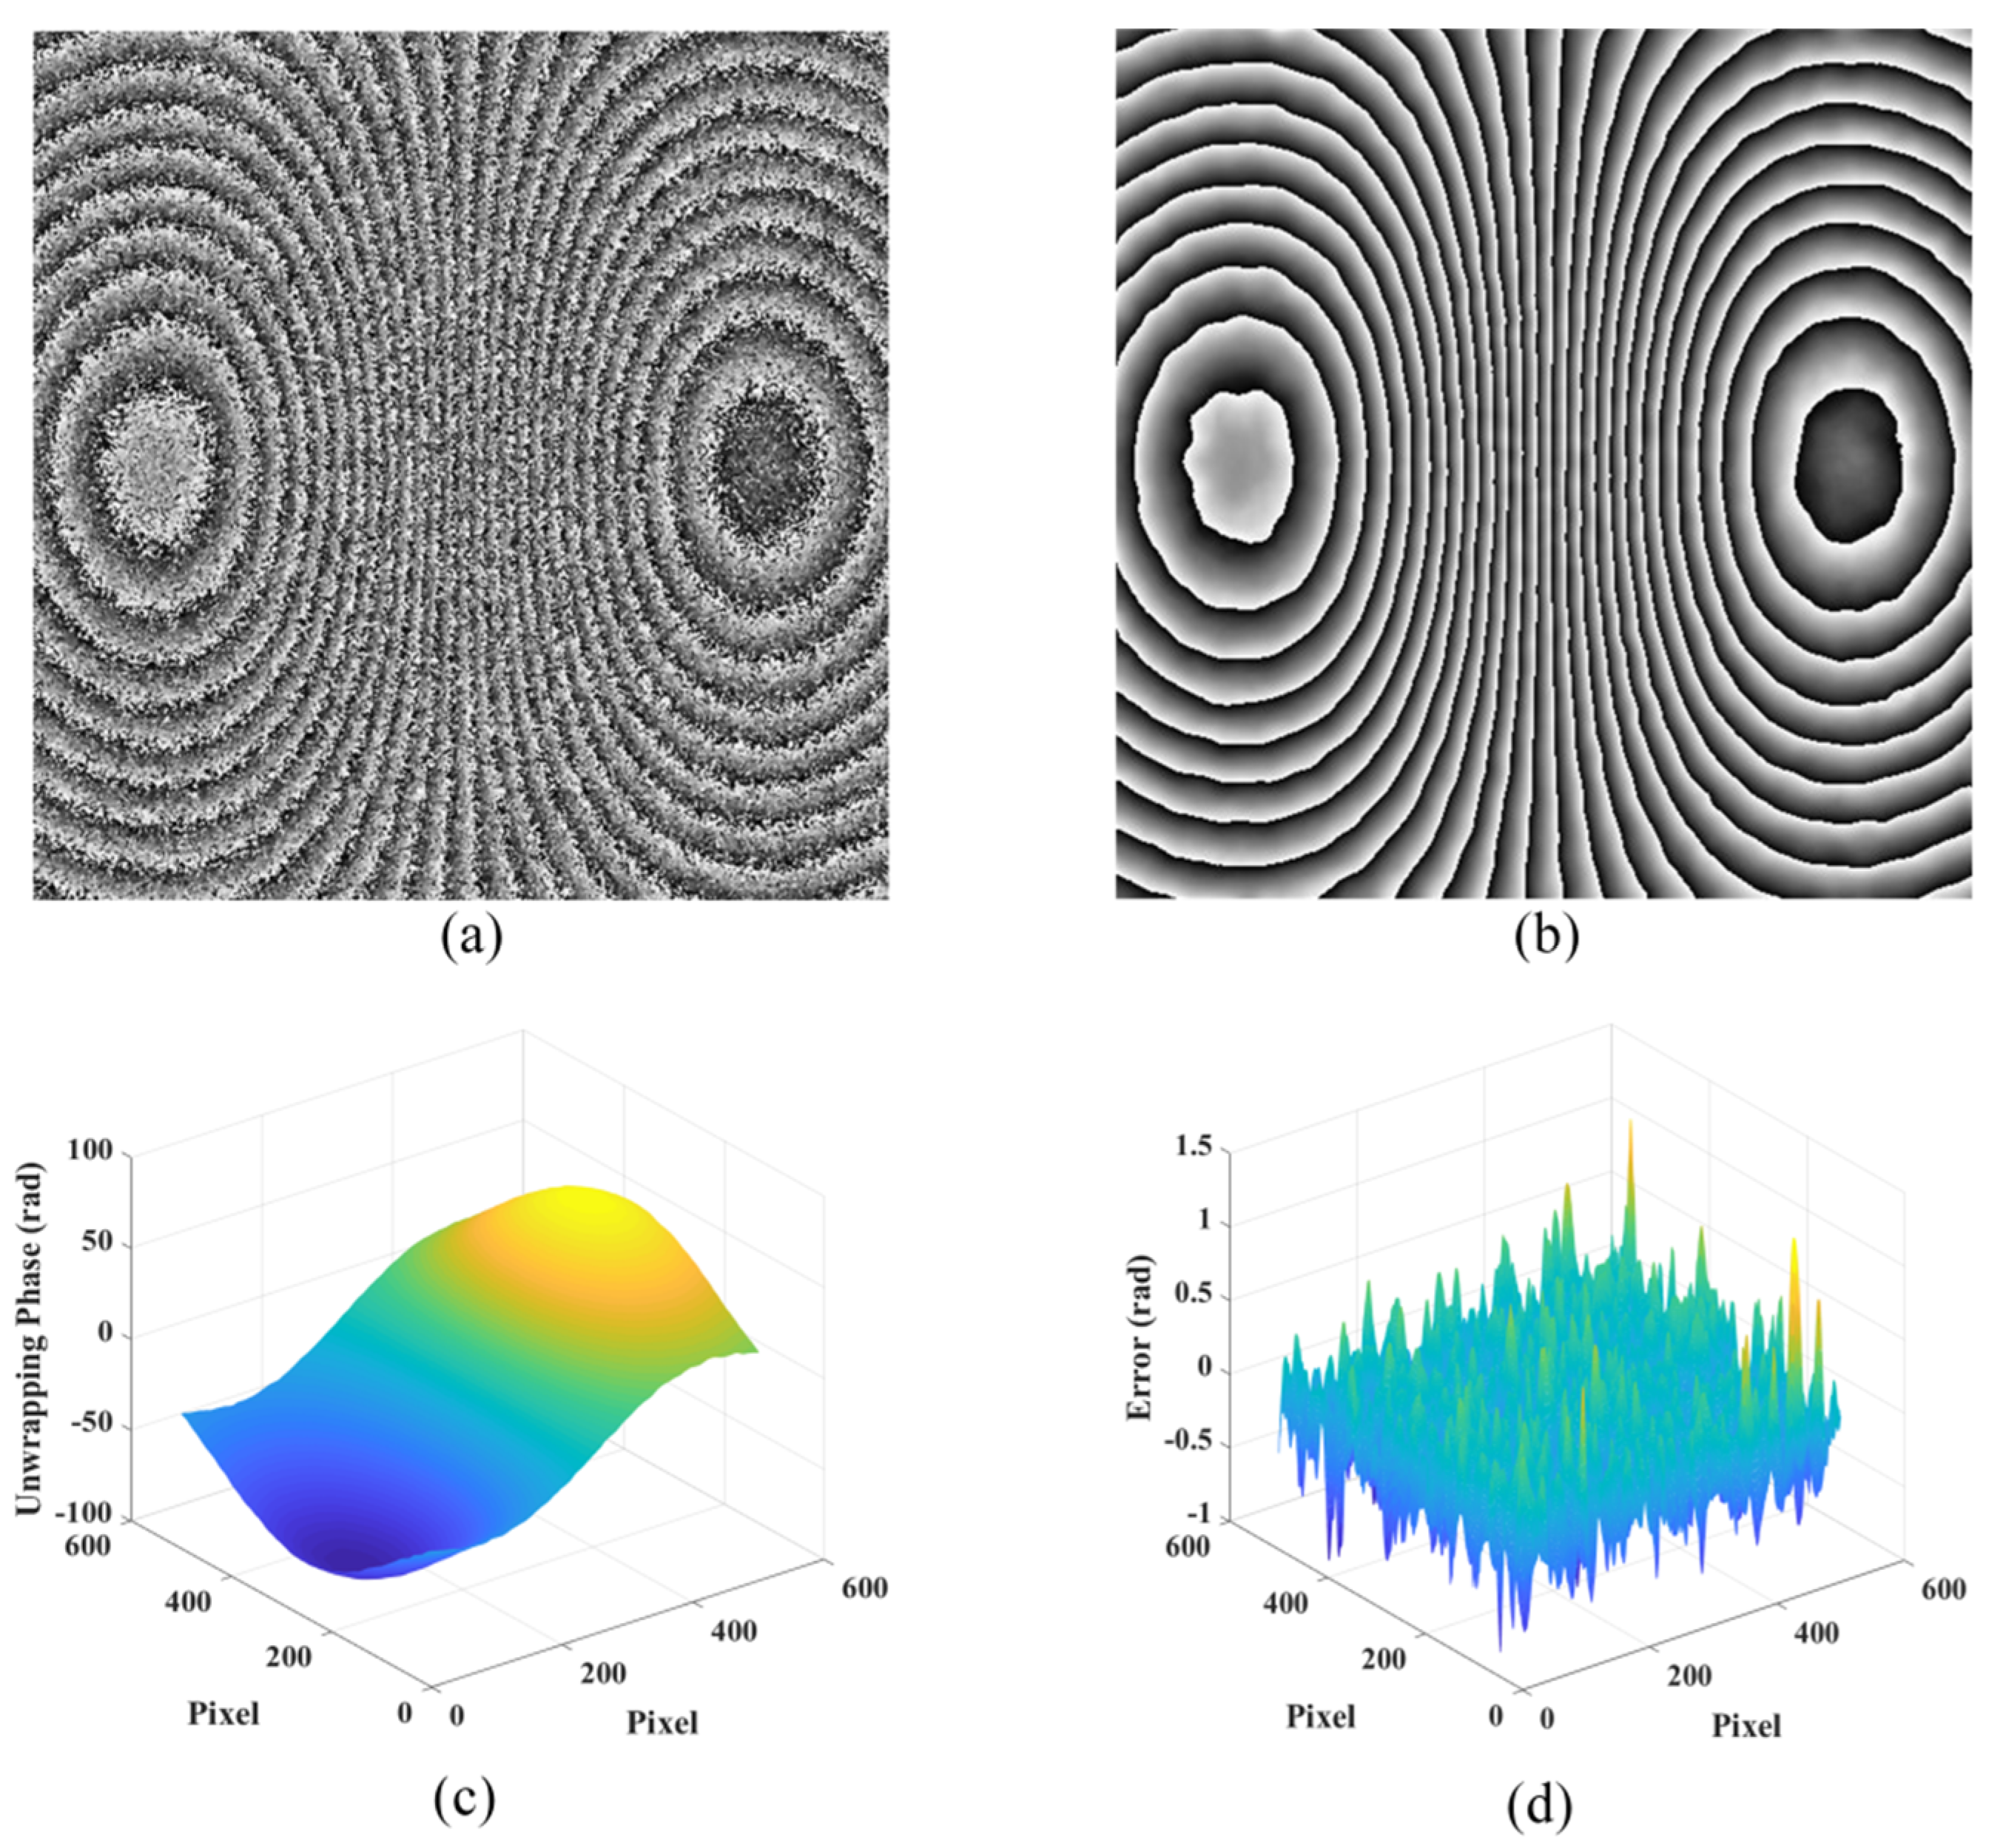
4.1. Evaluation in Simulated Data

The denoising results of simulated data are demonstrated to evaluate the performance. In Figure 5a, the noisy data with the size of 500 × 500 pixels are simulated under the speckle radius of 1 pixel, and the enhanced wrapped phase using the proposed method manifests a significant improvement on the noisy data as shown in Figure 5b. The phase unwrapping of Figure 5b using the least-squares algorithm by the discrete cosine transform (DCT) [40] is implemented in Figure 5c, which has a low error distribution as shown in Figure 5d. The Mean Squared Error (MSE) comparison between the noisy data and denoised data is provided by Table 1, and it can be seen that the noise is greatly reduced from the noisy wrapped phase.
By adjusting the size of the aperture, the simulated data in the speckle radius of 2 pixels are analyzed as shown in Figure 6a. The performance is demonstrated from the denoising result, and the denoising effect is illustrated by visualization in Figure 6b. In Figure 6c, the phase unwrapping is implemented by DCT for illustrating the denoising effect, and Figure 6d shows the low error distribution for illustrating the feasibility. In Table 1, the MSE comparison between the noisy data and denoising data indicates the good noise suppression ability of the proposed method. Besides, the calculation time for a wrapped phase with the size of 500 × 500 pixels is 3.45 s.

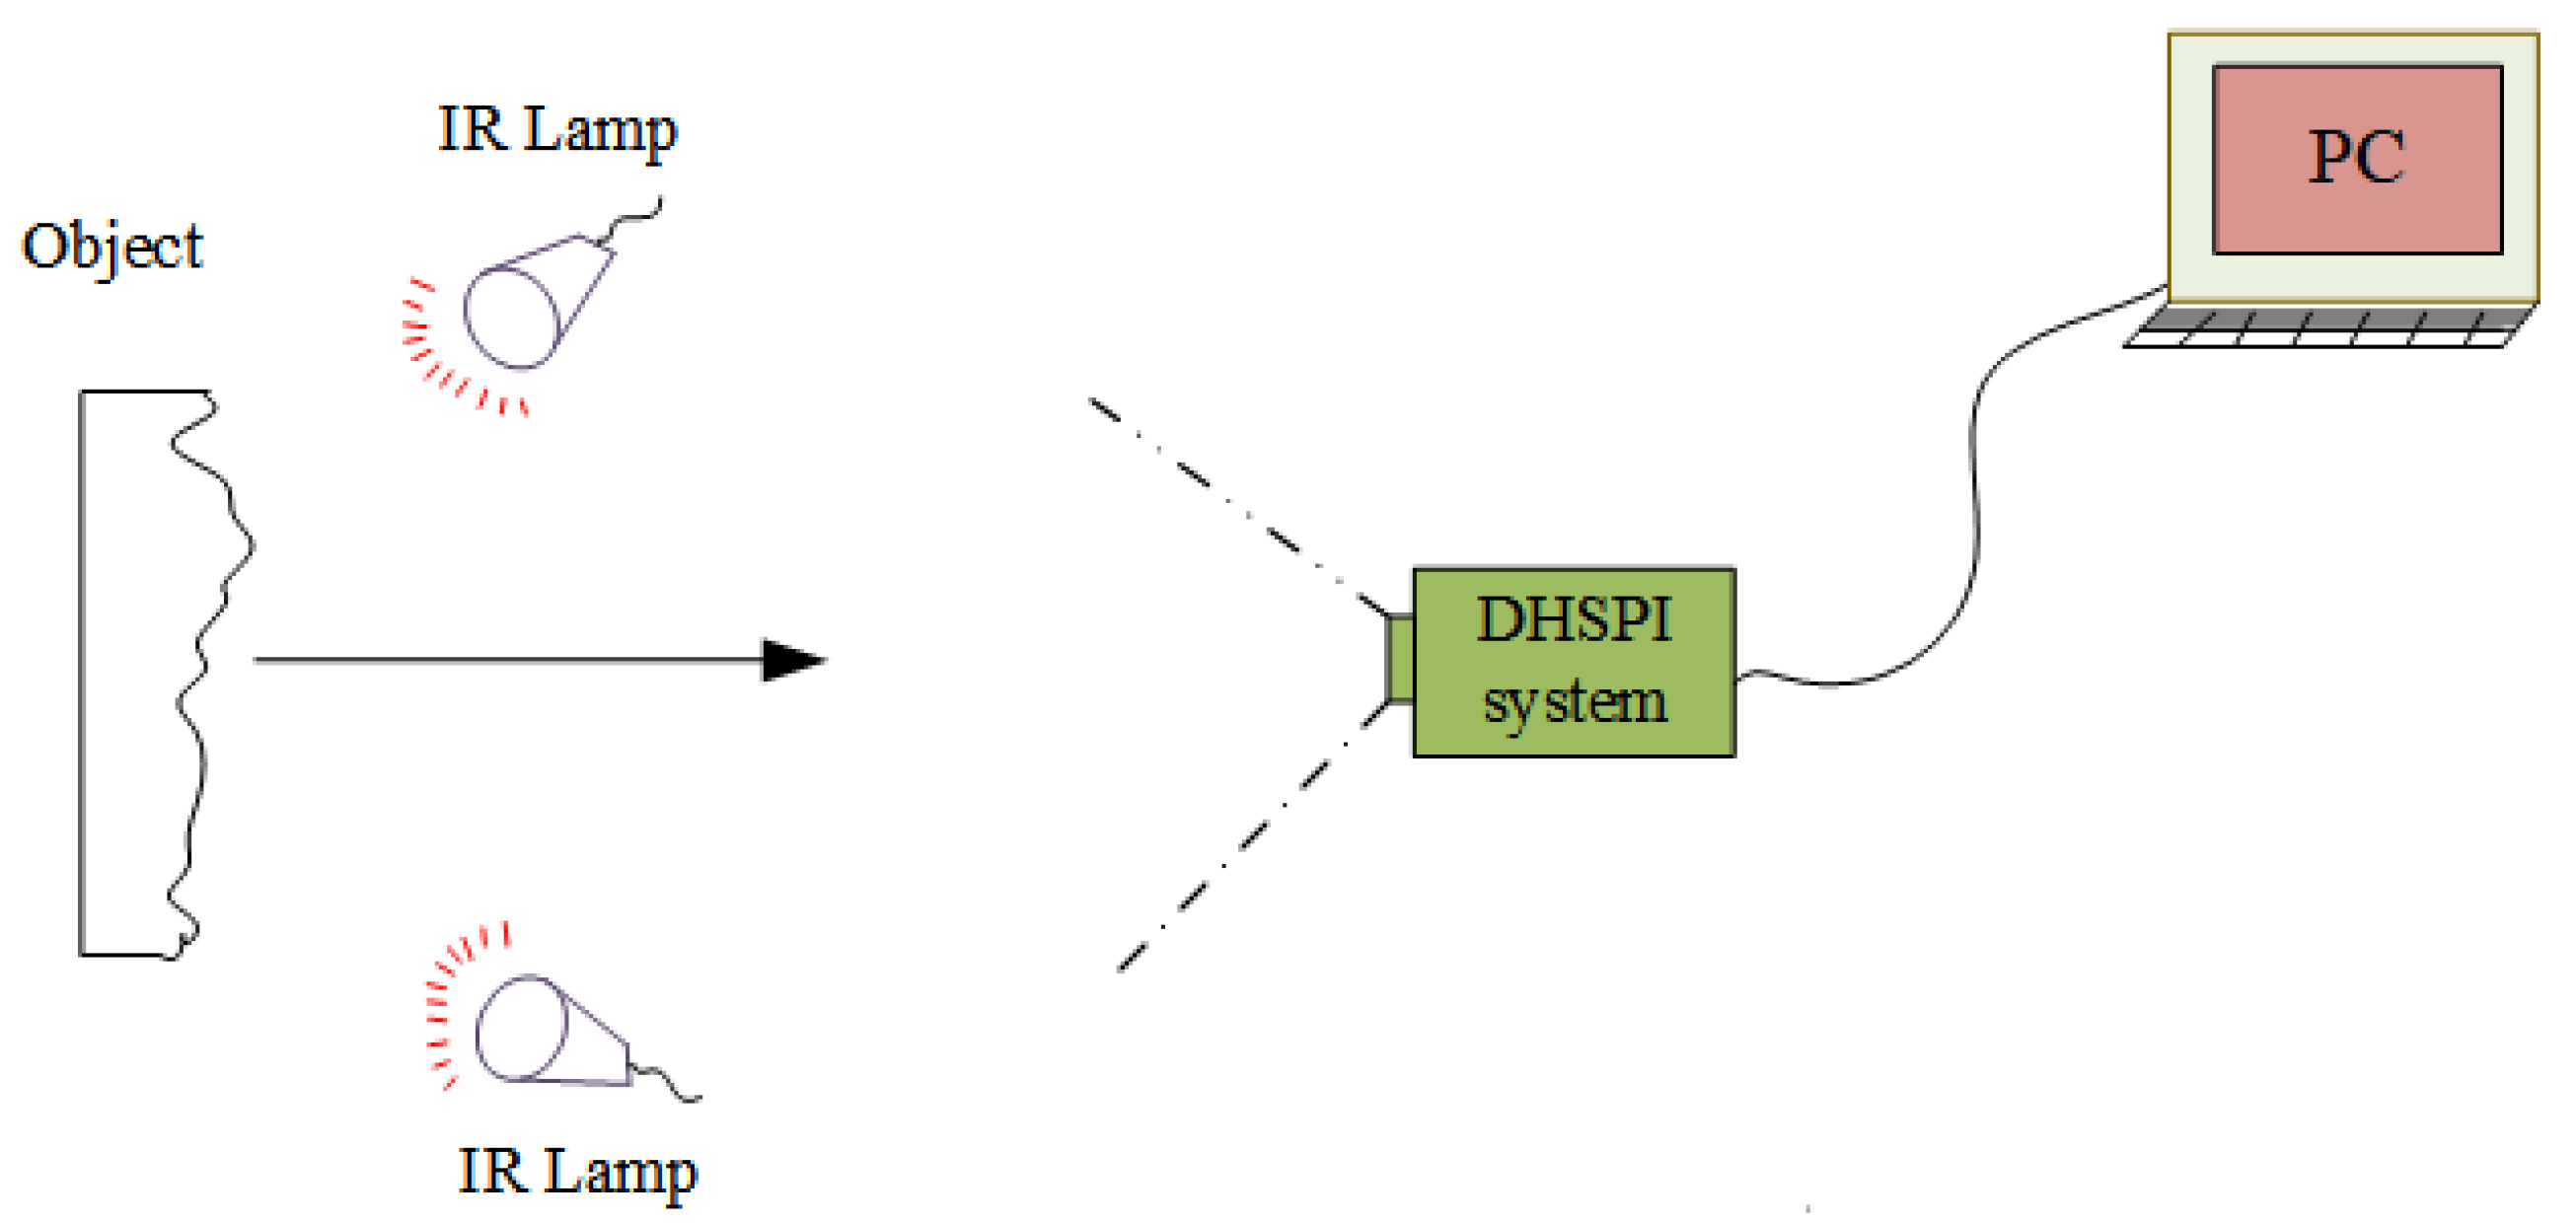
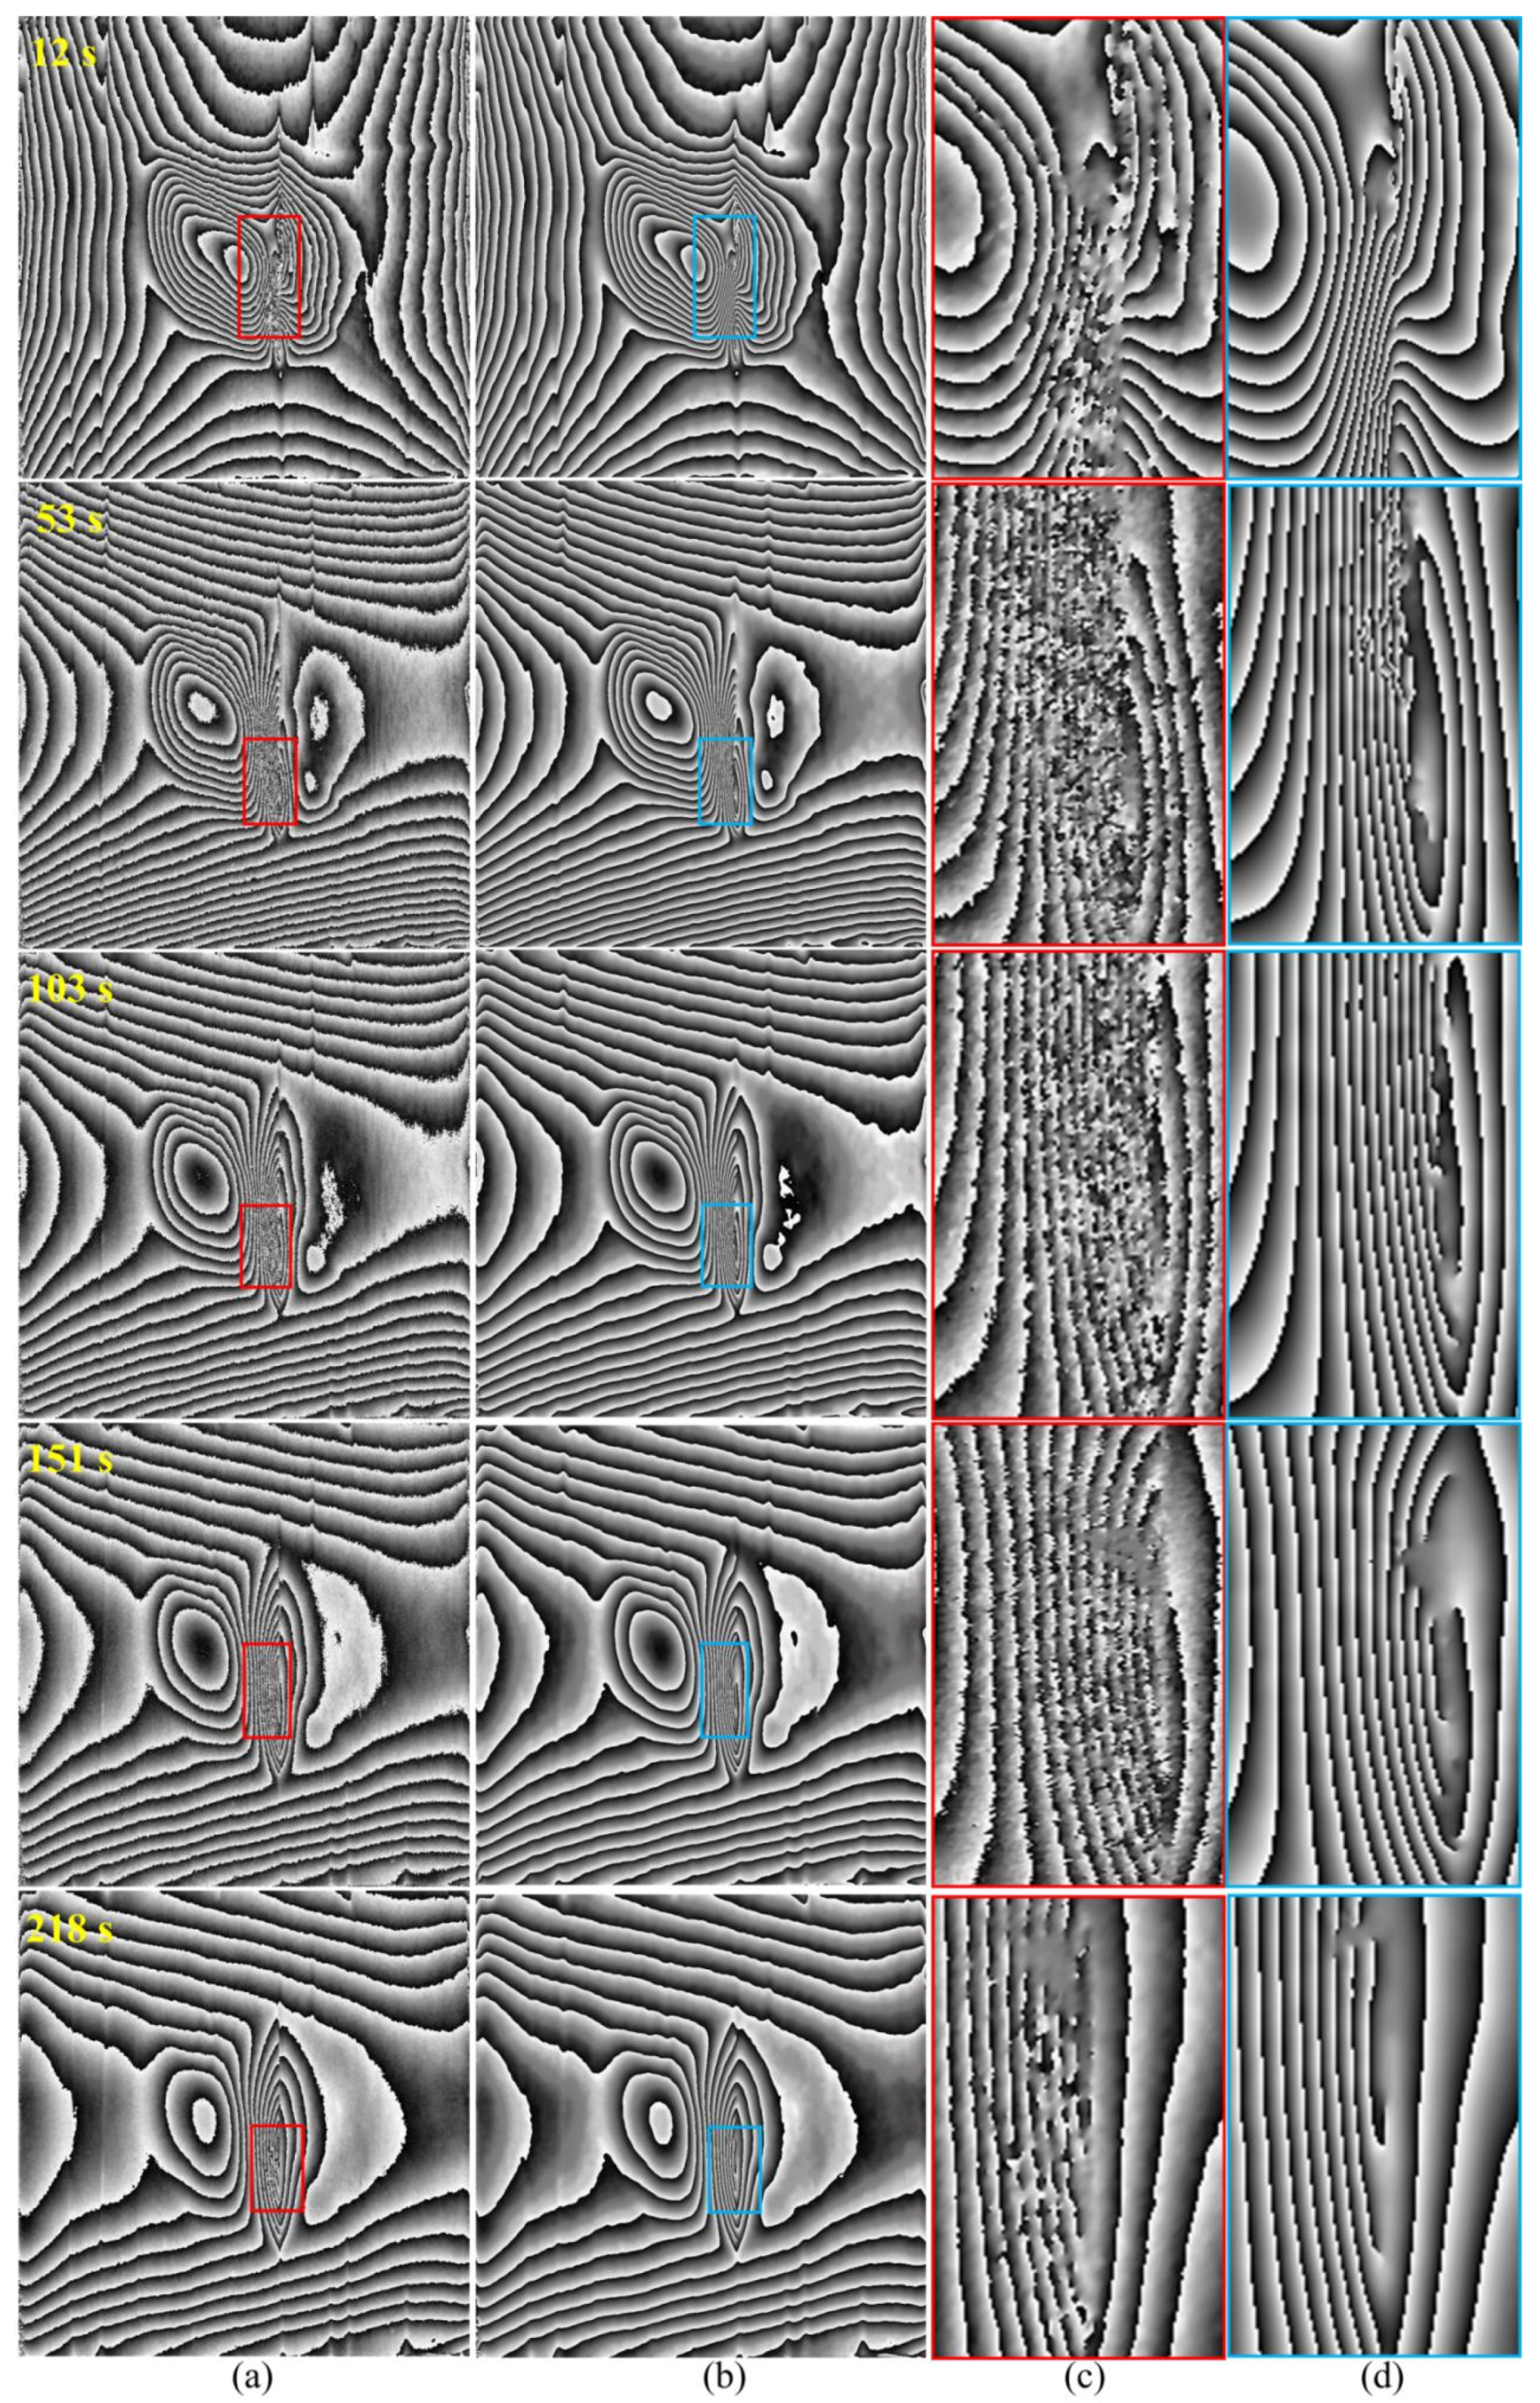
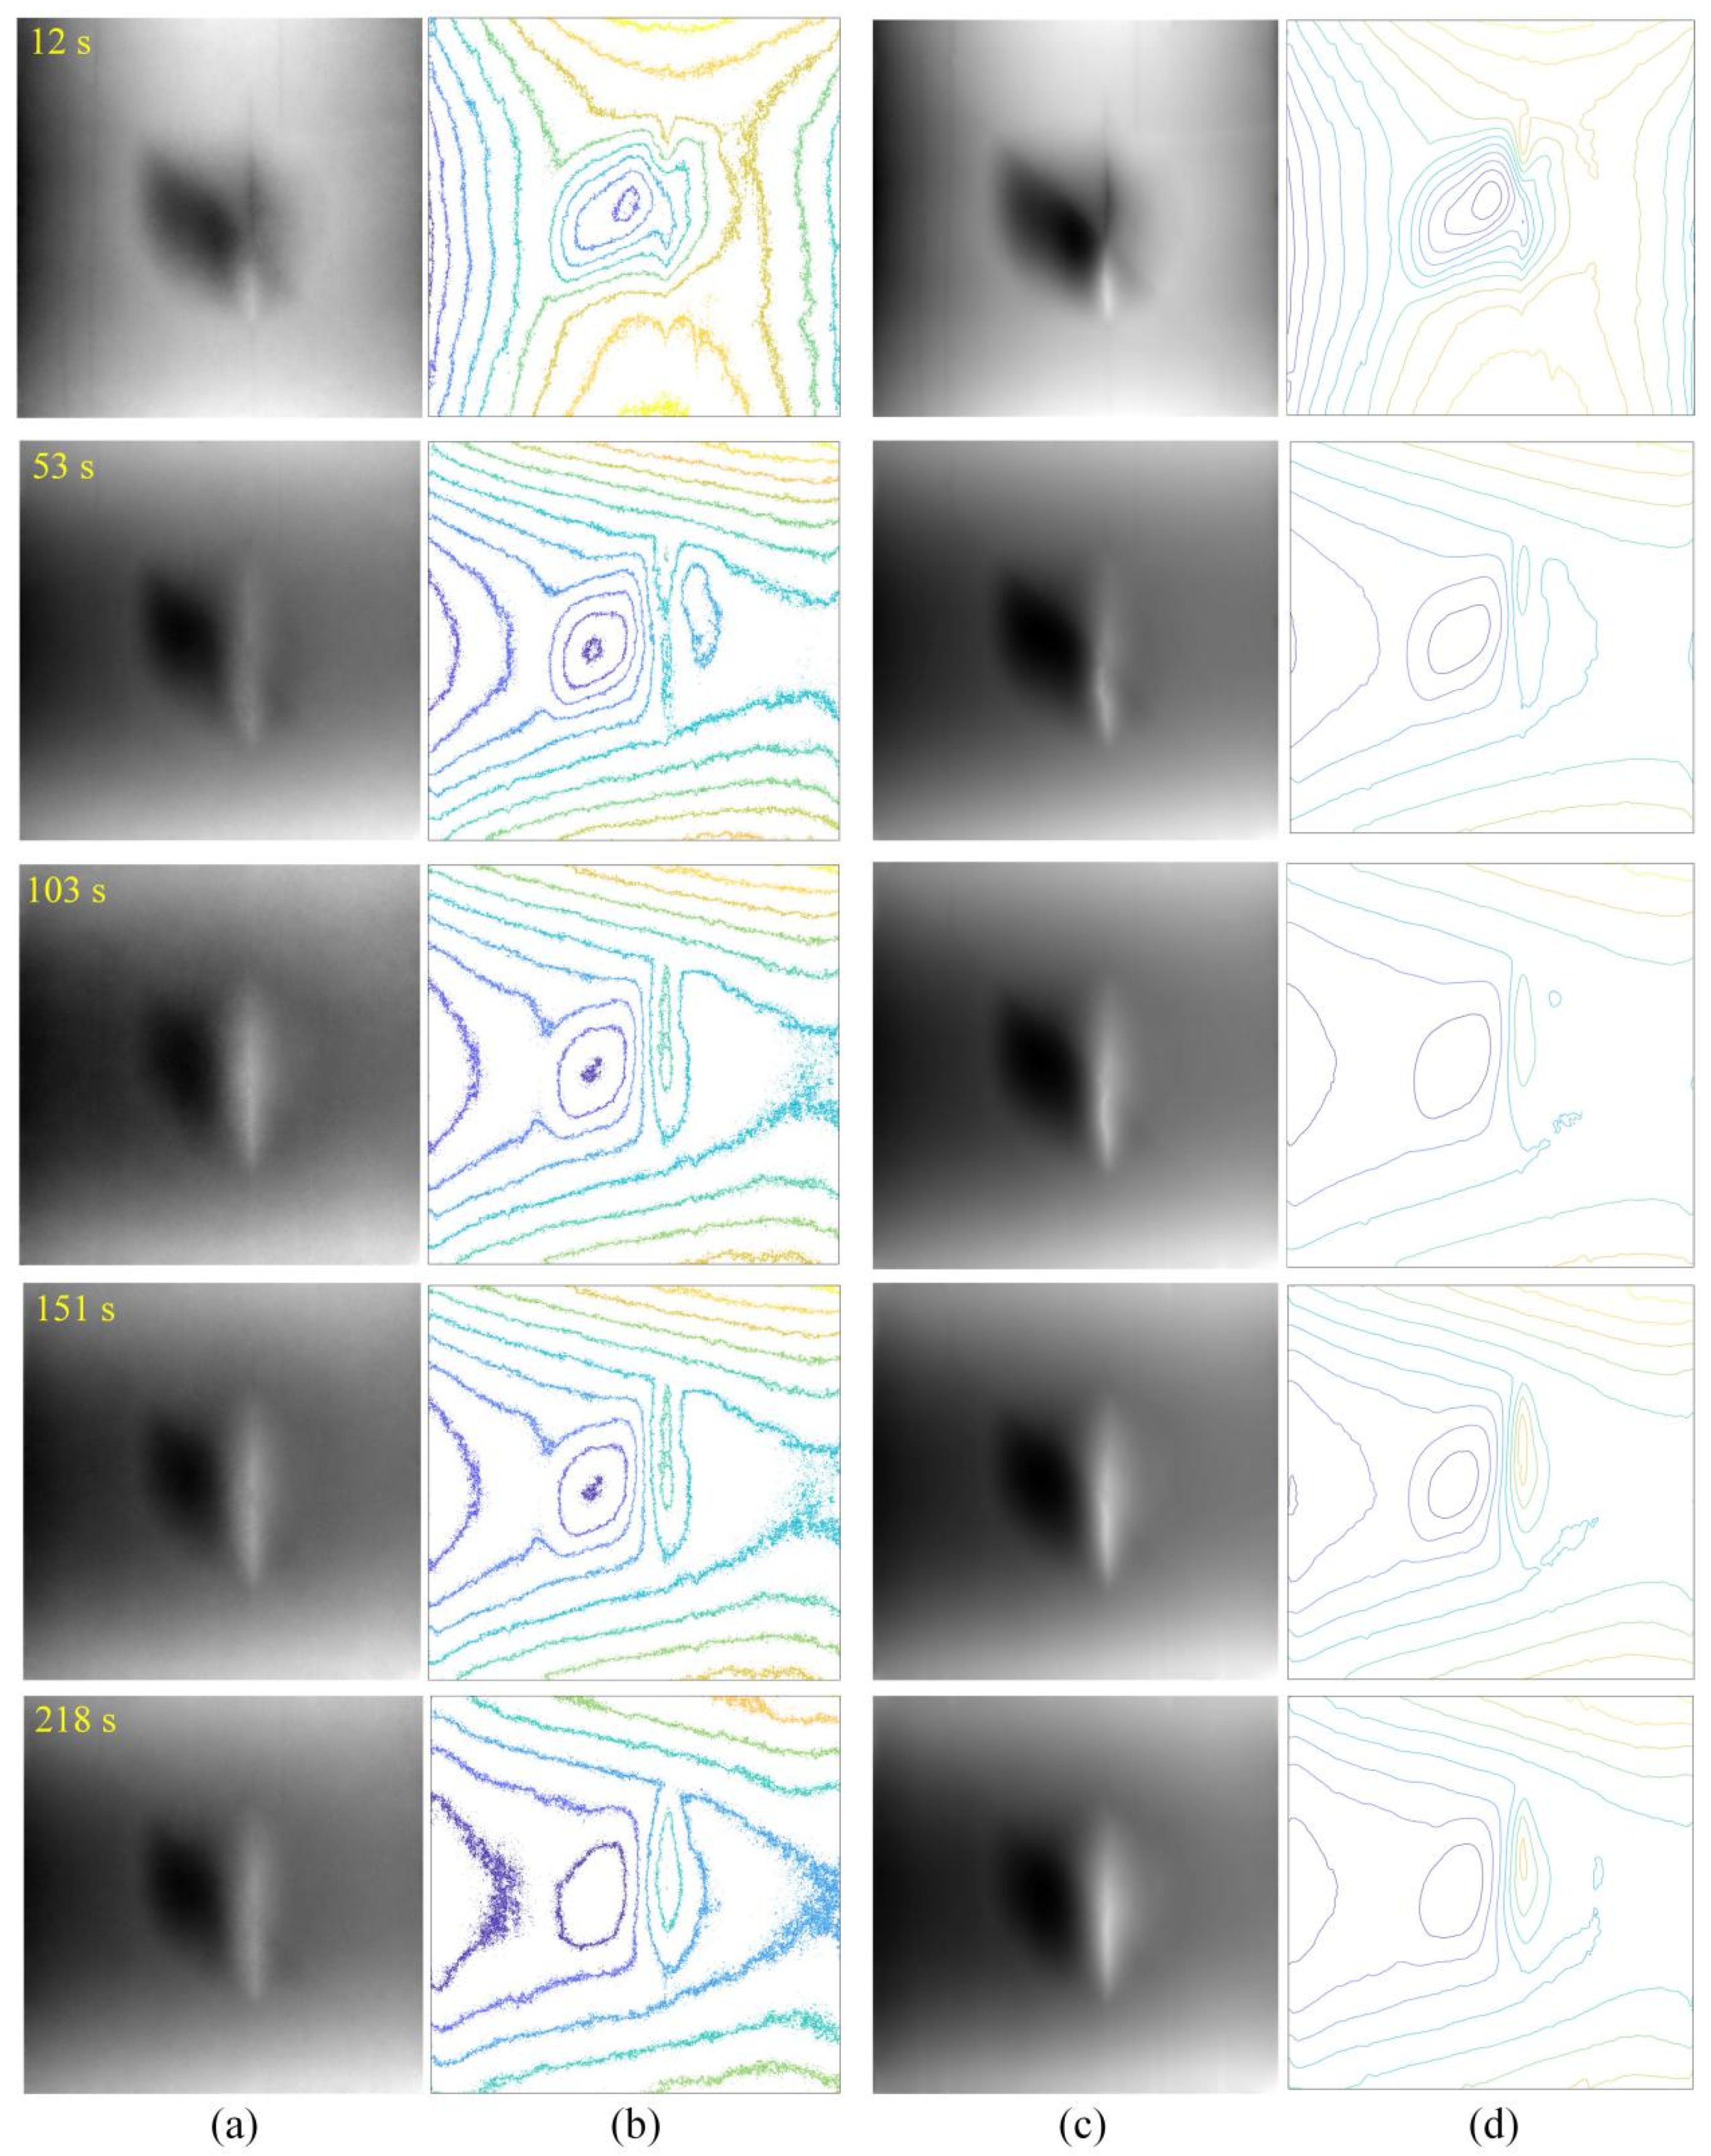
4.2. Evaluation in Captured Data

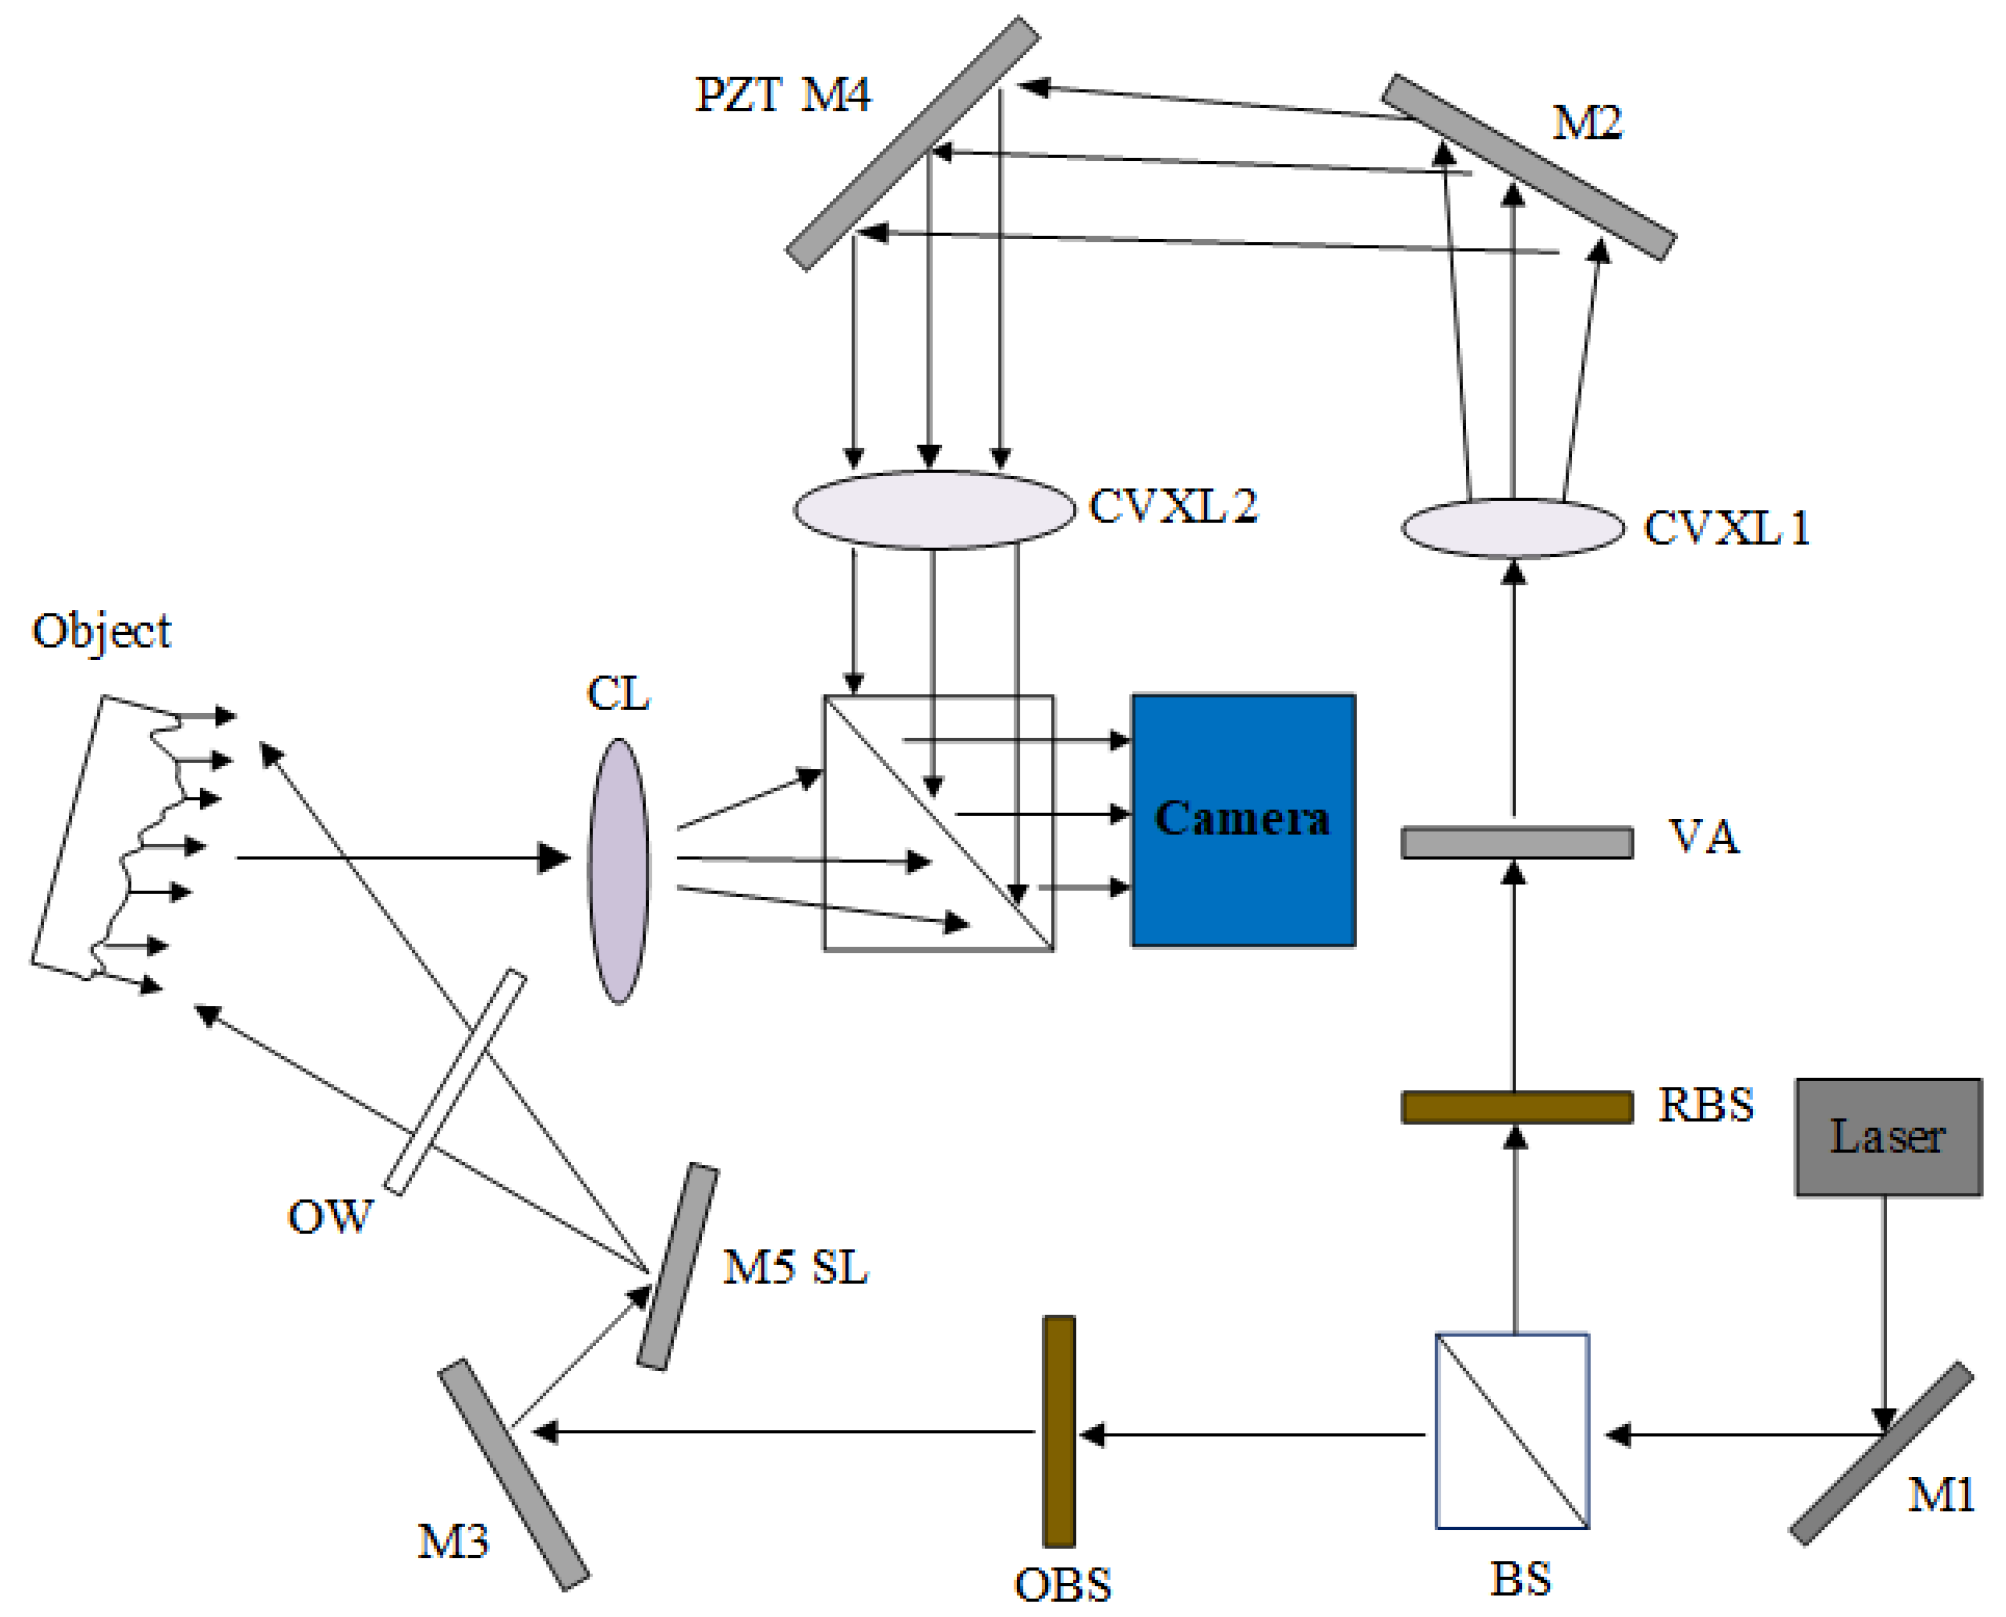
4.2.1. Data Acquisition

The precise monitoring and visualization of micro-deformation are important for understanding the structure of the defects [41]. To show the denoising effect to help the structural diagnosis, the captured data from the portable DHSPI system [13] are used to verify the performance. Figure 7 shows the schematic diagram of the measuring device [42], where IR lamps are used to provide the thermal excitation for the object. The object response after the thermal excitation is measured and recorded by the DHSPI system, and the personal computer (PC) can visualize results from the recorded data.
The object to be measured is marquetry as shown in Figure 8a. Figure 8b–f shows the estimated wrapped phase from the portable DHSPI system, and every wrapped phase represents a different state of the sample while the sample is cooling down after thermal excitation with IR lamps. The image in Figure 8b is the wrapped phase with a time interval of 12 s after the excitation. Subsequently, there are the wrapped phase maps with defect reaction at 53 s, 103 s, 151 s, and 218 s in a cooling down process after thermal excitation, respectively. However, we can observe obvious noise from these wrapped phase maps. In the high-frequency regions of the phase denoted by the red arrow, noise causes phase distortion. In such cases, it is difficult to directly estimate the depth information of the defect.

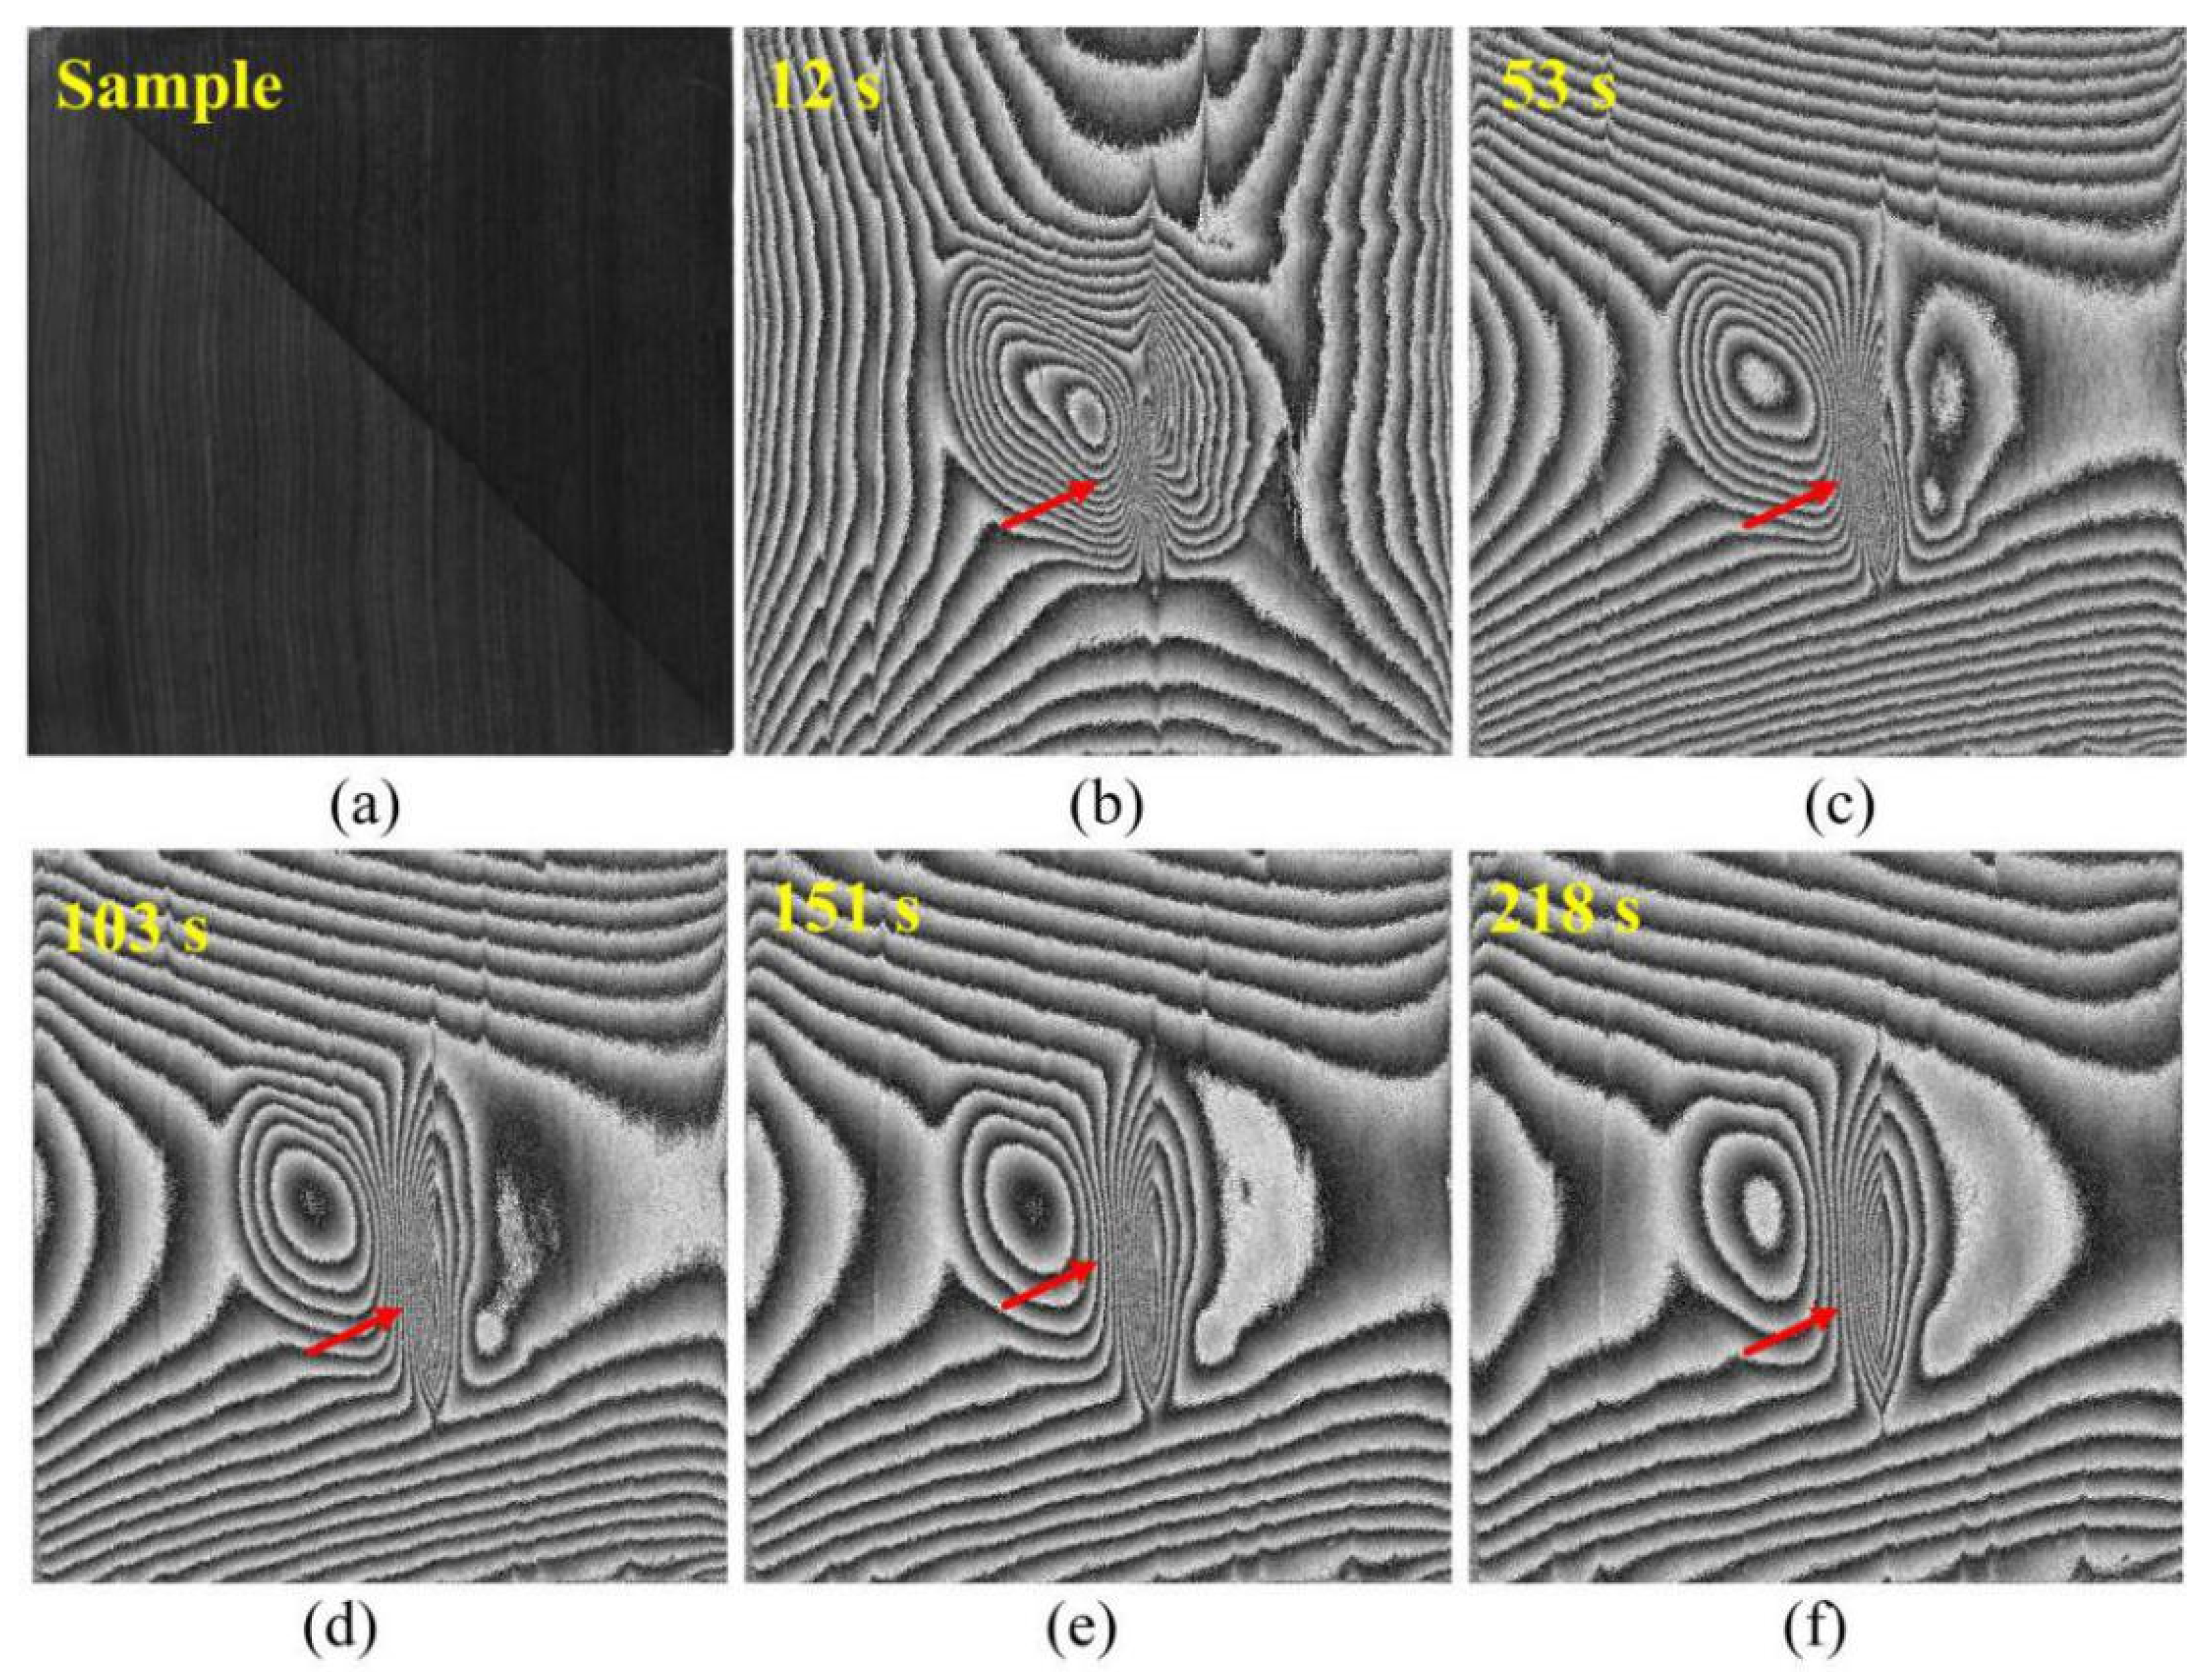
4.2.2. Denoising for Captured Data

Post-processing software of the portable DHSPI system can process the recorded results to improve the visualization for extracting useful information. The basic post-processing tools include denoising interferogram, phase unwrapping, displaying phase unwrapped image, and 3D surface deformation map, etc. [13]. The noisy data of Figure 8b–f are processed by the post-processing of the portable DHSPI system as shown in column (a) of Figure 9. Then, the proposed method is further used for denoising as shown in column (b) of Figure 9. From the visual inspection, the clean phase maps are obtained by the proposed method.
To clearly compare performance, in Figure 9 the enlarged phases in the red regions of column (a) and blue regions of column (b) are shown in columns (c) and (d), and the defect state can be observed more intuitively from the enhanced wrapped phase map using the proposed method. It can be seen that the proposed method can handle the high-frequency regions of the phase well, which shows it to be a useful post-processing method to estimate the depth of the defects in artworks. In the proposed method, the calculation time is 3.60 s for a captured wrapped phase map with size 1017 × 1030 pixels. Figure 10a,c shows the phase unwrapping results of the noisy data (Figure 8) and filtered data (Figure 9b) using DCT. The phase unwrapping effect is further illustrated by visualization of the contours in Figure 10b,d, and it further proves that the smooth phase can be obtained after denoising of the proposed method.

5. Conclusions

This paper presents a deep learning wrapped phase denoising method for application in digital holographic speckle pattern interferometry for the structural diagnosis of artworks. Based on simulation results, it is further verified that deep learning can be used to reduce speckle noise in the numerator (sine fringes) and denominator (cosine fringes) of the arctangent function, and an enhanced DHSPI wrapped phase using the arctangent function is provided from the denoising numerator and denominator. The captured data show that this method can effectively process the high-frequency regions of the wrapped phases compared with the DHSPI post-processing, thereby improving the accuracy of defect estimation in artworks. In future work, we will explore the defect prediction problem of artworks using the deep learning method. Meanwhile, we will consider applying deep learning to deformation detection of biological specimens in biomedicine [43,44,45,46]. Inhomogeneous surface properties significantly hinder reliable phase unwrapping and may produce a wrong quantitative evaluation for phase data. Deep learning may be a useful technique to solve these problems.

Author Contributions

K.Y.: Writing original draft, methodology, validation, visualization, and writing review and editing; L.C.: Supervision and visualization; M.A.: Data curation and software; V.T.: Writing review and editing, and data curation; Y.Y.: Writing review and editing, investigation, and supervision. All authors have read and agreed to the published version of the manuscript.

Funding

This project was supported by the National Natural Science Foundation of China (No. 51775326 and No. 61975112), the Research Fund of Natural Science Foundation of Shanghai (No. 18ZR1413700). The experimental data were produced from experiments that were carried out at the premises of the holographic metrology laboratory of the “Photonics For Heritage Science” group at the Institute of Electronic Structure and Laser of the Foundation for Research and Technology-Hellas (IESL-FORTH) and have been supported by the European project “Integrated Platform for the European Research Infrastructure on Cultural Heritage”, IPERION CH (Grant, Agreement: 654028) and the EU Ultraviolet Laser Facility (ULF) at FORTH-IESL, supported in part by the European Union’s Horizon 2020 research and innovation program LASERLAB-EUROPE (Grant Agreement No. 654148 and 871124).

Conflicts of Interest

The authors declare no conflict of interest.

References

  1. Fotakis, C.; Anglos, D.; Zafiropulos, V.; Georgiou, S.; Tornari, V. Lasers in the Preservation of Cultural Heritage: Principles and Applications; Taylor and Francis: New York, NY, USA, 2006. [Google Scholar]
  2. Tornari, V.; Zafiropulos, V.; Bonarou, A.; Vainos, N.A.; Fotakis, C. Modern technology in artwork conservation: A laser based approach for process control and evaluation. Opt. Lasers Eng. 2000, 34, 309–326. [Google Scholar] [CrossRef]
  3. Tornari, V. Laser Interference-Based techniques and applications in structural inspection of works of art. Anal. Bioanal. Chem. 2007, 387, 761–780. [Google Scholar] [CrossRef] [PubMed]
  4. Tornari, V.; Tsiranidou, E.; Bernikola, E. Interference fringe-patterns association to defect-types in artwork conservation: An experiment and research validation review. Appl. Phys. A 2012, 106, 397–410. [Google Scholar] [CrossRef]
  5. Groves, R.M.; Osten, W.; Doulgeridis, M.; Kouloumpi, E.; Green, T.; Hackney, S.; Tornari, V. Shearography as part of a multi-functional sensor for the detection of signature features in movable cultural heritage. In Proceedings of the O3A: Optics for Arts, Architecture, and Archaeology, Munich, Germany, 19 July 2007; Volume 6618, p. 661810. [Google Scholar] [CrossRef]
  6. Tornari, V.; Bonarou, A.; Castellini, P.; Esposito, E.; Osten, W.; Kalms, M.K.; Smyrnakis, N.; Stasinopulos, S. Laser-based systems for the structural diagnostic of artwork: An application to XVII-century byzantine icons. In Proceedings of the Laser Techniques and Systems in Art Conservation, Munich, Germany, 22 October 2001; Volume 4402, pp. 172–183. [Google Scholar] [CrossRef]
  7. Tornari, V.; Bonarou, A.; Zafiropulos, V.; Fotakis, C.; Doulgeridis, M. Holographic applications in evaluation of defect and cleaning procedures. J. Cult. Herit. 2000, 1, S325–S329. [Google Scholar] [CrossRef]
  8. Kosma, K.; Andrianakis, M.; Hatzigiannakis, K.; Tornari, V. Digital holographic interferometry for cultural heritage structural diagnostics: A coherent and a low-coherence optical set-up for the study of a marquetry sample. Strain 2018, 54, e12263. [Google Scholar] [CrossRef]
  9. Paoletti, D.; Spagnolo, G.S.; Facchini, M.; Zanetta, P. Artwork diagnostics with fiber-optic digital speckle pattern interferometry. Appl. Opt. 1993, 32, 6236–6241. [Google Scholar] [CrossRef]
  10. Boone, P.M.; Markov, V.B. Examination of Museum objects by means of video holography. Stud. Conserv. 1995, 40, 103–109. [Google Scholar] [CrossRef]
  11. Tornari, V.; Papadaki, K. Application of Holographic interferometric nondestructive testing on art works diagnostics. In From Marble to Chocolate: The Conservation of Modern Sculpture; Tate Gallery London: London, UK, 1995. [Google Scholar]
  12. Thizy, C.; Georges, M.; Doulgeridis, M.; Kouloumpi, E.; Green, T.; Hackney, S.; Tornari, V. Role of dynamic holography with photorefractive crystals in a multi-functional sensor for the detection of signature features in movable cultural heritage. O3A: Optics for Arts, Architecture, and Archaeology, Bellingham, WA, USA, 18–21 June 2007; Volume 6618, p. 661812. [Google Scholar] [CrossRef]
  13. Tornari, V. On development of portable digital holographic speckle pattern interferometry system for remote-access monitoring and documentation in art conservation. Strain 2018, 55, e12288. [Google Scholar] [CrossRef]
  14. Memmolo, P.; Arena, G.; Fatigati, G.; Grilli, M.; Paturzo, M.; Pezzati, L.; Ferraro, P. Automatic frames extraction and visualization from noisy fringe sequences for data recovering in a portable digital speckle pattern interferometer for NDI. J. Disp. Technol. 2015, 11, 417–422. [Google Scholar] [CrossRef]
  15. Tornari, V.; Bernikola, E.; Nevin, A.; Kouloumpi, E.; Doulgeridis, M.; Fotakis, C. Fully non contact holography-based inspection on dimensionally responsive artwork materials. Sensors 2008, 8, 8401–8422. [Google Scholar] [CrossRef] [Green Version]
  16. Bernikola, E.; Nevin, A.; Tornari, V. Rapid initial dimensional changes in wooden panel paintings due to simulated climate-induced alterations monitored by digital coherent out-of-plane interferometry. Appl. Phys. A 2009, 95, 387–399. [Google Scholar] [CrossRef]
  17. Zítek, P.; Vyhlídal, T.; Fišer, J.; Tornari, V.; Bernikola, E.; Tsigarida, N. Diffusion-model-Based risk assessment of moisture originated wood deterioration in historic buildings. Build. Environ. 2015, 94, 218–230. [Google Scholar] [CrossRef]
  18. Tornari, V.; Bernikola, E.; Tsigarida, N.; Andrianakis, M.; Hatzigiannakis, K.; Leissner, J. Preventive deformation measurements on cultural heritage materials based on non-contact surface response of model samples. Stud. Conserv. 2015, 60, S143–S158. [Google Scholar] [CrossRef] [Green Version]
  19. Tornari, V.; Basset, T.; Andrianakis, M.; Kosma, K. Impact of relative humidity on wood sample: A climate chamber experimental simulation monitored by digital holographic speckle pattern interferometry. J. Imaging 2019, 5, 65. [Google Scholar] [CrossRef] [Green Version]
  20. Osten, W.; Elandaloussi, F.; Mieth, U. The bias fringe processor—A useful tool for the automatic processing of fringe patterns in optical metrology. In Proceedings of the 3rd International Workshop in Optical Metrology-Series in Optical Metrology; Akademie Verlag: Bremen, Germany, 1998; pp. 98–107. [Google Scholar]
  21. Osten, W.; Jueptner, W.P.O.; Mieth, U. Knowledge-assisted evaluation of fringe patterns for automatic fault detection. In Proceedings of the SPIE 2004 Interferometry VI: Applications, San Diego, CA, USA, 1 March 1994; pp. 256–268. [Google Scholar] [CrossRef]
  22. Montresor, S.; Picart, P. Quantitative appraisal for noise reduction in digital holographic phase imaging. Opt. Express. 2016, 24, 14322–14343. [Google Scholar] [CrossRef] [PubMed]
  23. Bianco, V.; Memmolo, P.; Leo, M.; Montresor, S.; Distante, C.; Paturzo, M.; Picart, P.; Javidi, B.; Ferraro, P. Strategies for reducing speckle noise in digital holography. Light Sci. Appl. 2018, 7, 2047–7538. [Google Scholar] [CrossRef]
  24. Bianco, V.; Memmolo, P.; Paturzo, M.; Finizio, A.; Javidi, B.; Ferraro, P. Quasi noise-free digital holography. Light Sci. Appl. 2016, 5, e16142. [Google Scholar] [CrossRef]
  25. Aebischer, H.A.; Waldner, S. A simple and effective method for filtering speckle-interferometric phase fringe patterns. Opt. Commun. 1999, 162, 205–210. [Google Scholar] [CrossRef]
  26. Kemao, Q. Two-dimensional windowed Fourier transform for fringe pattern analysis: Principles, applications and implementations. Opt. Lasers Eng. 2007, 45, 304–317. [Google Scholar] [CrossRef]
  27. Villa, J.; Vera, R.; Quiroga, J.A.; De la Rosa, I.; GonzÃilez, E. Anisotropic phase-map denoising using a regularized cost-function with complex-valued Markov random fields. Opt. Lasers Eng. 2010, 48, 650–656. [Google Scholar] [CrossRef]
  28. Hao, F.; Tang, C.; Xu, M.; Lei, Z. Batch denoising of ESPI fringe patterns based on convolutional neural network. Appl. Opt. 2019, 58, 3338–3346. [Google Scholar] [CrossRef]
  29. Lin, B.; Fu, S.; Zhang, C.; Wang, F.; Li, Y. Optical fringe patterns filtering based on multi-stage convolution neural network. Opt. Lasers Eng. 2020, 126, 105853. [Google Scholar] [CrossRef] [Green Version]
  30. Yan, K.; Yu, Y.; Huang, C.; Sui, L.; Qian, K.; Asundi, A. Fringe pattern denoising based on deep learning. Opt. Commun. 2019, 437, 148–152. [Google Scholar] [CrossRef]
  31. Yan, K.; Yu, Y.; Sun, T.; Asundi, A.; Qian, K. Wrapped phase denoising using convolutional neural networks. Opt. Lasers Eng. 2020, 128, 105999. [Google Scholar] [CrossRef]
  32. Qian, K. Windowed Fringe Pattern Analysis; SPIE Press: Bellingham, WA, USA, 2013. [Google Scholar]
  33. Federico, A.; Kaufmann, G.H. Comparative study of wavelet thresholding methods for denoising electronic speckle pattern interferometry fringes. Opt. Eng. 2001, 40, 2598–2604. [Google Scholar] [CrossRef]
  34. Bhaduri, B.; Kothiyal, M.P.; Mohan, N.K. A comparative study of phase-shifting algorithms in digital speckle pattern interferometry. Optik 2008, 119, 147–152. [Google Scholar] [CrossRef]
  35. Zhang, K.; Zuo, W.; Chen, Y.; Meng, D.; Zhang, L. Beyond a Gaussian denoiser: Residual learning of deep CNN for image denoising. IEEE Trans. Image Process. 2017, 26, 3142–3155. [Google Scholar] [CrossRef] [Green Version]
  36. Nair, V.; Hinton, G. Rectified linear units improve restricted boltzmann machines. In Proceedings of the 27th International Conference on Machine Learning, Haifa, Israel, 21–24 June 2010; pp. 807–814. [Google Scholar]
  37. Ioffe, S.; Szegedy, C. Batch normalization: Accelerating deep network training by reducing internal covariate shift. In Proceedings of the 32nd International Conference on Machine Learning, Lille, France, 6-11 July 2015; pp. 448–456. [Google Scholar]
  38. Ren, Z.; Xu, Z.; Edmund, Y.L. End-to-end deep learning framework for digital holographic reconstruction. Adv. Photonics 2019, 1, 016004. [Google Scholar] [CrossRef]
  39. Kingma, D.; Ba, J. Adam: A method for stochastic optimization. In Proceedings of the 3rd International Conference on Learning Representations, San Diego, CA, USA, 7–9 May 2015. [Google Scholar]
  40. Dennis, C.G.; Louis, A.R. Robust two-dimensional weighted and unweighted phase unwrapping that uses fast transforms and iterative methods. J. Opt. Soc. Am. A 1994, 11, 107–117. [Google Scholar] [CrossRef]
  41. Tornari, V.; Bernikola, E.; Tsiranidou, E.; Hatzigiannakis, K.; Andrianakis, M.; Detalle, V.; Bodnar, J.L. Micro-mapping of defect structural micro-morphology in the documentation of fresco wall paintings. Int. J. Herit. Digit. Era 2013, 2, 1–22. [Google Scholar] [CrossRef]
  42. Tornari, V.; Andrianakis, M.; Chaban, A.; Kosma, K. Heat transfer effects on defect boundaries captured by digital holographic interferometry and infrared thermography workstation: An overview on experimental results. Exp. Tech. 2020, 44, 59–74. [Google Scholar] [CrossRef]
  43. Schedin, S.; Pedrini, G.; Tiziani, H.J. Pulsed digital holography for deformation measurements on biological tissues. Appl. Opt. 2000, 39, 2853–2857. [Google Scholar] [CrossRef]
  44. Avenhaus, W.; Kemper, B.; Knoche, S.; Domagk, D.; Poremba, C.; Bally, G.V.; Domschke, W. Dynamic holographic endoscopy-ex vivo investigations of malignant tumors in the human stomach. Lasers Med. Sci. 2005, 19, 223–228. [Google Scholar] [CrossRef]
  45. Dirksen, D.; Droste, H.; Kemper, B.; Deleré, H.; Deiwick, M.; Scheld, H.H.; Bally, G.V. Lensless Fourier holography for digital holographic interferometry on biological samples. Opt. Laser Eng. 2001, 36, 241–249. [Google Scholar] [CrossRef]
  46. Schedin, S.; Pedrini, G.; Tiziani, H.J.; Aggarwal, A.K. Comparative study of various endoscopes for pulsed digital holographic interferometry. Appl. Opt. 2001, 40, 2692–2697. [Google Scholar] [CrossRef]
Figure 1. The schematic of the digital holographic speckle pattern interferometry (DHSPI) system redrawn from [13]: BS, beam splitter; OBS, object beam shutter; RBS, reference beam shutter; VA, variable attenuator; CVX, convex; L, lenses; M, mirrors; SL, surface lens; OW, optical window; PZT, piezoelectric transducer.
Applsci 10 04044 g001
Figure 2. Simulated fringe pattern with the different aperture sizes.
Applsci 10 04044 g002
Figure 3. Estimated wrapped phases with the different aperture sizes.
Applsci 10 04044 g003
Figure 4. The architecture of the proposed network.
Applsci 10 04044 g004
Figure 5. Simulated data (the speckle radius of 1 pixel): (a) Simulated noisy wrapped phase; (b) denoising result of (a) by the proposed method; (c) unwrapped phase of (b); (d) error distribution map of (c).
Applsci 10 04044 g005
Figure 6. Simulated data (the speckle radius of 2 pixels): (a) Simulated noisy wrapped phase; (b) denoising result of (a) by the proposed method; (c) unwrapped phase of (b); (d) error distribution of (c).
Applsci 10 04044 g006
Figure 7. Schematic diagram of the measuring device.
Applsci 10 04044 g007
Figure 8. Captured data: (a) Measured sample; (bf) estimated phase maps at 12 s, 53 s, 103 s, 151 s, and 218 s, respectively.
Applsci 10 04044 g008
Figure 9. Experiment results: (a) Denoising result by DHSPI system; (b) denoising result by the proposed method; (c) enlarged region of (a); (d) enlarged region of (b).
Applsci 10 04044 g009
Figure 10. Phase unwrapping results using discrete cosine transform (DCT): (a) Unwrapping results of Figure 8b–f; (b) contour of (a); (c) unwrapping results of Figure 9b; (d) contour of (c).
Applsci 10 04044 g010
Table 1. Performance of the proposed method.
FigureNoisy Data (MSE)Denoising Data (MSE)
Figure 5a3.98810.5823
Figure 6a4.36080.8654

