Concurrent Validity and Reliability of My Jump 2 App for Measuring Vertical Jump Height in Recreationally Active Adults


Abstract
:Featured Application
Abstract
1. Introduction
2. Materials and Methods
2.1. Participants
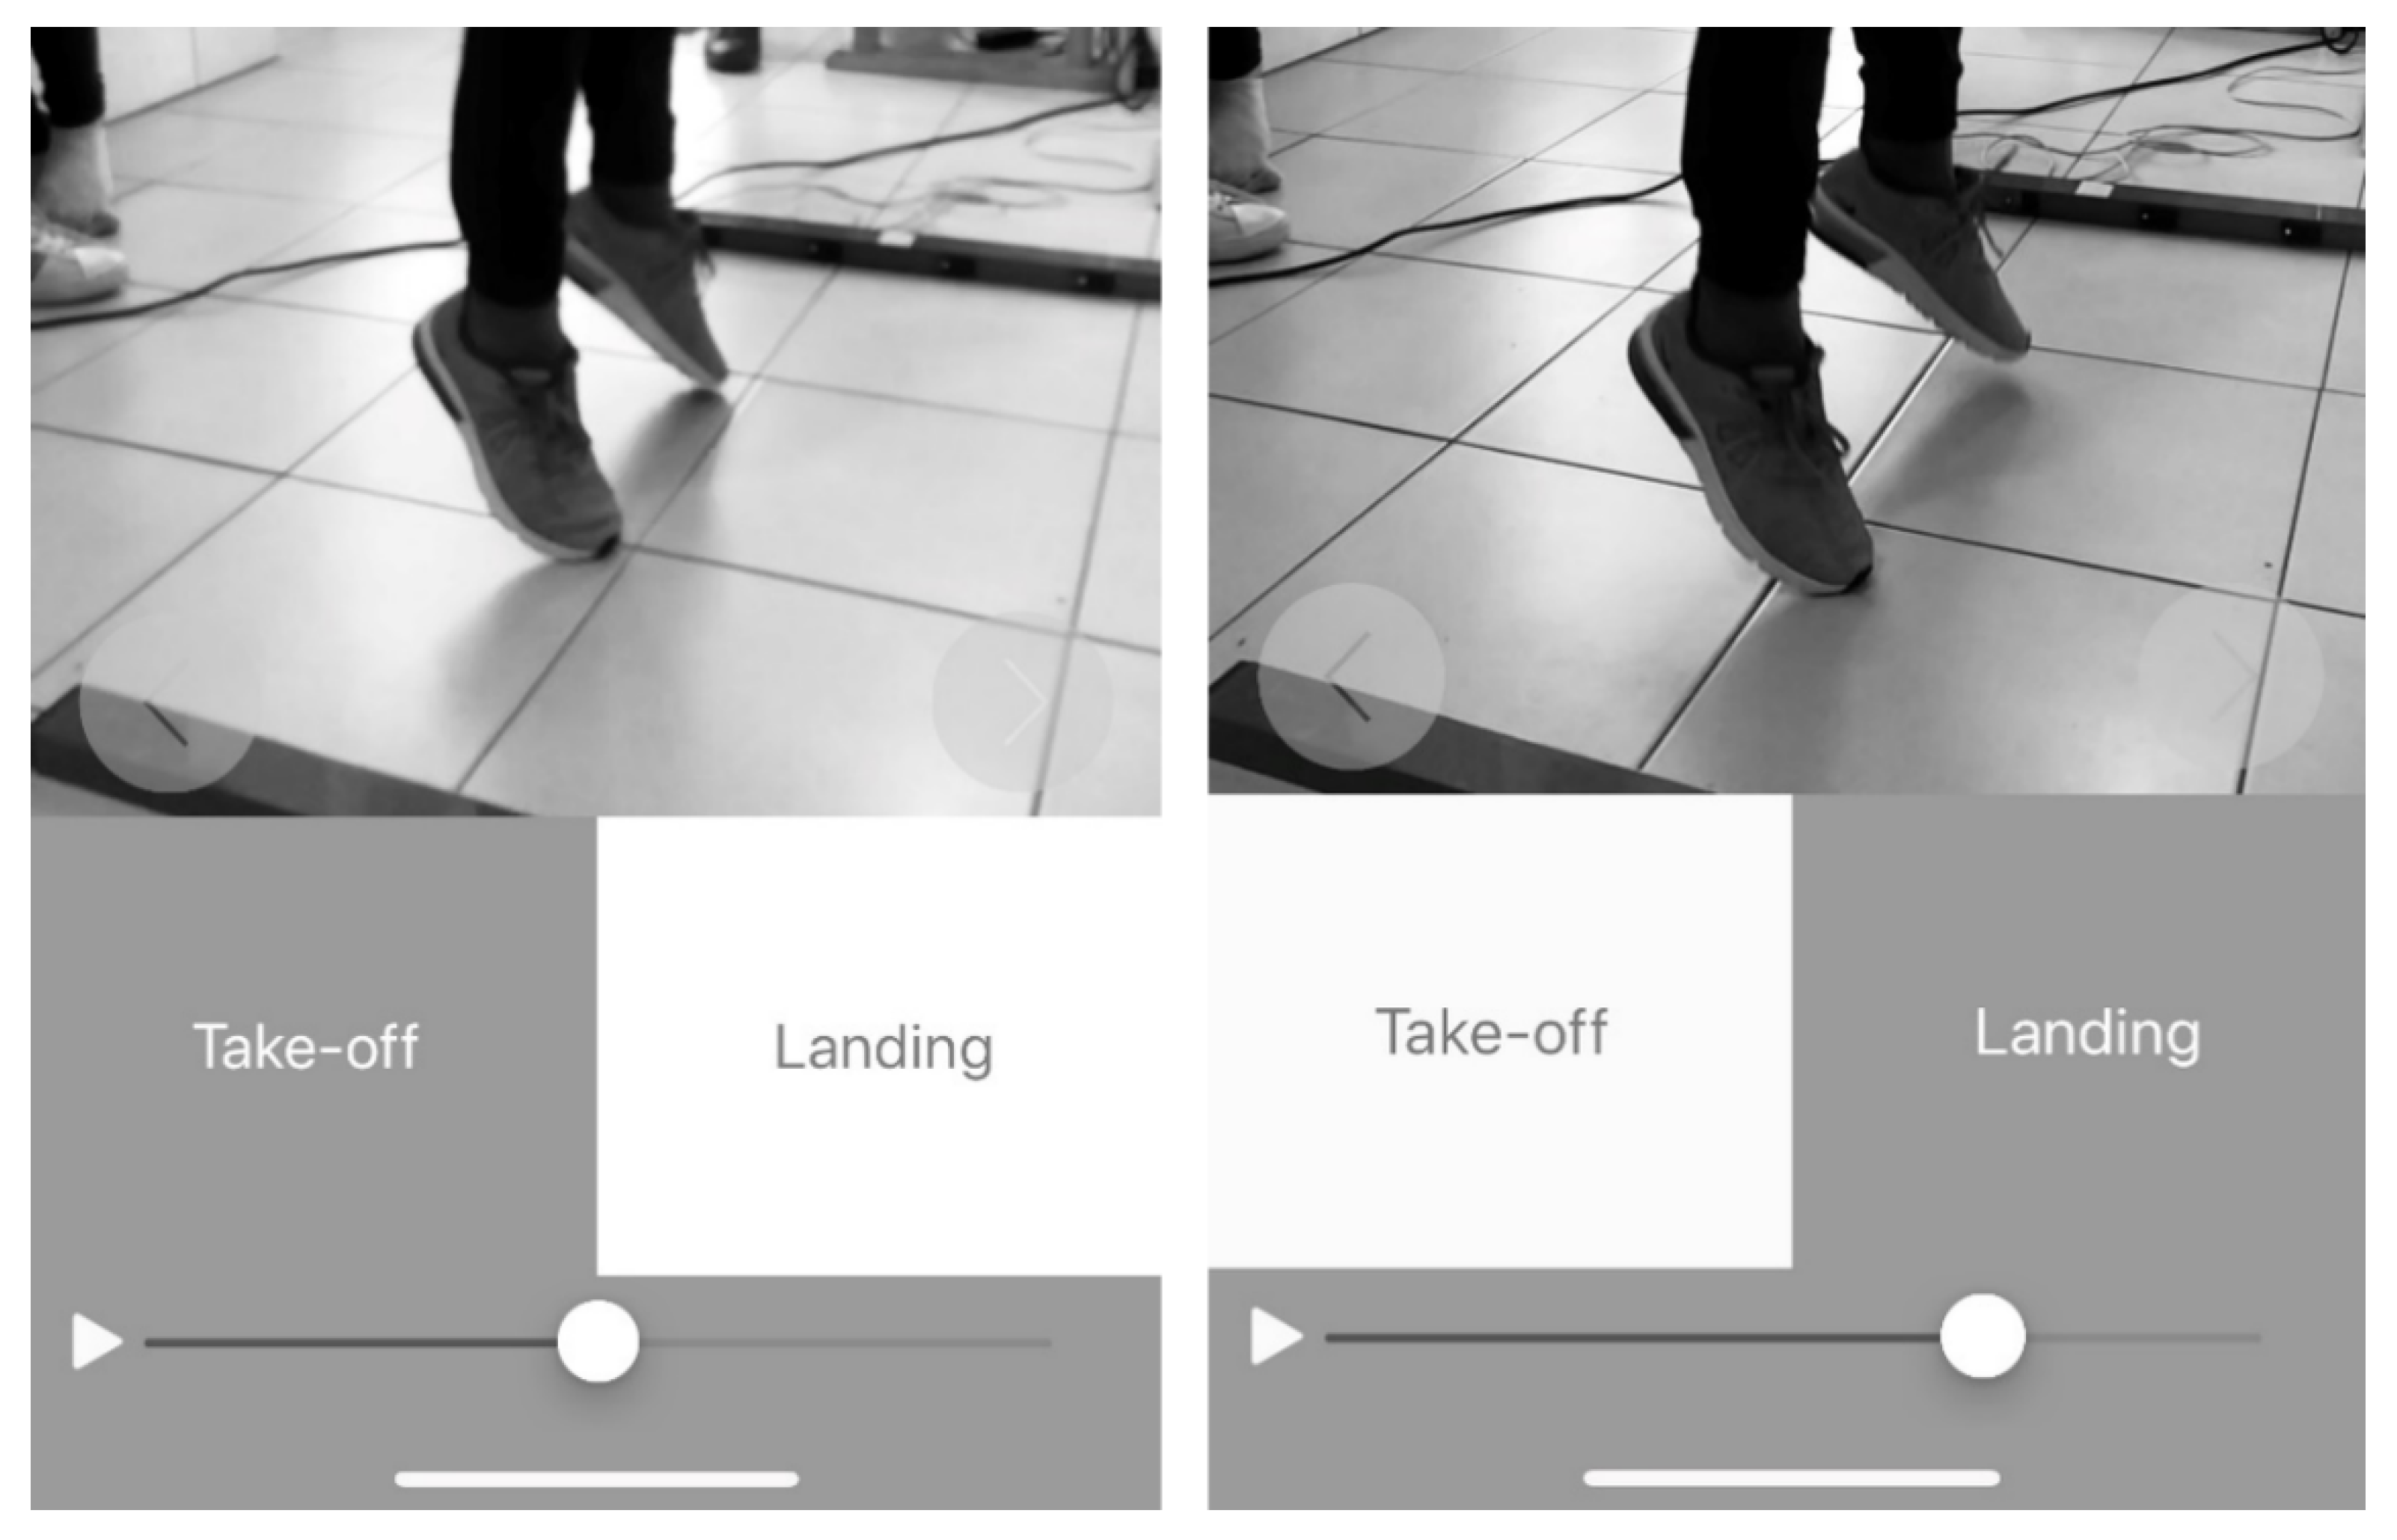
2.2. Procedures
2.3. Statistical Analysis
3. Results
3.1. Reliability
3.2. Test Usefulness
3.3. The Validity of the Test
4. Discussion
5. Conclusions
Author Contributions
Funding
Conflicts of Interest
References
- WHO. Global Recommendations on Physical Activity for Health; WHO: Geneva, Switzerland, 2015. [Google Scholar]
- Watkins, C.M.; Barillas, S.R.; Wong, M.A.; Archer, D.C.; Dobbs, I.J.; Lockie, R.G.; Coburn, J.W.; Tran, T.T.; Brown, L.E. Determination of Vertical Jump as a Measure of Neuromuscular Readiness and Fatigue. J. Strength Cond. Res. 2017, 31, 3305–3310. [Google Scholar] [CrossRef] [PubMed]
- Spiteri, T.; Binetti, M.; Scanlan, A.T.; Dalbo, V.J.; Dolci, F.; Specos, C. Physical Determinants of Division 1 Collegiate Basketball, Women’s National Basketball League, and Women’s National Basketball Association Athletes: With Reference to Lower-Body Sidedness. J. Strength Cond. Res. 2019, 33, 159–166. [Google Scholar] [CrossRef] [PubMed]
- Yingling, V.R.; Castro, D.A.; Duong, J.T.; Malpartida, F.J.; Usher, J.R.; Jenny, O. The reliability of vertical jump tests between the Vertec and My Jump phone application. PeerJ 2018, 2018, e4669. [Google Scholar] [CrossRef] [PubMed] [Green Version]
- Aragón, L.F. Evaluation of Four Vertical Jump Tests: Methodology, Reliability, Validity, and Accuracy. Meas. Phys. Educ. Exerc. Sci. 2000, 4, 215–228. [Google Scholar] [CrossRef]
- Gathercole, R.J.; Stellingwerff, T.; Sporer, B.C. Effect of acute fatigue and training adaptation on countermovement jump performance in elite snowboard cross athletes. J. Strength Cond. Res. 2015, 29, 37–46. [Google Scholar] [CrossRef] [PubMed]
- Castagna, C.; Ganzetti, M.; Ditroilo, M.; Giovannelli, M.; Rocchetti, A.; Manzi, V. Concurrent validity of vertical jump performance assessment systems. J. Strength Cond. Res. 2013, 27, 761–768. [Google Scholar] [CrossRef]
- Haynes, T.; Bishop, C.; Antrobus, M.; Brazier, J. The validity and reliability of the My Jump 2 app for measuring the reactive strength index and drop jump performance. J. Sports Med. Phys. Fit. 2019, 59, 253–258. [Google Scholar] [CrossRef] [Green Version]
- Whitmer, T.D.; Fry, A.C.; Forsythe, C.M.; Andre, M.J.; Lane, M.T.; Hudy, A.; Honnold, D.E. Accuracy of a vertical jump contact mat for determining jump height and flight time. J. Strength Cond. Res. 2015, 29, 877–881. [Google Scholar] [CrossRef]
- Pueo, B.; Lipinska, P.; Jiménez-Olmedo, J.M.; Zmijewski, P.; Hopkins, W.G. Accuracy of jump-mat systems for measuring jump height. Int. J. Sports Physiol. Perform. 2017, 12, 959–963. [Google Scholar] [CrossRef] [Green Version]
- Carlos-Vivas, J.; Martin-Martinez, J.P.; Hernandez-Mocholi, M.A.; Perez-Gomez, J. Validation of the iPhone app using the force platform to estimate vertical jump height. J. Sports Med. Phys. Fit. 2018, 58, 227–232. [Google Scholar]
- Bosquet, L.; Berryman, N.; Dupuy, O. A comparison of 2 optical timing systems designed to measure flight time and contact time during jumping and hopping. J. Strength Cond. Res. 2009, 23, 2660–2665. [Google Scholar] [CrossRef] [PubMed]
- Cruvinel-Cabral, R.M.; Oliveira-Silva, I.; Medeiros, A.R.; Claudino, J.G.; Jiménez-Reyes, P.; Boullosa, D.A. The validity and reliability of the “my Jump App” for measuring jump height of the elderly. PeerJ 2018, 2018. [Google Scholar] [CrossRef] [PubMed] [Green Version]
- Coswig, V.; Silva, A.D.A.C.E.; Barbalho, M.; de Faria, F.R.; Nogueira, C.D.; Borges, M.; Buratti, J.R.; Vieira, I.B.; Román, F.J.L.; Gorla, J.I. Assessing the validity of the MyJUMP2 app for measuring different jumps in professional cerebral palsy football players: An experimental study. JMIR mHealth uHealth 2019, 7, e11099. [Google Scholar] [CrossRef] [PubMed]
- Balsalobre-Fernández, C.; Glaister, M.; Lockey, R.A. The validity and reliability of an iPhone app for measuring vertical jump performance. J. Sports Sci. 2015, 33, 1574–1579. [Google Scholar] [CrossRef] [PubMed]
- Hopkins, W.G.; Schabort, E.J.; Hawley, J.A. Reliability of power in physical performance tests. Sport. Med. 2001, 31, 211–234. [Google Scholar] [CrossRef]
- Brooks, E.R.; Benson, A.C.; Bruce, L.M. Novel Technologies Found to be Valid and Reliable for the Measurement of Vertical Jump Height With Jump-and-Reach Testing. J. Strength Cond. Res. 2018, 32, 2838–2845. [Google Scholar] [CrossRef]
- Glatthorn, J.F.; Gouge, S.; Nussbaumer, S.; Stauffacher, S.; Impellizzeri, F.M.; Maffiuletti, N.A. Validity and reliability of optojump photoelectric cells for estimating vertical jump height. J. Strength Cond. Res. 2011, 25, 556–560. [Google Scholar] [CrossRef]
- Samozino, P.; Morin, J.B.; Hintzy, F.; Belli, A. A simple method for measuring force, velocity and power output during squat jump. J. Biomech. 2008, 41, 2940–2945. [Google Scholar] [CrossRef]
- Holsgaard Larsen, A.; Caserotti, P.; Puggaard, L.; Aagaard, P. Reproducibility and relationship of single-joint strength vs multi-joint strength and power in aging individuals. Scand. J. Med. Sci. Sport. 2007, 17, 43–53. [Google Scholar] [CrossRef]
- Bosco, C.; Luhtanen, P.; Komi, P.V. A simple method for measurement of mechanical power in jumping. Eur. J. Appl. Physiol. Occup. Physiol. 1983, 50, 273–282. [Google Scholar] [CrossRef]
- Stanton, R.; Wintour, S.A.; Kean, C.O. Validity and intra-rater reliability of MyJump app on iPhone 6s in jump performance. J. Sci. Med. Sport 2017, 20, 518–523. [Google Scholar] [CrossRef] [PubMed]
- Hopkins, W. Reliability from consecutive pairs of trials (Excel spreadsheet). A new view of statistics. sportsci.org: Internet Society for Sport Science.—Open Access Library. Internet Soc. Sport Sci. 2007, 11, 23–36. [Google Scholar]
- Koo, T.K.; Li, M.Y. A Guideline of Selecting and Reporting Intraclass Correlation Coefficients for Reliability Research. J. Chiropr. Med. 2016, 15, 155–163. [Google Scholar] [CrossRef] [PubMed] [Green Version]
- Buchheit, M.; Lefebvre, B.; Laursen, P.B.; Ahmaidi, S. Reliability, usefulness, and validity of the 30–15 Intermittent Ice Test in young elite ice hockey players. J. Strength Cond. Res. 2011, 25, 1457–1464. [Google Scholar] [CrossRef] [PubMed]
- Hopkins, W. How to Interpret Changes in an Athletic Performance Test. Sportscience 2004, 8, 1–7. [Google Scholar]
- Bland, M.J.; Altman, D. Statistical Methods for Assessing Agreement Between Two Methods of Clinical Measurement. Lancet 1986, 327, 307–310. [Google Scholar] [CrossRef]
- Gallardo-Fuentes, F.; Gallardo-Fuentes, J.; Ramírez-Campillo, R.; Balsalobre-Fernández, C.; Martínez, C.; Caniuqueo, A.; Cañas, R.; Banzer, W.; Loturco, I.; Nakamura, F.Y.; et al. Intersession and intrasession reliability and validity of the my jump app for measuring different jump actions in trained male and female athletes. J. Strength Cond. Res. 2016, 30, 2049–2056. [Google Scholar] [CrossRef]
- Driller, M.; Tavares, F.; McMaster, D.; O’Donnell, S. Assessing a smartphone application to measure counter-movement jumps in recreational athletes. Int. J. Sports Sci. Coach. 2017, 12, 661–664. [Google Scholar] [CrossRef]
- Choukou, M.A.; Laffaye, G.; Taiar, R. Reliability and validity of an accele-rometric system for assessing vertical jumping performance. Biol. Sport 2014, 31, 55–62. [Google Scholar] [CrossRef]
- Buckthorpe, M.; Morris, J.; Folland, J.P. Validity of vertical jump measurement devices. J. Sports Sci. 2012, 30, 63–69. [Google Scholar] [CrossRef]
- Wade, L.; Lichtwark, G.A.; Farris, D.J. Comparisons of laboratory-based methods to calculate jump height and improvements to the field-based flight-time method. Scand. J. Med. Sci. Sport. 2020, 30, 31–37. [Google Scholar] [CrossRef] [PubMed]
- Struzik, A.; Zawadzki, J. Estimation of potential elastic energy during the countermovement phase of a vertical jump based on the force-displacement curve. Acta Bioeng. Biomech. 2019, 21, 153–160. [Google Scholar]
- Moir, G.L. Three Different Methods of Calculating Vertical Jump Height from Force Platform Data in Men and Women. Meas. Phys. Educ. Exerc. Sci. 2008, 12, 207–218. [Google Scholar] [CrossRef]
- Lees, A.; Barton, G. The interpretation of relative momentum data to assess the contribution of the free limbs to the generation of vertical velocity in sports activities. J. Sports Sci. 1996, 14, 503–511. [Google Scholar] [CrossRef] [PubMed]
- Hara, M.; Shibayama, A.; Arakawa, H.; Fukashiro, S. Effect of arm swing direction on forward and backward jump performance. J. Biomech. 2008, 41, 2806–2815. [Google Scholar] [CrossRef] [PubMed]
- Attia, A.; Dhahbi, W.; Chaouachi, A.; Padulo, J.; Wong, D.P.; Chamari, K. Measurement errors when estimating the vertical jump height with flight time using photocell devices: The example of Optojump. Biol. Sport 2017, 34, 63–70. [Google Scholar] [CrossRef]
- Bučar, M.; Čuk, I.; Pajek, J.; Karacsony, I.; Leskošek, B. Reliability and validity of judging in women’s artistic gymnastics at University Games 2009. Eur. J. Sport Sci. 2012, 12, 207–215. [Google Scholar] [CrossRef]
- Bort-Roig, J.; Gilson, N.D.; Puig-Ribera, A.; Contreras, R.S.; Trost, S.G. Measuring and influencing physical activity with smartphone technology: A systematic review. Sport. Med. 2014, 44, 671–686. [Google Scholar] [CrossRef]


| Male (n = 26) | Female (n = 18) | |
|---|---|---|
| Age (years) | 30.1 ± 10.6 | 28.9 ± 5.6 |
| Height (cm) | 178.2 ± 16.2 | 169.6 ± 6.2 |
| Weight (kg) | 85.9 ± 23.8 | 60.5 ± 8.7 |
| Leg length (cm) | 108.1 ± 4.7 | 106.1 ± 4.5 |
| Years of training | 10.5 ± 7.6 | 9.8 ± 6.6 |
| Training hours per week | 6.2 ± 2.1 | 3.9 ± 1.1 |
| SJ | CMJ | CMJAS | |
|---|---|---|---|
| Test (cm) | 29.6 ± 6.0 | 31.9 ± 6.6 | 39.4 ± 9.7 |
| Retest (cm) | 30.8 ± 6.6 | 34.2 ± 6.9 | 39.7 ± 10.0 |
| ES | 0.19 (trivial) | 0.34 (small) | 0.03 (trivial) |
| Diff (95% CI) | 1.2 (0.4; 2.1) | 2.3 (1.6; 2.9) | 0.3 (−0.5;1.1) |
| ICC (95% CI) | 0.93 (0.86;0.96) | 0.96 (0.93; 0.97) | 0.97 (0.95; 0.99) |
| TE (95% CI) | 1.8 (1.5;2.3) | 1.3 (1.1;1.7) | 2.0 (1.6;2.6) |
| CV% (95% CI) | 5.8 (4.7; 7.6) | 4.1 (3.4; 5.5) | 5.0 (4.0; 6.6) |
| SWC% | 1.2 (4.3%) | 1.3 (4.0%) | 2.0 (5.3%) |
| Rating | marginal | OK | OK |
| SJ | CMJ | CMJAS | |
|---|---|---|---|
| Test (cm) | 23.9 ± 6.0 | 26.8 ± 6.3 | 29.3 ± 6.0 |
| Retest (cm) | 25.8 ± 6.8 | 27.3 ± 6.2 | 30.2 ± 6.4 |
| ES | 0.30 (small) | 0.08 (trivial) | 0.15 (trivial) |
| Diff (95% CI) | 1.90 (1; 2.8) | 0.5 (−0.1; 1.1) | 0.9 (0.2; 1.6) |
| ICC (95% CI) | 0.94 (0.86; 0.97) | 0.97 (0.93; 0.98) | 0.97 (0.92; 0.98) |
| TE (95% CI) | 1.6 (1.3; 2.3) | 1.1 (0,8; 1.5) | 1.2 (0.9; 1.6) |
| CV% (95% CI) | 7.2 (5.6; 10.3) | 4.3 (3.4; 6.1) | 4.3 (3.3; 6.0) |
| SWC% | 1.3 (5.1%) | 1.2 (4.5%) | 1.2 (4.2%) |
| Rating | marginal | good | OK |
| My Jump 2 | Optojump | Diff. (95% CI) | ES | r (95% CI) | Rating | |
|---|---|---|---|---|---|---|
| SJ | 29.6 ± 6.0 | 30.0 ± 6.3 | 0.40 (−3.26; 2.46) | −0.07 | 0.95 (0.91; 0.97) | Very large |
| CMJ | 31.9 ± 6.6 | 32.5 ± 7.1 | 0.60 (−3.79; 2.59) | −0.09 | 0.98 (0.95;0.99) | Very large |
| CMJAS | 39.4 ± 9.7 | 39.7 ± 9.5 | 0.30 (−4.76; 4.16) | −0.03 | 0.98 (0.97;0.99) | Very large |
| My Jump 2 | Optojump | Diff. (95% CI) | ES | r (95% CI) | Rating | |
|---|---|---|---|---|---|---|
| SJ | 23.9 ± 6.0 | 24.5 ± 7.5 | 0.6 (−3.79; 2.59) | −0.09 | 0.97 (0.93; 0.99) | Very large |
| CMJ | 26.8 ± 6.3 | 27.7 ± 7.8 | 0.9 (−4.90; 3.10) | −0.13 | 0.96 (0.91;0.98) | Very large |
| CMJAS | 29.3 ± 6.0 | 30.7 ± 8.4 | 1.4 (−5.51; 2.71) | −0.19 | 0.94 (0.87;0.98) | Very large |
© 2020 by the authors. Licensee MDPI, Basel, Switzerland. This article is an open access article distributed under the terms and conditions of the Creative Commons Attribution (CC BY) license (http://creativecommons.org/licenses/by/4.0/).
Share and Cite
Bogataj, Š.; Pajek, M.; Andrašić, S.; Trajković, N. Concurrent Validity and Reliability of My Jump 2 App for Measuring Vertical Jump Height in Recreationally Active Adults. Appl. Sci. 2020, 10, 3805. https://doi.org/10.3390/app10113805
Bogataj Š, Pajek M, Andrašić S, Trajković N. Concurrent Validity and Reliability of My Jump 2 App for Measuring Vertical Jump Height in Recreationally Active Adults. Applied Sciences. 2020; 10(11):3805. https://doi.org/10.3390/app10113805
Chicago/Turabian StyleBogataj, Špela, Maja Pajek, Slobodan Andrašić, and Nebojša Trajković. 2020. "Concurrent Validity and Reliability of My Jump 2 App for Measuring Vertical Jump Height in Recreationally Active Adults" Applied Sciences 10, no. 11: 3805. https://doi.org/10.3390/app10113805