Article

Properties of the Surface Layer After Trochoidal Milling and Brushing: Experimental Study and Artificial Neural Network Simulation

1
Department of Enterprise Organisation, Management Faculty, Lublin University of Technology, 20-618 Lublin, Poland
2
Department of Production Engineering, Mechanical Engineering Faculty, Lublin University of Technology, 20-618 Lublin, Poland
*
Author to whom correspondence should be addressed.
Appl. Sci. 2020, 10(1), 75; https://doi.org/10.3390/app10010075
Submission received: 22 November 2019 / Revised: 18 December 2019 / Accepted: 18 December 2019 / Published: 20 December 2019

Abstract

:
The aim of this study was to investigate the effect of milling and brushing cutting data settings on the surface geometry and energy parameters of two Mg alloy substrates: AZ91D and AZ31. In milling, the cutting speed and the trochoidal step were modified (vc = 400–1200 m/min and str = 5–30%) to investigate how they affect selected 2D (Rz, Rku, Rsk, RSm, Ra) and 3D (Sa, Sz, Sku, Ssk) roughness parameters. The brushing treatment was carried out at constant parameters: n = 5000 rev/min, vf = 300 mm/min, ap = 0.5 mm. The surface roughness of specimens was assessed with the Ra, Rz, and RSm parameters. The effects of the two treatments on the workpiece surface were analyzed comparatively. It was found that the roughness properties of the machined surface may be improved by the application of a carbide milling cutter and ceramic brush. The use of different machining data was also shown to impact the surface free energy and its polar component of Mg alloy specimens. Complementary to the results from the experimental part of the study, the investigated machining processes were modelled by means of statistical artificial neural networks (the radial basis function and multi-layered perceptron). The artificial neural networks (ANNs) were shown to perform well as a tool for the prediction of Mg alloy surface roughness parameters and the maximum height of the profile (Rz) after milling and brushing.

Graphical Abstract

1. Introduction: State of the Art

Magnesium alloys are typically shaped in milling—the process that can produce a high-quality surface finish and is thus an ideal solution for both roughing and finishing operations. The analyzed metal exhibits very good specific strength, which is why it is widely used in the aerospace industry. Machining of low-rigidity components is problematic for several reasons; however, it is the occurrence of chatter that typically constitutes the biggest challenge. Vibrations tend to decrease the quality of the finish and the dimensional and shape accuracy of the workpiece. In order to counter the negative effects of machining, workpieces are subjected to finishing operations with the use of appropriate tools, strategies, and carefully adjusted machining parameters. One of the typical finishing operations is deburring, which can be performed with the use of dedicated ceramic brushes. These tools are applicable in fully automated machining centers and are known to generate minor force values during machining [1,2].
Surface roughness parameters and the energy state of the surface layer are particularly relevant in the case when the components are subsequently processed with the application of adhesion technologies [3].
In addition to fostering adhesion, maintaining surface roughness is hugely important considering the increasingly strict tolerance limits demanded of machined products, particularly with respect to mating surfaces. The surface structure of components performing in cooperation is decisive of their utilitarian properties; therefore, knowledge on how to shape surface roughness parameters by modifying technological factors is essential. A precise determination of the impact of milling conditions on the workpiece surface requires extending the standard range of typically considered 2D surface roughness and 3D area roughness parameters (i.e., Ra or Rz and Sa or Sz). An in-depth analysis of 2D and 3D roughness parameters will contribute to enhancing the quality of the finish, the effectiveness of the process, and ultimately, the work of mating components [4,5,6].
The experimental models provide the data for modern AI-based techniques employed for simulating different machining processes. Artificial neural networks (ANNs) are capable of predicting dimensional errors, machining performance, chatter, as well as surface roughness. While the simulations may not directly produce a ready-to-use set of machining parameters, they do, however, effectively approximate the desired range of cutting data and, therefore, support the work of technologists responsible for determining optimal machining conditions.

1.1. Surface Roughness in Milling

Surface quality along with the dimensional and shape accuracy are often investigated by researchers studying machining. One of the essential products of machining (e.g., milling or brushing treatment) is the modification of the surface roughness [7]. Commonly, milling, drilling, or boring are not followed by any further machining. The technologist should thus ensure that the processes are both efficient and effective and that the surface roughness properties of the workpiece meet the functional requirements, be it for the tested Mg alloys or any other substrate.
Gziut et al. investigated the changes in the surface roughness of Mg alloy AZ91HP workpieces after milling in response to the modification of the cutting parameters (vc, fz, ap) and the geometry of the carbide cutting tool edge (γ = 5° and γ = 30°) [8]. The results from the measurements on the lateral face showed that surface roughness parameters decrease at increasing vc, but rise with the increase in fz. It was also shown that lower roughness parameter values were obtained when employing a cutter inclined at a 5° angle. The same material was used in the study of different machining processes reported by Kłonica et al. [9]. Milling was shown to produce the highest quality surface: Ra = 0.124 μm and Rz = 0.952 μm; while the 180 non-woven tool the worst, Ra = 0.81 μm and Rz = 3.82 μm.
The surface roughness of AZ91D alloy was analyzed by Shi et al. [10]. In the study, the carbide cutter, micro-cooled with compressed air, was employed at a conventional range of speeds, maximum vc = 400 m/min. The tests concluded that Ra increases in response to rising vc and fz. The lowest Ra = 0.5 μm was produced at a lower cutting speed, vc = 50 m/min, and feed per tooth, fz = 0.2 mm/tooth. The roughness increased at higher cutting speeds.
AZ91D alloy was also investigated by Ruslan et al. [11], who obtained an exceptionally low surface roughness—Ra = 0.061–0.133 μm—by machining at a small feed per tooth of fz = 0.03–0.09 mm/tooth and an axial depth of cut equal to ap = 0.2–0.3 mm. The lowest Ra of the workpiece surface was achieved at the highest cutting speed of vc = 900 m/min, effectively proving that milling may constitute the finishing operation (grinding or polishing are redundant) given that it is executed at high cutting speeds.
Muralidharan et al. [12] applied solid carbide end mills with and without TiN and TiAlN coating to machining SiC and B4C-reinforced magnesium. The tests were executed in the range of spindle speeds from 1500 to 2500 rev/min (vc = 19–31 m/min) and the feed rate was in the range 1200–2000 mm/min. The results showed that the built-up cutting edge and feed per tooth change to the greatest extent the workpiece’s surface roughness. The best quality of finish was provided by a TiN-coated tool, with an Ra equal to 0.35 μm. The authors of a related study [13] aimed to determine the optimal combination of cutting parameters with respect to the surface roughness in the dry milling of AM60 magnesium alloy with a TiN-coated carbide cutter. Several important correlations emerged from the tests: Increasing the feed per tooth and the axial depth of cut increased the surface roughness, and secondly, at a higher spindle speed, the surface roughness was reduced. The study concluded that the most effective machining data configuration was a spindle speed of 2000 rev/min, feed per tooth of 0.1 mm/rev, and axial depth of cut of 1.0 mm, as it produces the most advantageous surface roughness: Ra approximately 0.3 μm.
Recently, researchers have been highlighting the fact that description of the surface that is limited to the analysis of Ra is insufficient, as it fails to provide information on numerous relevant characteristics of the roughness profile; therefore, additional 2D roughness parameters must be included when describing the condition of the surface. According to Grzesik [4], the amplitude parameters, Rt and Rz, provide a better indication of the fatigue strength than Ra. These parameters were also analyzed by Wojciechowski et al. [14]. Grzesik [4] points out that the horizontal parameter, Rsm, is also important from the point of view of the utilitarian characteristics of surfaces. The behavior of surfaces in operating conditions is described by, e.g., Rku and Rsk. The Rku parameter describes surface defects, while from the results of Rsk measurements, the conductivity and load-carrying capacity of a given surface may be inferred. These parameters have been analyzed in the literature, e.g., in the study of precise cylindrical milling [15].
The surface roughness is among the key indicators describing numerous machining processes, e.g., plastic forming (pre-treatment), the Abrasive Water Jet Machining (AWJM) method (preparation of semi-finished products for other processes) [16], or brushing treatment (deburring) [7]. It is thus necessary to supply more detail in the description of the surface finish quality after machining. Nevertheless, the specialist literature tends to limit the scope of analyses to the Ra parameter, which appears broadly insufficient considering the applicability of Mg alloys.
Although the spiral tool path is employed in the machining of the hardest-to-machine materials, in the case of light alloys, such as Mg, trochoidal milling is used to reduce the cutting forces, heat, and chatter in the area of the cut [17,18]. The research works devoted to trochoidal milling of light alloys tend to seek the real values of machinability indexes, e.g., the cutting force components [19,20,21], and their simulation with ANN/MES solutions [22]. What is more, these analyses focused on Al alloys, e.g., 7075-T651 [20], 5086 Al alloy [21], or Al6061-T6 alloy [22], which indicates that there is a distinct paucity of research into the machinability of Mg alloys using a trochoidal path.

1.2. Brushing Characteristics

Brushing is a type of mechanical surface treatment with a rotary tool. Brushing tools are found across industries in applications predominantly involving deburring, edge rounding, glossing, and surface cleaning. Deburring is the typical purpose of brushing. The study by Matuszak et al. [7] presented the complex impact of the conditions of brushing on deburring and the surface of 7075 Al alloys after milling, by analyzing the state of the edges (rounding, chamfering), edge roughness, microhardness, and internal stresses. As a result, brushing was shown to contribute to a significant increase in microhardness and internal stresses.
Ceramic fiber brushes, the working part of which is made of alumina fibers, are relatively new tools on the market. Composed of myriad highly flexible brush microfibers (a single bristle consists of approximately 1000 microfibers), they adapt well to the shape of the workpiece.
Kitahara et al. [23,24] examined the impact of brushing treatment on the microstructure, the mechanical properties, and the corrosion resistance of 1-mm-thick AZ31B Mg alloy plates under a varying feed and axial force applied by the brush against the workpiece. It was concluded that in the range of machining conditions adopted in the experiment, the grain size of the Mg alloy microstructure shows higher sensitivity to the feed rather than to the axial force applied by the brush. In addition, the yield strength and tensile strength increased slightly after brushing. The brushed surface was imparted with a high corrosion resistance, about four to seven times greater compared to the untreated one.
In a different study [25], the question of improving the corrosion resistance of the reinforcing wire by means of the brushing treatment was undertaken. The wire moved between two opposite brushes—rotating at a speed of 8000 rpm with a feed speed of 300 mm/min—to intensify the process, which was additionally performed in two transitions. After the first pass, the reinforcing wire was rotated around its axis by 90° to obtain a uniform surface on the entire circumference of the specimen. Scale removal during brushing was shown to further contribute to enhancing the corrosion resistance. In addition, brushing is used to create a specific direction of the grain in the geometric surface structure, for a decorative effect, to enhance bonding in the adhesive joining process, or to impart specific properties of the surface layer [26,27,28].

1.3. Surfaces Roughness Modelling and Prediction

Various experimental studies aimed at deepening the knowledge on the phenomena and relationships occurring during machining processes are increasingly supported by mathematical modelling and computer simulation. This includes the analysis of the surface layer quality of workpieces.
Different models may be employed for the prediction of surface roughness data after machining. Equipped with the dependable results from these simulations, engineers may set the parameters of machining processes with a higher certainty of obtaining the desired surface texture. Mathematical modelling was, e.g., employed by Zhou et al. [29] to produce 3D area topography after helical milling. The model accounted for such factors as the tool eccentricity, the secondary cutting, and the effect of size. Urbikain [30], on the other hand, developed a geometrical model for the prediction of the surface topography in flank-milling with the use of circle-segment end mills. The analysis considered the tool geometry, the feed rate, the radial immersion, and the tool run-out. Miko and Nowakowski’s model [31] served to determine the Ra of the surface following milling, thus aiding the correct specification of machining parameters as per the desired properties of surface roughness. The model of the Polish scholars is also similar to other models by sharing the key problem, the inaccuracy of predictions, resulting from the included simplifying assumptions. The result is the discrepancy between the modelled and actual surface roughness parameters, which may produce a 1.5 to 5 times lower prediction. The machining process is highly complex, involving numerous random factors, and therefore it is difficult to obtain fully accurate simulation results.
Given the inaccuracies, new artificial network-based models of machining processes began to emerge. They implemented the experimental models, thus providing superior precision of predictions and representation of the characteristics of machining processes. ANN prediction models are employed in numerous works, e.g., by Sangwan et al. [32], who determined optimum machining parameters from the perspective of minimizing the surface roughness. The genetic algorithm (GA) was also used in the study. Neural networks’ performance is further confirmed in predicting surface quality and optimization of process parameters [33], machining performance [34], or the cutting force and vibration [19].
The use of ANNs is by no means restricted to the cases listed in the preceding paragraph, as they are used, e.g., to model the surface roughness in turning. Several examples of such applications can be given, e.g., the model for predicting the surface roughness of AISI316 stainless steel following low-speed turning based on multiple linear regression and ANN by Acayab and Escalon [35]; empirical models for tool life, surface roughness, and cutting force determination in turning [36]; or the implementation of Edgeworth–Pareto optimization of ANN in the prediction of the surface roughness (Ra) of a component subjected to CNC turning over a minimal machining time and at the prime machining cost [37].
Based on the analyzed literature, it appears that extending the scope of investigations to include a greater number of surface roughness parameters allows a deeper insight into the condition or utilitarian features of surfaces, including, e.g., its fatigue strength characteristics. Therefore, the study reported in this paper employed 2D roughness parameters (Rz, Rku, Rsk, RSm, Ra) and 3D area roughness parameters (Sa, Sz, Sku, Ssk) to describe in detail the surface of AZ91D and AZ31 magnesium alloy substrates after trochoidal milling and brushing. The choice of the workpiece material followed the preliminary search of the literature, which revealed few studies on the machinability of Mg alloys using the trochoidal path and brushing. The influence of vc and str on selected indicators of the surface geometry was assessed based on the results of the surface roughness parameter measurements on the end face and the lateral face of substrates, their surface free energy, and by means of the artificial neural network simulation and statistical tests. The primary purpose of ANN modelling is to forecast the effects of non-linear technological processes, such as trochoidal milling or brushing. Developed further, the methodology may give rise to a decision-making support system to be implemented in manufacturing enterprises.

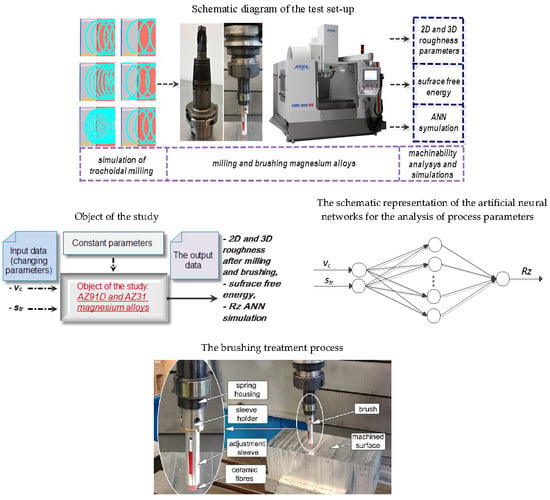
2. Materials and Methods

This work set out to analyze the effect of the variable machining parameters of milling and brushing on selected indicators of the surface geometry and energy. These analyses concerned the machinability of two types of magnesium alloys: AZ31 (for sheet and plate uses) and AZ91D (a die casting alloy).
The milling was carried out using the vertical milling center AVIA VMC800HS (Warsaw, Poland) with the Heidenhain iTNC 530 control system. The model and the machining procedure were implemented by means of NX 10.0 – SIEMENS (Munich, Germany) software. The cutting tool in the tests was a VHM end mill from Fenes (Siedlce, Poland). It was a TiAlN-coated double-edge carbide milling cutter of a diameter, d = 16 mm. The milling cutter was mounted in a SECO shrink-fit holder (Fagersta, Sweden) HSK 63A SFD 16 × 120 mm. A CIMAT RT 610 balancer (Bydgoszcz, Poland) was used to balance the tool and holder in a grade “G2.5”, in accordance with the International Standard, ISO 21940-11: 2016. The residual unbalance value was 0.77 gmm. Based on former research and a review of the literature, the following ranges of milling parameters were used: The cutting speed vc = 400–1200 m/min, the trochoidal step str = 5–30% of the tool diameter, fz = 0.15 mm/tooth, and ap = 6 mm.
The tests were specifically designed to determine the impact of the trochoidal step, str, and the cutting speed, vc, on selected 2D and 3D roughness parameters. The 2D surface roughness parameters were measured in two variants, at the end face and the lateral face, while the 3D area roughness was measured solely at the end face. In the case of the 2D roughness parameters’ analysis, the following measurements were made:
  • At the end face of the specimen: Rz, Rku, Rsk, RSm, Ra; and
  • At the lateral face of the specimen: Rz, RSm, Rku, Rsk.
The 3D roughness parameters measurements were based on the following parameters: Sa, Sz, Sku, and Ssk. 2D roughness measurements were carried in five repetitions on each surface, with the use of a Hommel Tester T1000 contact profilometer (Jena, Germany). The following measurement parameters were used for 2D roughness measurements: Traverse length lt = 15 mm and sampling length lr = 2.5 mm, scan rate vt = 0.5 mm/s, and measuring ranges/resolution M = ±320 μm/0.04 μm). T8000 RC120-400 combined roughness and contour measurement system by Hommel–Etamic Jenooptik (Jena, Germany) was the tool for the 3D area roughness profile measurements. The 3D area roughness measurement specifications were the following: lt = 4.8 mm, lr = 0.8 mm, and vt = 0.5 mm/s. The 4.8 × 4.8 mm surface area was scanned in approximately 200 scanning steps. Figure 1 shows an example of a 2D surface profile obtained from the extracted profile analysis, according to the International Standards ISO: ISO 11562, ISO 135651, and ISO 4287.
Figure 2 presents a schematic diagram of the conducted experiment (Figure 2a) and test set-up (Figure 2b) along with the object of the study.
Milling was followed by brushing, which was carried out at constant parameters with a ceramic brush from Xebec (Tokyo, Japan), with a shank diameter of 6 mm. The brush fibers offer different grinding power properties, represented by the pink, red, white, and blue colors. In our tests, red fibers, dedicated for light alloys, were employed. The brushing parameters were constant: n = 5000 rev/min, vf = 300 mm/min, and the distance between the fibers and the work surface, ap = 0.5 mm. Having completed the machining stage, the condition of the surface was evaluated (parameters Ra, Rz, RSm) in order to compare the effects of milling and brushing. Figure 3 shows the brushing treatment in the process.
The surface free energy of the Mg alloys was obtained indirectly by contact angle measurement. Two standard liquids were used, distilled water and diiodomethane. The standard liquids with a constant volume of approximately 4 μL were automatically applied to the test surface with a PGX goniometer (Paul N. Gardner Company, Pompano Beach, FL, USA). The contact angle measurements with distilled water and diiodomethane were carried out in 10 repetitions at minimum for each Mg alloy surface [38]. The measurements were taken at the temperature range of 20 to 22 °C and the relative humidity of 40% to 45%.
The experimental data were fed into the ANN to simulate the maximum height of the profile (Rz). The milling and brushing processes were approached as the control object and the modelled surface roughness parameter, Rz, became the output parameter. This allowed us to compensate for any inaccuracy issues resulting from the nonlinear character of the simulated processes. The variable parameters of machining were the cutting speed, vc, and the trochoidal step, str (2 neurons in the hidden layer). The ANN schematics in Figure 4 show the analyzed process parameters, the variable input, vc and str, and the output parameters, the surface roughness Rz (one neuron in the output layer). Four different neural networks were prepared to represent the process, including: One machining parameter; two types of machining, milling and brushing; and two workpiece materials, AZ31 and AZ91D. The black box model of ANNs was selected for the performance considerations. This model is suitable whenever mathematical equations fail to accurately describe the process under analysis, as in the studied case.
The simulation works were carried out with the application of the specialist statistical software, Statistica Neural Networks, and employed two ANN types, MLP (multi-layered perceptron) and RBF (radial basis function). The former model used linear, exponential, logistic, tanh, and sinus activation functions, while for the BFGS gradient (Broyden–Fletcher–Goldfarb–Shanno), the conjugate gradient and the steepest descent training algorithm were used to train the network. The latter network’s activation functions were for hidden neurons, the Gaussian distribution, and for output neurons, the linear function, and it was trained with the RBFT algorithm. The number of neurons in the hidden layer (2–9) and training epochs (150–300) were determined experimentally. The advantages of the selected ANNs are optimal training, validation quality, and error characteristics. The least-squares method was used to identify the network errors. The training data set involved 75% of the experimental data while the remaining 25% were used for validation. Given the insufficient amount of data from milling, it was resolved that the test data set would not be included [19].

3. Results

The results from the experiments and measurements are presented in the form of bar charts, with the standard deviation marked as a measure of the scatter of the measurement results. 2D roughness parameters, including their mean values after milling, are given in Figure 5, Figure 6, Figure 7, Figure 8, Figure 9, Figure 10, Figure 11 and Figure 12, while after brushing is shown in Figure 13 and Figure 14. For the sake of 3D roughness parameter analysis (Figure 15 and Figure 16), surface roughness maps were created, one for each machining parameter, hence these charts do not contain a standard deviation.

3.1. Surface Roughness after Trochoidal Milling

3.1.1. The Effect of Trochoidal Step, str

(a) The End Face of the Specimen

Figure 5 shows the values of the Rku (kurtosis) and Rsk (skewness) parameters. The presented data indicate that considering Rku at str = 5% and 15%, surfaces with more rounded peaks were obtained (Rku <3 increases the friction coefficient), str = 10%, Rku > 3 (is characteristic of surfaces with a large number of sharp peaks, which in the case of mating surfaces may reduce the coefficient of friction), str = 20%–30%, values oscillating in the vicinity of Rku = 3 were obtained, which determines that the distribution is close to normal. In contrast, the Rsk is largely negative, which may compromise the substrate’s corrosion resistance and reduce the coefficient of friction.
Figure 6a reports the results for RSm, i.e., the mean width of the profile elements. In this case, the increase in the trochoidal step, str, affects the value of RSm. The highest values of this roughness parameter were observed for str = 10% (for AZ31 0.27 mm and AZ91D 0.41 mm, respectively). The results obtained at str 5%, 20%, and 25% were the lowest and thus may be considered as the most favorable from the analyzed viewpoint. Figure 6b shows the results for Ra, which oscillated at approximately 1.5 to 2.0 µm. From the data presented in Figure 6b, it can be seen that increasing the trochoidal step leads to the emergence of different relations depending on the type of workpiece material. In the case of the AZ91D alloy, the surface roughness increases (comparing str = 5% and str = 30%, Rz: from 7.1 to 11.6 µm), whereas in AZ31 alloy, the roughness parameters change only to a slight extent.

(b) The Lateral Face of the Specimen

Figure 7 shows the values of the Rz and RSm parameters at different trochoidal steps, str, measured on the lateral face of the specimen.
As the trochoidal step, str, increases, the values of the Rz and RSm parameters change. The lowest values of both parameters were observed for str = 5%. In the case of the Rz parameter, the least favorable str is 15% while for RSm, the str ranges from 20 to 30%. The least favorable conditions of machining, the 15% trochoidal step, indicate an unstable machining area. Similar relationships are often found for other indicators, e.g., for the radial depth of cut ae, the stable areas were determined for ae > 75% d and ae < 25% d (d is the tool diameter). Therefore, with respect to Rz, the stable machining area is str = 5% and str = 20–30%. In addition, increasing the str results in an increase in the amount of workpiece material subtracted per one trochoidal step (increase in the diameter of the area of the cut). The higher extraction rate leads to the rise in the values of the horizontal surface roughness parameter, Rsm (mean width of the profile elements).
Figure 8 shows the values of Rku and Rsk. In both cases, for most changes in the range of str, the parameters, Rku and Rsk, assume positive values (the exception being the Rsk parameter for alloy AZ31 at str = 5% and alloy AZ91D at str = 30%). Positive values of both parameters may indicate more rounded peaks of micro-irregularities, an increased friction coefficient, and higher corrosion resistance.

3.1.2. Effect of the Cutting Speed, vc

(a) The End Face of the Specimen

Figure 9 presents the results of the kurtosis and skewness measurements. It shows that the slope factor of the profile is positive, which indicates the increase in the friction coefficient (due to more rounded surface irregularities). In contrast, the profile asymmetry factor in the majority of cases takes negative values. Therefore, it can be concluded that the peaks and valleys are non-symmetrical in distribution, and the corrosion resistance is lower.
Figure 10a, which shows the recorded values of RSm, gives a clear indication that the increase in the vc value impacts the RSm parameter value. The highest values of RSm were observed for vc = 400 m/min. The results obtained in the 600–1200 m/min range of vc produced the most beneficial conditions of machining, with the lowest RSm. In addition, for vc = 1000 m/min, the RSm parameter values were: 0.115 (AZ31) and 0.2 mm (AZ91D). Figure 10b, on the other hand, shows that the lowest values of Ra were in the region of 1 µm. It can also be seen that as the cutting speed, vc, increases, the Rz surface roughness parameter exhibits a tendency to drop. The lowest values of the Rz parameters are observed in the range of vc = 1000–1200 m/min. This highlights that machining at high cutting speeds (HSM) is beneficial for the condition of the surface. The lowest Rz values were 5.45 µm for the AZ31 alloy and 5.05 µm for the AZ91D alloy (at vc = 1000 m/min). The observed drop in the values of Ra and Rz could be the result of the machining speed entering the range of HSM, in which the cutting forces and the surface roughness are known to decrease.

(b) The Lateral Face of the Specimen

Figure 11 reports the values of the Rz and RSm parameter at the changing cutting speed, vc, measured at the end face of the specimens. From Figure 11, it can be seen that with the increase in vc, the values of the Rz and RSm parameters change. An increase in these parameters causes an increase in the analyzed machinability indices. The lowest values of both parameters were observed for vc = 400 m/min. In the case of the Rz parameter, the least favorable machining scenario is vc = 800 m/min, and in the case of the RSm, it is the entire 800 to 1200 m/min range of vc. From the observations, it can be seen that the lowest values of the surface roughness parameters (Rz and Rsm) on the lateral face of the specimen are obtained when the process is executed at lower speeds and following the trochoidal tool path.
Figure 12 presents the values of Rku and Rsk. In both cases, the parameters, Rku and Rsk, take positive values, which may indicate more rounded peaks of micro-irregularities, thus a higher coefficient of friction, as well as higher corrosion resistance.

3.2. Surface Roughness after Brushing

3.2.1. Effect of the Trochoidal Step on the Surface Roughness

Figure 13 shows the effect of the trochoidal step on the roughness of the Mg alloys’ surfaces upon brushing (Ra, Rz, and RSm, respectively). Considering Ra and Rz, the AZ91D alloy appears to have exhibited higher values of roughness parameters.
Modifying the trochoidal step has a notable impact on changes in the roughness parameters of the AZ91D alloy. In the trochoidal step range of 5% to 20%, an increase in the roughness parameters occurs along with the increase in the trochoidal step. Comparing the surface roughness parameters from milling (the results in Section 3.1), it can be seen that brushing caused a significant reduction in the roughness. In the case of brushing, the values of the Ra parameter changed accordingly: For the AZ31 alloy in the range from Ra = 0.26 µm to Ra = 0.35 µm (after milling from Ra = 1.49 µm to Ra = 1.91 µm), and for the AZ91D alloy in the range from Ra = 0.22 µm to Ra = 0.53 µm (after milling from Ra = 1.39 µm to Ra = 2.16 µm). On average, over the entire range of the trochoidal steps investigated, the brushing treatment caused a 5.6-fold decrease in the value of the Ra parameter in relation to milling for the AZ31 alloy and about 3.9-fold drop for the AZ91D alloy. A similar trend was observed for Rz.

3.2.2. The Effect of the Cutting Speed

Figure 14 shows the effect of the cutting speed, vc, change during milling on the roughness of the workpiece surface measured after brushing. Compared to the values of the roughness parameters obtained in milling, it can be stated that brushing is capable of reducing the surface roughness by several times.
The lowest values of the roughness parameter, Ra = 0.23 µm, were obtained for the AZ31 alloy machined at the speed of vc = 800 m/min. A marked decrease in the surface roughness in the 400–800 m/min vc range may indicate machining in the HSM range, which typically involves the decrease in the surface roughness at an increased cutting speed.

3.3. 3D Area Roughness

In Table 1 and Table 2, the surface topographies are collected along with the bearing area curves obtained from the milling process. The isometric images and the Abbott–Firestone curves present the conditions at the end face of the workpiece. In the isometric views of surface topographies, visibly marked machining traces produced at subsequent passes of the cutting tool are visible. An extended analysis of 3D roughness parameters is given below, when the Sa, Sz, Sku, and Ssk 3D roughness parameters are detailed.
The bearing area curve (the Abbott–Firestone curve) provides relevant information from the point of view of surface functionality. This curve takes different shapes: Degressive, progressive, progressive-degressive, and degressive-progressive. The most favorable in terms of utilitarian features are surfaces whose curves represent a progressive or progressive-degressive trend. The progressive material bearing area curve denotes a surface of "rounded" peaks of micro-irregularities, which is more resistant to wear than surfaces with the degressive curve shape [15]. Based on the results from the tests presented in Table 2, it can be concluded that the resulting surfaces are in most cases degressive-progressive.
Figure 15 and Figure 16 show the 3D area roughness parameters, respectively, Sa, Sz, Sku, and Ssk. The behavior of these parameters was analyzed under a changing cutting speed, vc, and trochoidal step, str.
From the graphs in Figure 15 and Figure 16, and the results from the performed tests, it can be concluded that changes in the roughness parameters occur in response to the increase in vc/str. The lowest values of the Sa and Sz parameters were measured in the range of vc = 1000–1200 m/min. Although slightly, the Sa and Sz roughness parameters change their values in response to the change in str.
The Rku parameter was shown to take positive values in both cases (the change in vc and str), which leads to the conclusion that these surfaces are characterized by more rounded peaks of micro-irregularities and a higher coefficient of friction. In contrast, the Sku parameter in most cases takes negative values, which may indicate a lower corrosion resistance.

3.4. Surface Free Energy (SFE) after Milling

Figure 17 shows the energy state of the surface layer of the AZ31 and AZ91D Mg alloys.
The results from the experiments indicate that the machining parameters affect the surface free energy and its polar component. The largest increase in the value of the SFE was observed for the AZ91D alloy at the str parameter modification. The said increase amounted to 16% when machining with str = 30%, compared to the specimens machined at str = 5%. The maximum increase in the polar component of the SFE was a 96% increase observed in the AZ91D alloy. The cutting speed was similarly found to impact the SFE of the analyzed Mg alloys.

3.5. Numerical Modelling of Rz Surface Roughness Parameters with Artificial Neural Networks after Trochoidal Milling and Brushing

The experimental data from the measurements of Rz, the maximum height of the profile, after milling and brushing of the tested Mg alloys, AZ31 and AZ91D, served as input for the simulation of Rz with the use of ANNs. The simulations were performed by means of the Statistica Neural Networks software and with the use of MLP and RBF networks.
There are several network quality indicators, including learning quality, validation quality, learning error, and validation error, derived from the least-squares method. In the study, 500 networks were developed for each modelled scenario; subsequently, the quality of networks was evaluated with the aforementioned indicators to select the most suitable network type—MLP or RBF. The obtained network parameters for AZ31 and AZ91D alloys and Rz surface roughness after milling are given in Table 3. Analyzing the networks obtained from the simulation of the surface roughness following milling and brushing for AZ31 alloy, it was found that network 3, MLP 2-8-1, is the most suitable. The said ANN contains 8 hidden neurons and was obtained after 150 iterations. The activation function of the neuron in the hidden layer into the output signal is logistic, and in the output layer it is linear. In the case of the AZ91D alloy, the best results were also obtained for the MPL network with eight hidden neurons (MLP 2-8-1), whose activation function in the hidden layer is tanh, and in the output layer, it was logistic. The network was produced after 168 iterations.
The results of the surface roughness parameters, Rz, for the AZ31 and AZ91D alloys after brushing are presented in Table 4. The comparative analysis of the neural network models leads to the conclusion that for the AZ31 alloy, it was the RBF 2-8-1 network with eight neurons that provided better results. In the case of brushing treatment, the results of the simulated surface roughness parameters, Rz, for the AZ31 and AZ91D alloy are presented in Table 4.
The comparative analysis of the neural network models shows the superiority of the RBF 2-8-1 network with eight neurons, as it provides better fitting results for the AZ31 alloy. It was, moreover, only in this case that the RBF network performed better in determining the surface roughness parameter, Rz, both after milling and brushing. This network has one hidden layer containing radial neurons, each modelling the Gaussian response surface, whereas, in the output layer, it contains linear neurons with a linear activation function. In the modelling of the surface roughness parameter, Rz, after the milling and brushing of the AZ91D alloy, comparable results were obtained for networks 4 (MLP 2-5-1) and 6 (MLP 2-4-1). However, analyzing the detailed error results and differences for individual cases and taking into account its practical purpose, it would be more reasonable to use network 6. This network was the product of 200 iterations and the activation function in both the hidden and output layers is logistic.
The numerical results from the total simulation of the surface roughness parameter, Rz, for AZ31 and AZ91D alloy after milling are shown in Figure 18 while those after milling and brushing are shown in Figure 19. Once vc and str were fed into Statistica, the surface roughness parameters, Rz, for both alloys were obtained.
The accuracy of the modelled networks (Figure 20 and Figure 21) enables the comparison of the surface roughness parameter, Rz, measured for the milling and brushing of the AZ31 alloy (Figure 20) and the AZ91D alloy (Figure 21) material, with the numerical values reflecting the changes in the cutting speed, vc, at a fixed trochoidal step of str = 15. From their comparison, it can be seen that the relative error between the real values of the simulated parameters did not exceed 10% for milling, and 15% for after milling and brushing.
The results from the simulations show a permissible level of error, lower than 15%. This indicates that ANNs are fully capable of simulating parameters of milling or brushing. The obtained data may give grounds for the development of effective numerical models. This property of artificial neural networks earmarks them as a perfect machining process simulation tool.

3.6. Statistical Analysis

To validate the findings, the Ra and Rz parameters obtained during milling and brushing were subjected to statistical analysis. First, the said parameters were tested for normality with the Shapiro–Wilk test, and subsequently, the equality of variances and mean values were verified at the standard level of significance of α = 0.05.
The results of the statistical analysis performed for the Ra and Rz parameters obtained on the end face surfaces of the sample during milling with a trochoid step of str = 5% and str = 30% are presented in Table 5 and in Figure 22 and Figure 23.
At the standard level of significance, the change in str was shown not to exert a significant effect on the observed variance of results. However, in the case of mean values, no effect was demonstrated only for the Rz parameter measured on the lateral face of AZ31 Mg alloy workpieces. In the case of Ra results, the disparity in mean values was observed; however, it appears to favor employing larger trochoidal step values.
Results from the statistical analysis of the Ra and Rz parameters measured on the end face surface of specimens after milling with a trochoidal step of str = 5% and str = 30% and after brushing are presented in Table 6 and in Figure 24 and Figure 25.
From the statistical analysis presented above, it can be seen that the hypothesis of equality of variances was confirmed in all cases. The obtained mean values of Ra after milling and brushing reveal that in surfaces machined at a higher trochoidal step, Ra shows a statistically significant increase along with the increase in str. No differences were found for the Rz parameter measured on the end face of the AZ31 workpieces.

4. Conclusions

The experimental and mathematical data obtained in the study reported in this work enabled the following conclusions.
  • Lower values of roughness parameters after milling were obtained at the end face of the specimen (e.g., for AZ31 and str = 30%: end face Rz = 9.22 µm, lateral face Rz = 14 µm).
  • The changes in the analyzed roughness parameters were different in response to vc and str.
  • For both alloys, similar values of the analyzed roughness parameters were achieved (e.g., for vc = 400 m/min, Rz: AZ31 was 8.66 µm and AZ91D was 9.15 µm). The discrepancies could only be considered at the statistical level; however, they are technologically irrelevant.
  • Although the change in the tested milling input parameters (vc/str) induced a change in the investigated surface roughness parameters, it is, however, difficult to observe a distinctive trend.
  • In relation to milling, brushing treatment reduces the roughness parameters of the tested Mg alloy specimens by several times. Following brushing, an approximately 5.6-fold decrease in the roughness (Ra parameter) was observed for the AZ31 alloy and about 3.9-fold for the AZ91D alloy, compared to the initial machining, i.e., milling with a variable trochoidal step.
  • The largest increase in the value of the surface free energy (16%) was observed for the AZ91D alloy during the change of the str parameter. The increase in the SFE directly impacts the increase in the polar component of the SFE, which for the AZ91D alloy was 96%.
  • Considering the simulation results of the roughness parameters and their correlation with the actual cutting data, the error was shown not to exceed the acceptable level of 15% (10% for milling and 15% for milling and brushing). ANNs exhibit good potential for the simulation of accurate data for the preliminary determination of milling parameters.
  • The ANNs succeeded in representing the non-linear dependence between machining and roughness parameters. This may prove their fitness for the analysis of milling without the need for implementing time-, labor-, and cost-consuming machining.
  • ANN simulation may be the cornerstone of modelling tools for the analysis of phenomena in machining. If effectively implemented, it can aid the decision-making process by producing precise cutting data that ensures the required surface roughness. A set of parameters (vc and str) fed into the system as input for computation is transformed into surface roughness parameter values (Rz) for the tested machining parameters (milling, brushing) of the tested Mg alloys, AZ31 and AZ91D.
  • The statistical analysis of Ra confirms that in the milling and brushing variant, the change in str is reflected in the statistically significant change in the values of Ra. The observed variance of means, however, appears to indicate a favorable effect of a higher trochoidal step on the surface finish (for str = 5% was 1.91 µm and str = 30% was 1.63 µm). A reverse effect was shown in the milling and brushing of AZ31 alloy.

Author Contributions

Conceptualization, M.K. (Monika Kulisz), I.Z., M.K. (Mariusz Kłonica) and J.M.; Data curation, I.Z., M.Ku, J.M. and M.K. (Mariusz Kłonica); Formal analysis, M.K.(Monika Kulisz); Investigation, I.Z., J.M. and M.Kl; Methodology, I.Z., J.M., M.K. (Mariusz Kłonica) and M.K. (Monika Kulisz); Software, M.K. (Monika Kulisz); Visualization, M.K. (Monika Kulisz), I.Z., M.K. (Mariusz Kłonica) and J.M.; Writing—original draft, M.K. (Monika Kulisz), I.Z., J.M. and M.K. (Mariusz Kłonica); Writing—review and editing, M.K. (Monika Kulisz), I.Z., M.K. (Mariusz Kłonica) and J.M.; Supervision, M.K. (Monika Kulisz); Project Administration, M.K. (Monika Kulisz); Funding Acquisition, M.K. (Monika Kulisz). All authors have read and agreed to the published version of the manuscript.

Funding

The project/research was financed in the framework of the project Lublin University of Technology-Regional Excellence Initiative, funded by the Polish Ministry of Science and Higher Education (contract no. 030/RID/2018/19).

Conflicts of Interest

The authors declare no conflicts of interest.

References

  1. Matuszak, J.; Kłonica, M.; Zagórski, I. Measurements of Forces and Selected Surface Layer Properties of AW-7075 Aluminum Alloy Used in the Aviation Industry after Abrasive Machining. Materials 2019, 12, 3707. [Google Scholar] [CrossRef] [PubMed] [Green Version]
  2. Matuszak, J.; Kłonica, M.; Zagórski, I. Effect of Brushing Conditions on Axial Forces in Ceramic Brush Surface Treatment. In Proceedings of the 2019 IEEE 5th International Workshop on Metrology for AeroSpace (MetroAeroSpace), Torino, Italy, 19–21 June 2019; IEEE: Torino, Italy, 2019; pp. 644–648. [Google Scholar] [CrossRef]
  3. Kłonica, M.; Kuczmaszewski, J.; Samborski, S. Effect of a notch on impact resistance of the epidian 57/Z1 epoxy material after “Thermal Shock”. Solid State Phenom. 2016, 240, 161–167. [Google Scholar] [CrossRef]
  4. Grzesik, W. Surface Topography and Utilitarian Characteristics of Machine Parts. Mechanik 2015, 8–9, 587–593. [Google Scholar] [CrossRef] [Green Version]
  5. Sedlaček, M.; Vilhena, L.M.; Podgornik, B.; Vižintin, J. Surface Topography Modelling for Reduced Friction. Stroj. Vestn. J. Mech. Eng. 2011, 57, 674–680. [Google Scholar] [CrossRef] [Green Version]
  6. Sedlaček, M.; Gregorčič, P.; Podgornik, B. Use of the Roughness Parameters Ssk and Sku to Control Friction—A Method for Designing Surface Texturing. Tribol. Trans. 2017, 60, 260–266. [Google Scholar] [CrossRef]
  7. Matuszak, J.; Zaleski, K. Analysis of deburring effectiveness and surface layer properties around edges of workpieces made of 7075 aluminium alloy. Aircr. Eng. Aerosp. Technol. 2018, 90, 515–523. [Google Scholar] [CrossRef]
  8. Gziut, O.; Kuczmaszewski, J.; Zagórski, I. Surface quality assessment following high performance cutting of AZ91HP magnesium alloy. Manag. Prod. Eng. Rev. 2015, 6, 4–9. [Google Scholar] [CrossRef]
  9. Kłonica, M.; Kuczmaszewski, J. Badania porównawcze stanu energetycznego warstwy wierzchniej stopu AZ91HP po obróbce ściernej i frezowaniu. Mechanik 2015, 8–9, 212–216. [Google Scholar]
  10. Shi, K.; Zhang, D.; Ren, J.; Yao, C.; Huang, X. Effect of cutting parameters on machinability characteristics in milling of magnesium alloy with carbide tool. Adv. Mech. Eng. 2016, 8. [Google Scholar] [CrossRef] [Green Version]
  11. Ruslan, M.S.; Othman, K.; Ghani, J.A.; Kassim, M.S.; Haron, C.H.C. Surface roughness of magnesium alloy AZ91D in high speed milling. J. Teknol. 2016, 78, 115–119. [Google Scholar] [CrossRef] [Green Version]
  12. Muralidharan, S.; Karthikeyan, N.; Kumar, A.B.; Aatthisugan, I. A study on machinability characteristic in end milling of magnesium composite. Int. J. Mech. Eng. Technol. 2017, 8, 455–462. [Google Scholar]
  13. Sathyamoorthy, V.; Deepan, S.; Sathya Prasanth, S.P.; Prabhu, L. Optimization of Machining Parameters for Surface Roughness in End Milling of Magnesium AM60 Alloy. Indian J. Sci. Technol. 2017, 10, 1–7. [Google Scholar] [CrossRef]
  14. Wojciechowski, S.; Twardowski, P.; Pelic, M.; Maruda, R.W.; Barrans, S.; Krolczyk, G.M. Precision surface characterization for finish cylindrical milling with dynamic tool displacements model. Precis. Eng. 2016, 46, 158–165. [Google Scholar] [CrossRef]
  15. Zaleski, K.; Skoczylas, A. Effect of vibration shot peening parameters upon shapes of bearing curves of alloy steel surface. Adv. Sci. Technol. Res. J. 2015, 9, 20–26. [Google Scholar] [CrossRef] [Green Version]
  16. Zagórski, I.; Kłonica, M.; Kulisz, M.; Łoza, K. Effect of the AWJM Method on the Machined Surface Layer of AZ91D Magnesium Alloy and Simulation of Roughness Parameters Using Neural Networks. Materials 2018, 11, 2111. [Google Scholar] [CrossRef] [Green Version]
  17. Santhakumar, J.; Iqbal, M.U. Parametric Optimization of Trochoidal Step on Surface Roughness and Dish Angle in End Milling of AISID3 Steel Using Precise Measurements. Materials 2019, 12, 1335. [Google Scholar] [CrossRef] [Green Version]
  18. Celaya, A.; Bo, P.; González, H.; Bartoň, M.; Lopez de Lacalle, L.N. Highly accurate 5-axis flank CNC machining with conical tools. Int. J. Adv. Manuf. Technol. 2018, 97, 1605–1615. [Google Scholar] [CrossRef] [Green Version]
  19. Zagórski, I.; Kulisz, M.; Kłonica, M.; Matuszak, J. Trochoidal Milling and Neural Networks Simulation of Magnesium Alloys. Materials 2019, 12, 2070. [Google Scholar] [CrossRef] [Green Version]
  20. Pleta, A.; Niaki, F.A.; Mears, L. A comparative study on the cutting force coefficient identification between trochoidal and slot milling. Procedia Manuf. 2018, 26, 570–579. [Google Scholar] [CrossRef]
  21. Rauch, M.; Duc, E.; Hascoet, J.Y. Improving trochoidal tool paths generation and implementation using process constraints modelling. Int. J. Mach. Tool. Manuf. 2009, 49, 375–383. [Google Scholar] [CrossRef]
  22. Gao, Y.; Ko, J.H.; Lee, H.P. 3D Eulerian Finite Element Modelling of End Milling. Procedia CIRP 2018, 77, 159–162. [Google Scholar] [CrossRef]
  23. Kitahara, H.; Yada, T.; Tsushida, M.; Ando, S. Microstructure and Evaluation of Wire-brushed Mg Sheets. Procedia Eng. 2011, 10, 2737–2742. [Google Scholar] [CrossRef] [Green Version]
  24. Kitahara, H.; Yada, T.; Hashiguchi, F.; Tsushida, M.; Ando, S. Mg alloy sheets with a nanocrystalline surface layer fabricated by wire-brushing. Surf. Coat. Technol. 2014, 243, 28–33. [Google Scholar] [CrossRef]
  25. Song, D.; Ma, A.; Sun, W.; Jiang, J.; Jiang, J.; Yang, D.; Guo, G. Improved corrosion resistance in simulated concrete pore solution of surface nanocrystallized rebar fabricated by wire-brushing. Corros. Sci. 2014, 82, 437–441. [Google Scholar] [CrossRef]
  26. Fredj, N.B.; Nasr, M.B.; Rhouma, A.B.; Braham, C.; Sidhom, H. Fatigue Life Improvements of the AISI 304 Stainless Steel Ground Surfaces by Wire Brushing. J. Mater. Eng. Perform. 2004, 13, 564–574. [Google Scholar] [CrossRef]
  27. Gillström, P.; Jarl, M. Mechanical descaling of wire rod using reverse bending and brushing. J. Mater. Process. Technol. 2006, 172, 332–340. [Google Scholar] [CrossRef]
  28. Shia, C.Y.; Stango, R.J. Analysis of a Compliant Honing Tool for Brushing Cylindrical Surfaces. J. Manuf. Sci. Eng. 1997, 119, 441–444. [Google Scholar] [CrossRef]
  29. Zhou, Y.; Tian, Y.; Jing, X.; Wang, F.; Liu, Y. Surface topography modeling and roughness extraction in helical milling operation. Int. J. Adv. Manuf. Technol. 2018, 95, 4561. [Google Scholar] [CrossRef]
  30. Urbikain, G.; de Lacalle, L.N.L. Modelling of surface roughness in inclined milling operations with circle-segment end mills. Simul. Model. Pract. Theory 2018, 84, 161–176. [Google Scholar] [CrossRef]
  31. Miko, E.; Nowakowski, E. Models for prediction of Ra roughness parameters of milled surfaces. Mechanik 2015, 8–9, 82–90. [Google Scholar]
  32. Sangwan, K.S.; Saxena, S.; Kant, G. Optimization of machining parameters to minimize surface roughness using integrated ANN-GA approach. Proc. CIRP 2015, 29, 305–310. [Google Scholar] [CrossRef]
  33. Kaviarasan, V.; Venkatesan, R.; Natarajan, E. Prediction of surface quality and optimization of process parameters in drilling of Delrin using neural network. Prog. Rubber Plast. Recycl. Technol. 2019, 35, 149–169. [Google Scholar] [CrossRef]
  34. Zerti, A.; Yallese, M.A.; Zerti, O.; Nouioua, M.; Khettabi, R. Prediction of machining performance using RSM and ANN models in hard turning of martensitic stainless steel AISI 420. Proc. Inst. Mech. Eng. C 2019, 233, 4439–4462. [Google Scholar] [CrossRef]
  35. Acayaba, G.M.A.; Escalona, P.M.D. Prediction of surface roughness in low speed turning of AISI316 austenitic stainless steel. CIRP J. Manuf. Sci. Technol. 2015, 11, 62–67. [Google Scholar] [CrossRef] [Green Version]
  36. Al-Ahmari, A.M.A. Prediction and optimisation models for turning operations. Int. J. Prod. Res. 2008, 46, 4061–4081. [Google Scholar] [CrossRef]
  37. Abbas, A.T.; Pimenov, D.Y.; Erdakov, I.N.; Taha, M.A.; Soliman, M.S.; El Rayes, M.M. ANN Surface Roughness Optimization of AZ61 Magnesium Alloy Finish Turning: Minimum Machining Times at Prime Machining Costs. Materials 2018, 11, 808. [Google Scholar] [CrossRef] [PubMed] [Green Version]
  38. Kłonica, M.; Kuczmaszewski, J. Determining the value of surface free energy on the basis of the contact angle. Adv. Sci. Technol. Res. J. 2017, 11, 66–74. [Google Scholar] [CrossRef] [Green Version]
Figure 1. An example of a 2D surface profile, including the surface roughness parameters (vc = 1200 m/min, str = 15%, AZ31, after trochoidal milling).
Applsci 10 00075 g001
Figure 2. Schematic diagram: (a) test set-up (b) and the study object.
Applsci 10 00075 g002aApplsci 10 00075 g002b
Figure 3. The brushing treatment process.
Applsci 10 00075 g003
Figure 4. The schematic representation of the artificial neural network (ANN) for the analysis of process parameters.
Applsci 10 00075 g004
Figure 5. Effect of the trochoidal step, str: (a) Rku and (b) Rsk (vc = 800 m/min, fz = 0.15 mm/tooth, ap = 6 mm) measured at the end face of the specimen.
Applsci 10 00075 g005
Figure 6. Effect of the trochoidal step, str: (a) RSm and (b) Ra, Rz (vc = 800 m/min, fz = 0.15 mm/tooth, ap = 6 mm) measured at the end face of the specimen.
Applsci 10 00075 g006
Figure 7. Effect of the trochoidal step, str: (a) Rz and (b) RSm (vc = 800 m/min, fz = 0.15 mm/tooth, ap = 6 mm) measured on the lateral face of the specimen.
Applsci 10 00075 g007
Figure 8. Effect of the trochoidal step str: (a) Rku and (b) Rsk (vc = 800 m/min, fz = 0.15 mm/tooth, ap = 6 mm) measured on the lateral face of the specimen.
Applsci 10 00075 g008
Figure 9. Effect of the cutting speed, vc: (a) Rku and (b) Rsk (str = 15%, fz = 0.15 mm/tooth, ap = 6 mm) measured at the end face of the specimen.
Applsci 10 00075 g009
Figure 10. Effect of the cutting speed, vc: (a) RSm and (b) Ra, Rz (str = 15%, fz = 0.15 mm/tooth, ap = 6 mm) measured at the end face of the specimen.
Applsci 10 00075 g010
Figure 11. Effect of the cutting speed, vc: (a) Rz and (b) RSm (str = 15%, fz = 0.15 mm/tooth, ap = 6 mm) measured on the lateral face of the specimen.
Applsci 10 00075 g011
Figure 12. Effect of the cutting speed, vc: (a) Rku and (b) Rsk (str = 15%, fz = 0.15 mm/tooth, ap = 6 mm) measured on the lateral face of the specimen.
Applsci 10 00075 g012
Figure 13. Effect of the trochoidal step, str: (a) Ra, (b) Rz, and (c) RSm measured on the lateral face of the specimen after brushing (milling: vc = 800 m/min, fz = 0.15 mm/tooth, ap = 6 mm; brushing: n = 5000 rev/min, vf = 300 mm/min, ap = 0.5 mm).
Applsci 10 00075 g013
Figure 14. Effect of cutting speed vc: (a) Ra, (b) Rz, and (c) RSm measured on the lateral face of the specimen after brushing (milling: vc = 800 m/min, fz = 0.15 mm/tooth, ap = 6 mm; brushing: n = 5000 rev/min, vf = 300 mm/min, ap = 0.5 mm).
Applsci 10 00075 g014
Figure 15. 3D area roughness parameters after trochoidal milling (effect of vc): (a) Sa; (b) Sz; (c) Sku; (d) Ssk.
Applsci 10 00075 g015
Figure 16. 3D area roughness parameters after trochoidal milling (effect of str): (a) Sa; (b) Sz; (c) Sku; (d) Ssk.
Applsci 10 00075 g016
Figure 17. The surface layer energy state of Mg alloys depending on the trochoidal step str: (a) Surface free energy (SFE); (b) the polar component of SFE, and depending on the cutting speed, vc: (c) SFE; (d) the polar component of SFE.
Applsci 10 00075 g017aApplsci 10 00075 g017b
Figure 18. Numerical results of surface roughness parameters, Rz, after milling for the (a) AZ31 alloy (MLP 2-8-1) and (b) AZ91D alloy (MLP 2-8-1) depending on the cutting speed, vc, and trochoidal step, str.
Applsci 10 00075 g018
Figure 19. Numerical results of the surface roughness parameters, Rz, after brushing for the (a) AZ31 alloy (RBF 2-8-1) and (b) AZ91D alloy (MLP 2-4-1) depending on the cutting speed, vc, and trochoidal step, str.
Applsci 10 00075 g019
Figure 20. Comparison of the experimental and numerical results of the surface roughness parameters, Rz, depending on the cutting speed, vc, for the trochoidal step, str = 15%, for AZ31 alloy after milling and brushing.
Applsci 10 00075 g020
Figure 21. Comparison of the experimental and numerical results of the surface roughness parameters, Rz, depending on the cutting speed, vc, for the trochoidal step, str = 15%, for the AZ91D alloy after milling and brushing.
Applsci 10 00075 g021
Figure 22. Results from Shapiro–Wilk test of normality conducted for the distribution of the Ra parameter results after trochoidal milling: Ra, AZ31 str = 30%.
Applsci 10 00075 g022
Figure 23. Statistical analysis of the (a) Ra and (b) Rz parameters after milling with a variable trochoidal step, str.
Applsci 10 00075 g023
Figure 24. Results from the Shapiro–Wilk test of normality conducted for the distribution of the Ra parameter results after trochoidal milling and brushing: Ra, AZ31 str = 30%.
Applsci 10 00075 g024
Figure 25. Statistical analysis of the (a) Ra and (b) Rz parameters after milling with a variable trochoidal step, str, and brushing treatment.
Applsci 10 00075 g025
Table 1. Selected isometric images of AZ31 and AZ91D specimen surfaces after milling.
vc /strMagnesium Alloys
AZ31AZ91D
600 [m/min] Applsci 10 00075 i001 Applsci 10 00075 i002
1000 [m/min] Applsci 10 00075 i003 Applsci 10 00075 i004
10% Applsci 10 00075 i005 Applsci 10 00075 i006
20% Applsci 10 00075 i007 Applsci 10 00075 i008
Table 2. Abbott–Firestone curve.
vc /strMagnesium Alloys
AZ31AZ91D
600 [m/min] Applsci 10 00075 i009 Applsci 10 00075 i010
1000 [m/min] Applsci 10 00075 i011 Applsci 10 00075 i012
10 % Applsci 10 00075 i013 Applsci 10 00075 i014
20 % Applsci 10 00075 i015 Applsci 10 00075 i016
Table 3. Characteristics of multi-layered perceptron (MLP) and radial basis function (RBF) networks for AZ31 and AZ91D alloy for surface roughness parameters, Rz, after milling.
Network No.Network NameQuality (Training, %)Quality (Validation, %)Error (Training)Error (Validation)Activation (Hidden)Activation (Output)
AZ31 alloy
1MLP 2-9-191.4489.390.5280.532LogisticsSinus
2RBF 2-8-196.3199.980.2330.729GaussianLinear
3MLP 2-8-198.9799.960.0020.647LogisticsLinear
AZ91D alloy
4MLP 2-6-196.9699.650.0310.042TanhExponential
5MLP 2-8-197.9599.370.0320.072TanhExponential
6MLP 2-8-198.9999.530.0110.012TanhLogistic
Table 4. Characteristics of MLP and RBF networks for AZ31 and AZ91D alloy for surface roughness parameters, Rz, after brushing.
Network No.Network NameQuality (Training, %)Quality (Validation, %)Error (Training)Error (Validation)Activation (Hidden)Activation (Output)
AZ31 alloy
1RBF 2-8-193.9699.990.0080.024GaussianLinear
2RBF 2-5-192.2099.980.0110.025GaussianLinear
3RBF 2-6-192.3699.980.0110.032GaussianLinear
AZ91D alloy
4MLP 2-5-195.0199.220.0160.027TanhLogistic
5MLP 2-3-191.3797.680.0260.005TanhSinus
6MLP 2-4-195.0199.970.0160.027LogisticLogistic
Table 5. Statistical analysis of the Ra and Rz parameters after milling with a variable trochoidal step, str.
Hypothesis of Equal VariancesHypothesis of Equal Means
Par.str [%] X ¯ σ2Statistics F ValueCritical Value FConclusionStatistics F ValueCritical Value CStatisticst ValueCritical Value tConclusion
AZ31
End face
Ra51.910.01142.46096.3883Equal--–4.3792.776Unequal
301.630.0046
Rz5
30
8.82
9.22
0.0899
0.2394
0.37576.3883Equal--1.3942.776Equal
Table 6. Statistical analysis of the Ra and Rz parameters after milling with a variable trochoidal step, str, and brushing.
Hypothesis of Equal VariancesHypothesis of Equal Means
Par.str [%] X ¯ σ2Statistics F ValueCritical Value FConclusionStatistics F ValueCritical Value CStatisticst ValueCritical Value tConclusion
AZ31
End face
Ra50.270.00020.93946.3883Equal-- 3.0112.776 Unequal
300.300.0002
Rz5
30
2.32
2.51
0.0234
0.1238
0.18896.3883Equal - -0.9802.776Equal

