Article

A Deep Learning Model for Estimation of Patients with Undiagnosed Diabetes

1
Cancer Big Data Center, National Cancer Control Institute, National Cancer Center, Goyang 10408, Korea
2
Database/Bioinformatics Laboratory, College of Electrical and Computer Engineering, Chungbuk National University, Cheongju 28644, Korea
3
Division of Nephrology, Department of Internal Medicine, Department of Internal Medicine, National Cancer Center, Goyang 10408, Korea
4
Department of Cancer Control and Policy, Graduate School of Cancer Science and Policy, National Cancer Center, Goyang 10408, Korea
*
Author to whom correspondence should be addressed.
Appl. Sci. 2020, 10(1), 421; https://doi.org/10.3390/app10010421
Submission received: 4 November 2019 / Revised: 2 January 2020 / Accepted: 3 January 2020 / Published: 6 January 2020
(This article belongs to the Special Issue Data Technology Applications in Life, Diseases, and Health)

Abstract

:
A screening model for undiagnosed diabetes mellitus (DM) is important for early medical care. Insufficient research has been carried out developing a screening model for undiagnosed DM using machine learning techniques. Thus, the primary objective of this study was to develop a screening model for patients with undiagnosed DM using a deep neural network. We conducted a cross-sectional study using data from the Korean National Health and Nutrition Examination Survey (KNHANES) 2013–2016. A total of 11,456 participants were selected, excluding those with diagnosed DM, an age < 20 years, or missing data. KNHANES 2013–2015 was used as a training dataset and analyzed to develop a deep learning model (DLM) for undiagnosed DM. The DLM was evaluated with 4444 participants who were surveyed in the 2016 KNHANES. The DLM was constructed using seven non-invasive variables (NIV): age, waist circumference, body mass index, gender, smoking status, hypertension, and family history of diabetes. The model showed an appropriate performance (area under curve (AUC): 80.11) compared with existing previous screening models. The DLM developed in this study for patients with undiagnosed diabetes could contribute to early medical care.

1. Introduction

Globally, an estimated 422 million adults are suffering from diabetes mellitus (DM), according to the World Health Organization Global Report on Diabetes. This number is significantly higher than that of 1980 (108 million) [1]. However, an estimated 30–80 percent of diabetes cases are undiagnosed [2]. Diabetes without clinical care is significantly linked to serious complications, which can add a considerable burden to the public health system. The prevalence of diabetes is expected to increase rapidly in the future due to the prevalence of obesity, aging of the population, and other cardiovascular risk factors [3].
Complications of diabetes mellitus such as cardiovascular disease, kidney damage, and so on should be prevented in early stage [4]. However, diabetes is usually asymptomatic [5,6]. People with undiagnosed diabetes are more likely to be diagnosed with complications than those who are aware of their diabetes status. Although fasting plasma glucose (FPG), the oral glucose tolerance test (OGTT), and hemoglobin A1C (HBA1c) are well-established determinants in diabetes diagnosis [7], they are insufficient to provide invasive screen tests for a large population [8].
Risk screening systems for patients with undiagnosed diabetes has been developed [3,8,9,10,11,12]. Lee et al. developed a self-assessment score for diabetes risk in Korean adults [3]. Zhou et al. proposed a diabetes screening model for middle-aged rural Chinese [8]. Aekplakorn et al. developed a prediction risk score for people at high risk of diabetes in Thailand [9]. Nanri et al. developed the model to predict the three-year incidence of type 2 diabetes in a Japanese population [10]. Gao et al. constructed a diabetes risk score for screening undiagnosed diabetes and validated it using Chinese adults [11]. Baan et al. developed a predictive model in order to identify individuals who had an increased risk of undiagnosed diabetes [12]. Theses system are used to prevent diabetes through changes in lifestyle and intervention with pharmaceutical treatments [13]. However, research using machine learning technology to develop screening tools for undiagnosed diabetes has been insufficient.
Previous studies have introduced predictive models for diseases such as diabetic retinopathy, skin cancer, lung disease, heart failure, chronic kidney disease, and so on using machine learning techniques [14,15,16,17,18,19,20]. These studies that use deep learning techniques to make major advances in solving problems have resisted the best attempts of the artificial intelligence community in many cases [21]. Although previous studies have developed predictive models based on machine learning algorithms, it is unclear whether these models can be properly used for estimating undiagnosed diabetes [22,23,24]. Consequently, the objective of the present study was to develop a deep learning model (DLM) for patients with undiagnosed diabetes. The remainder of this paper is organized as follows. Section 2 describes the proposed framework, study design, and methods. Section 3 shows the result of the experiment and Section 4 presents the conclusion and discussion.

2. Materials and Methods

The construction of a DLM for undiagnosed diabetes consists of four steps, as shown in Figure 1. In the first step, KNHANES(korean national health and nutrition examination survey) datasets collected from 2013 to 2016 were combined and the consistency of variables was explored. If the scale measurement of a variable was not changed during the study period, it was included in the present study. In the second step, the combined dataset was pre-processed to obtain a reliable experimental dataset. In the third step, basic characteristics were analyzed for each group, including a normal glucose group (NG), an impaired fasting glucose group (IFG), and an undiagnosed diabetes group (UDG). Significant non-invasive variables (NIV) were selected based on bivariate analysis using logistic regression (LR). These NIVs were used to optimize machine learning models. Finally, the model with the best performance was selected and compared with other screening models published in previous studies on undiagnosed diabetes.

2.1. Study Design

Data from the KNHANES 2013–2016 dataset collected by the Centers for Disease Control and Prevention Korea (KCDC) were used to perform analysis and construct a DLM for predicting undiagnosed diabetes. The KCDC assesses trends in health risk factors and nutrition status. It also conducts surveillance of infectious and chronical diseases. Records collected from the surveillance system are analyzed for the development and evaluation of health policies [25].
There were 31,098 subjects in the KNHANES 2013–2016 dataset, which is a non-duplicate sample. Those with an age ≤ 19 years (n = 7003), null or unknown response (n = 6864), or any record of diabetes diagnosis, abnormal insulin level, or antidiabetic treatment prescription (n = 1331) were excluded. The study population was then divided into a development group (n = 11,456; 2013–2015) and a validation group (n = 4444; 2016) according to the surveyed years shown in Figure 2.
The diagnosis of diabetes was based on diabetes diagnosis criteria that referred to the Classification of Diabetes Mellitus 2019 WHO (world health organization) [2]. Undiagnosed diabetes was identified in the health interview survey for subjects with fasting plasma glucose (FPG) ≥ 126 mg/dL), subjects without a previous diagnosis of diabetes made by a healthcare professional, and subjects who were taking insulin or oral antidiabetic agents [3]. Impaired fasting glucose was defined as an FPG of 100–125 mg/dL with above-constraint satisfaction. Subjects were classified into two categories in the model architecture. The primary dependent group was UDG, and NG and IFG were combined into a comparison group.

2.2. Analysis Methods

Descriptive analysis was conducted for study groups (NG, IFG, and UDG) to compare their basic characteristics, as shown in Table 1 [26]. A logistic regression model was used to analyze potential correlations between variables and select candidate attributes for the generation of a deep neural network model in Table 2. All reported p-values are two-sided, and significance was set as a p-value of < 0.05.
Logistic regression (LR) can be used to discover a linear relationship between independent variables X and a binary dependent variable Y [27,28]. LR transforms log-odds to probability using the logistic function. The maximum likelihood is used to estimate regression coefficients. At each data point we have interpreter x and binary dependent variable y, and the probability of dependent variables is either p (x) (if y = 1) or 1−p (x) (if y = 0). In model generation, we used L2 regularization based on the scikit-learn package.
Various conventional machine learning algorithms were employed for a comparison of performance with a deep learning model such as LR, k-nearest neighbor algorithms (KNNs) [29,30], support vector machine (SVM) [31], AdaBoost (AB) [32], gaussian naïve Bayes (GNB) [33], and random forest (RF) [34].
In this work, we focus on developing deep neural networks [31] due to its efficiency in deep representation learning. Each layer includes a given number of nodes with the activation function linked by weights in neighbor layers. We used a grid search algorithm to find optimal hyperparameters including a number of layers, hidden nodes, learning rate, batch size, and epoch number. Therefore, we applied Adam’s [35] optimization algorithm, which is considered one of the best results and is faster than others [28,36]. To avoid overfitting, we used a dropout regularization technique that can avoid learning spurious features at hidden nodes. It has been shown that this method can provide a significant improvement in the generalization performance of the artificial neural network model, and that it is computationally cheap [31].
Area under curve (AUC) is suitable for performance evaluation in unbalanced clinical data. In conjunction with the Neyman–Pearson method, AUC has long been used in signal detection theory [37]. AUC was used to verify the DLM performance in the present study.

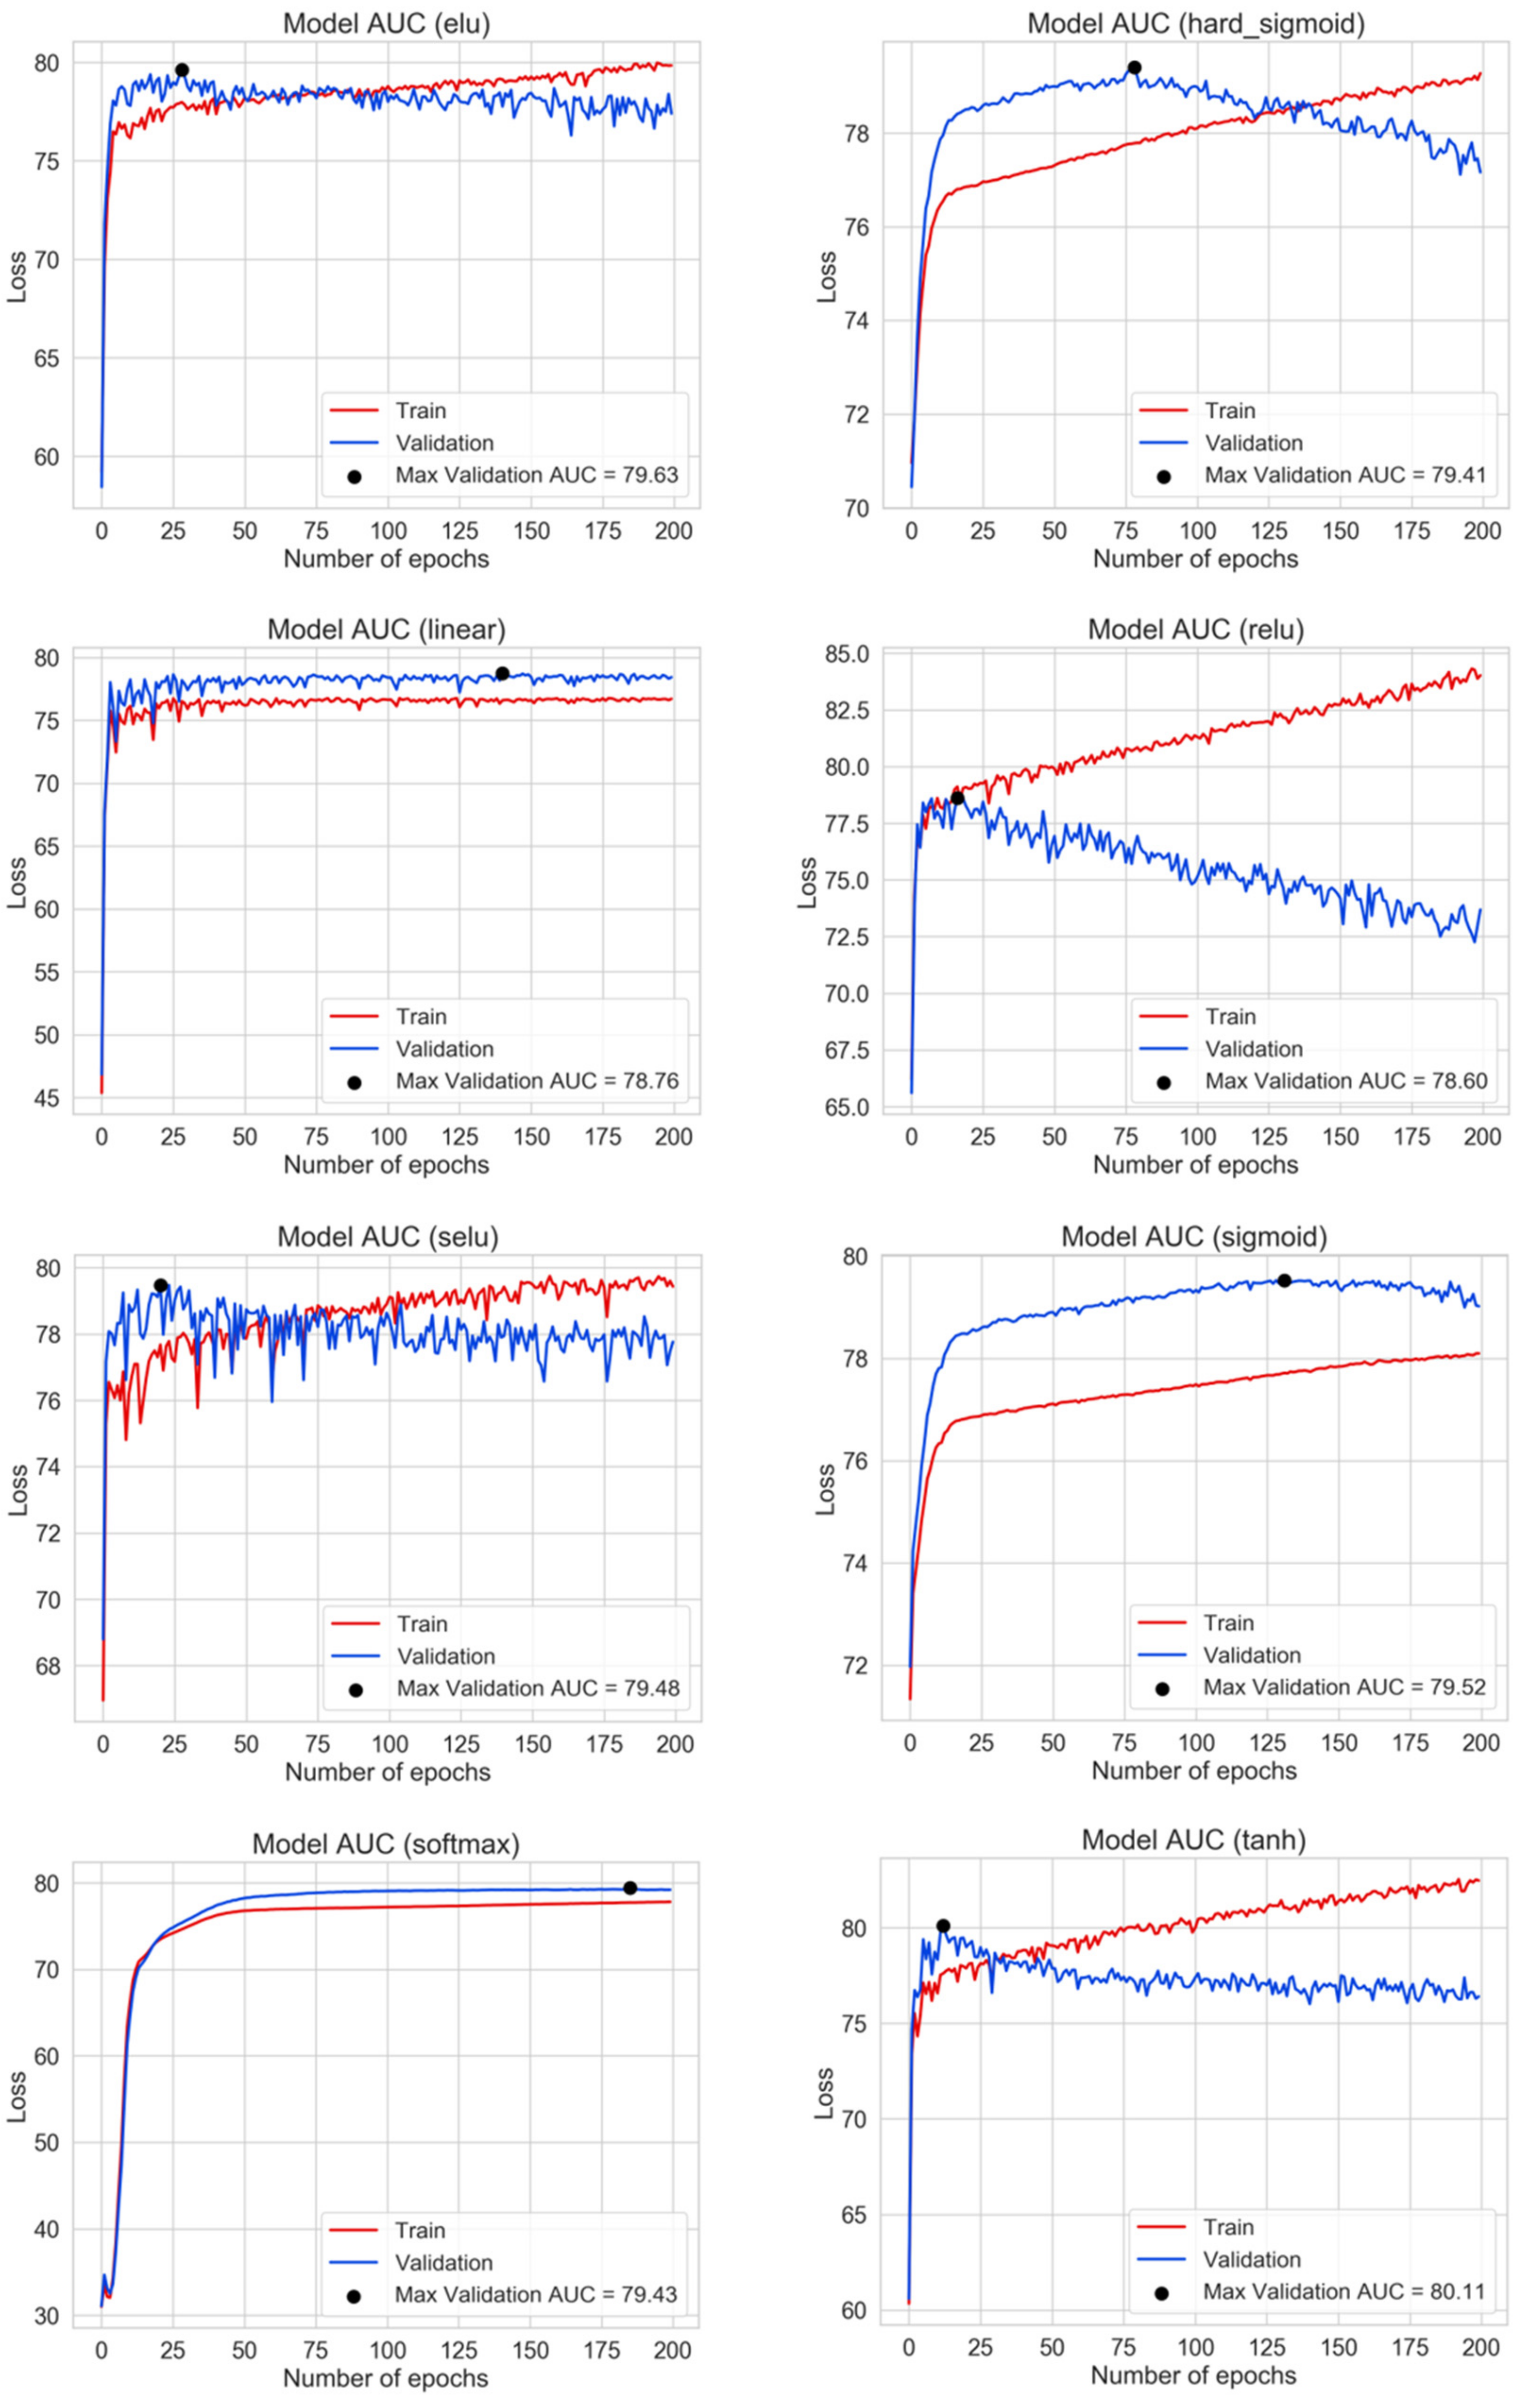
3. Experimental Results

Comparison of Basic Characteristics among NG, IFG, and UDG

The basic characteristics of each group are shown in Table 1. In the development dataset, the IFG and UDG contained more old, male participants than the NG. Also, the IFG and UDG participants had higher systolic blood pressure (SBP), diastolic blood pressure (DBP), weight, body mass index (BMI), waist circumference (WC), fasting plasma glucose (FPG), total cholesterol (TC), and triglycerides (TGs). Family history of diabetes (FHD), smoke, and hypertension were more frequent in the UDG and IFG groups than in the NG group. High-density lipoprotein (HDL) levels were lower in the IFG and UDG than in the NG. Of these variables, seven NIVs (year, WC, BMI, gender, smoking status, hypertension, and family history of diabetes) were selected as candidate variables for learning.
Results of the bivariate analysis for evaluating the deep learning method are summarized in Table 2. Age in year (odd ratio (OR): 1.03, 95% confidence interval (CI): 1.03–1.04, P = 0.01), WC (OR: 1.08, 95% CI: 1.07–1.09, P = 0.01), BMI (OR: 1.18, 95% CI: 1.15~1.22, P = 0.01), male gender (OR: 1.74, 95% CI: 1.41–2.15, P = 0.01), smoking status (OR: 1.77, 95% CI: 1.44~2.19, P = 0.01), hypertension (OR: 2.77, 95% CI: 2.23~3.47, P = 0.01), and family history of diabetes (OR: 2.05, 95% CI: 1.64–2.57, P = 0.01) had significant effects on UDG. They were selected to build machine learning models.

4. Discussion

In the present study, we developed various screening models for undiagnosed diabetes and compared our models with each other as well as with models from other studies. The DLM had a higher AUC than any other model. Previous studies have predicted undiagnosed diabetes patients using various screening models, resulting in adequate goodness of fit and AUC [3,8,9,10,11,12]. Zhou et al. established a simple and effective risk score for type 2 diabetes mellitus in middle-aged rural Chinese [8]. Aekplakorn et al. developed a risk score model for predicting diabetes in the Thai population that does not require laboratory tests [9]. Nanri et al. generated a simple risk model based on a non-invasive and an invasive model for type 2 diabetes [10]. Gao et al. constructed a diabetes risk score for screening undiagnosed diabetes in Chinese adults and compared fasting capillary blood glucose (FCG) and glycated hemoglobinA1c (HbA1c) [11]. Baan et al. developed a predictive model to identify individuals with an increased risk of undiagnosed based on the Rotterdam Study [12]. Lee et al. proposed a self-assessment score for diabetes risk based on the Korea National Health and Nutrition Examination Survey (KNHANES) 2001–2005 that showed good discrimination in comparison with non-Asian models [13].
Our data included fewer subjects than the data used in previous studies, and were collected only from Korean citizens. Nevertheless, our study focused on developing a deep neural network model to improve screening performance. Several previous studies have developed predictive models using machine learning algorithms. Mercaldo et al. analyzed the performance of machine learning algorithms that can classify diabetes patients using Pima Indians diabetes data from a UCI (University of California Irvine) machine repository standard dataset [22]. The architecture of a deep artificial neural network was proposed that would use 19 clinical features to automatically determine the health statuses of patients [23]. Soltani et al. developed a diagnostic model for type 2 diabetes based on an artificial neural network using the Pima Indians dataset [24]. The primary goal of such studies was to predict diabetes status of subjects that are not identified. Furthermore, invasive variables are unsuitable for universal application, and can cause a financial burden to some people or countries. Thus, the development of disease prediction or screening models should be user-centric. Pei et al. developed a diabetes prediction model using non-invasive variables based on machine learning algorithms (decision tree, AdaBoost, support vector machine, Bayesian network, naïve Bayesian) that showed an appropriate performance [38].
The DLM included seven NIVs (age, male gender, hypertension, family history of diabetes, smoking status, BMI, and waist circumference) that would be convenient for a layperson to use as a self-assessment of diabetes risk in the real world. These variables are highly correlated with undiagnosed diabetes in other studies [38,39,40,41,42,43,44,45]. Although blood analysis (including FPG and oral glucose tolerance test) are required to diagnose at-risk individuals based on the guidelines, our model can provide users with an estimation of their diabetes status without a medical diagnosis. In addition, our model allows people to carry out self-screening in terms of diabetes. It can provide services for recommending schedule arrangements with health care practitioners to people at high risk.
In the DLM building step we used variables such as age, BMI, and waist circumference with continuous measurements. However, we did not convert them into categorical values. Previous studies have applied a discretization approach that shows easily understandable information for screening diabetes risk. However, distinguished data by intervals may have biased information in the learning step. Our model insists on optimization based on hyper-parameters to prevent overfitting problems and improve model performance. Therefore, we compared and analyzed hyper-parameters for the DLM with values in the validation dataset. By comparing the results of epoch numbers with different activation functions, tanh carries out the best performance (Figure 3). Minimal validation loss for the DLM was 0.13 (Figure 4). The hyper-parameter for the best DLM was built with the following options: epoch number 50, batch size 32, two hidden layers with 100 neurons each, a tanh activation function, and 0.1 drop out in the network topology.
The performance of our deep learning model was evaluated and resulted in a higher AUC than any other model from previous studies. We compared the performance-based AUC for machine learning algorithms LR, KNN, SVM, AdaBoost, GNB, and the DLM. The results showed that the DLM (AUC: 80.11) performed better than any other model in the validation dataset when screening for undiagnosed diabetes, including LR (ACU: 78.55), KNN (AUC: 77.05), SVM (AUC: 78.22), RF (79.05), AB (AUC: 78.32), and GNB (AUC: 78.47), as shown in Figure 5. In addition, the DLM was compared with previous screening models and the DLM (AUC: 80.11) had higher discrimination performance than the models of Baan et al. (AUC: 67.50), Nanri et al. (AUC: 74.69), Zhou et al. (AUC: 75.56), Aekplakorn et al. (AUC: 75.33), Gao et al. (AUC: 74.12), and Lee et al. (AUC: 74.14), as shown in Table 3.
Our model was evaluated to guarantee reliability based on the validation dataset (KNHANES 2016) assembled at a different time than the development dataset (KNHANES 2013~2015). First, we were able to evaluate machine learning algorithms in order to prove the highest effectiveness of performance by the DLM, as shown in Figure 5. Second, the DLM was compared with previous screen models. As a result, our DLM showed good performance in screening undiagnosed diabetes, as shown in Table 3. Through this experiment, we demonstrated the effectiveness and usefulness of the DLM model for patients with undiagnosed diabetes.

5. Conclusions

Undiagnosed diabetes is continuously increasing due to a lack of specific symptoms and limited financial resources in the public health care system. To overcome this problem, previous studies have proposed screening models for undiagnosed patients. However, to date, there has been insufficient research regarding the identification of undiagnosed diabetes based on the deep neural network. Therefore, our study proposed a deep learning model for patients with undiagnosed diabetes that could contribute to self-assessment. Our model could help decrease the financial burden on the national health care system, and future work should be implemented using different populations for its validation.

Author Contributions

Conceptualization, K.S.R. and H.S.C.; methodology, K.S.R. and E.B.; software, K.S.R. and E.B.; validation, J.W.L., K.S.C. and H.S.C.; investigation, K.S.R.; data curation, K.S.R.; writing—original draft preparation K.S.R. and H.S.C.; writing—review and editing K.S.R., S.W.L., J.W.L., K.S.C. and H.S.C.; visualization K.S.R. and E.B.; supervision, H.S.C.; funding acquisition, K.S.C. All authors have read and agreed to the published version of the manuscript.

Funding

This study was supported by a Grant-in-Aid for Cancer Research and Control from the National Cancer Center of Korea (1810871-2) and (2010010-1).

Conflicts of Interest

The authors declare no conflicts of interest.

Data and DLM Sharing Statement

The dataset and DLM used and analyzed during the current study are available from the corresponding authors upon reasonable request.

References

  1. World Health Organization. Global Report on Diabetes 2016; World Health Organization. Available online: https://apps.who.int/iris/handle/10665/204871 (accessed on 5 January 2020).
  2. World Health Organization. Classification of Diabetes Mellitus 2019; World Health Organization. Available online: https://apps.who.int/iris/handle/10665/325182 (accessed on 5 January 2020).
  3. Lee, Y.H.; Bang, H.; Kim, H.C.; Kim, H.M.; Park, S.W.; Kim, D.J. A simple screening score for diabetes for the Korean population: Development, validation, and comparison with other scores. Diabetes Care 2012, 35, 1723–1730. [Google Scholar] [CrossRef] [Green Version]
  4. Colagiuri, S.; Cull, C.A.; Holman, R.R.; UKPDS Group. Are lower fasting plasma glucose levels at diagnosis of type 2 diabetes associated with improved outcomes?: U.K. prospective diabetes study 61. Diabetes Care 2002, 25, 1410–1417. [Google Scholar] [CrossRef] [Green Version]
  5. Chung, S.; Azar, K.M.; Baek, M.; Lauderdale, D.S.; Palaniappan, L.P. Reconsidering the age thresholds for type II diabetes screening in the U.S. Am. J. Prev. Med. 2014, 47, 375–381. [Google Scholar] [CrossRef] [Green Version]
  6. Pippitt, K.; Li, M.; Gurgle, H.E. Diabetes Mellitus: Screening and Diagnosis. Am. Fam. Physician 2016, 93, 103–109. [Google Scholar]
  7. Kim, M.J.; Lim, N.K.; Choi, S.J.; Park, H.Y. Hypertension is an independent risk factor for type 2 diabetes: The Korean genome and epidemiology study. Hypertens Res. 2015, 38, 783–789. [Google Scholar] [CrossRef] [PubMed]
  8. Zhou, H.; Li, Y.; Liu, X.; Xu, F.; Li, L.; Yang, K.; Qian, X.; Liu, R.; Bie, R.; Wang, C. Development and evaluation of a risk score for type 2 diabetes mellitus among middle-aged Chinese rural population based on the RuralDiab Study. Sci. Rep. 2017, 7, 42685. [Google Scholar] [CrossRef] [PubMed] [Green Version]
  9. Aekplakorn, W.; Bunnag, P.; Woodward, M.; Sritara, P.; Cheepudomwit, S.; Yamwong, S.; Yipintsoi, T.; Rajatanavin, R. A risk score for predicting incident diabetes in the Thai population. Diabetes. Diabetes Care 2006, 29, 1872–1877. [Google Scholar] [CrossRef] [PubMed] [Green Version]
  10. Nanri, A.; Nakagawa, T.; Kuwahara, K.; Yamamoto, S.; Honda, T.; Okazaki, H.; Uehara, A.; Yamamoto, M.; Miyamoto, T.; Kochi, T.; et al. Development of Risk Score for Predicting 3-Year Incidence of Type 2 Diabetes: Japan Epidemiology Collaboration on Occupational Health Study. PLoS ONE 2015, 10, e0142779. [Google Scholar] [CrossRef]
  11. Gao, W.G.; Dong, Y.H.; Pang, Z.C.; Nan, H.R.; Wang, S.J.; Ren, J.; Zhang, L.; Tuomilehto, J.; Qiao, Q. A simple Chinese risk score for undiagnosed diabetes. Diabet. Med. 2010, 27, 274–281. [Google Scholar] [CrossRef]
  12. Baan, C.A.; Ruige, J.B.; Stolk, R.P.; Witteman, J.C.; Dekker, J.M.; Heine, R.J.; Feskens, E.J. Performance of a predictive model to identify undiagnosed diabetes in a health care setting. Diabetes Care 1999, 22, 213–219. [Google Scholar] [CrossRef] [Green Version]
  13. Hussain, A.; Claussen, B.; Ramachandran, A.; Williams, R. Prevention of type 2 diabetes: A review. Diabetes Res. Clin. Pract. 2007, 76, 317–326. [Google Scholar] [CrossRef] [PubMed]
  14. Chen, M.; Yang, J.; Zhou, J.; Hao, Y.; Zhang, J.; Youn, C.H. 5G-Smart Diabetes: Toward Personalized Diabetes Diagnosis with Healthcare Big Data Clouds. IEEE Commun. Mag. 2018, 57, 16–23. [Google Scholar] [CrossRef]
  15. Choi, E.; Schuetz, A.; Stewart, W.F.; Sun, J. Using recurrent neural network models for early detection of heart failure onset. J. Am. Med. Inform. Assoc. 2017, 23, 361–370. [Google Scholar] [CrossRef] [PubMed]
  16. Anthimopoulos, M.; Christodoulidis, S.; Ebner, L.; Christe, A.; Mougiakakou, S. Lung Pattern Classification for Interstitial Lung Diseases Using a Deep Convolutional Neural Network. IEEE Trans. Med. Imaging 2016, 35, 1207–1216. [Google Scholar] [CrossRef] [PubMed]
  17. Li, H.; Huang, Z.; Fu, J.; Li, Y.; Zeng, N.; Zhang, J.; Ye, C.; Jin, L. Modified Weights-and-Structure-Determination Neural Network for Pattern Classification of Flatfoot. IEEE Access 2019, 7, 63146–63154. [Google Scholar] [CrossRef]
  18. Gulshan, V.; Peng, L.; Coram, M.; Stumpe, M.C.; Wu, D.; Narayanaswamy, A.; Venugopalan, S.; Widner, K.; Madams, T.; Cuadros, J.; et al. Development and Validation of a Deep Learning Algorithm for Detection of Diabetic Retinopathy in Retinal Fundus Photographs. JAMA 2016, 316, 2402–2410. [Google Scholar] [CrossRef]
  19. Esteva, A.; Kuprel, B.; Novoa, R.A.; Ko, J.; Swetter, S.M.; Blau, H.M.; Thrun, S. Dermatologist-level classification of skin cancer with deep neural networks. Nature 2017, 542, 115–118. [Google Scholar] [CrossRef]
  20. Xiao, J.; Ding, R.; Xu, X.; Guan, H.; Feng, X.; Sun, T.; Zhu, S.; Ye, Z. Comparison and development of machine learning tools in the prediction of chronic kidney disease progression. J. Transl. Med. 2019, 17, 119. [Google Scholar] [CrossRef] [Green Version]
  21. LeCun, Y.; Bengio, Y.; Hinton, G. Deep learning. Nature 2015, 521, 436–444. [Google Scholar] [CrossRef]
  22. Mercaldo, F.; Nardone, V.; Santone, A. Diabetes mellitus affected patients classification and diagnosis through machine learning techniques. Procedia Comput. Sci. 2017, 112, 2519–2528. [Google Scholar] [CrossRef]
  23. Alcalá-Rmz, V.; Zanella-Calzada, L.A.; Galván-Tejada, C.E.; García-Hernández, A.; Cruz, M.; Valladares-Salgado, A.; Galván-Tejada, J.I. Identification of Diabetic Patients through Clinical and Para-Clinical Features in Mexico: An Approach Using Deep Neural Networks. Int. J. Environ. Res. Public Health 2019, 16, 381. [Google Scholar] [CrossRef] [PubMed] [Green Version]
  24. Soltani, Z.; Jafarian, A. A New Artificial Neural Networks Approach for Diagnosing Diabetes Disease Type II. Int. J. Adv. Comput. Sci. Appl. 2016, 7, 89–94. [Google Scholar] [CrossRef] [Green Version]
  25. Kweon, S.; Kim, Y.; Jang, M.J.; Kim, Y.; Kim, K.; Choi, S.; Chun, C. Data resource profile: The Korea National Health and Nutrition Examination Survey (KNHANES). Int. J. Epidemiol. 2014, 43, 69–77. [Google Scholar] [CrossRef] [PubMed] [Green Version]
  26. Ryu, K.S.; Bae, J.W.; Jeong, M.H.; Cho, M.C.; Ryu, K.H. Risk Scoring System for Prognosis Estimation of Multivessel Disease Among Patients with ST-Segment Elevation Myocardial Infarction. Int. Heart J. 2019, 60, 708–714. [Google Scholar] [CrossRef] [PubMed] [Green Version]
  27. Cox, D.R. The Regression Analysis of Binary Sequences. J. R. Stat. Soc. Ser. B 1958, 20, 215–232. [Google Scholar] [CrossRef]
  28. Munkhdalai, L.; Munkhdalai, T.; Namsrai, O.E.; Lee, J.Y.; Ryu, K.H. An Empirical Comparison of Machine-Learning Methods on Back Client Credit Assessments. Sustainability 2018, 11, 699. [Google Scholar] [CrossRef] [Green Version]
  29. Dreiseitl, S.; Ohno-Machado, L. Logistic regression and artificial neural network classification models: A methodology review. J. Biomed. Inform. 2002, 35, 352–359. [Google Scholar] [CrossRef] [Green Version]
  30. Altman, N.S. An Introduction to Kernel and Nearest-Neighbor Nonparametric Regression. Am. Stat. 1992, 46, 175–185. [Google Scholar]
  31. Tan, P.N.; Steinbach, M.; Kumar, V.; Karpatne, A. Introduction to Data Mining, 2nd ed.; Pearson Education: London, UK, 2018; pp. 262–295. [Google Scholar]
  32. Viola, P.; JONES, M.J. Robust Real-Time Face Detection. Int. J. Comput. Vis. 2004, 57, 137–154. [Google Scholar] [CrossRef]
  33. Liaw, A.; Wiener, M. Classification and regression by randomForest. R News 2002, 2, 18–22. [Google Scholar]
  34. Griffis, J.C.; Allendorfer, J.B.; Szaflarski, J.P. Voxel-based Gaussian naïve Bayes classification of ischemic stroke lesions in individual T1-weighted MRI scans. J. Neurosci. Methods 2016, 257, 97–108. [Google Scholar] [CrossRef] [PubMed] [Green Version]
  35. Kingma, D.P.; Ba, J.L. ADAM: A Method for Stochastic Optimization. arXiv 2014, arXiv:1412.6980. [Google Scholar]
  36. Ruder, S. An Overview of Gradient Descent Optimization Algorithms. arXiv 2016, arXiv:1609.04747. [Google Scholar]
  37. Bradley, A.P. The use of the area under the ROC curve in the evaluation of machine learning algorithms. Pattern Recognit. 1997, 30, 1145–1159. [Google Scholar] [CrossRef] [Green Version]
  38. Pei, D.; Gong, H.; Zhang, C.; Guo, Q. Accurate and rapid screening model for potential diabetes mellitus. BMC Med Inform. Decis. Mak. 2019, 19, 41. [Google Scholar] [CrossRef] [Green Version]
  39. Makrilakis, K.; Liatis, S.; Grammatikou, S.; Perrea, D.; Stathi, C.; Tsiligros, P.; Katsilambros, N. Validation of the Finnish diabetes risk score (FINDRISC) questionnaire for screening for undiagnosed type 2 diabetes, dysglycaemia and the metabolic syndrome in Greece. Diabetes Metab. 2011, 37, 144–151. [Google Scholar] [CrossRef]
  40. Lindström, J.; Tuomilehto, J. The diabetes risk score: A practical tool to predict type 2 diabetes risk. Diabetes Care 2003, 26, 725–731. [Google Scholar] [CrossRef] [Green Version]
  41. Rathmann, W.; Martin, S.; Haastert, B.; Icks, A.; Holle, R.; Löwel, H.; Giani, G.; KORA Study Group. Performance of screening questionnaires and risk scores for undiagnosed diabetes: The KORA Survey 2000. Arch. Intern. Med. 2005, 165, 436–441. [Google Scholar] [CrossRef] [Green Version]
  42. Bang, H.; Edwards, A.M.; Bomback, A.S.; Ballantyne, C.M.; Brillon, D.; Callahan, M.A.; Teutsch, S.M.; Mushlin, A.I.; Kern, L.M. Development and validation of a patient self-assessment score for diabetes risk. Ann. Intern. Med. 2009, 151, 775–783. [Google Scholar] [CrossRef]
  43. Al-Lawati, J.A.; Tuomilehto, J. Diabetes risk score in Oman: A tool to identify prevalent type 2 diabetes among Arabs of the Middle East. Diabetes Res. Clin. Pract. 2007, 77, 438–444. [Google Scholar] [CrossRef]
  44. Witte, D.R.; Shipley, M.J.; Marmot, M.G.; Brunner, E.J. Performance of existing risk scores in screening for undiagnosed diabetes: An external validation study. Diabet. Med. 2010, 27, 46–53. [Google Scholar] [CrossRef] [PubMed]
  45. Leiter, L.A.; Barr, A.; Bélanger, A.; Lubin, S.; Ross, S.A.; Tildesley, H.D.; Fontaine, N. Diabetes Screening in Canada (DIASCAN) Study: Prevalence of undiagnosed diabetes and glucose intolerance in family physician offices. Diabetes Care 2001, 24, 1038–1043. [Google Scholar] [CrossRef] [PubMed] [Green Version]
Figure 1. Research framework of the DLM (deep learning model) for patients with undiagnosed diabetes. NIV: non-invasive variables; UDG: undiagnosed diabetes group; KNHANES: korean national health and nutrition examination survey.
Applsci 10 00421 g001
Figure 2. Flow chart for selecting the study population.
Applsci 10 00421 g002
Figure 3. Comparison of area under curve (AUC) according to various activation functions.
Applsci 10 00421 g003
Figure 4. Comparison of model loss according to activation functions.
Applsci 10 00421 g004
Figure 5. Comparison of AUC results among the DLM and other machine learning algorithms.
Applsci 10 00421 g005
Table 1. Basic characteristics of participants for the development and validation dataset.
VariablesDevelopment Dataset
n = 11456
Validation Dataset
n = 4444
NG
n = 8311
IFG
b = 2781
UDG
n = 364
NG
n = 3115
IFG
b = 1182
UDG
n = 147
Age (year)45.6 ± 15.554.0 ± 13.355.6 ± 12.445.7 ± 15.853.9 ± 14.255.5 ± 13.5
Male (%)37.752.855.237.552.755.8
Height (cm)162.9 ± 9.0163.6 ± 9.2163.3 ± 9.7163.2 ± 9.1163.8 ± 9.3163.5 ± 9.1
Weight (kg)61.6 ± 11.466.9 ± 12.269.4 ± 13.562.1 ± 11.767.5 ± 12.771.5 ± 14.1
SBP (mmHg)114.3 ± 15.8122.2 ± 16.2124.3 ± 15.6114.9 ± 15.2123.0 ± 16.0128.0 ± 17.8
DBP (mmHg)74.1 ± 9.977.7 ± 10.578.8 ± 10.674.5 ± 9.478.3 ± 10.379.7 ± 11.9
Hypertension (%)12.226.334.113.928.039.5
BMI (kg/m2)23.1 ± 3.224.9 ± 3.425.9 ± 3.923.2 ± 3.325.0 ± 3.426.6 ± 4.1
WC (cm)78.9 ± 9.485.1 ± 9.288.2 ± 9.780.2 ± 9.686.0 ± 9.390.5 ± 9.6
FHD (%)18.322.433.021.526.136.1
Father (%)8.17.711.810.610.911.6
Mother (%)8.810.816.89.712.615.7
Sibling (%)3.97.612.44.67.613.6
Smoker (%)35.046.551.934.148.247.6
FPG (mg/dL)89.9 ± 5.8107.0 ± 6.3153.3 ± 37.090.0 ± 5.9107.1 ± 6.4156.8 ± 43.4
TC (mg/dL)187.7 ± 34.0195.4 ± 34.8206.6 ± 37.8193.1 ± 34.6200.4 ± 37.9208.2 ± 24.3
TG (mg/dL)118.0 ± 89.2159.1 ± 121.0216.8 ± 103.8120.7± 97.3166.7 ± 150.1204.4 ± 140.0
HDL (mg/dL)53.0 ± 12.248.8 ± 11.446.7 ± 11.253.4 ± 13.349.1±12.246.5 ± 11.0
Data are expressed as the number of patients (percentage) or mean ± SD. NG, normal group; IFG, impaired fasting group; UDG, undiagnosed diabetes group; SBP, systolic blood pressure; DBP, diastolic blood pressure; BMI, body mass index; WC, waist circumference; FPG, fasting plasma glucose; TC, total cholesterol; TG, triglycer.
Table 2. Bivariate analysis of the deep learning model (DLM) performance evaluation.
VariablesBOdd ration (95% CI)P value
Age0.341.03 (1.03~1.04)<0.01
Male gender0.551.74 (1.41~2.15)<0.01
Hypertension1.022.77 (2.22~3.47)<0.01
BMI0.171.18 (1.15~1.22)<0.01
WC0.071.08 (1.07~1.09)<0.01
FHD0.722.05 (1.64~2.57)<0.01
Smoke0.571.77 (1.44~2.19)<0.01
Data are expressed as odds ratio between variables. BMI, body mass index; WC, waist circumference; FHD, family history of diabetes.
Table 3. Performance evaluation for the DLM compared with other screening models.
ModelNIVs (non-invasive variables)AUC
Undiagnosed screening
Our DLMGender, age, hypertension, family history of diabetes, smoking status, BMI, waist circumference80.11
Lee et al. [3]Age, family history of diabetes, hypertension, waist circumference, smoking status, alcohol intake (drinks/day)74.12
Baan et al. [12]Age, male, anti-hypertension medication, BMI67.50
Gao et al. [11]Age, waist circumference, diabetes in parents and or sibling74.11
Onset of type 2 diabetes
Nanri et al. [10]Male, age, BMI, waist circumference, smoking status, hypertension74.69
Zhou et al. [8]Male, age, family history of diabetes, waist circumference, dyslipidemia, diastolic blood pressure, BMI75.56
Aekplakorn et al. [9]Age, sex, BMI, waist circumference, hypertension, history of diabetes in parent or sibling75.33

