Article

A Bio-Inspired Flapping Wing Rotor of Variant Frequency Driven by Ultrasonic Motor

1
College of Aerospace Engineering, Nanjing University of Aeronautics and Astronautics, Nanjing 210016, China
2
Key Laboratory of Complex Systems and Intelligent Computing, School of Mathematics and Statistics, Qiannan Normal University for Nationalities, Duyun 558000, China
3
School of Aerospace, Transport and Manufacturing, Cranfield University, Cranfield MK43 0AL, UK
*
Authors to whom correspondence should be addressed.
Appl. Sci. 2020, 10(1), 412; https://doi.org/10.3390/app10010412
Submission received: 20 November 2019 / Revised: 17 December 2019 / Accepted: 3 January 2020 / Published: 6 January 2020

Abstract

:
By combining the flapping and rotary motion, a bio-inspired flapping wing rotor (FWR) is a unique kinematics of motion. It can produce a significantly greater aerodynamic lift and efficiency than mimicking the insect wings in a vertical take-off and landing (VTOL). To produce the same lift, the FWR’s flapping frequency, twist angle, and self-propelling rotational speed is significantly smaller than the insect-like flapping wings and rotors. Like its opponents, however, the effect of variant flapping frequency (VFF) of a FWR, during a flapping cycle on its aerodynamic characteristics and efficiency, remains to be evaluated. A FWR model is built to carry out experimental work. To be able to vary the flapping frequency rapidly during a stroke, an ultrasonic motor (USM) is used to drive the FWR. Experiment and numerical simulation using computational fluid dynamics (CFD) are performed in a VFF range versus the usual constant flapping frequency (CFF) cases. The measured lifting forces agree very well with the CFD results. Flapping frequency in an up-stroke is smaller than a down-stroke, and the negative lift and inertia forces can be reduced significantly. The average lift of the FWR where the motion in VFF is greater than the CFF, in the same input motor power or equivalent flapping frequency. In other words, the required power for a VFF case to produce a specified lift is less than a CFF case. For this FWR model, the optimal installation angle of the wings for high lift and efficiency is found to be 30° and the Strouhal number of the VFF cases is between 0.3–0.36.

1. Introduction

Since the research initiation of the micro aerial vehicle (MAV) from the defense advanced research projects agency (DARPA) program [1], increasing attention has been paid to the design of bio-inspired flapping wing MAV, and in particular, the study of aerodynamics [2,3,4]. Phan et al. [5] designed a stable 21 g insect-like tailless flapping wing micro air vehicle (FWMAV) with proportion-differentiation (PD) feedback control. By undertaking several flight tests, they demonstrated that the tailless FWMAV could perform a vertical climb, then hover and loiter, within a 0.3 m ground radius, with small variations in pitch and roll body angles. Hsiao et al. [6] developed an ultra-light FWMAV named Golden Snitch with only 8 g weight and 20 cm wingspan. By mounting a commercial infrared (IR) transmission module on the vehicle, they realized that altitude control of the FWMAV by a modified proportional feedback algorithm. The validity of their approach is demonstrated in both numerical simulations and flight tests. Arabagi et al. [7] designed a scalable, controllable, miniature flapping wing robot. They manufactured a working prototype and conducted FEM analysis for their airframe design to ensure its strength. A scaling law, based on momentum theory, was proposed to predict the lift/weight ratio versus the flapping wing robot’s size. Ansari et al. [8] proposed a nonlinear unsteady aerodynamic model for insect-like flapping wings, based on potential flow theory, and validated their model against existing experimental data. Very good agreement is found in flow field representation and force prediction in the experiments. Ansari et al. [9] also conducted experimental measurements for a flapping wing flight, ranging from R e = 500 to 15,000. They studied the behaviour of the leading-edge vortex based on these Reynolds numbers and verified the presence of Kelvin-Helmholtz instability, observed at a higher Reynolds number in computational fluid dynamics calculations.
Regarding the MAV power, the electric motor is the most commonly used actuation source for bio-inspired flapping-wing MAV (FWMAVs). However, constrained by the rotational inertial force, the change rate of the electric motor’s rotation speed is limited and power-consuming. Guo and Huang developed a piezoelectric actuator and multi-bar of flexure hinges to drive flapping-wing and a novel flapping wing rotor (FWR) [10,11,12]. Sreetharan and Wood [13] designed an insect-type flapping wing MAV which utilizes piezoelectric transmission wings with flexure hinges to replace the motorized transmission. Mateti improved the piezoelectric transmission wings by designing and developing a flapping wing MAV, known as LionFly [14,15]. Ma et al. [16] designed and fabricated an 80-milligram, insect-scale, flapping-wing robot, which used a four-bar linkage to amplify the piezoelectric flight muscle’s displacement and generate the wing-flapping motion. The common advantages of these piezoelectric transmissions are that they are small, light mass, simple structure, have superb accuracy, no gears, and low inertial effects. These advantages make piezoelectric transmission suited for nano- to pico-scale unmanned aerial vehicles (UAVs).
Different from mimicking the insect-like wings, a novel flapping wing rotor, with combined rotary and flapping motion, was proposed by the author [17]. The FWR has the advantages of significant higher aerodynamic efficiency and lift coefficient than insect-like wings, in the range of Reynolds number from 2600 to 5000, and ideal Strouhal number around 0.3 [18,19]. In order to evaluate the FWR aerodynamic performance, numerical and experimental studies have been conducted [12,17]. Guo et al. [10] designed a piezoelectric actuated flapping wing rotor model and analyzed the aerodynamic performance of the model with two-dimensional (2-D) CFD numerical simulation. Very good agreement is shown by comparing the experimental and simulation results. Zhou [20] studied the effects of kinematic parameters on average lift force experimentally and found that a proper combination of wing structure, installation angle of the wing, and power input can be beneficial for higher averaged lift force. Chen et al. [21] developed a boring-hole designed flapping wing rotor model. Through the experimental data, they found that there exists a critical angle of attack for a perforated wing to increase its maximize mean lift by 35%.
In order to further understand the FWR flow mechanism of coupled flapping motion and rotary motion, numerical simulations by CFD were performed. Wu et al. [22] analyzed the unsteady aerodynamic behaviour of a FWR by CFD, at a low Reynolds number, and proposed that the lift and rotational moment will increase with the increase in pitching amplitude and Reynolds number. Wang et al. [23] studied a FWR of aspect ratios of five by CFD method and proposed that a higher Reynolds number and mean pitching angle can strength the leading edge vortex and provide a higher lift and thrust. Yang et al. [24] used a charge coupled device (CCD) camera and the SURFER software to capture and fit the three-dimensional (3D) flapping motion of the wing surface. The 3D flapping motion is then sliced into the flapping motion on 2D cross sections before calculating the flapping wing’s lift and drag through 2D quasi-steady CFD. The calculated results show a similar trend with their experiments, which validates their methods. Yang et al. [25] also investigated the three-dimensional (3D) flow fields around a flapping wing with a span of 20 cm through both, COMSOL fluid-structure interaction (FSI) simulation and 3D stereo photography. They obtained similar trends for the numerical and experimental lift force data, and found the simulated stream lines, flowing over the 3D wing, agree well with the experimental smoke traces. Li et al. [26] employed a quasi-steady method to compare the efficiency and lift of the flapping wing, rotary wing, and flapping wing rotor. The rotary wing showed the greatest efficiency, while the flapping wing rotor can obtain both relative high lift and relative high efficiency at the same time.
In the current study, a FWR, driven by an ultrasonic motor, has been designed and manufactured to investigate the effect of flapping frequency variation in down-stroke and up-stroke on the aerodynamic forces. Subsequently, the kinematics of the flapping wing motion is decomposed into the variation of rotary, stroking, and twisting angle, where the elastic deformation of the wing is neglected in the CFD numerical model. The CFD model, which used Fluent software to calculate the lift curves of the FWR, was built and subsequently validated by comparing with previous research results by Wang et al. [23]. The study then focused on the effect of different flapping frequency of the FWR, in down-stroke and up-stroke on the lift, by experiment and CFD simulation. The usual motion of constant flapping frequency (CFF) in a flapping cycle provides a baseline reference for evaluating the effect of variant flapping frequency (VFF) in up-stroke and down-stroke on FWR performance. In addition, the influence of the installation angle of the FWR on the rotational speed and lift is studied.

2. Structure Design and Numerical Method

2.1. Flapping Wing Rotor Model

In this investigation, a FWR model of 50 g weight was designed and built in the configuration illustrated in Figure 1. An ultrasonic motor normally provides higher power density (power-to-volume ratio) and quicker actuation response [27] than an ordinary DC motor/servo motor. Therefore, an in-house ultrasonic motor (USR30) is used to drive the FWR model. The motor mass is 28 g, while the maximum continuous power and torque of the motor is 1.8 W, and 0.1 N∙m, respectively. It is capable of changing the flapping frequency in several milliseconds to study the effect of variant flapping frequency on the FWR’s motion and lift. The components of the FWR model (in green), shown in Figure 1a, was manufactured by 3D printing, and the rod was made of carbon/epoxy composite. The aerodynamic forces, the rotary angle ( ψ ), twisting angle ( θ ), and stroking angle ( φ ) are indicated using arrows. Among the above motions in three degrees of freedom (3-DoF), only the stroking motion is driven by the ultrasonic motor. The twisting is caused by the deformation of the flexible wing spars and the skin made from the 20 μm polyimide film. The flapping wing produces lift and thrust from both wings in axial symmetric configuration. The thrust forms a torque to drive the wings rotation around the shaft. Associated with the rotation, the wings also produce drag that equal the thrust at a specific rotational speed. Two optical sensors, shown in Figure 1b, are mounted on the FWR, in order to measure the flapping frequency for feedback and control of the motor speed during up-stroke and down-stroke.
In order to fulfil the FWR stroking motion, the driving disk was mounted at the centre of the shaft of the ultrasonic motor to provide continuous rotational moment. The assembly of the driving disk, driving bar, and linear rod forms a slider crank mechanism, as shown in Figure 2a. If the small deviation (1 mm), from the mid-bar axis and output shaft axis, is ignored in order to avoid the occurrence of dead-point and the setting of the origin at the top stop point, the stroke position of the mid bar and the stroke angle ( φ ) could be written as per Equations (1) and (2),
Z m i d _ b a r = r ( 1 c o s α ) + 0.25 λ r [ 1 cos ( 2 α ) ]
φ = [ Z m i d _ b a r Z a v g ] / B 1
where α is the crank angle defined in Figure 2, λ denotes the crank-link rod ratio ( r / l ) and Z a v g = 0.5 · ( r + 0.5 r · λ + 0.5 r / λ ) is defined as average value between the maximum Z m i d _ b a r and the minimum Z m i d _ b a r . B 1 means the distance between A and B or A’ and B’, as shown in Figure 2b. The lengths of the two connecting rods ( r and l ) are listed in Table 1.
The wing of rectangle platform was initially installed at 30° on the FWR model through the wing front spar beam. Two symmetric rotation axes (A and A ) are present for the flapping motion as per Figure 2 and Figure 3. As shown in Figure 3, the front spar, chord-wise beam and two reinforced oblique beams of each wing are plotted in black lines. The span-wise and chord-wise length of the wing membrane skin are 205 mm, and 150 mm, respectively.

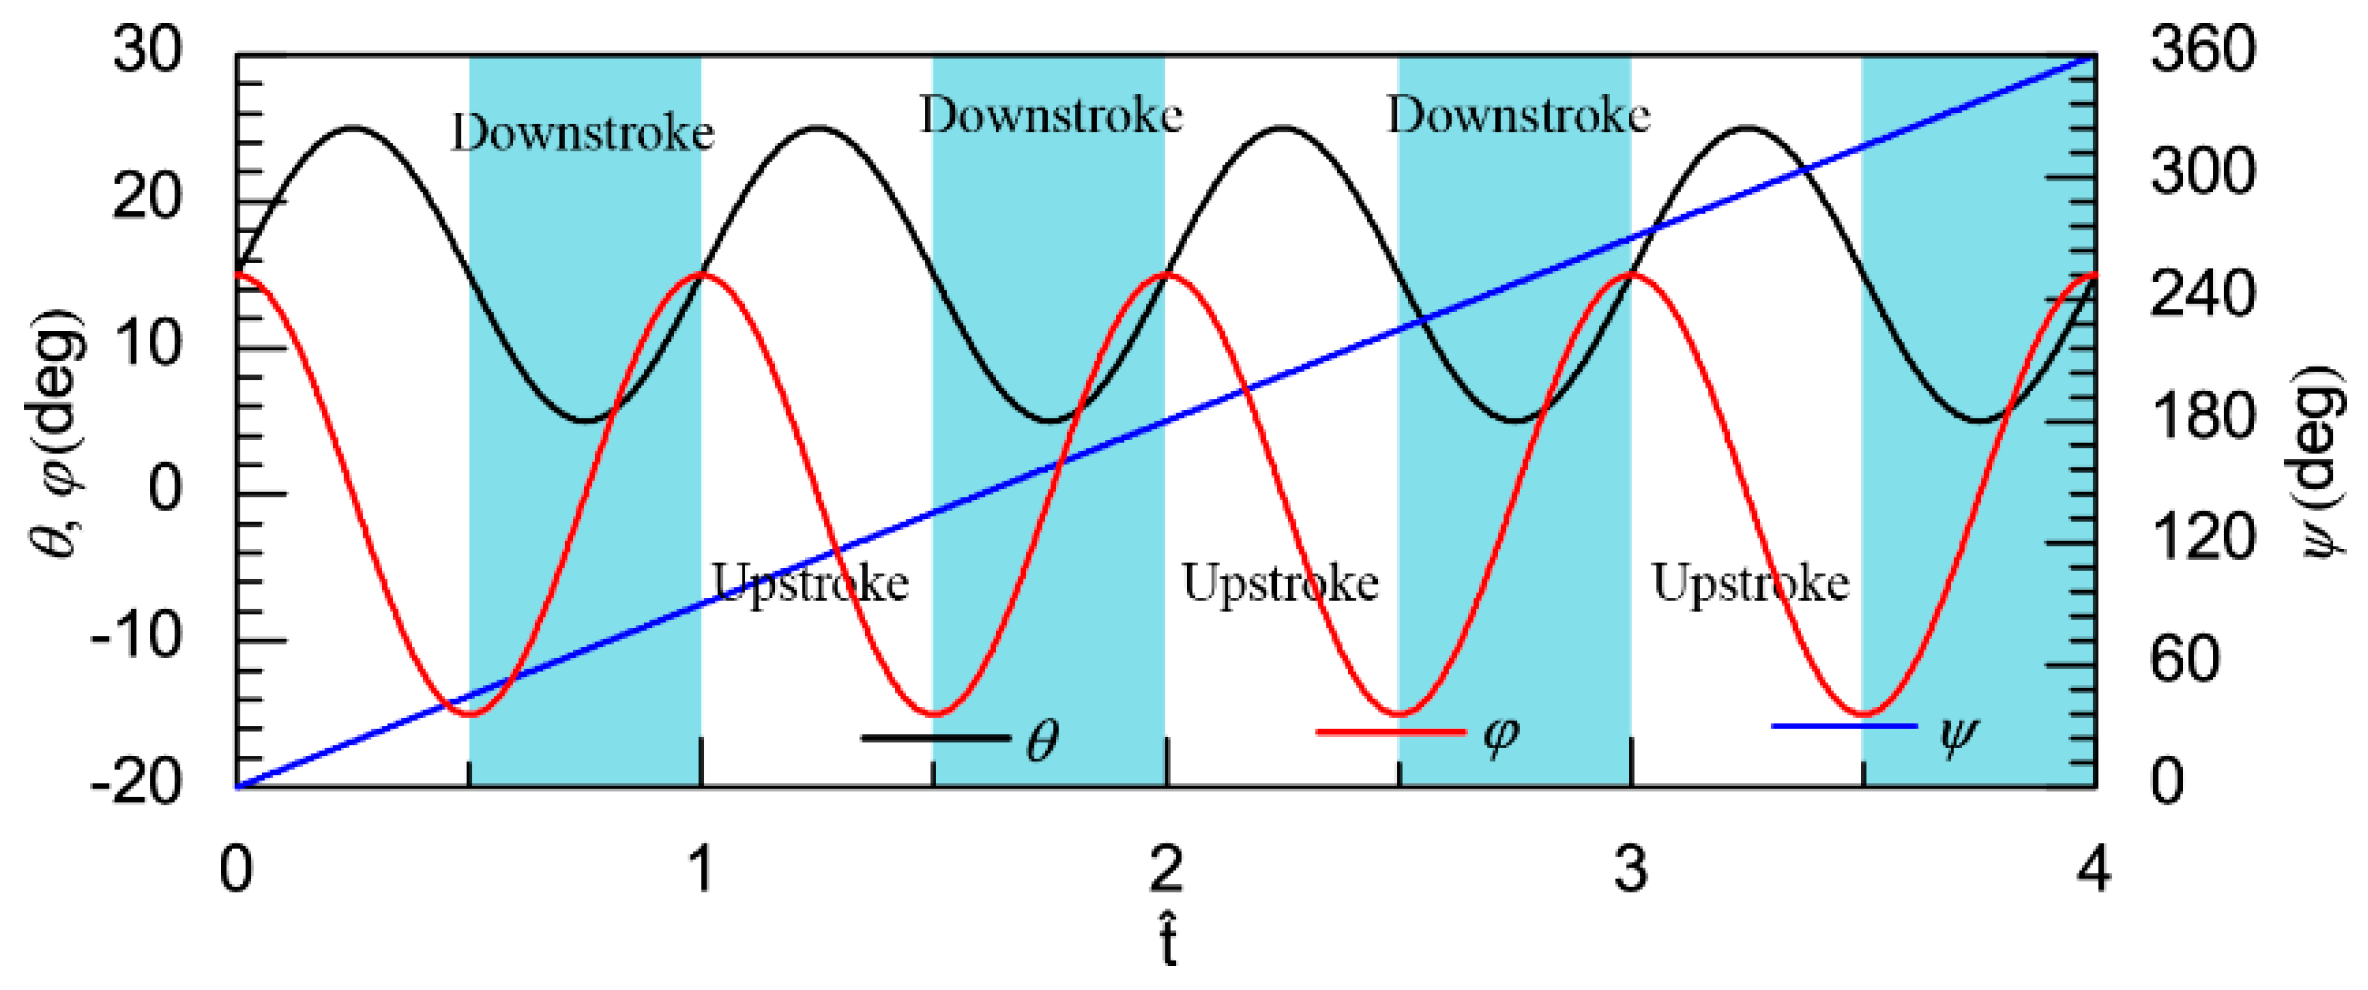
2.2. Kinematics of the Flapping Wing Rotor

The kinematics of the FWR motion can be decomposed into twisting θ, flapping φ, and rotary angle ψ . The function of the flapping motion is determined by the geometric parameters of the flapping wing rotor mechanism, and could be deduced by using Equations (1) and (2), given the flapping frequency. The rotary motion can be assumed as a rotation with constant speed, as in previous studies [22,23], and the flexibility of the wings is not taken into consideration in the CFD model for numerical calculation. Above all, the kinematic parameters, required for the numerical calculation, are the rotational speed ψ ˙ , the flapping frequency during down-stroke ( f d ), and up-stroke ( f u ). As shown in Figure 4, three reflective stickers (denoted as white and green dots) are attached on the flapping wing rotor. A laser velocimeter (DM6230) is applied to measure both, the rotational speed and the flapping frequency. To generate the variant flapping frequencies, such as f d and f u , it is needed to trigger the upper sensor and disable the circuits to trigger the lower sensor before making the motor rotate at f d , and vice versus. After both f d and f u are set, variant flapping frequencies between the up-stroke and the down-stroke can be achieved if the circuits to trigger lower sensor and upper sensor work.
Figure 5 illustrates a general set of variation curves of flapping angles, twisting angles, and rotary angles in three successive periods for numerical calculation of the flapping wing rotor’s lift, where t ^ stands for non-dimensional time normalized by flapping period ( 0.5 / f u + 0.5 / f d ). The definition of t ^ d and t ^ u . could be given as below:
t ^ d = 0.5 f d ( 0.5 f u + 0.5 f d ) = 1 f d ( 1 f u + 1 f d ) ,   t ^ u = 0.5 f u ( 0.5 f u + 0.5 f d ) = 1 f u ( 1 f u + 1 f d ) .
It is noted that the flapping frequency during the down-stroke ( f d ) is larger than that during the up-stroke ( f u ) in Figure 5. The curve of flapping angles follows Equations (1) and (2) during either, the single up-stroke or down-stroke. Twisting angles remain unchanged throughout the flapping process, and the slope of the curves for rotary angles over 360 represents the revolutions of rotary motion during every flapping cycle.
Finally, based on the above assumption, the trace line of the point P at flapping wing rotor’s wing tip in one rotary cycle could finally be plotted in Figure 6. It only consists of both flapping motion and rotary motion, while the flexible twisting motion is neglected in the following numerical calculation. The wings are mounted on the FWR in an installation angle ( θ 0 ) and installation angle is defined as the angle between the wing chord and the horizontal plane when the flapping angle is zero during mid down-stroke, as illustrated in Figure 6.

2.3. CFD Model and Validation

In order to calculate the flow field of the flapping wing rotor and make a comparison between the lift obtained by CFD, a CFD model was built. The CFD solver, used in this paper, is fluent 19.0 and the mesh is plotted by Hypermesh software, as well as the meshing mode of fluent as given in Figure 7. The whole fluid field is defined as a sphere and can be mainly divided into two parts: Inner fluid and outer fluid. There is also a region around the wing surface (“wall” boundary condition) in which structured mesh is employed. The outer boundary of this region is selected to be a 1 time chord from the wing surface. Then, the outer bound radius of inner fluid (dark blue domain) is about 5 times the wing chord length while the outer bound radius of outer fluid (light blue) accounts for 10 times the wing chord length, in order to meet the requirements of far field boundary condition. A user-defined function is coded in C language to make the mesh in dark blue rotate about the center of sphere. These rotation motions can be decomposed into three mutually orthogonal components to simulate the flapping, twisting and rotary motion of our FWR model. The overset boundary condition is applied to the interface between inner fluid and outer fluid. Since the Reynolds number of this single wing is 7000–23,000 when its flapping frequency ranges from 1 Hz to 3 Hz, the k-ω shear stress transfer (SST) model is utilized in this paper as that used in [28].
In order to validate the CFD model built-up in this paper, a case comparison is made between the lift and moment results in our CFD simulation and the results obtained by Wang et al. [23]. The variation function of flapping angle ( φ ), twisting angle ( θ ) and rotary angle ( ψ ) as shown in Figure 8 are set the same as those in the literature. According to Wang, the shape of the wing is simplified as a flat plane with 3% relative thickness and the aspect ratio λ = 5 . The reference length ( L r e f ) and reference velocity ( U r e f ) are defined as wing chord L r e f = c and the average flapping velocity at the wing tip U r e f = 4 c λ f Δ φ . Based on the above definition, the lift and rotational moment coefficients C L and C m are calculated as follows,
C L = 2 L ρ ( U r e f ) 2 S
C m = 2 m r o t a r y ρ ( U r e f ) 2 S c
where L (lift) and m r o t a r y (rotational moment) are the components of the aerodynamic force and moment in rotary direction. Besides, ρ denotes the air density. After calculation, the simulation results are shown in Figure 9.
According to Figure 9, the trend of lift coefficients’ and rotational moment coefficients’ curves by fluent software in this paper is the same as those by Wang et al. [23]. The average lift coefficients and rotational moment coefficients are C L ¯ = 0.92 and C m ¯ = 0.13 in Wang’s results. Meanwhile, in this paper, the C L ¯ equals to 0.922 and C m ¯ equals to 0.123 which is quite similar to those given by Wang et al. [23]. Overall, the comparisons above show that the CFD model, in this paper, is suitable for the aerodynamic study of the FWR.

2.4. Assembly of Experimental Devices

Upon manufacturing, a FWR experimental model was built as shown in Figure 10 with the parts assembled using epoxy resin. Apart from the items plotted in Figure 1, one more part (base 1) was manufactured for fixing the FWR model onto a load cell (SEEED STUDIO 314990000) to measure the forces.
The experimental set-up for the FWR measurement are shown in Figure 11a. The DC voltage for signal acquisition card and the USM controller are 8 V, and 12 V, respectively. It will generate a voltage signal upon a force acting on the load cell, through a signal amplifier of 1k gain. The amplified signal was transferred to a signal acquisition card (NI USB-6361) before finally being passed to a computer and processed by software LabVIEW (2014, national instrument, Austin, Texas, and America). The measured signals were filtered by the second order low-pass Chebyshev algorithm in the LabVIEW code and the low-pass cutoff frequency was set as five times the flapping frequency of the FWR model [29,30].
In order to generate different flapping frequencies in down-stroke ( f d ) and up-stroke ( f u ), and limit the response time for switching the frequency between f d and f u to within milliseconds, two optical sensors are mounted on the FWR as shown in Figure 1b. Moreover, a control breadboard is needed as shown in Figure 11b. Each time the trigger passing through the higher optical sensors, an excitation signal is generated at the position of “sensor 1” plotted in Figure 11b. It would make the “output” in Figure 11b only affected by the adjustable resistance R 5 . By adjust the resistance R 5 , the voltage of “output” ( V o u t ) in Figure 11b ranges from 1 V to 2.5 V. Then, the controller of the USM can control the rotation speed of the USR30 by inputting different V o u t and higher V o u t usually corresponds to higher motor’s rotation speed, namely, higher FWR flapping frequency.

3. Experiment Results and Discussion

3.1. Parametric Study for the Effect of Flapping Frequency Variation

As described in Section 2.2 and Section 2.4, it is possible to vary the flapping frequency in up-stroke and down-stroke separately by employing the USM. The frequency and corresponding rotational speed of the FWR were measured by using laser velocimeter, as described in Section 2.2. In this study, the flapping frequency was altered from 1 Hz to 3 Hz to set a combination of flapping motion cases including the constant flapping frequency (CFF) mode in case 1, 2, and 3 and variant flapping frequency (VFF) mode in case 4 and 5, as listed in Table 2. According to Table 2, it can be found that higher average flapping frequency usually lead to higher rotational speed ψ ˙ .

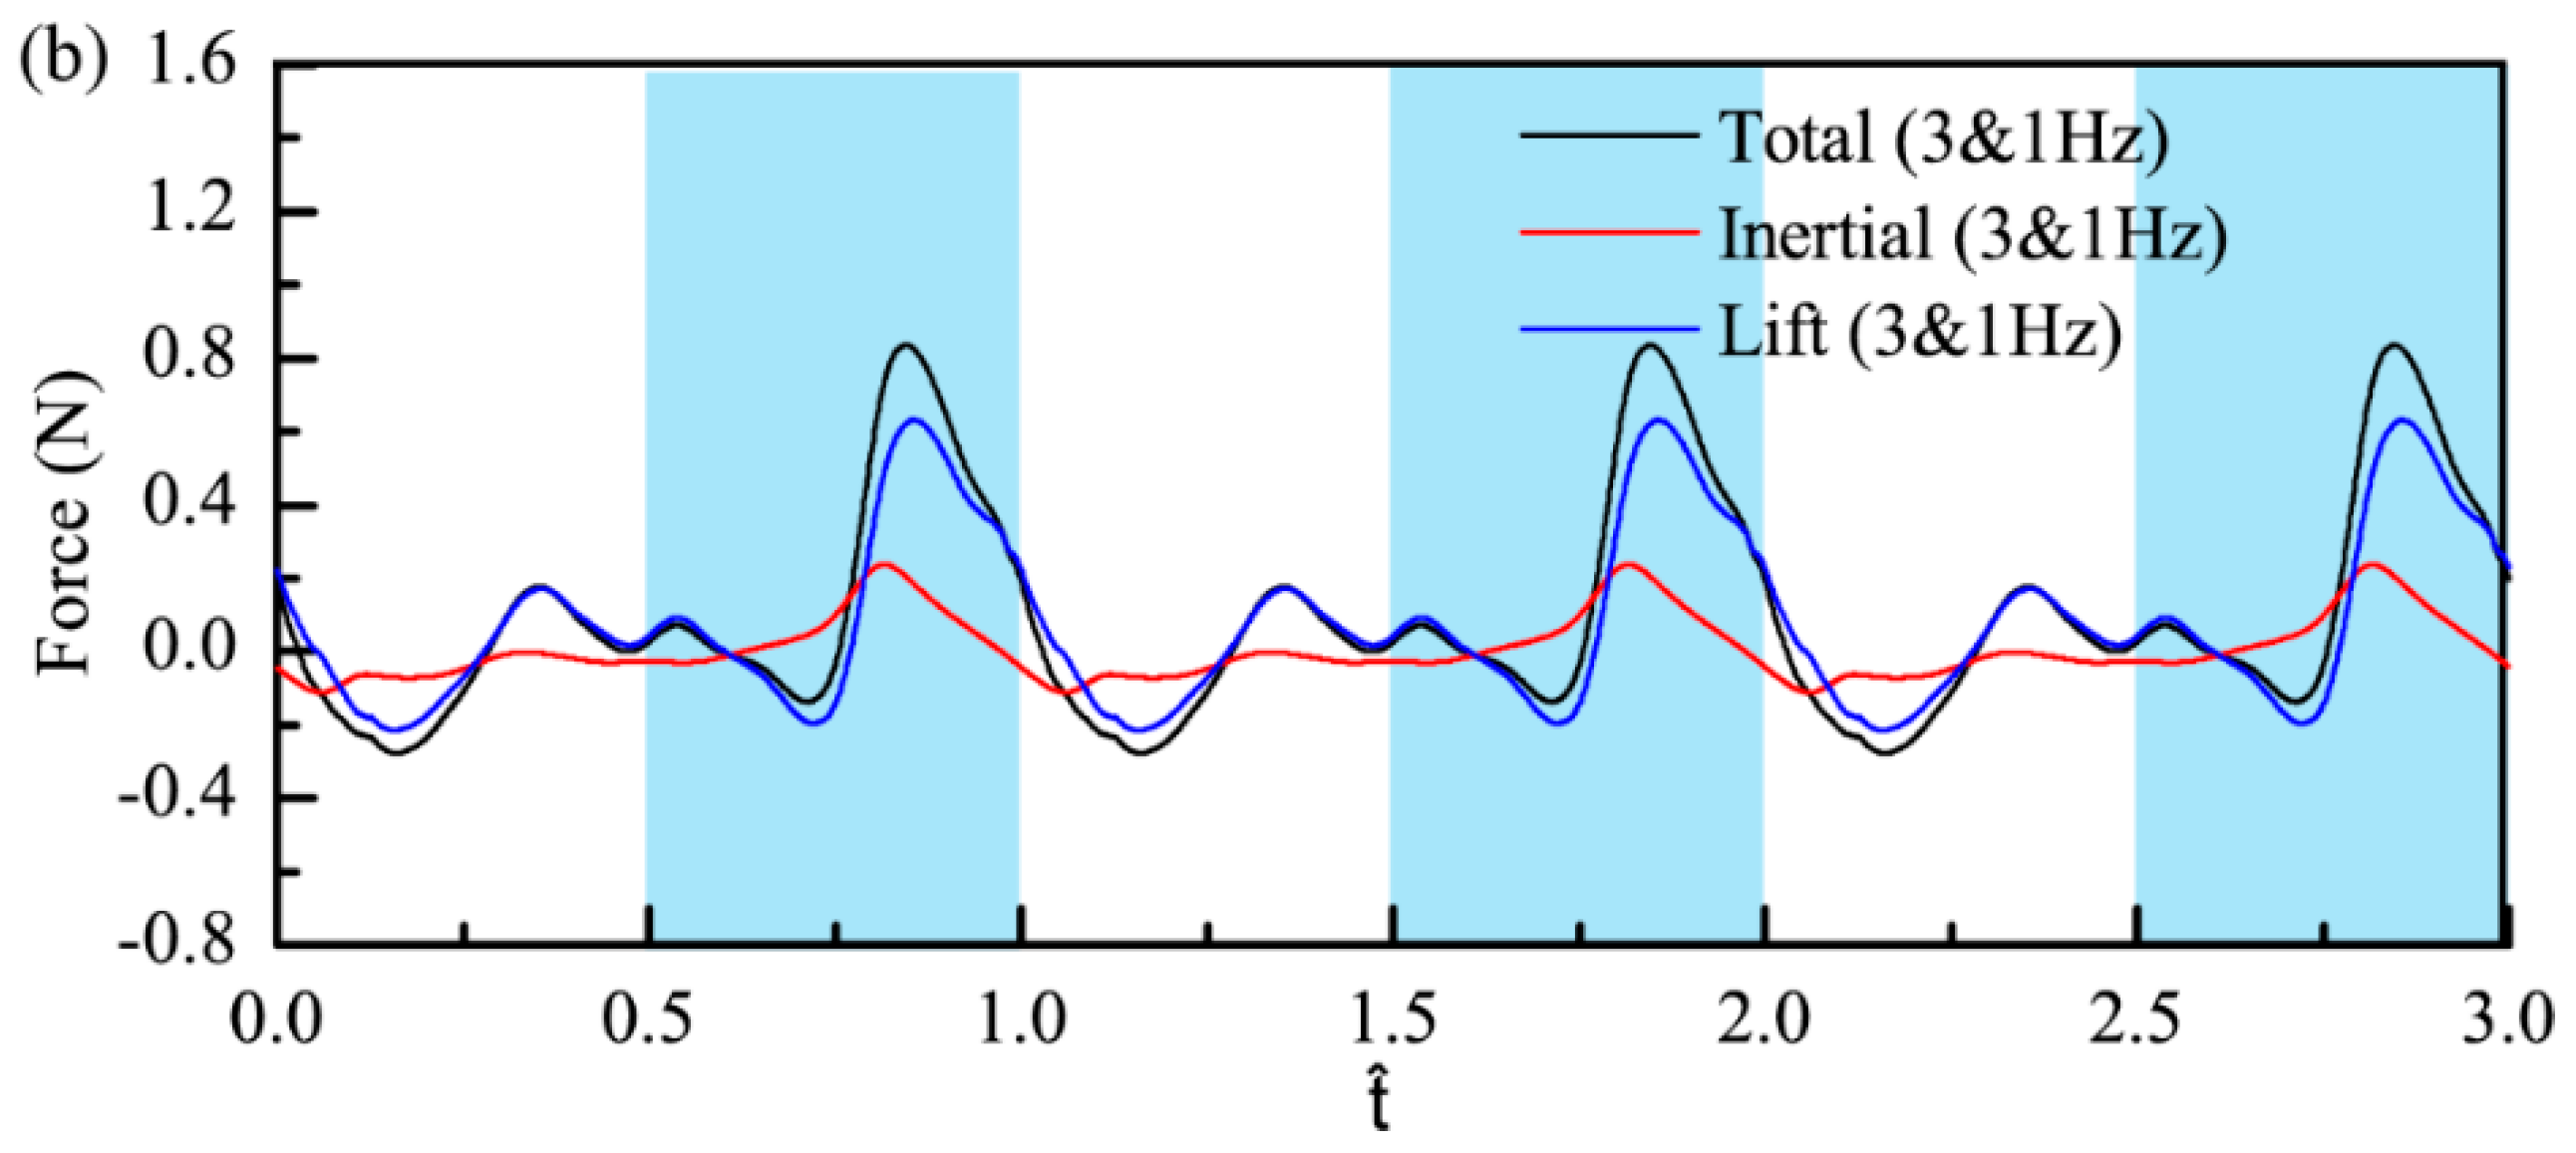
3.2. Experimental Results of the VFF Effect on Inertial Force

For the CFF Case 1 (3 Hz) versus the VFF Case 4 (3 & 1 Hz), the total force, including the inertial and aerodynamic lift forces, are measured and shown in Figure 12. Since the total force measured by the load cell is a mixture of the inertial and aerodynamic forces, the inertial force was measured separately with the membrane skin removed from the wing in the same condition of f u = f d = 3   Hz as in case 1 and f u = 1   Hz ,   f d = 3   Hz as in case 4. The aerodynamic forces can be obtained from the difference between the total force and the inertial force of the FWR model. From Figure 12 for the baseline case 1 (CFF 3 Hz), the average inertial force, in a flapping cycle, is nearly zero, and results in an average total force (215 mN) almost the same as the average lift force (214 mN). The phase difference is about 90° between the inertial force and lift force, given the maximum vertical acceleration and minimum velocity occurs at the start of the up-stroke and down-stroke. During the up-stroke, the phase difference is slightly smaller than 90°, while the phase difference is slightly larger than 90° during the down-stroke.
Unlike case 1, the VFF in case 4 results in a positive average inertial force about 8.3 mN, which is about 10% of the average lift 80.5 mN. The results indicate that a reduced flapping frequency, during up-stroke, would be beneficial due to the power efficiency and the lift of the FWR model. It is worthy to note that this phenomenon is mainly due to the relatively rigid wing with limited twisting angle of the FWR model, which is different from a flying animal wing that is capable of folding or large twisting in up-stroke.

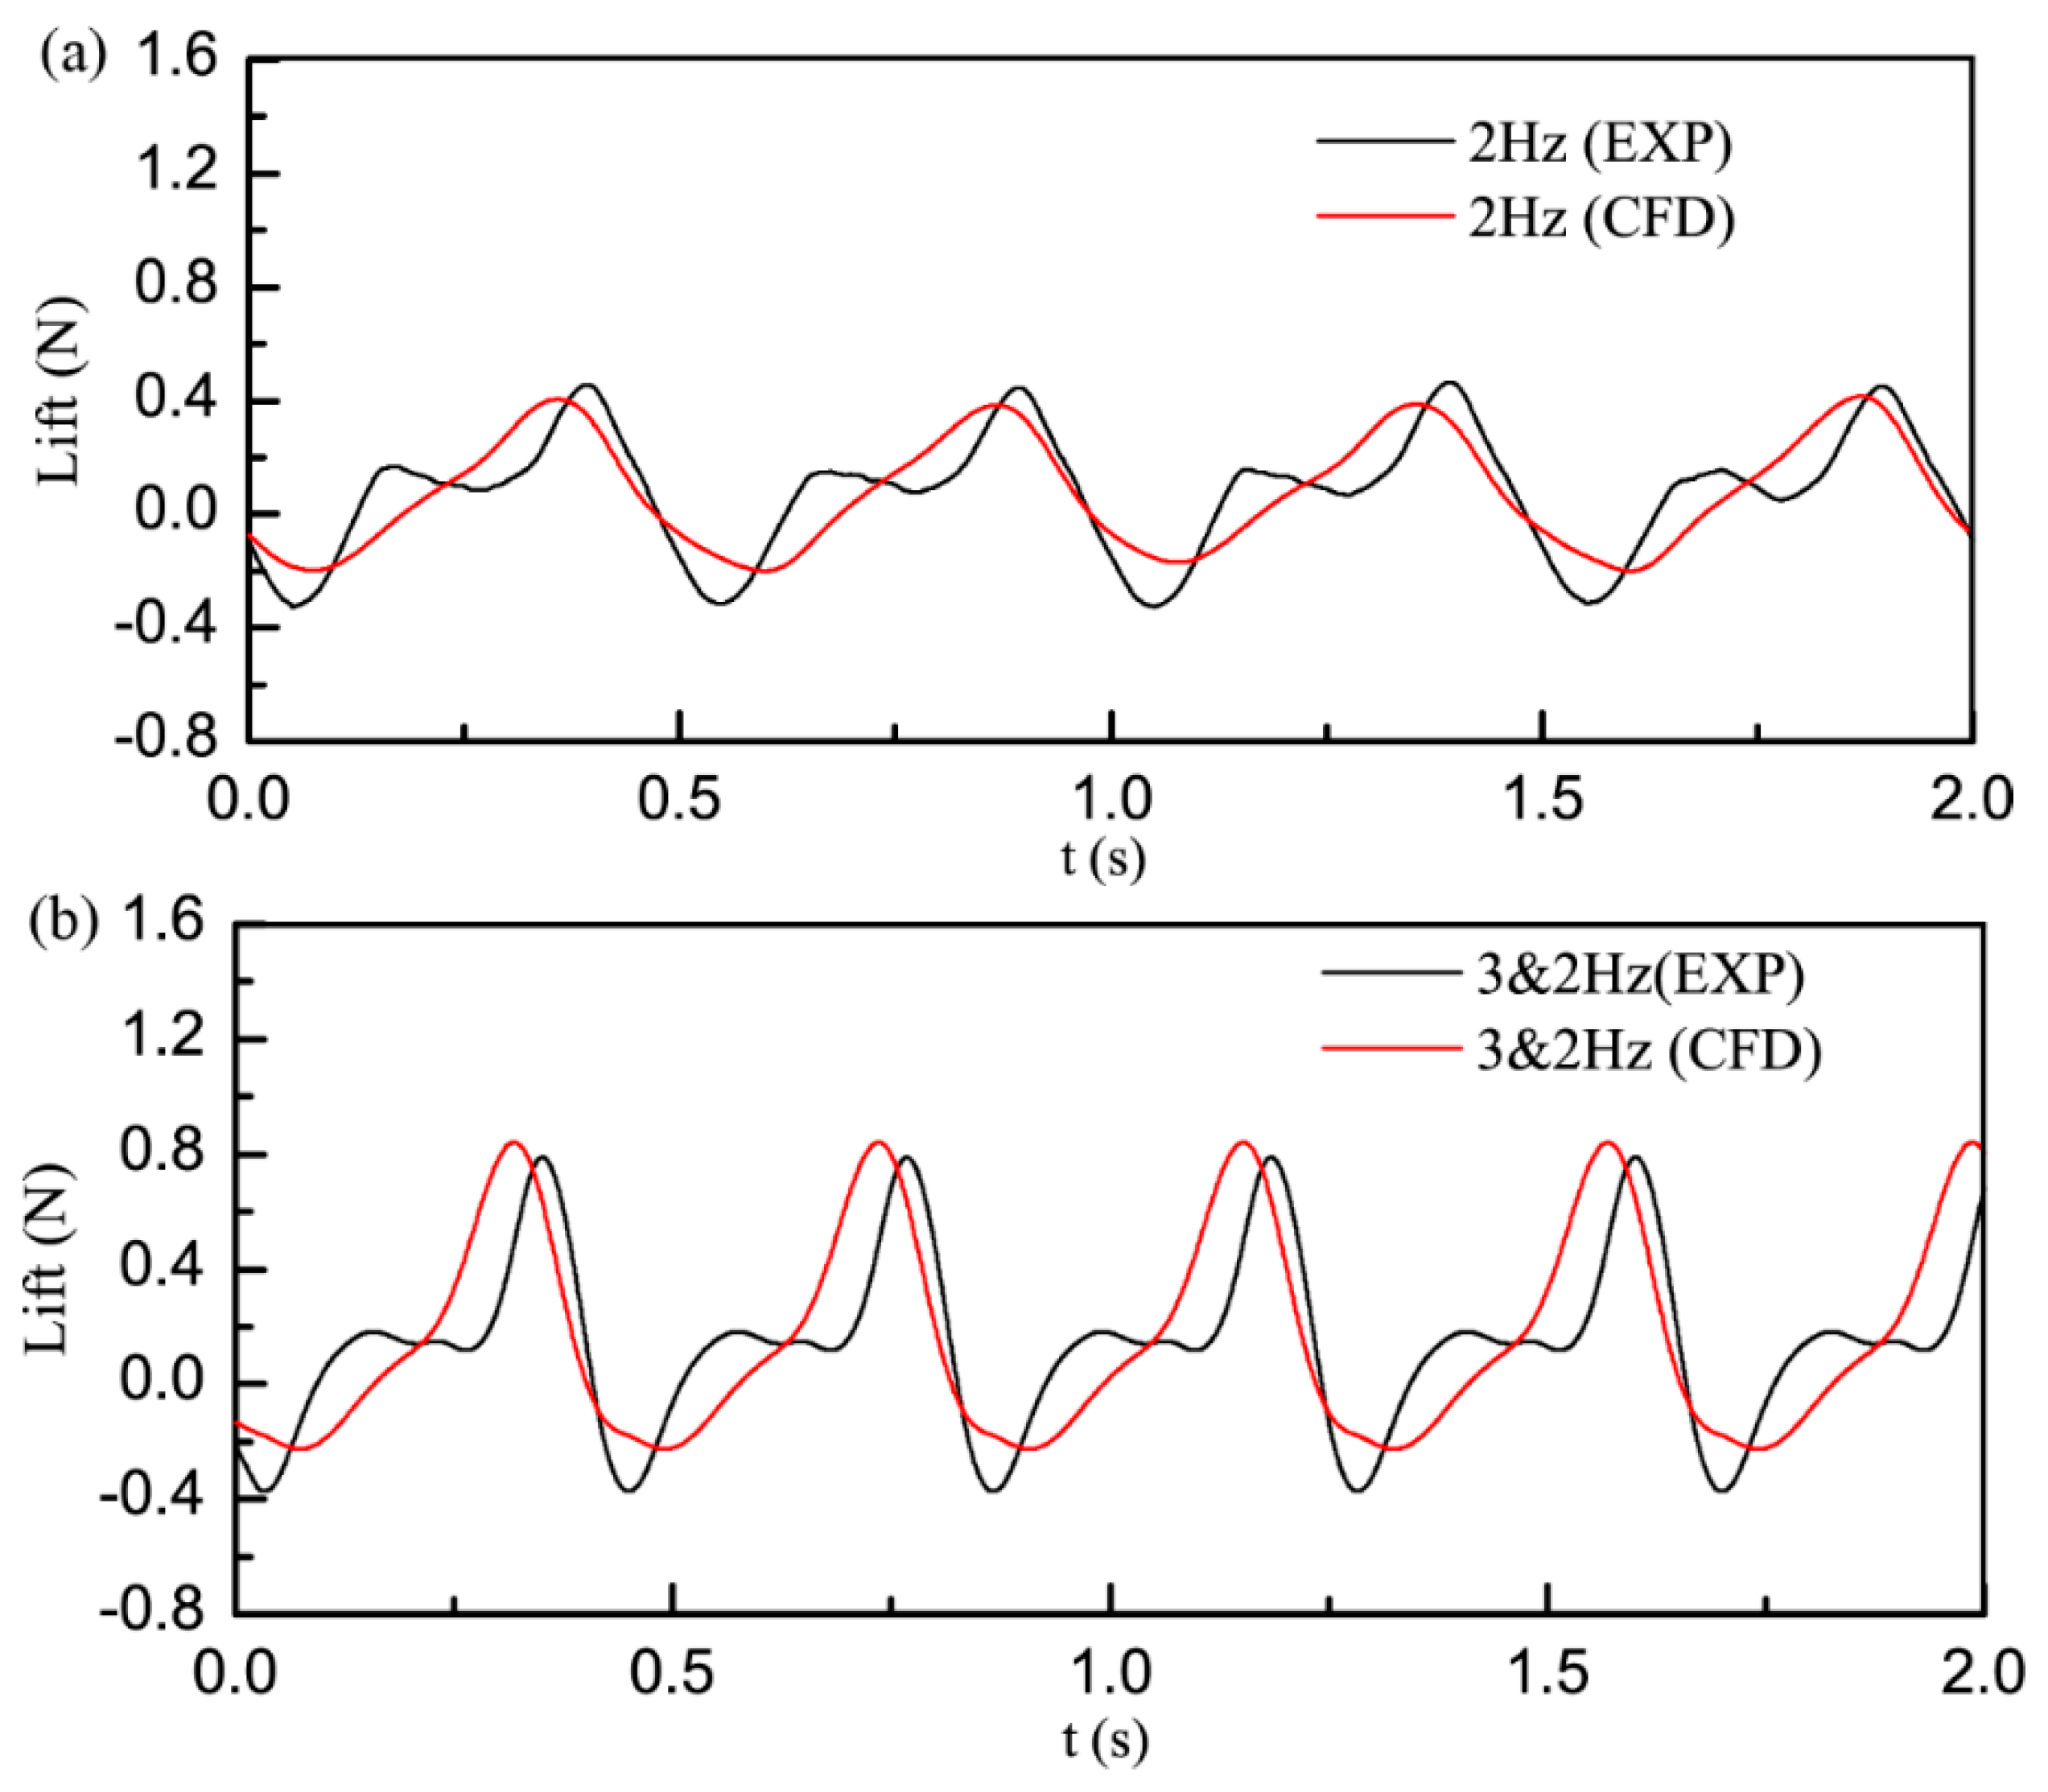
3.3. Experimental and CFD Simulation Comparison

It is apparent that, compared with CFF case, the negative inertial and lift forces will be reduced by decreasing the flapping frequency in up-stroke. However, the up-stroke time and the period of a flapping cycle will be longer, means that the average flapping frequency is reduced. The study then focused on the effect of VFF on the lift by comparing the experimental data with CFD simulation results, as shown in Figure 13 and Figure 14. It is noted that the elastic deformation of the FWR wing spar and membrane skin was ignored in the CFD model.
For the CFF case 1 (3 Hz), the lift force results, from experiment and CFD methods, are compared in Figure 13. For the baseline case 1, a similar trend of the lift curves is found between the CFD and experiment results, with the average lift 218 mN, and 214 mN in a flapping cycle, respectively. The maximum negative lift occurs at mid-up-stroke, while the maximum positive lift occurs at mid-down-stroke by both methods. The peak lift values by experiment is smaller than that by CFD simulation, mainly because a constant rotational speed ( ψ ˙ ) is taken in the CFD model. While, in fact, the rotational speed of the FWR experiment is slightly larger during the up-stroke than the average value ( ψ ˙ ), but smaller during the down-stroke when the maximum lift is produced. Despite the difference in lift peak values between the CFD and experiment results, their general trend and average lift values are quite similar. Thus, the assumptions made in the CFD model is valid for evaluating the effect of variant flapping frequency on the FWR performance in the study (<3 Hz).
For the CFF case 3 (1 Hz), the average lift value 17.8 mN from experiment is much smaller than the average lift (214 mN) in the CFF case 1 (3 Hz) and the lift (80.5 mN) in the VFF case 4 (3 & 1 Hz), according to the results shown in Figure 13. A similar average lift from CFD is found for the case 3 (19.9 mN) and case 4 (85.3 mN). It is observed that the lift curves in case 3 are similar to the case 4 during up-stroke at 1 Hz flapping frequency, while the lift during down-stroke is similar to the case 1 at 3 Hz flapping frequency. The average lift in case 4 (3 & 1 Hz) is apparently greater than the lift in case 3 (1 Hz), but smaller than case 1 (3 Hz), due to smaller input power and rotational speed during up-stroke motion.
For the CFF case 2 (2 Hz) and VFF case 5 (3 & 2 Hz), the lift force results are shown as Figure 14 in comparison with the baseline case 1 (3 Hz). The average lift forces for the case 2 from the experiment and CFD simulation are 72.8 mN, and 77.3 mN, respectively; for case 5 (3 & 2 Hz) are 151.7 mN, and 167.5 mN, respectively, which is significantly greater than the lift force 72.8 mN in case 2 (2 Hz) and the lift 80.5 mN in case 4 (3 & 1 Hz), but smaller than the lift force 214 mN in case 1 (3 Hz).

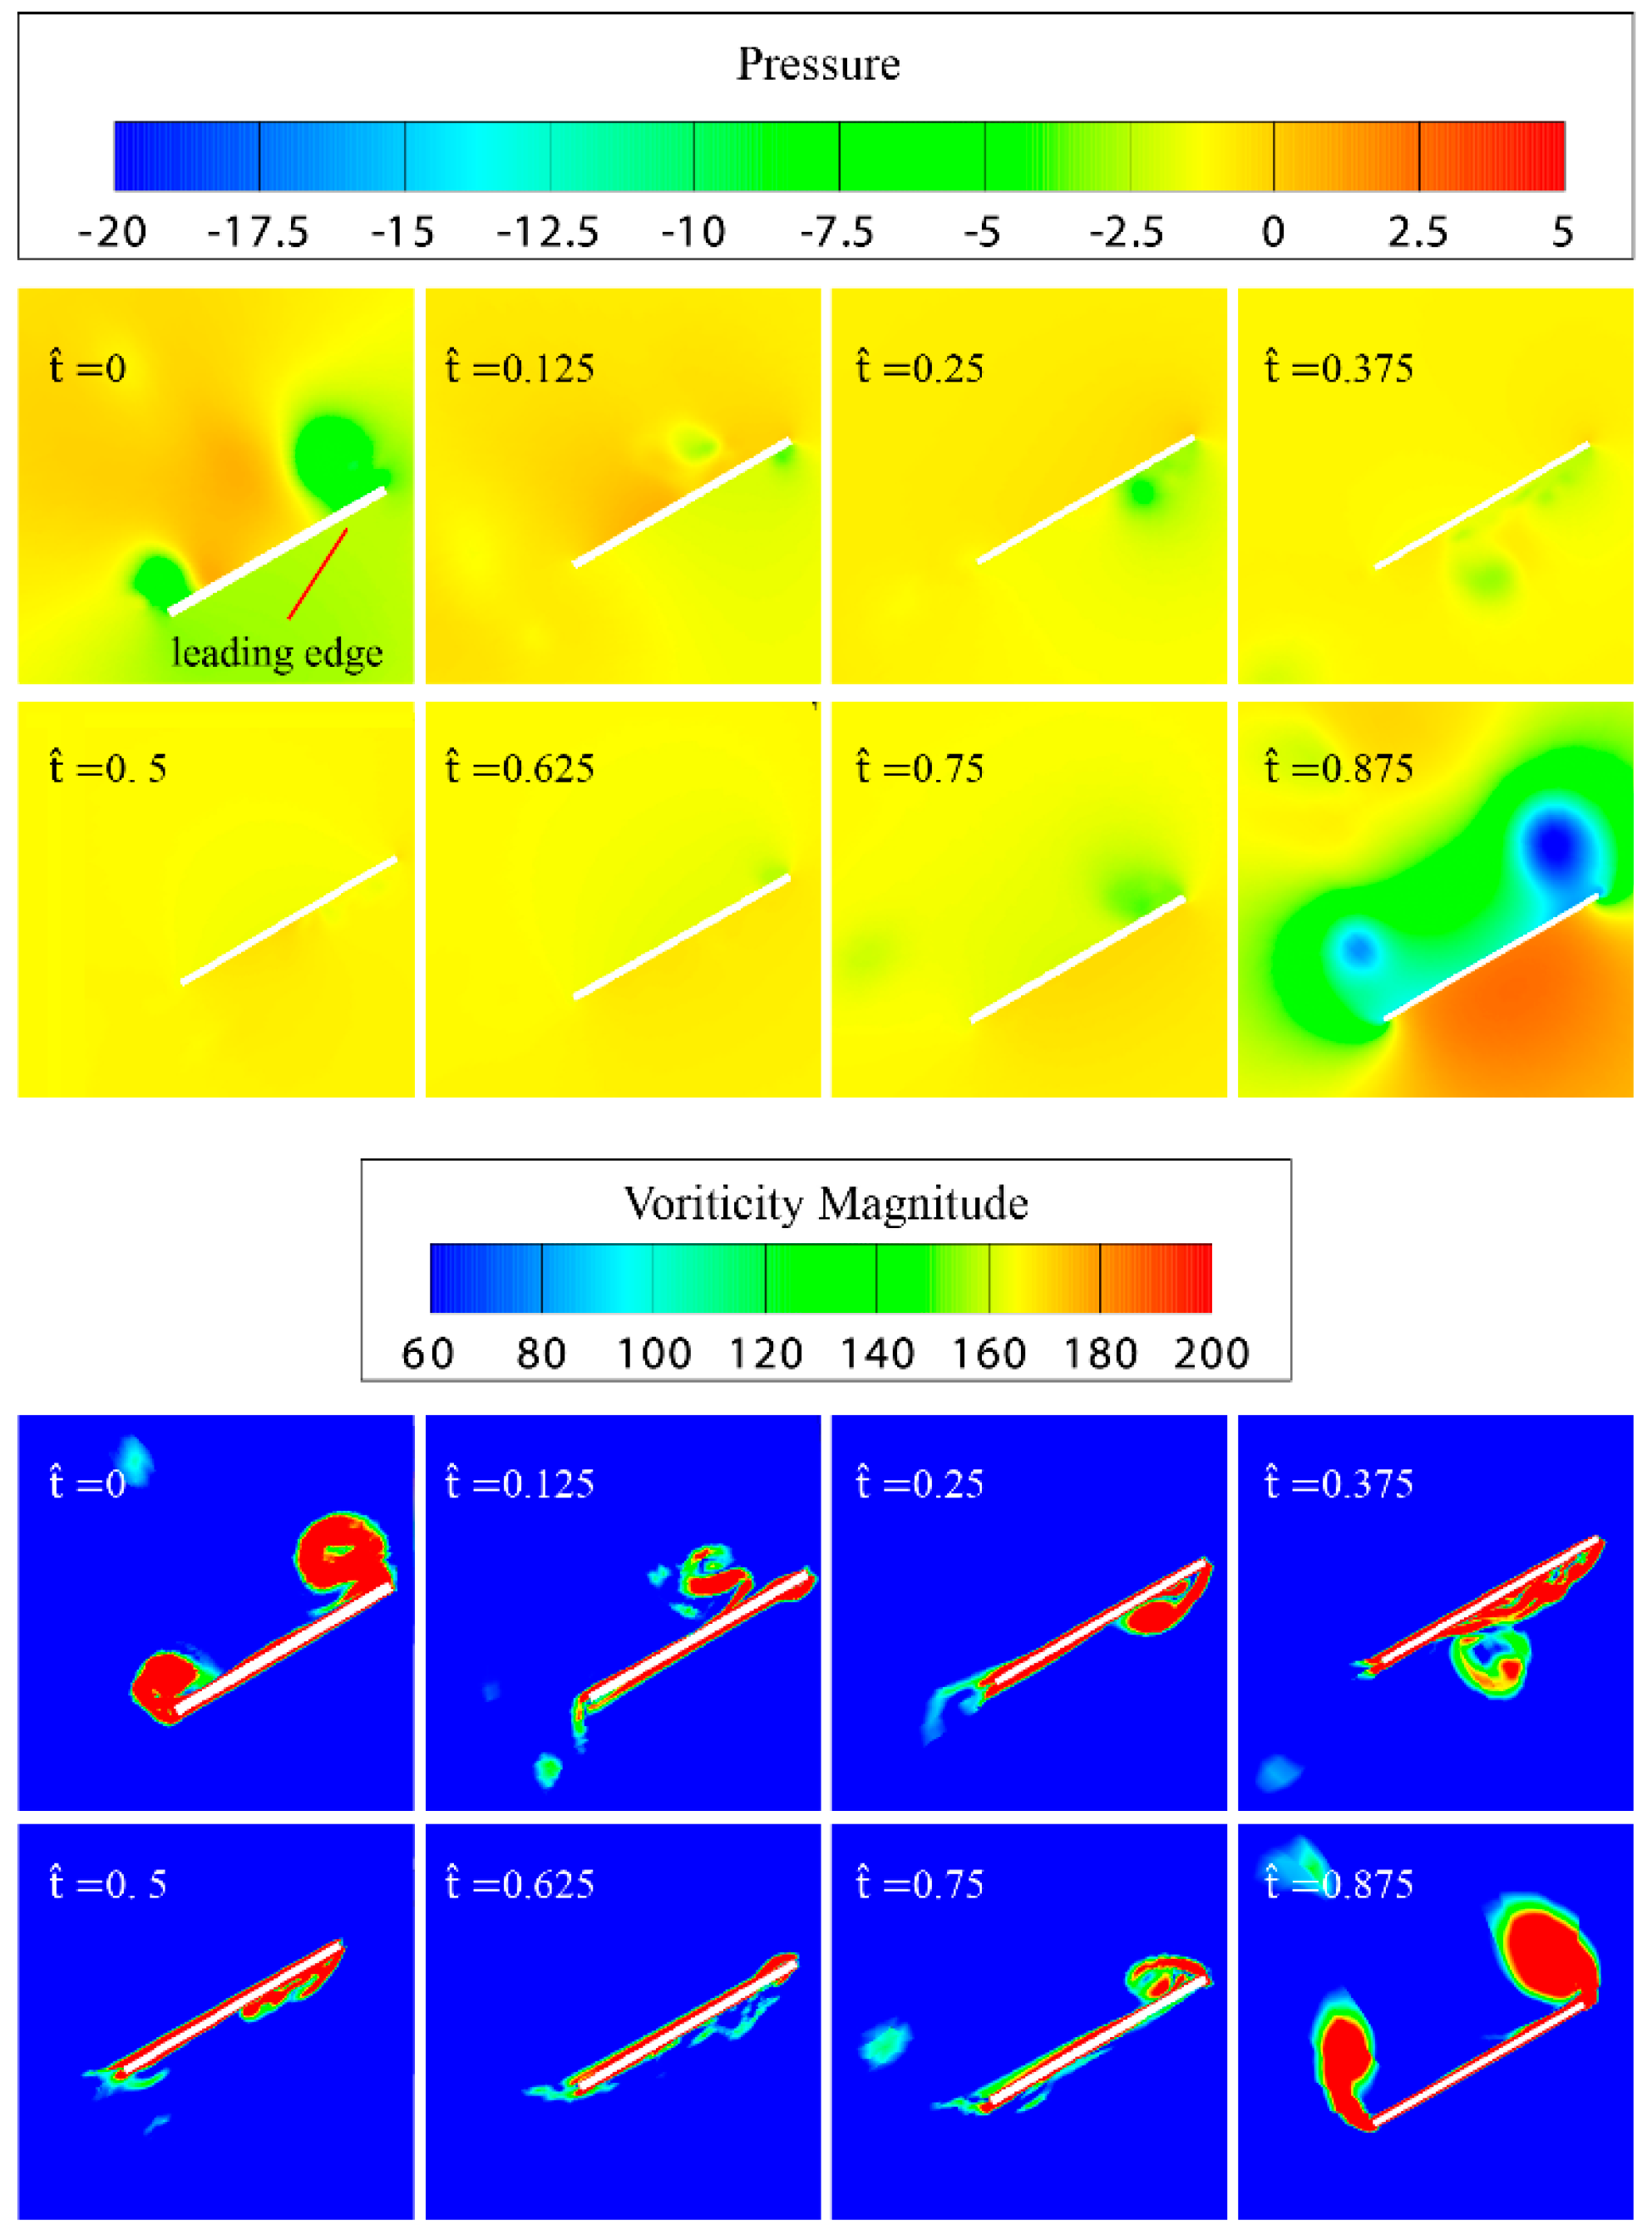
3.4. Flow Field Simulation and Analysis by CFD Method

It is understood from a previous study that the evolution of leading edge vortex (LEV) and trailing edge vortex (TEV) is a decisive factor for generating the lift and thrust of FWR. For case 1 (3 Hz), the flow pressure and vorticity, produced by the FWR, are plotted in Figure 15 at eight non-dimensional time step t ^ = 0, 0.125, 0.25, 0.375, 0.5, 0.625, 0.75, 0.875 in one flapping cycle. As given in Figure 15, the flapping cycle starts at the beginning of the up-stroke t ^ = 0 . In the plots, only the mid-span section of the FWR was taken as the typical section for analyzing the LEV and TEV structures [23].
According to Figure 15, a TEV forms at the lower surface at the end of down-stroke ( t ^ = 0 ), while a high-pressure region is formed on the upper surface of the FWR, mainly in the region of chord 0.6 and 1.0. When up-stroke started at t ^ = 0.125 , significantly low (negative) pressure and LEV occurred on the lower surface of the wing section, which exacerbated the generation of negative lift. From t ^ = 0.25 , the LEV started shedding off the section and eventually a weak TEV is formed on the upper surface of the trailing edge. During the second half of the up-stroke motion, the lift increases from negative to small positive values, reaching about 20% of the maximum lift in one cycle. Wake capture (LEV shed from the airfoil during up-stroke) was observed at the lower surface, at the start of the down-stroke, when t ^ = 0.5 . From t ^ = 0.5–0.75, the LEV and TEV continued to accumulate on the upper surface of the FWR section until shedding off started at t ^ = 0.875 . The lift reached a maximum of 880 mN in the mid position of down-stroke, at about t ^ = 0.75 , when the strongest LEV and TEV were found on the upper surface. In general, the evolution of LEV and TEV determines the lift generation and form on the upper surface most of the time in one cycle, which leads to a positive average lift (218 mN) in a complete flapping cycle.
The evolution of LEV and TEV are quite similar for the CFF case 1, 2, and 3. However, several differences of the flow field are found between the above CFF cases and VFF case. Since the difference between f u and f d is larger in the VFF case 4 (3 & 1 Hz), the difference of fluid field in up-stroke and down-stroke is more apparent as presented in Figure 16. Unlike case 1, the pressure difference between the lower and upper surfaces and the pressure value is much smaller over a longer period until t ^ = 0.75 during the up-stroke. Hence, the negative lift keeps in relatively small value (about 10–15% of maximum positive lift) most of the time in a flapping cycle. It is not until t ^ = 0.75 that the LEV and TEV started to accumulate on the upper surface of the section, with the peak lift (650 mN) occurring at t ^ = 0.875 , when down-stroke started and the strongest LEV and TEV formed.
From the results in Figure 13 and Figure 14, it is found that the lift generated in the VFF case 4 and 5 is smaller than the CFF case 1, with higher output power from the motor in a flapping cycle. However, given the same output power, the lift forces generated by the FWR in the CFF and VFF cases are yet to be evaluated and compared. The measured output power against the rotation speed and torque of the motor in standard operating conditions is shown in Figure 17a. The results show that the maximum output power is 1.8 W with associated torque nearly 0.1Nm. The stalling torque of the motor is 0.16 N·m. From the results in Section 3.2, it was found that the lift reaches maximum value of 214 mN when the maximum power output occurs at the motor speed 180 rev/min. The relationship between the output power and the average lift of the FWR is shown in Figure 17b where the equivalent output power of the motor defined as below,
P e q = ( 0.5 · T f u · P f u + 0.5 · T f d · P f d ) / ( 0.5 · T f u + 0.5 · T f d )
where T f u = 1 / f u and T f d = 1 / f d means the corresponding flapping period of the flapping frequency f u and f d ; P f d and P f u stands for the power output of the motor with rotation speed 60 · f u and 60 · f d which can be found from Figure 17a. According to Figure 17b, it shows that in the same power, the average lift force produced by the FWR in the VFF cases is greater than that in the CFF cases. Moreover, larger lift difference between the CFF and VFF cases with larger | f d f u | is found, and in particular, the lift more than doubled in the VFF case 4 (3 & 1 Hz) compared with that in the CFF cases (1.3 Hz) of the same power output.
From the above results, it is found that the motor provides adequate torque for the FWR to obtain VFF for the investigation although the flapping frequency (3 Hz) is relatively low due to the limited motor power. Consequently, the maximum lift produced by the FWR is only 43% of the FWR model weight (50 g), and even smaller than the motor mass 28 g. Obviously, it is impractical for this model to achieve hovering flight unless the model weight can be reduced significantly. Although it is feasible to reduce the component weight, understanding how to improve the power to weight ratio (efficiency) of the ultrasonic motor is beyond the scope of the current study.

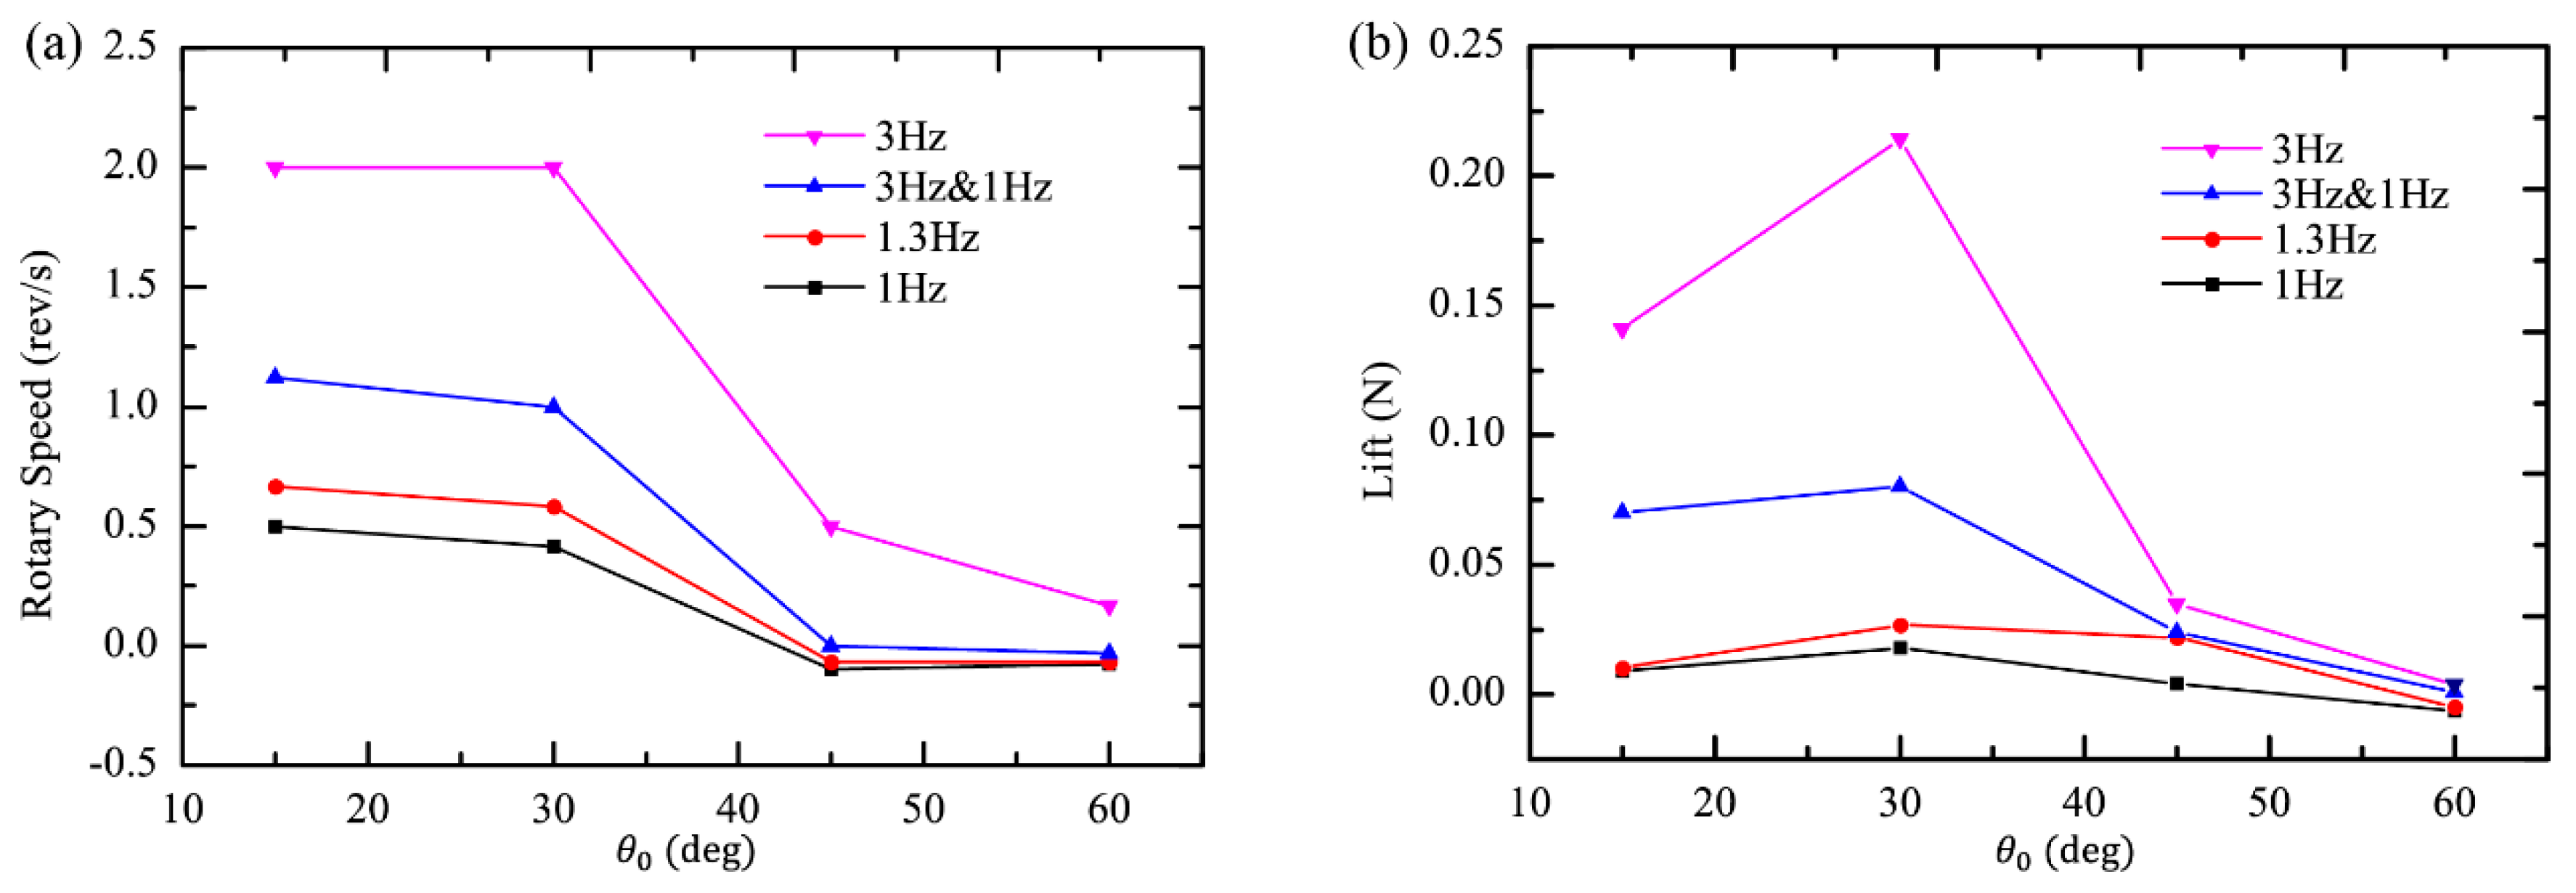
3.5. The Effect of Different Installation Angles on the Lift Generation and Rotational Speed Generation

In the above cases and results, the FWR installation angle is θ0 = 30°. In order to evaluate the effect of the installation angle on the lift, the FWR model, with alternative installation angles, including θ0 = 15°, 45° and 60° and have also been tested with the results presented in Figure 18.
According to the test results shown in Figure 18a, the FWR rotational speed decreases when the installation angle θ0 increases due to the increased drag force. In general, the larger the flapping frequency and power input, the larger the rotational speed. Furthermore, the rotational speed for CFF case 1 remains almost constant when θ0 < 30° before decrease afterwards, while the rotational speed for the other cases of smaller power input is decreased in the whole range of θ0, and even close to zero when θ0 reaches 45°. The maximum average lift force, generated by the FWR, is shown in Figure 18b. It is also observed that the lift force increases with the installation angle until it reaches the maximum at θ0 = 30° and then decreases when θ0 > 30° for all the cases. The results indicate that there is an optimal installation angle to achieve the largest lift for different power, flapping frequency, and rotational speed. In terms of lift-to-power ratio, the higher value is generally associated with higher flapping frequency or input power, as shown in Figure 18c. However the lift-to-power ratio of the FWR at 3Hz reduces dramatically when θ0 > 30° and becomes smaller than the VFF case (3 Hz & 1 Hz) when θ0 = 43°–53°, and the 1.3 Hz case, which has much smaller input power.
Furthermore, the lift efficiency in terms of Strouhal number ( S t number) and lift efficiency P f used in previous studies [19,31,32] are employed to obtain the insight with a quantified analysis of the results:
S t = f Φ ψ ˙ f w d
P f = C L ¯ 1.5 C p ¯ .
where,
C L ¯ = L ¯ 0.5 ρ U r f 2 S t w ,       C p ¯ = P ¯ 0.5 ρ U r f 3 S t w ,         U r f = 2 Φ f r 2
where f stands for the flapping frequency (for VFF cases, it is a value equivalent to the CFF with the same output power), Φ is the stroke angle amplitude, ψ ˙ f w d is taken to be rotational angular speed of the wing, P ¯ and L ¯ is the motor’s power and average lift of the FWR, S t w is the total area of two wings, r 2 stands for the radius of the second moment of wing area, as defined in Ellington’s book [32], ρ is the air density, P f stands for the lift efficiency. Since the P ¯ is defined as the motor output power instead of mean aerodynamic power in a flapping cycle, the resulting P f in the current study cases is generally smaller than the case in previous study [19].
For the installation angles θ0 ≥ 45° in all cases of different flapping frequencies, it is found that the resulting 0.1 > St > 0.6 is far beyond the high propulsion efficiency around St = 0.3 of flying animals and the associated lift efficiency P f < 0.02 is very low. For the cases with installation angles 15°–30°, the S t values fall in the range of 0.25–0.6 with most of the associated P f > 0.05 as shown in Figure 19. In particular the P f reaches a value 0.28 associated with St = 0.36 for the CFF case 1 (3 Hz), which is similar to an optimal result in previous study [19]. Comparing all the CFF cases, the S t number for all the VFF cases of equivalent power output falls in the range of 0.3–0.36 with slightly higher P f values. For example, the VFF case 4 (3 & 1 Hz) results in St = 0.31 and P f = 0.11 while the CFF case of equivalent frequency (1.3 Hz) and power (1.09 W) results in St = 0.53 and significant smaller P f = 0.02 . It is clear that the VFF cases with an installation angle θ0 = 30° result in higher P f and optimal St number comparing with the other cases and installation angles.

4. Conclusions

An investigation is conducted into the effect of variant flapping frequency during a flapping cycle on the aerodynamic force generation of a flapping wing rotor driven by an ultrasonic motor (USR30) through experiment and CFD simulation. In the experiment, a couple of optical sensors and a laser velocimeter are used to measure the FWR motion including flapping frequencies in up-stroke f u and down-stroke f d and rotational speed ψ ˙ . The lift force generated by the FWR is obtained from the difference of the total force and inertia force measured by a load cell. A CFD model is created for the FWR with the spar beam twist but without the wing skin deformation taken into account. The CFD model is validated before used for FWR aerodynamic simulation.
As described in Section 2.2 and Section 2.4, it is possible to vary the flapping frequency in up-stroke and down-stroke separately by employing the USM. The frequency and corresponding rotational speed of the FWR were measured by using laser velocimeter as described in Section 2.2. In this study, the flapping frequency was altered from 1 Hz to 3 Hz to set a combination of flapping motion cases including the constant flapping frequency mode in case 1, 2 and 3 and variant flapping frequency mode in case 4 and 5 as listed in Table 2. According to Table 2, it can be found that higher average flapping frequency usually lead to higher rotational speed ψ ˙ .
However, given a specified power output, the lift generated by the FWR in VFF cases is significantly larger than the usual CFF cases. This is due to the reduced negative lift of the FWR during the slower up-stroke motion in the VFF cases. In the VFF case 4 (3 & 1 Hz), the lift is more than doubled comparing with that the CFF case having equivalent flapping frequency (1.3 Hz) and power. Due to slower up-stroke motion, a positive inertia force about 10% of the average lift is produced by the FWR in a flapping cycle although it does not contribute to lifting the model during flight. The CFD simulation reveals the aerodynamic mechanism and provides insight of the evolution and different flow characteristics of the LEV and TEV in the CFF and VFF cases. From the flow pressure and velocity results, it is found that the LEV and TEV growth on the FWR upper surface is much slower during up-stroke (takes over 60% of flapping period) in the VFF case 4 (3 & 1 Hz) hence a smaller negative lift (about 10–15% peak positive lift) than the CFF case 1 (3 Hz). Therefore, a kinematics of motion with an optimal VFF is superior comparing with the usual CFF subject to the same power.
The installation angle θ0 of the wings is a key factor that influences the FWR performance and lift. From the parametric study for a range of installation angles θ0 = 15°–60°, it is found that the larger the installation angle, the greater the lift force at a rotational speed. In practice however, a large installation angle results in a large drag and reduced rotational speed. When θ0 ≥ 45°, the rotational speed is decreased to nearly zero. Without rotary motion, the FWR works like a conventional flapping wing with the lift reduced dramatically as shown in Figure 18. For this FWR model, an optimal θ0 is found around 30° for both CFF and VFF cases while the VFF normally results in a higher power efficiency and propulsion efficiency. With the optimal installation angle θ0 = 30°, the Strouhal number for the VFF cases is in the range of high propulsion efficiency 0.3–0.36 and higher P f values than the CFF cases of the same power and equivalent flapping frequency. The ultrasonic motor provides a feasible solution for the FWR to obtain VFF and generate higher lift under a specified input power.

Author Contributions

Conceptualization, S.C. and L.W.; methodology, S.C. and L.W.; software, S.C.; validation, S.C. and L.W.; formal analysis, S.C. and L.W.; investigation, S.C. and L.W.; resources, S.C. and L.W.; data curation, S.C.; writing—original draft preparation, S.C.; writing—review and editing, S.G.; visualization, S.G.; supervision, M.T. and C.Z.; project administration, C.Z.; funding acquisition, L.W. and C.Z. All authors have read and agreed to the published version of the manuscript.

Funding

This research was funded by The National Natural Science Foundation of China, Grant No. 51575265 and Grant No. 11972079; Foundation Sciences Qiannan Normal University for Nationalities, Grant No. qnsy2018004.

Conflicts of Interest

The authors declare no conflict of interest.

References

  1. Jubin, J.; Tornow, J.D. The DARPA Packet Radio Network Protocols. Proc. IEEE 1987, 75, 21–32. [Google Scholar] [CrossRef]
  2. Lentink, D. Biomimetics: Flying like a fly. Nature 2013, 498, 306–307. [Google Scholar] [CrossRef] [PubMed]
  3. Mishra, S.; Tripathi, B.; Garg, S.; Kumar, A.; Kumar, P. Design and Development of a Bio-Inspired Flapping Wing Type Micro Air Vehicle. Procedia Mater. Sci. 2015, 10, 519–526. [Google Scholar] [CrossRef] [Green Version]
  4. Kim, D.K.; Han, J.H.; Kwon, K.J. Wind tunnel tests for a flapping wing model with a changeable camber using macro-fiber composite actuators. Smart Mater. Struct. 2009, 18, 24–32. [Google Scholar] [CrossRef]
  5. Phan, H.V.; Kang, T.; Park, H. Design and stable flight of a 21 g insect-like tailless flapping wing micro air vehicle with angular rates feedback control. Bioinspir. Biomim. 2017, 12, 1–17. [Google Scholar] [CrossRef]
  6. Hsiao, F.-Y.; Yang, L.; Lin, S.-H.; Chen, C.-L.; Shen, J.-F. Autopilots for ultra lightweight robotic birds: Automatic altitude control and system integration of a sub-10 g weight flapping-wing micro air vehicle. IEEE Control Syst. 2012, 32, 35–48. [Google Scholar]
  7. Arabagi, V.; Hines, L.; Sitti, M. Design and manufacturing of a controllable miniature flapping wing robotic platform. Int. J. Robot. Res. 2012, 31, 785–800. [Google Scholar] [CrossRef]
  8. Ansari, S.A.; Zbikowski, R.; Knowles, K. Non-linear unsteady aerodynamic model for insect-like flapping wings in the hover. Part 1: Methodology and analysis. Proc. Inst. Mech. Eng. Part G J. Aerosp. Eng. 2006, 220, 169–186. [Google Scholar] [CrossRef] [Green Version]
  9. Ansari, S.; Phillips, N.; Stabler, G.; Wilkins, P.; Żbikowski, R.; Knowles, K. Erratum to: Experimental investigation of some aspects of insect-like flapping flight aerodynamics for application to micro air vehicles. Exp. Fluids 2012, 46, 777–798. [Google Scholar] [CrossRef] [Green Version]
  10. Guo, S.; Li, D.; Wu, J. Theoretical and experimental study of a piezoelectric flapping wing rotor for micro aerial vehicle. Aerosp. Sci. Technol. 2012, 23, 429–438. [Google Scholar] [CrossRef]
  11. Chung, H.C.; Kummari, K.L.; Croucher, S.J.; Lawson, N.J.; Guo, S.; Whatmore, R.W.; Huang, Z. Development of piezoelectric fans for flapping wing application. Sens. Actuators A Phys. 2009, 149, 136–142. [Google Scholar] [CrossRef]
  12. Lal Kummari, K.; Li, D.; Guo, S.; Huang, Z. Development of piezoelectric actuated mechanism for flapping wing micro-aerial vehicle applications. Adv. Appl. Ceram. 2010, 109, 175–179. [Google Scholar] [CrossRef] [Green Version]
  13. Sreetharan, P.S.; Wood, R.J. Passive torque regulation in an underactuated flapping wing robotic insect. Auton. Robots 2011, 31, 225–234. [Google Scholar] [CrossRef] [Green Version]
  14. Mateti, K.; Byrne-Dugan, R.A.; Rahn, C.D.; Tadigadapa, S.A. Monolithic SUEX flapping wing mechanisms for pico air vehicle applications. J. Microelectromech. Syst. 2013, 22, 527–535. [Google Scholar] [CrossRef]
  15. Mateti, K.; Byrne-Dugan, R.A.; Tadigadapa, S.A.; Rahn, C.D. Wing rotation and lift in SUEX flapping wing mechanisms. Smart Mater. Struct. 2013, 22, 14–25. [Google Scholar] [CrossRef]
  16. Buck, M.; Razavi, S.; Derose, R.; Inoue, T.; Silver, P.A.; Subsoontorn, P.; Endy, D.; Gerchman, Y.; Collins, C.H.; Arnold, F.H.; et al. Controlled Flight of a Biologically. Science 2013, 340, 603–607. [Google Scholar]
  17. Li, D.; Guo, S.; Matteo, N.D.; Yang, D.; Student, P. Design, Experiment and Aerodynamic Calculation of a Flapping Wing Rotor Micro Aerial Vehicle. In Proceedings of the 52nd AIAA/ASME/ASCE/AHS/ASC Structures, Structural Dynamics and Materials Conference, Denver, CO, USA, 4–7 April 2011; pp. 1–9. [Google Scholar]
  18. Zhou, C.; Wu, J.; Guo, S.; Li, D. Experimental study on the lift generated by a flapping rotary wing applied in a micro air vehicle. Proc. Inst. Mech. Eng. Part G J. Aerosp. Eng. 2014, 228, 2083–2093. [Google Scholar] [CrossRef]
  19. Li, H.; Guo, S. Aerodynamic efficiency of a bioinspired flapping wing rotor at low Reynolds number. R. Soc. Open Sci. 2018, 5, 1–15. [Google Scholar] [CrossRef] [Green Version]
  20. Zhou, C.; Wu, J.H.; Guo, S.J. Experimental study of a mechanical flapping rotary wing model. Appl. Mech. Mater. 2013, 390, 23–27. [Google Scholar] [CrossRef]
  21. Chen, L.; Yan, W.; Wu, J. Experimental Validation on Lift Increment of a Flapping Rotary Wing with Boring-hole Design. Procedia Eng. 2015, 99, 1543–1547. [Google Scholar]
  22. Wu, J.; Wang, D.; Zhang, Y. Aerodynamic Analysis of a Flapping Rotary Wing at a Low Reynolds Number. AIAA J. 2015, 53, 2951–2966. [Google Scholar] [CrossRef]
  23. Wang, D.; Zhang, Y.; Wu, J.; Zhang, Y. Aerodynamics on Flapping Rotary Wing in Low Reynolds Number. Am. Inst. Aeronaut. Astronaut. 2013, 37, 1–14. [Google Scholar]
  24. Yang, L.J.; Huang, H.; Liou, J.; Esakki, B.; Chandrasekhar, U. 2D Quasi-Steady Flow Simulation of an Actual Flapping Wing. J. Unmanned Syst. Technol. 2015, 2, 10–16. [Google Scholar]
  25. Yang, L.; Feng, A.-L.; Lee, H.-C.; Esakki, B.; He, W. The Three-Dimensional Flow Simulation of a Flapping Wing. J. Mar. Sci. Technol. 2018, 26, 297–308. [Google Scholar]
  26. Li, H.; Guo, S.; Zhang, Y.L.; Zhou, C.; Wu, J.H. Unsteady aerodynamic and optimal kinematic analysis of a micro flapping wing rotor. Aerosp. Sci. Technol. 2016, 63, 1–19. [Google Scholar] [CrossRef] [Green Version]
  27. Zhao, C. Ultrasonic Motors Technologies and Applications; Springer: Berlin/Heidelberg, Germany, 2011. [Google Scholar]
  28. Liu, L.; Li, H.; Ang, H.; Xiao, T. Numerical investigation of flexible flapping wings using computational fluid dynamics/computational structural dynamics method. Proc. Inst. Mech. Eng. Part G J. Aerosp. Eng. 2018, 232, 85–95. [Google Scholar] [CrossRef]
  29. Granlund, K.O.; Ol, M.V.; Bernal, L.P. Unsteady pitching flat plates. J. Fluid Mech. 2013, 733, R5. [Google Scholar] [CrossRef]
  30. Ramesh, K.; Gopalarathnam, A.; Edwards, J.R.; Ol, M.V.; Granlund, K. An unsteady airfoil theory applied to pitching motions validated against experiment and computation. Theor. Comput. Fluid Dyn. 2013, 27, 843–864. [Google Scholar] [CrossRef]
  31. Taylor, G.K.; Nudds, R.L.; Thomas, A.L.R. Flying and swimming animals cruise at a Strouhal number tuned for high power efficiency. Nature 2003, 425, 707–711. [Google Scholar] [CrossRef]
  32. Ellington, C.P. The Aerodynamics of Hovering Insect Flight: II. Morphological Parameters. Philos. Trans. R. Soc. Lond. 1984, 303, 605–654. [Google Scholar] [CrossRef]
Figure 1. (a) Working principle; (b) driving mechanism of the flapping wing rotor.
Applsci 10 00412 g001
Figure 2. Schematic diagram of (a) the slider crank mechanism; and (b) the U-shape mechanism.
Applsci 10 00412 g002
Figure 3. Dimensions of the rectangle wings for the flapping wing rotor.
Applsci 10 00412 g003
Figure 4. Measurement of flapping frequency and rotational speed.
Applsci 10 00412 g004
Figure 5. Time-course curves of stroking, twisting, and rotary angles in three flapping periods.
Applsci 10 00412 g005
Figure 6. Trace line of the flapping wing rotor.
Applsci 10 00412 g006
Figure 7. Mesh used in the CFD calculation.
Applsci 10 00412 g007
Figure 8. Variation of flapping angles, twisting angles, and rotary angles in four periods.
Applsci 10 00412 g008
Figure 9. Comparison in lift coefficients and rotational moment coefficients between CFD calculation by fluent software and computational results by Wang et al.
Applsci 10 00412 g009
Figure 10. The flapping wing rotor (FWR) experimental model mounted on a load cell.
Applsci 10 00412 g010
Figure 11. (a) Experimental components; (b) measurement circuits for the FWR model.
Applsci 10 00412 g011
Figure 12. Force measurement of the FWR model in (a) 3 Hz case; (b) 3&1 Hz case.
Applsci 10 00412 g012aApplsci 10 00412 g012b
Figure 13. Lift force comparison between the experiment and CFD in (a) 3 Hz case; (b) 1 Hz case; (c) 3&1 Hz case.
Applsci 10 00412 g013
Figure 14. Comparison between lift curves of the flapping wing rotor measured in (a) 2 Hz case; (b) 3&2 Hz case.
Applsci 10 00412 g014
Figure 15. Variation of the flow pressure and vorticity during one flapping cycle in case 1.
Applsci 10 00412 g015
Figure 16. Variation of the pressure and vorticity in a flapping cycle in case 4.
Applsci 10 00412 g016
Figure 17. (a) Mechanical output curves of motor; (b) the relationship between lift and output power.
Applsci 10 00412 g017
Figure 18. The (a) rotational speeds; (b) lift forces; (c) the ratio between lift and power produced by the FWR in different installation angles.
Applsci 10 00412 g018aApplsci 10 00412 g018b
Figure 19. The lift efficiency and St number for the cases of installation angles 15°–30°.
Applsci 10 00412 g019
Table 1. Geometric parameters for the flapping wing rotor’s mechanism.
Variablesrl O A   ( O A ) A B   ( A B )
Dimensions (mm)63598
Table 2. Flapping frequency and corresponding rotational angular velocity.
Case No.Flapping Mode f d (Hz) f u (Hz) ψ ˙ (Hz)
1CFF332
2CFF221
3CFF110.41
4VFF311
5VFF321.67

