Article

Influence of Chromium Content on the Microstructure and Mechanical Properties of Thermomechanically Hot-Rolled Low-Carbon Bainitic Steels Containing Niobium

1
Materials and Mechanical Engineering, Centre for Advanced Steels Research, University of Oulu, P.O. Box 4200, 90014 Oulu, Finland
2
Steel Technology Department, Central Metallurgical Research and Development Institute (CMRDI), Helwan, Cairo 11421, Egypt
*
Author to whom correspondence should be addressed.
Appl. Sci. 2020, 10(1), 344; https://doi.org/10.3390/app10010344
Submission received: 5 December 2019 / Revised: 27 December 2019 / Accepted: 30 December 2019 / Published: 2 January 2020
(This article belongs to the Special Issue Recent Trends in Advanced High-Strength Steels)

Abstract

:

Featured Application

The current results can be used as a guideline for the production of high-strength low-carbon bainitic steels with high impact toughness.

Abstract

The effect of chromium content in the range of 1 wt.%–4 wt.% on the microstructure and mechanical properties of controlled-rolled and direct-quenched 12 mm thick low-carbon (0.04 wt.%) steel plates containing 0.06 wt.% Nb has been studied. In these microalloyed 700 MPa grade steels, the aim was to achieve a robust bainitic microstructure with a yield strength of 700 MPa combined with good tensile ductility and impact toughness. Continuous cooling transformation diagrams of deformed and non-deformed austenite were recorded to study the effect of Cr and hot deformation on the transformation behavior of the investigated steels. Depending on the cooling rate, the microstructures consist of one or more of the following microstructural constituents: bainitic ferrite, granular bainite, polygonal ferrite, and pearlite. The fraction of bainitic ferrite decreases with decreasing cooling rate, giving an increasing fraction of granular bainite and polygonal ferrite and a reduction in the hardness of the transformation products. Polygonal ferrite formation depends mainly on the Cr content and the cooling rate. In both deformed and non-deformed austenite, increasing the Cr content enhances the hardenability and refines the final microstructure, shifting the ferrite start curve to lower cooling rates. Preceding austenite deformation promotes the formation of polygonal ferrite at lower cooling rates, which leads to a decrease in hardness. In hot-rolled and direct-quenched plates, decreasing the Cr content promotes the formation of polygonal ferrite leading to an increase in the impact toughness and elongation but also a loss of yield strength.

1. Introduction

Thermomechanically controlled processing (TMCP) followed by direct quenching is considered the most powerful and effective processing route to obtain the best combination of the yield strength, good ductility, low-temperature toughness with a good hardenability in the low-carbon microalloyed steels [1]. The final microstructure of the hot-rolled steel is considered the key factor for getting the targeted combination of the mechanical properties and it is controlled by the quenching process following the TMCP. Hence, the microstructures and mechanical properties of low-carbon microalloyed steel can be improved significantly by designing a suitable accelerated cooling/direct quenching process, following the hot deformation schedule [2]. Depending on the chemical composition of the steel and the cooling path, the accelerated cooling rate may promote the formation of bainite with or without the formation of ferrite.
Low-carbon bainitic steels are used in many structural applications as a result of their good combinations of strength and toughness. Use of structural steels for weight critical applications such as mobile frames and crane booms is desirable to minimize the carbon footprint and save energy. Different alloying elements like Cr, Nb, Mo, and B are used to improve the strength and toughness through promoting the formation of bainite and refining the microstructure [3]. Bainitic ferrite and granular bainite represent the two main microstructure constituents in low-carbon bainitic steels and they are associated with distinct mechanical properties [4,5,6]. Cr is widely used to improve the hardenability and thereby promote the formation of bainite by suppressing the formation of high temperature transformation products [7,8,9,10,11,12,13,14].
The main objective of the current work is to develop a low-carbon steel with 700 MPa yield strength in combination with good ductility and toughness. To help reach this goal, the effect of Cr and preceding hot deformation of austenite on the continuous cooling transformation (CCT) diagrams of a candidate composition was studied. Following this, the effect of Cr on the microstructures, tensile properties, and impact toughness of hot-rolled and direct-quenched low-carbon bainitic steel plates was investigated.

2. Materials and Methods

2.1. Materials

Three 70 kg vacuum-cast ingots with the chemical composition given in Table 1 were produced at Outokumpu, Tornio, Finland. From the ingots, 200 × 80 × 55 mm (length, width, thickness) pieces were cut and soaked at 1250 °C for 2 h and then thermomechanically rolled with six passes to 12 mm thick plates from 55 mm thick slab. Final plate dimensions were approximately 1000 × 90 × 12 mm. The experimental thermomechanical process consists of several hot rolling passes in the recrystallized controlled regime followed by controlled rolling passes in the non-recrystallization regime (TNR). The temperature of the specimens was monitored during the rolling and direct quenching with the aid of thermocouples fixed in holes drilled to the centers of the pieces before hot rolling. The finish rolling temperature (FRT) was controlled to be about 880 °C, which was followed by direct quenching in a water tank with a cooling rate (CR) of about 40–50 °C/s as measured in the centers of the specimens.

2.2. CCT Diagrams

A Gleeble 3800 thermomechanical simulator (Dynamic Systems Inc., Poestenkill, NY, USA) was used to get the dilatation curves required to construct continuous cooling transformation (CCT) diagrams and deformation continuous cooling transformation (DCCT) diagrams. Small cylindrical samples were machined with a diameter of 5 mm and a length of 7.5 mm for the Gleeble simulation tests. In order to get the dilatation curves to determine the critical transformation temperatures Ac1 and Ac3, the samples were heated at 10 °C/s to 1100 °C, held for 180 s, and then quenched. To get the dilatation curves for CCT diagrams, specimens were heated at 10 °C/s to 1100 °C, held for 180 s, and then quenched at different cooling rates (CRs) ranging from 2 to 80 °C/s as shown in Figure 1a. To obtain the dilatation curves for DCCT diagrams, the specimens were heated at 10 °C/s to 1100 °C, held for 180 s, cooled at 2 °C/s to 880 °C, held there for 15 s, given a compressive deformation with a total strain of 0.6 and a strain rate of 1 s−1, held for 20 s, and finally cooled at different rates in the range of 2–80 °C/s to room temperature (see Figure 1b).

2.3. Microstructure Characterization

For the thermomechanical simulation specimens, Figure 2 shows the selected section for all further investigations. All specimens were ground to the selected section and polished following standard procedures. Then, depending on the CR, samples were etched for 15–50 s in fresh 10% nital.
Specimens from hot-rolled plates were ground, polished, and etched in 2% nital. An additional polishing step was done using 0.04 µm silica for EBSD analysis. Microstructures were examined using laser scanning confocal microscopy (LSCM, VK-X200 Keyence Ltd.) and Zeiss Sigma field emission scanning electron microscopy (Carl Zeiss AG, Oberkochen, Germany) with EDAX-OIM acquisition and analysis software (7.1.0, Amatek Inc., Berwyn, PA, USA). Electron backscatter diffraction (EBSD) analyses using Zeiss Sigma FESEM, were carried out on hot-rolled specimens using 15 kV accelerating voltage with a 0.2 µm step size.

2.4. Mechanical Properties Characterization

For the tensile properties, longitudinal flat tensile specimens, 11.7 mm thick, 20 mm wide, and with a parallel length of 120 mm, were tested at room temperature according to the standard SFS-EN 10002-1 using an MTS 810 mechanical testing machine fitted with a 100 kN load cell (MTS systems, Eden Prairie, MN, USA). The results are the means of three specimens for each steel composition.
The 28 J Charpy V transition temperatures (T28J) of the rolled plates were determined using two standard (10 × 10 × 55 mm) Charpy V-notch impact test specimens per test temperature for both the longitudinal and transverse directions. Tests were made at temperatures in the range of −120 to +20 °C using a 300 J Charpy testing machine. The fracture surfaces of Charpy V impact samples broken at room temperature (20 °C) were examined using a Zeiss Sigma FESEM at 8 kV accelerating voltage at a working distance of 8.5 mm.
Hardness was measured using a Struers Duramin-A300 (Struers A/S, Ballerup, Denmark) macro-hardness tester at five random positions across the thermomechanical simulation specimens, while for the hot rolled specimens, a representative hardness value was obtained from the mean of five sets of seven suitably spaced hardness impressions through the thickness.

3. Results and Discussion

3.1. CCT and DCCT Diagrams

Figure 3 shows CCT and DCCT diagrams constructed on the basis of the results of dilatation curves, microstructures, and macrohardness values. Increasing the Cr content from 2.5 wt.% to 4 wt.% led to an increase in Ac1 by about 35 °C, otherwise it has no effect on the critical transformation temperatures. LSCM and SEM micrographs of the final transformation products formed from non-deformed and deformed austenite after cooling at 2 and 80 °C/s are shown in Figure 4, Figure 5, Figure 6 and Figure 7.
For Steel I, with the lowest Cr content, the preceding hot deformation had a great effect on the microstructural constituents (see Figure 3a,b and Figure 4a,d, Figure 5a,d, Figure 6a,d and Figure 7a,d). In the case of the non-deformed condition, the microstructure was a mixture of bainitic ferrite (BF) and granular bainite (GB) over a wide range of CRs. Deforming the austenite changed the microstructure to fully polygonal ferrite (PF) at all the investigated CRs, apart from the appearance of a very small fraction of pearlite at CRs in the range of 2–20 °C/s (Figure 6d) which could not be detected from the dilatation curves. These changes had a clear impact in the hardness of the specimens.
For Steel II (Figure 3c,d, Figure 4b,e, Figure 5b,e, Figure 6b,e and Figure 7b,e), depending on the CR, BF, GB, and PF were observed in the non-deformed and deformed conditions. Again, a small fraction of pearlite which could not be detected in the dilatation curve was found for CRs in the range of 2–10 °C/s. Here too, preceeding hot deformation caused a drop in hardness.
For Steel III (Figure 3e,f, Figure 4c,f, Figure 5c,f, Figure 6c,f and Figure 7c,f), increasing the CR refined the microstructure, promoted the formation of BF and suppressed the formation of the high-temperature transformation products, i.e., GB and PF, in the case of both the non-deformed and deformed conditions. However, in the case of deformed austenite, the formation of BF requires a higher CR than is needed for undeformed austenite. For both non-deformed and deformed austenite, irrespective of the microstructural constituents, CR has little effect on the transformation temperatures and hardness.

3.2. Influence of Cr Content on the CCT and DCCT Diagrams and Hardness

As commonly observed [13,14,15,16,17], the hardenability of the present steels increases with increasing Cr content. This shows as a lowering of transformation temperatures in both CCT and DCCT diagrams as the Cr content increases, see Figure 8, which promotes the formation of the low-temperature transformation product BF and reduces the formation of the transformation products that form at relatively high temperatures, i.e., PF and GB.
As can be seen from Figure 9, the effect of the preceding hot deformation on the transformation products is decreased with increasing Cr content. In the case of Steel I, with the lowest Cr content (1 wt.%), prior hot deformation had a great effect on the transformation curves which shifted to significantly higher temperatures as a result of ferrite formation. This caused a significant drop in hardness as can be seen from Figure 10. This behavior results from the dislocation substructure formed in the austenite after deformation in the non-recrystallization region, which provides nucleation sites and diffusional paths for the diffusional transformation products [18,19]. In the case of Steel II (2.5 wt.% Cr), the preceding hot deformation shifted the transformation curves of ferrite to higher CRs, while Bs shifted to lower temperatures. These changes led to an increase in the formation of PF and GB, while the formation of BF was reduced even at high CRs. However, in the case of Steel III with the highest Cr content (4.0 wt.%), the effect of the preceding hot deformation on the transformation temperatures and products became very small. The transformation curves were shifted to slightly lower temperatures, but this effect decreased with increasing cooling rate. Austenite deformation increased the fraction of GB somewhat at the lower CRs. The insensitivity to deformation also reflected in the final hardness as a function of cooling rate as shown in Figure 10.
At all CRs, the hardness values increased with increasing the Cr content (Figure 10). This is due to the higher solid solution strengthening combined with the lower transformation temperatures which refine the microstructure significantly (see Figure 6a–c). Overall, it can be concluded that austenite deformation with a high Cr content lowers the transformation temperatures, while transformation temperatures are increased in the case of low Cr contents.

3.3. Microstructure of the Hot Rolled and Direct-Quenched Steel Plates

The microstructures of the hot rolled and direct-quenched steel plates have been examined in order to evaluate the effect of Cr content in the case of laboratory scale rolling. As a result of the accelerated cooling, the microstructure of the three steel plates consists mainly of one or more of the following microstructural components: BF, GB, PF, and coalesced bainite (CB) (see Figure 11). Figure 12 shows inverse pole figures (IPF) with superimposed image quality (IQ) maps, grain boundary misorientation distributions, and grain sizes. The effective grain was determined as the equivalent circle diameters (ECD) of grains surrounded by boundaries having misorientation angles >15°. The effective high-angle grain sizes at the 90th percentile in the cumulative grain size distribution (D90%) were also determined. The grain boundary misorientation distribution of Steel I, with the lowest Cr content, supports the LSCM and SEM observations that Steel I consisted mainly of GB with a large fraction of PF. Steel I also had a large mean effective grain size and D90%. Increasing the Cr content to 2.5 wt.% in case of Steel II led to an increase in the hardenability, an increase in the fraction of BF, and a reduction in the fraction of GB and PF, which are associated with reductions in the mean effective grain size from 2.66 to 2.12 µm and D90% from 30.85 to 24.35 µm. The frequency of misorientation at about 58° increased compared to that of Steel I. With the further increase in the Cr content in the case of Steel III, the hardenability increased significantly, which promoted the formation of BF and suppressed the formation of PF and GB. This was associated with further reductions in the mean effective grain size from 2.12 to 1.86 µm and D90% from 24.35 to 17.12 µm, together with a further increase in the frequency of misorientation at about 58° compared to that of Steel II.
In summary, increasing the Cr content was associated with a significant change in the microstructural components, an increasing grain boundary misorientation frequency at about 58°, and a reduction in the mean effective grain size and D90%.

3.4. Mechanical Properties

The variation in the tensile properties, mean hardness values, and 28J transition temperatures (T28J) estimated from the impact tests are given in Table 2 and Figure 13. In addition, the through-thickness hardness profiles and impact transition curves are shown in Figure 14.
Both Steels II (2.5 Cr) and III (4 Cr) were able to provide the targeted 700 MPa level of yield strength, which is a widely used strength class among high-strength structural steels [20]. Steel I (1 Cr) provided a lower yield strength of 560 MPa with a high elongation to fracture as a result of the formation of PF. The higher impact toughness of Steel I (1 Cr), in respect to higher upper shelf energy and lower T28J temperature compared to Steels II (2.5 Cr) and III (4 Cr) resulted from the presence of PF and GB, which contains martensite-austenite (M/A) islands (see Table 2 and Figure 14). It is well known that the presence of PF enhances the toughness properties [4]. On the other hand, the presence of M/A constituents in the lath-like granular bainite is detrimental to impact toughness [21]. Figure 15 shows that despite a refinement of the effective mean and 90th percentile grain size, increasing the Cr content was associated with poorer impact toughness, i.e., higher T28J. Presumably this is due to the combined detrimental effects caused by an increase in the fraction of BF and higher yield and tensile strength.
The adverse effect of the high fraction of PF (see Figure 11a) on the hardness in Steel I can be seen clearly in Figure 14a. As mentioned above, increasing the Cr content enhanced the hardenability, promoted the formation of the low-temperature transformation product BF, and hindered the formation of the high-temperature transformation products PF and GB, thereby enhancing the hardness in the case of Steels II and III (see Table 2) [22]. Moreover, due to the higher hardenability of the high-Cr steels, the hardness was fairly uniform throughout the plate thickness as shown in Figure 14a.
As can be seen in Figure 16, there is a correlation between the yield strength and T28J. It can be seen that the targeted yield strength could still be achieved with good impact toughness in the hot-rolled and direct-quenched plates when the Cr content was in the range of 2.5 wt.%–4 wt.%, but not in the case of the lowest Cr content (1 wt.%) due to the formation of a significant fraction of PF which improved the impact toughness and tensile elongation to fracture, but at the expense of the yield strength.

3.5. Fractography

Figure 17 shows fractographs of selected areas from the Charpy V impact samples at room temperature (20 °C). An effect of the Cr content on the fractography of the impact samples can be clearly observed. In the case of Steel I (1 Cr) (Figure 17a,b), the fracture surface consisted mainly of elongated dimples due to the microvoid coalescence associated with ductile fracture. In Steels II and III with the higher Cr content of 2.5 wt.% and 4 wt.%, the fracture surface consisted mainly of many small dimples with less ductility compared to that of Steel I (see Figure 17c–f, respectively). These results are in line with the value of upper shelf energy (USE) given in Table 2 which illustrates the closeness of the USE of Steels II and III in contrast to Steel I.

4. Conclusions

Thee experimental steels were designed based on (in wt.%) 0.04C-0.2Si-1.0Mn-0.06Nb with 1 wt.%, 2.5 wt.%, and 4 wt.% Cr and processed through laboratory hot rolling followed by direct quenching. The effect of the Cr content on the continuous cooling transformation (CCT) diagram and deformation continuous cooling transformation (DCCT) diagram was studied. A Gleeble 3800 thermomechanical simulator was employed to determine the dilatation curves for the CCT and DCCT diagrams. In addition, the effect of the Cr content on the final microstructure and mechanical properties of the hot-rolled and direct-quenched materials was studied. The following conclusions can be drawn.
  • In the case of non-strained austenite, the microstructure consists mainly of bainitic ferrite at high CRs, a mixture of bainitic ferrite with granular bainite at intermediate CRs, and polygonal ferrite with granular bainite at the lowest CRs. Increasing the Cr content and CRs refined the microstructure significantly. In addition, increasing the Cr content led to an increase in the hardenability, i.e., a decrease in transformation temperatures, as well as the promotion of bainite at the expense of the high-temperature transformation products like polygonal ferrite and granular bainite.
  • In the low-Cr steel, deformation of austenite below its recrystallization temperature has a large effect on the final microstructural constituents, changing the microstructure completely to ferrite at all the investigated CRs and causing a large drop in hardness relative to the non-deformed case. However, this effect decreased with increasing the Cr content.
  • To get a fully bainitic microstructure in the case of deformed austenite, the Cr content should be in the range of 2.5 wt.%–4 wt.%, and the CR should be higher than 20 °C/s.
  • In the case of the 12 mm thick hot-rolled and direct-quenched steel plates, the microstructure consisted mainly of different types of bainite, i.e., bainitic ferrite, granular bainite, and coalesced bainite. A significant amount of polygonal ferrite only appears at the lowest Cr level, i.e., 1 wt.%. Increasing the Cr content led to an increase in the hardness owing to an enhanced hardenability.
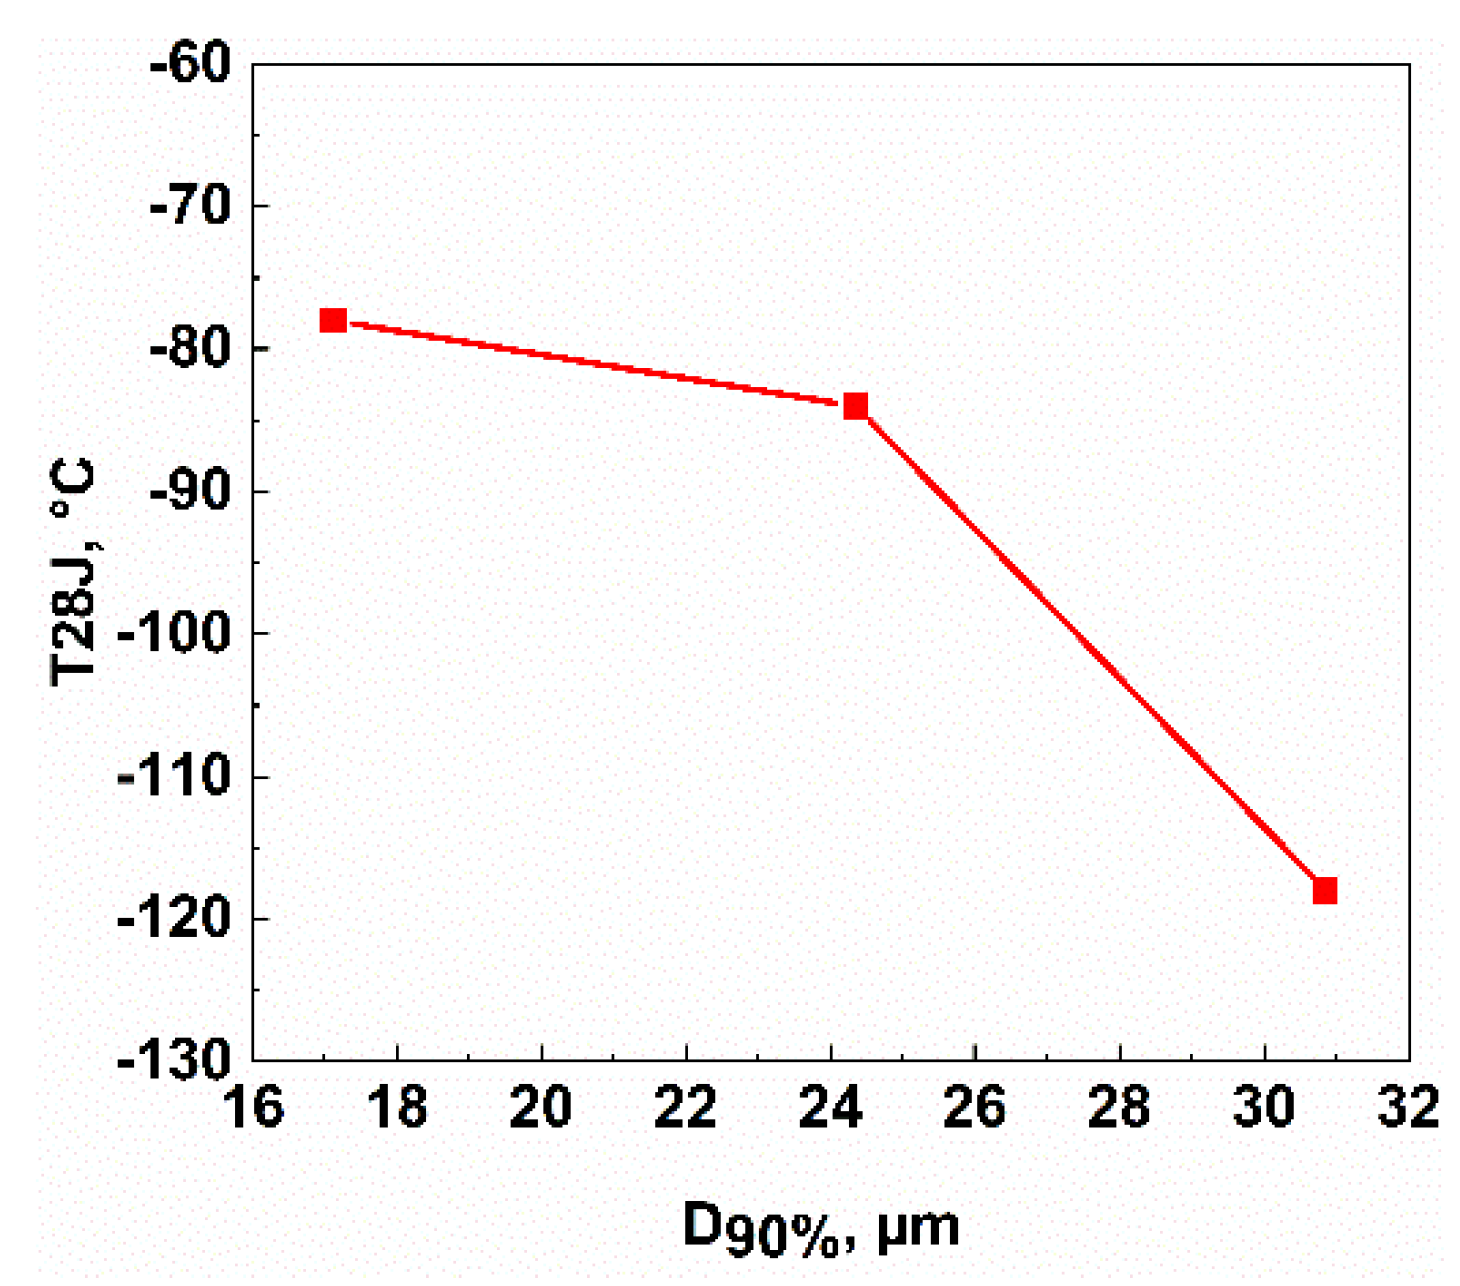
  • The targeted 700 MPa yield strength with good ductility and toughness were achieved in the hot-rolled and direct-quenched plates with Cr content in the range of 2.5 wt.%–4 wt.%, but not achieved with the lowest Cr content (1 wt.%) due to the presence of a significant fraction of polygonal ferrite, which increased the impact toughness and elongation at the expense of the yield strength.

Author Contributions

Writing—review and editing, M.A., T.N., A.K., J.H. and D.P.; supervision, D.P. and J.K. All authors have read and agreed to the published version of the manuscript.

Funding

This research was funded by CBMM (Companhia Brasileira de Metalurgia e Mineracao).

Conflicts of Interest

The authors declare no conflict of interest.

References

  1. Xie, H.; Du, L.-X.; Hu, J.; Misra, R.D.K. Microstructure and Mechanical Properties of a Novel 1000MPa Grade TMCP Low Carbon Microalloyed Steel with Combination of High Strength and Excellent Toughness. Mater. Sci. Eng. A 2014, 612, 123–130. [Google Scholar] [CrossRef]
  2. Bandyopadhyay, P.S.; Ghosh, S.K.; Kundu, S.; Chatterjee, S. Evolution of Microstructure and Mechanical Properties of Thermomechanically Processed Ultrahigh-Strength Steel. Metall. Mater. Trans. A 2011, 42, 2742–2752. [Google Scholar] [CrossRef]
  3. Hu, H.; Xu, G.; Zhou, M.; Yuan, Q. Effect of Mo Content on Microstructure and Property of Low-Carbon Bainitic Steels. Metals 2016, 6, 173. [Google Scholar] [CrossRef] [Green Version]
  4. Krauss, G.; Thompson, S.W. Ferritic Microstructures in Continuously Cooled Low- and Ultralow-carbon Steels. ISIJ Int. 1995, 35, 937–945. [Google Scholar] [CrossRef]
  5. Lan, H.; Du, L.; Zhou, N.; Liu, X. Effect of Austempering Route on Microstructural Characterization of Nanobainitic Steel. Acta Metall. Sin. Engl. Lett. 2014, 27, 19–26. [Google Scholar] [CrossRef]
  6. Yang, X.L.; Xu, Y.B.; Tan, X.D.; Yu, Y.M.; Wu, D. Microstructures and Mechanical Properties of High Strength Low Carbon Bainitic Steel. Mater. Sci. Forum 2015, 817, 257–262. [Google Scholar] [CrossRef]
  7. Caballero, F.G.; Bhadeshia, H.K.D.H.; Mawella, K.J.A.; Jones, D.G.; Brown, P. Design of Novel High Strength Bainitic Steels: Part 1. Mater. Sci. Technol. 2001, 17, 512–516. [Google Scholar] [CrossRef]
  8. Caballero, F.G.; Bhadeshia, H.K.D.H.; Mawella, K.J.A.; Jones, D.G.; Brown, P. Design of Novel High Strength Bainitic Steels: Part 2. Mater. Sci. Technol. 2001, 17, 517–522. [Google Scholar] [CrossRef] [Green Version]
  9. Caballero, F.G.; Bhadeshia, H.K.D.H. Very Strong Bainite. Curr. Opin. Solid State Mater. Sci. 2004, 8, 251–257. [Google Scholar] [CrossRef] [Green Version]
  10. Caballero, F.G.; Santofimia, M.J.; García-Mateo, C.; Chao, J.; de Andrés, C.G. Theoretical Design and Advanced Microstructure in Super High Strength Steels. Mater. Des. 2009, 30, 2077–2083. [Google Scholar] [CrossRef] [Green Version]
  11. Hasan, H.S.; Peet, M.J.; Avettand-Fènoël, M.-N.; Bhadeshia, H.K.D.H. Effect of Tempering upon the Tensile Properties of a Nanostructured Bainitic Steel. Mater. Sci. Eng. A 2014, 615, 340–347. [Google Scholar] [CrossRef] [Green Version]
  12. Yao, Z.; Xu, G.; Hu, H.; Yuan, Q.; Tian, J.; Zhou, M. Effect of Ni and Cr Addition on Transformation and Properties of Low-Carbon Bainitic Steels. Trans. Indian Inst. Met. 2019, 72, 1167–1174. [Google Scholar] [CrossRef]
  13. Zhou, M.; Xu, G.; Tian, J.; Hu, H.; Yuan, Q. Bainitic Transformation and Properties of Low Carbon Carbide-Free Bainitic Steels with Cr Addition. Metals 2017, 7, 263. [Google Scholar] [CrossRef]
  14. Tian, J.; Xu, G.; Zhou, M.; Hu, H.; Wan, X. The Effects of Cr and Al Addition on Transformation and Properties in Low-Carbon Bainitic Steels. Metals 2017, 7, 40. [Google Scholar] [CrossRef]
  15. Kong, L.; Liu, Y.; Liu, J.; Song, Y.; Li, S.; Zhang, R.; Li, T.; Liang, Y. The Influence of Chromium on the Pearlite-Austenite Transformation Kinetics of the Fe–Cr–C Ternary Steels. J. Alloys Compd. 2015, 648, 494–499. [Google Scholar] [CrossRef]
  16. Zhang, G.-H.; Chae, J.-Y.; Kim, K.-H.; Suh, D.W. Effects of Mn, Si and Cr addition on the Dissolution and Coarsening of Pearlitic Cementite during Intercritical Austenitization in Fe-1mass%C alloy. Mater. Charact. 2013, 81, 56–67. [Google Scholar] [CrossRef]
  17. Siwecki, T.; Eliasson, J.; Lagneborg, R.; Hutchinson, B. Vanadium Microalloyed Bainitic Hot Strip Steels. ISIJ Int. 2010, 50, 760–767. [Google Scholar] [CrossRef] [Green Version]
  18. Opiela, M.; Zalecki, W.; Grajcar, A. Influence of Plastic Deformation on CCT-Diagrams of New-Developed Microalloyed Steel. J. Achiev. Mater. Manuf. Eng. 2012, 51, 78–89. [Google Scholar]
  19. Zhao, M.-C.; Yang, K.; Xiao, F.-R.; Shan, Y.-Y. Continuous Cooling Transformation of Undeformed and Deformed Low Carbon Pipeline Steels. Mater. Sci. Eng. A 2003, 355, 126–136. [Google Scholar] [CrossRef]
  20. The High-Strength Structural Steel at 700 MPa. Available online: https://www.ssab.com/products/brands/strenx/products/strenx-700-mc (accessed on 2 September 2019).
  21. Bhadeshia, H.K.D.H. Local Brittle Zones and the Role of Niobium. Mater. Sci. Forum 2014, 783–786, 2129–2135. [Google Scholar] [CrossRef] [Green Version]
  22. Lee, H.; Lee, H. Effect of Cr Content on Microstructure and Mechanical Properties of Low Carbon Steel Welds. Int. J. Electrochem. Sci. 2015, 10, 8028–8040. [Google Scholar]
Figure 1. Gleeble thermomechanical simulator procedures for obtaining continuous cooling transformation (CCT) diagrams (a) and deformation continuous cooling transformation (DCCT) diagrams (b).
Applsci 10 00344 g001
Figure 2. Selected section of investigation for the samples after thermomechanical simulation.
Applsci 10 00344 g002
Figure 3. CCT (a,c,e) and DCCT (b,d,f) diagrams for Steels I (a,b), II (c,d), and III (e,f). Abbreviations: BF = bainitic ferrite, GB = granular bainite, and PF = polygonal ferrite.
Applsci 10 00344 g003aApplsci 10 00344 g003b
Figure 4. Laser scanning confocal microscopy (LSCM) micrographs of Steel I (a,d), II (b,e), and III (c,f) without austenite deformation after cooling at 80 and 2 °C/s, respectively. Abbreviations: BF = bainitic ferrite, GB = granular bainite, and PF = polygonal ferrite.
Applsci 10 00344 g004
Figure 5. Scanning electron microscopy (SEM) micrographs of Steel I (a,d), II (b,e), and III (c,f) without austenite deformation after cooling at 80 and 2 °C/s, respectively. Abbreviations: BF = bainitic ferrite, GB = granular bainite, and PF = polygonal ferrite.
Applsci 10 00344 g005
Figure 6. Laser scanning confocal microscopy (LSCM) micrographs of Steel I (a,d), II (b,e), and III (c,f) with austenite deformation after cooling at 80 and 2 °C/s, respectively. Abbreviations: BF = bainitic ferrite, GB = granular bainite, PF = polygonal ferrite, and P = pearlite.
Applsci 10 00344 g006
Figure 7. Scanning electron microscopy (SEM) micrographs of Steel I (a,d), II (b,e), and III (c,f) with austenite deformation after cooling at 80 and 2 °C/s, respectively. Abbreviations: BF = bainitic ferrite, GB = granular bainite, PF = polygonal ferrite, and P = pearlite.
Applsci 10 00344 g007
Figure 8. Influence of Cr content on the transformation temperatures for CCT diagrams (a) and DCCT diagrams (b). Abbreviations: Fs = ferrite start temperature, Ff = ferrite finish temperature, Bs = bainite start temperature, and Bf = bainite finish temperature.
Applsci 10 00344 g008
Figure 9. Influence of austenite deformation on CCT curves for a Cr content of 1 wt.% (a), 2.5 wt.% (b), and 4 wt.% (c). CCT curves bold and DCCT curves dotted. Abbreviations: Fs = ferrite start temperature, Ff = ferrite finish temperature, Bs = bainite start temperature, and Bf = bainite finish temperature.
Applsci 10 00344 g009
Figure 10. Influence of CR, Cr content, and prior hot deformation on hardness.
Applsci 10 00344 g010
Figure 11. Typical LSCM and inlens SEM micrographs of the investigated hot-rolled and direct-quenched plates. PF and GB in Steel I (a,d), BF and PF in Steel II (b,e), and BF and CB in Steel III (c,f). Abbreviations: BF = bainitic ferrite, GB = granular bainite, PF = polygonal ferrite, and CB = coalesced bainite.
Applsci 10 00344 g011
Figure 12. Inverse pole figures (IPF) with superimposed image quality (IQ) maps of hot-rolled and direct-quenched steel plates for Steel I (a), Steel II (b), Steel III (c). Grain boundary misorientations are given in (d) and mean effective grain sizes and D90% in (e).
Applsci 10 00344 g012
Figure 13. Effect of Cr content on the hardness, yield and ultimate tensile strength (a) and elongation and 28J transition temperature (b).
Applsci 10 00344 g013
Figure 14. Through-thickness profile (a) and Charpy V impact transition curves (b).
Applsci 10 00344 g014
Figure 15. Relationship between effective high-angle grain sizes at the 90th percentile in the cumulative size distribution (D90%) and the 28-joule transition temperature (T28J).
Applsci 10 00344 g015
Figure 16. Relationship between yield strength and 28 joule transition temperature.
Applsci 10 00344 g016
Figure 17. SEM images showing fractographs of the impact fracture surface after testing at room temperature (20 °C) for Steel I (a,b), Steel II (c,d), and Steel III (e,f).
Applsci 10 00344 g017
Table 1. Chemical composition of the investigated steels.
Steel CodeCSiMnCrNb
Steel I (1 Cr)0.0410.2111.021.00.065
Steel II (2.5 Cr)0.0410.1680.952.50.066
Steel III (4 Cr)0.0360.1540.924.00.064
Table 2. Mechanical properties of the investigated steels.
Steel CodeYS 1, MPaUTS 1, MPaEl 1, %Hardness 2, HVT28J (°C)USE J/cm2YS/UTSUTS*El (MPa *%)
Steel I (1 Cr)560 ± 7756 ± 217 ± 0252 ± 6−1183180.7413034
Steel II (2.5 Cr)699 ± 3909 ± 414 ± 0292 ± 7−842700.7712852
Steel III (4 Cr)780 ± 9982 ± 812 ± 0312 ± 7−782650.7912238
1 Error bars are standard deviations of three measurements. 2 Error bars are standard deviations of 35 measurements through the thickness. Definitions: YS = yield strength, UTS = ultimate tensile strength, El = total elongation, T28J = 28J transition temperatures, USE = upper shelf energy.

