Article

Factors Affecting Purchase Intentions in Generation Y: An Empirical Evidence from Fast Food Industry in Malaysia

1
Graduate School of Business, Universiti Sains Malaysia, Penang 11800, Malaysia
2
School of Management, Universiti Sains Malaysia, Penang 11800, Malaysia
*
Author to whom correspondence should be addressed.
Adm. Sci. 2019, 9(1), 4; https://doi.org/10.3390/admsci9010004
Submission received: 19 September 2018 / Revised: 17 December 2018 / Accepted: 21 December 2018 / Published: 31 December 2018

Abstract

:
The purpose of the present study was to investigate the factors that influence the purchase intentions of Generation Y students towards the fast food industry in Nilai, Malaysia. Nowadays, purchase intentions are an important aspect of organizational long-term success in the fast food industry. In addition, purchase intentions are the critical element in competing with other competitive environments; hence, it is important for the fast food industry to pay a significant attention to this matter. The present study was conducted to identify the key determinants that impact the purchase intention of Generation Y students towards the fast food industry in Nilai, Malaysia. Employing the quantitative method in this study, a total of 313 questionnaires were distributed with the response rate of 91%. Another purpose of this study was to provide important insights to Nilai fast food restaurants in understanding the purchase intentions of customers. Therefore, the leaders and managers of Nilai local fast food restaurants can enhance customers’ experience, solve their problems, and ultimately obtain high quality business by understanding the key factors of purchase intentions in fast food industry.

1. Introduction

Fast food is known to be a frequent selection, convenient for customers, tasty, and have a reasonable price. In the current era, fast food is well known for its reasonable price, efficiency, and tastiness. Moreover, advertisers of fast food restaurants usually make the fast food to appear healthy, which causes the customers to be easily influenced. Goyal and Singh (2007) declared that fast food is the fastest emerging food category in the world. A possible explanation for this might be that fast food involves rapidly subsequently subscribing as well as minimal service subscribing for dining and takeout facilities. A food that can be serviced and prepared quickly is considered a fast food. The primary reason that influences the customers to choose a quick meal over a home-cooked meal is due to their busy lifestyle, especially the dual-working families with kids (Atkins and Bowler 2001). This was further supported by Habib et al. (2011) who agreed with the notion that limited time of the customers has caused them to resort to fast food as a result of long working hours, busy lifestyle, career, and family. Hence, the fast food industry in Malaysia has been the most preferred choice for majority of the customers due to the instant preparation of the meal which allows them to eat within a short period of time. Therefore, the changing lifestyle of customers has provided the food industry in Malaysia with an opportunity to further expand their businesses.
According to Habib et al. (2011), the fast food industry in Malaysia is dominated by American franchises which include A&W, Burger King, Domino’s Pizza, Kentucky Fried Chicken (KFC), MarryBrown, McDonald’s, Pizza Hut, and Subway. These fast food trademarks have acquired prestigious recognition in the process of Malaysian Generation. Meanwhile, the Malaysia Population (2018) affirmed that Generation Y students make up the largest segment in the entire Malaysia’s population which consists of 12.67 million citizens. Generation Y students have strong purchasing power and they are regarded as the key market segment due to their lifestyle and eating habits that influence their preference on the fast food industry. Moreover, Generation Y is always eating out and having takeout food from the fast food restaurant; hence, they are always looking for facilities production that can fulfill the demand of their generation. Therefore, the current research regarded Generation Y students as the appropriate target population for this study.
The intention of the current research was to understand the factors affecting the purchase intentions of Generation Y students towards fast food industry in Nilai, Malaysia. Apart from that, the present study analyzed whether and how the factors affect Generation Y students in purchasing fast food. In this case, it is worth to note that the fast food industry in Nilai, Malaysia as well as other industries in Malaysia have been confronted with increasing number of competitive challenges. On a more important note, the fast food industries in Malaysia have been expanding over the last decade. Malaysians are extremely attached to fast food such as hamburger, fried chicken, chips, and others despite knowing that they are unhealthy junk food containing high calories. On a similar note, Generation Y students still prefer to purchase fast food; hence, the present study aimed to determine the key factors that affect the purchase intentions of Generation Y students towards fast food. Therefore, the current research explored the relationship between food quality, service quality, price, and restaurant environment with the purchase intentions of Generation Y students in Malaysia.

2. Literature Review

2.1. Fast Food

The term “fast food” does not have an established definition. Nevertheless, it can generally be described as foods that are served on demand and instantly. According to the Ministry of Health Malaysia, fast food is defined as “foods that are intended in large quantities, fast food restaurants are following standardized procedures and served rapidly in restaurants commonly, use the electronic and print media to advertise the services”. Fast foods frequently contain high number of calories, sugar, and fat. In this area for much of the research and policy are considers individual foods. In regard to this, it should be noted that the “approved scale of unhealthy foods on a menu” has not been established, but the fast food channels seem to have extended the list of their menu by incorporating healthy eating alternatives. More importantly, there is an evolving benefit in the attempt of limiting fast food channels that are believed to help preserve and boost society healthy (Darian and Tucci 2011).

2.2. Fast Food Industry in Nilai, Malaysia

The fast food industry in Malaysia is made of a diverse range of food outlets that offer multiple distinctive dishes ranging from local to international. However, traditional fast food meals include burgers, fried chips, and sugar-sweetened beverages. The fast food franchising sector takes up about 32% which represent a total of 6000 fast food outlets in Malaysia, while the QSR (Quick Service Restaurant) or fast food market was valued at $493 million (RM1.8 billion) locally.
At present, the largest foreign franchise operators are McDonalds and KFC which have managed to set up a high number of franchise outlets in Malaysia. However, KFC is the fast food brand that firstly entered the Malaysia market in the year 1973. In regard to this, KFC has allocated a total of 447 outlets and 46/5 market share in the fast food or QSR market in order to adapt with the development of the fast food industry. The top performers in fast food retaining stores are KFC (46%), followed by McDonalds (25%), and Pizza Hut (14%). Meanwhile, it is important to note that Muslims make up the largest population in Malaysia despite the fact that Malaysia is a multiracial and multi-religious country.

2.3. Purchase Intentions

Purchase intention promotes more profitable businesses to the industry, particularly when customers are satisfied with the production. Hence, purchase intention has been regarded as one of the most significant sections in the business field. Generally, customer satisfaction is described as how customers assess production after utilizing a product as well as how they estimate the services of production by comparing it with products from other companies that are in the same industry. On another note, purchase intention is responsible in determining if a product meets customers’ expectations and need in order to further explore their assessment on goods and services. This notion claims that customers will be more satisfied when the field of production and services meets the customers’ expectations. On the other hand, customers will be more dissatisfied if the performance of production is less than their expectations. More importantly, purchase intention is the key to promote a long-term business success which helps to keep customers and collect CLV (customer lifetime value).
A firm must recognize the factors that significantly influence purchase intention. The factors include food quality, staff service, competitive price, and accuracy of bills. Meanwhile, a number of researchers present the importance of quality and its positive correlation with purchase intention considering that a well-known food quality will influence the retention of customers. In this case, a considerable amount of literature point out that a customer is satisfied by excellent service. Ma and Yang (2018) argued that a customer will also be satisfied if the product they receive is made of a good quality. Excellent service focuses on empowerment, innovation, and making employees’ part of attitude and behaviors. In addition, organizational employees play a vital role in purchase intention.
It is important to determine purchase intention because it is hard to assess customers’ expectations, while businesses only tend to recognize it after the product has already been transferred. Purchase intention has a primary responsibility in businesses considering that it is a significant tool in safeguarding a competitive advantage despite the difficulty and the cost involved in the process. Apart from that, a high level of purchase intention will be able to build profitable relationship with customers. Furthermore, there is a prediction regarding the need to preserve an existing customer because it is cheaper than attracting new customer. Therefore, employers frequently exploit new production and focus more on quality by upgrading their services from time to time in order to preserve the existing customers which are deemed to be the most significant aspect in businesses.

2.4. Food Quality

According to Sulek and Hensley (2014), food quality is one of the most crucial parts in dining experience. Food quality is a major factor that influences the purchase intention in regard to the choice of restaurants. On a similar note, Susskind and Chan (2000) discovered that food quality is the key stator that promotes customers to visit fast food restaurant. Food quality is considered as a crucial estimator for fast food dining restaurants in ensuring customer loyalty. Sulek and Hensley (2014) agreed by stating that food quality is the most significant component of purchase intention provided that the environment components and service quality are contrasted by other fields of the restaurant. Furthermore, the positive relation between food quality and satisfaction would influence the purchase intention of customers.
There are several aspects of food quality that need to be considered in investigating the influence of excellent food on purchase intention which include nutrition, menu variety, and tastiness of food. Moreover, Raajpoot (2002) added that variety of food, menu design, serving size, and food presentation in the food service industry are important determinants of food quality. Therefore, it is extremely important to take into account about the halal consumption of food its cleanliness in the context of Malaysia because the majority of the population is Muslim.

2.5. Restaurant Environment

In today’s world, it is undeniably true that individuals prefer to have meals outside more frequently. Customers, nowadays, are willing to spend a premium to help them save time and have a better meal environment. These factors stimulate restaurateurs to emphasize their effort in designing and offering a more comfortable environment for customers. Ryu and Jang (2008) found that restaurant environment a significant antecedent of customers’ pleasure, arousal and behavioral intention in an upscale restaurant context. A considerable amount of studies have demonstrated that it is necessary to make the ambience more pleasant and innovative to ensure the success of a company. Moreover, it was also discovered that the ambience of a fast food restaurant is regarded to be more important than the fast food itself. Hence, the current research postulated that establishing the ambience of fast food restaurants is the single most significant attribute because it is always perceived to be more important than the food served. The environment of a restaurant will establish the expectation of customers as a result of the dining experience before the fast food is served. Food quality and services quality further strengthen the intangible aspects of the present study, particularly in regard to the surrounding of a restaurant.
The majority of the fast food restaurant’s features is to offer food; however, customers, nowadays, are more concerned about improving their life quality and enjoying a comfortable dining room. Hence, this indicates that improving food quality alone is not sufficient in fulfilling the need of customers. This stimulates the marketers of fast food industry to keep promoting the importance of restaurant environments considering that it can positively strengthen the customers’ feelings. As a result, this will lead to higher sales because the customers perceived that their demand for a better dining environment has been fulfilled. On a similar note, a pleasant environment plays an important role in motivating the purchasing habit of customers which also helps to generate more profits (Ryu and Jang 2006). Furthermore, a delightful and arousal surrounding will motivate customers’ purchase intentions by roughly 12 percent on average.
The factor of environment can be categorized into three groups, namely social cues, ambient cues, and design cues. More specifically, social cues refers to individuals in the environment, design cues describes the functions (color, decoration) that promote customer’s awareness, and ambient cues indicate the background attributes (scent, cleanliness) of a store. Consequently, the objective of the current research was to concentrate on two characteristics of ambient cues, namely cleanliness and ambient scent. A possible explanation for this the fact that experienced customers tend to pay more attention towards ambient factors.

2.6. Service Quality

The consequences of service quality are in the tangible form; however, it also considers “during associations among provider and consumer” which involves the methods and the way of delivering it to the customer. Subsequently, the dimensions of service quality are determined on a single standard by utilizing a special instrument. Meanwhile, different types of sub-components of the service quality have been distinguished by a number of researchers, including some disagreements among the authors. Three dimensions as follows: (1) the personnel or the interaction dimension; (2) the facilities or the environmental dimension; and (3) the material or the outcome dimension of what is delivered which take into account “the method the core service was transferred” and all interpersonal relationships. On a similar note, the reputation and image of the brand are considered as corporate quality.
Recent evidence seems to suggest that the number of service quality components can be reduced by the core and relational aspects of functional quality, technical and service quality, or instrumental and expressive performance. The extrinsic cues are frequently utilized as service quality when the customers are promoted with a few procedures of the core elements. On the other hand, it is easy for the fast food industry to change the intrinsic characteristics because the extrinsic components include physical environment, company reputation, and visitor contingent and investment that are often extremely difficult to change. Table 1 shows the selected model. As can be observed, each of the three measurements have an arrangement of multiple factors as well as trusted to cover the primary aspects of service quality for the interest of this research based on the 10 stators of service quality.
The actual outcome of the service refers to the material measurement based on the quality of served food and drinks such as the size of the portion, presentation, freshness, taste, and variety. In this case, the aspects of the services can only be evaluated following the actual consumption of the product. Furthermore, it is necessary to acknowledge that the measurement of tangible aspects include cleanliness, safety, location, and physical environment. Apart from that, the operation’s hours, ambience, and physical environment are equally important. Ambience of restaurant could be further enhanced by the lighting, temperature, music, and colors. Therefore, the company reputation should be assessed considering that it is similarly associated to other visitors and may influence their decision to leave or stay.
On another note, customer is more loyal if ‘the location is viewed as warm and friendly’ based on the score of personnel measurements; hence, this is considered necessary to the perceived quality. The measurement concludes that physical appearance of the personnel, competency, and communication skills are the critical aspects due to the high standard of professional knowledge and responsiveness. Efficiency is frequently stated as one of the most significant factors that cause the customers to be satisfied. As a result, it is very helpful if a fast food restaurant can provide the “homey feeling” that is recognized by the customers, show individualized attention, and create a more personalized platform for the service consumption.
The above determined all of the three measurable objective service qualities. Distinctly from the objectives service quality, distinct from person to person perceived service quality, following on personal judgment as we are determined as “a gap among expectations and perceived performance or perceived performance alone”. Meanwhile, it should be understood that adequate service and desired service are two different levels of expectations. In other words, what the customer think that they should receive are determined based on the desired service level. Meanwhile, the level of acceptance tolerated by customers are determined by adequate service. Hence, businesses are hoping to fulfil customers’ basic needs by offering the minimum service. Nevertheless, it should be acknowledged that the gap between these two is based on the zone of tolerance whereby service providers are targeting to accomplish a better level or also known as the desired service level of the customers. Previous expectations, word of mouth (WOM), traditions, and ideology as the factors of expectations that affect the desired service level, but they will not be broadly analyzed in the current research (Iqbal and Hassan 2018). According to Iqbal and Hassan (2018), perception of factors influencing word of mouth (WOM) vary across employees and customers. The present study chose to observe perceived service quality as multi-dimensional construct of perceived performance as suggested by Martinez Garcia and Martinez Caro (2010).
Furthermore, Zeithaml’s search and experience characteristics model is in the middle of the causal chain of perceived service quality which was the result of the complicated nature of service quality measurements. On another note, Iqbal and Hassan (2016) and Iqbal, Iqbal et al. (2016) extended the research work of Parasuraman et al. (1988) by investigating the role of service quality in the service sector of Pakistan and the United Kingdom. A few empirical investigations provided several conclusions in terms of determining a completely distinct outcome such as when a service is evaluated to have more weight in customers’ minds as part of the core aspect.
Past research indicates customers’ desire for a more personalized and closer relations with service providers. The service quality that acts as an attitude of ‘a long run entire assessment” has led to the relationship between the existence of the service quality and satisfaction. Kassim and Abdullah (2010) and Iqbal et al. (2016) confirmed that service quality enhances, customer’s satisfaction and customer’s loyalty where their relationship is moderated by gender in the service sector. Moreover, the restaurant industry positively influences the purchase intention for service quality, particularly in terms of confirmation of the assumption. In the present study, facilities measurement was discovered to be the least significant aspect of purchase intention.
A considerable amount of studies investigated service quality as a complex construct that concludes distinct measurements. Every one of those measurements could be tested, while distinct standards of significance are able to retrieve customer preferences. Satisfaction and loyalty sidelong countries certify the existence of “significant distinct identified in the importance located on each measurement” through a well-formulated conclusion. Service quality has a significant association with customers’ loyalty (Iqbal et al. 2016) despite being utilized in a diverse manner. Particularly in the context of its dimensions such as tangibles, reliability, responsiveness, assurance, and empathy (Iqbal and Hassan 2016). This is a strong background of service quality measurements which can be adopted in investigating the Malaysian Fast Food Industry. Apart from that, Kandampully and Suhartanto (2000) stated that the relations among service quality, and loyalty may be viewed in the Malaysia market. Therefore, it is worth indicating that the fast food industry has not been thoroughly studied considering that only a few random facts managed to be established in this field over recent years. Apart from that, it has been identified that efficiency is the most dissatisfying factor among visitors.

2.7. Price

Perceived price can be defined as the consumer’s perceptual representation or subjective perception of the objective price of the product (Jacoby and Olson 1977). Price is the most important key component of purchase intention in the fast food industry because most customers in Malaysia tend to concentrate on the brand’s price which further motivates them to purchase a meal. Product brand establishes different price for a similar product which further develops the standard of brand production. Furthermore, price significantly influences purchase intentions because changes in production have a great impact on the customers (Liew 2015). Apart from that, customers can also afford and be satisfied with which promote their willingness to purchase the production of brand repeatedly in the future. Yang and Mao (2014) found that a lower price could also be viewed as the factor that influences consumers’ to purchase. Price sensitive consumers are those who try their best to search for a lower price (Wakefield and Inman 2003). Therefore, service provider must concentrate on price charges that will influence the purchase intention of customers.

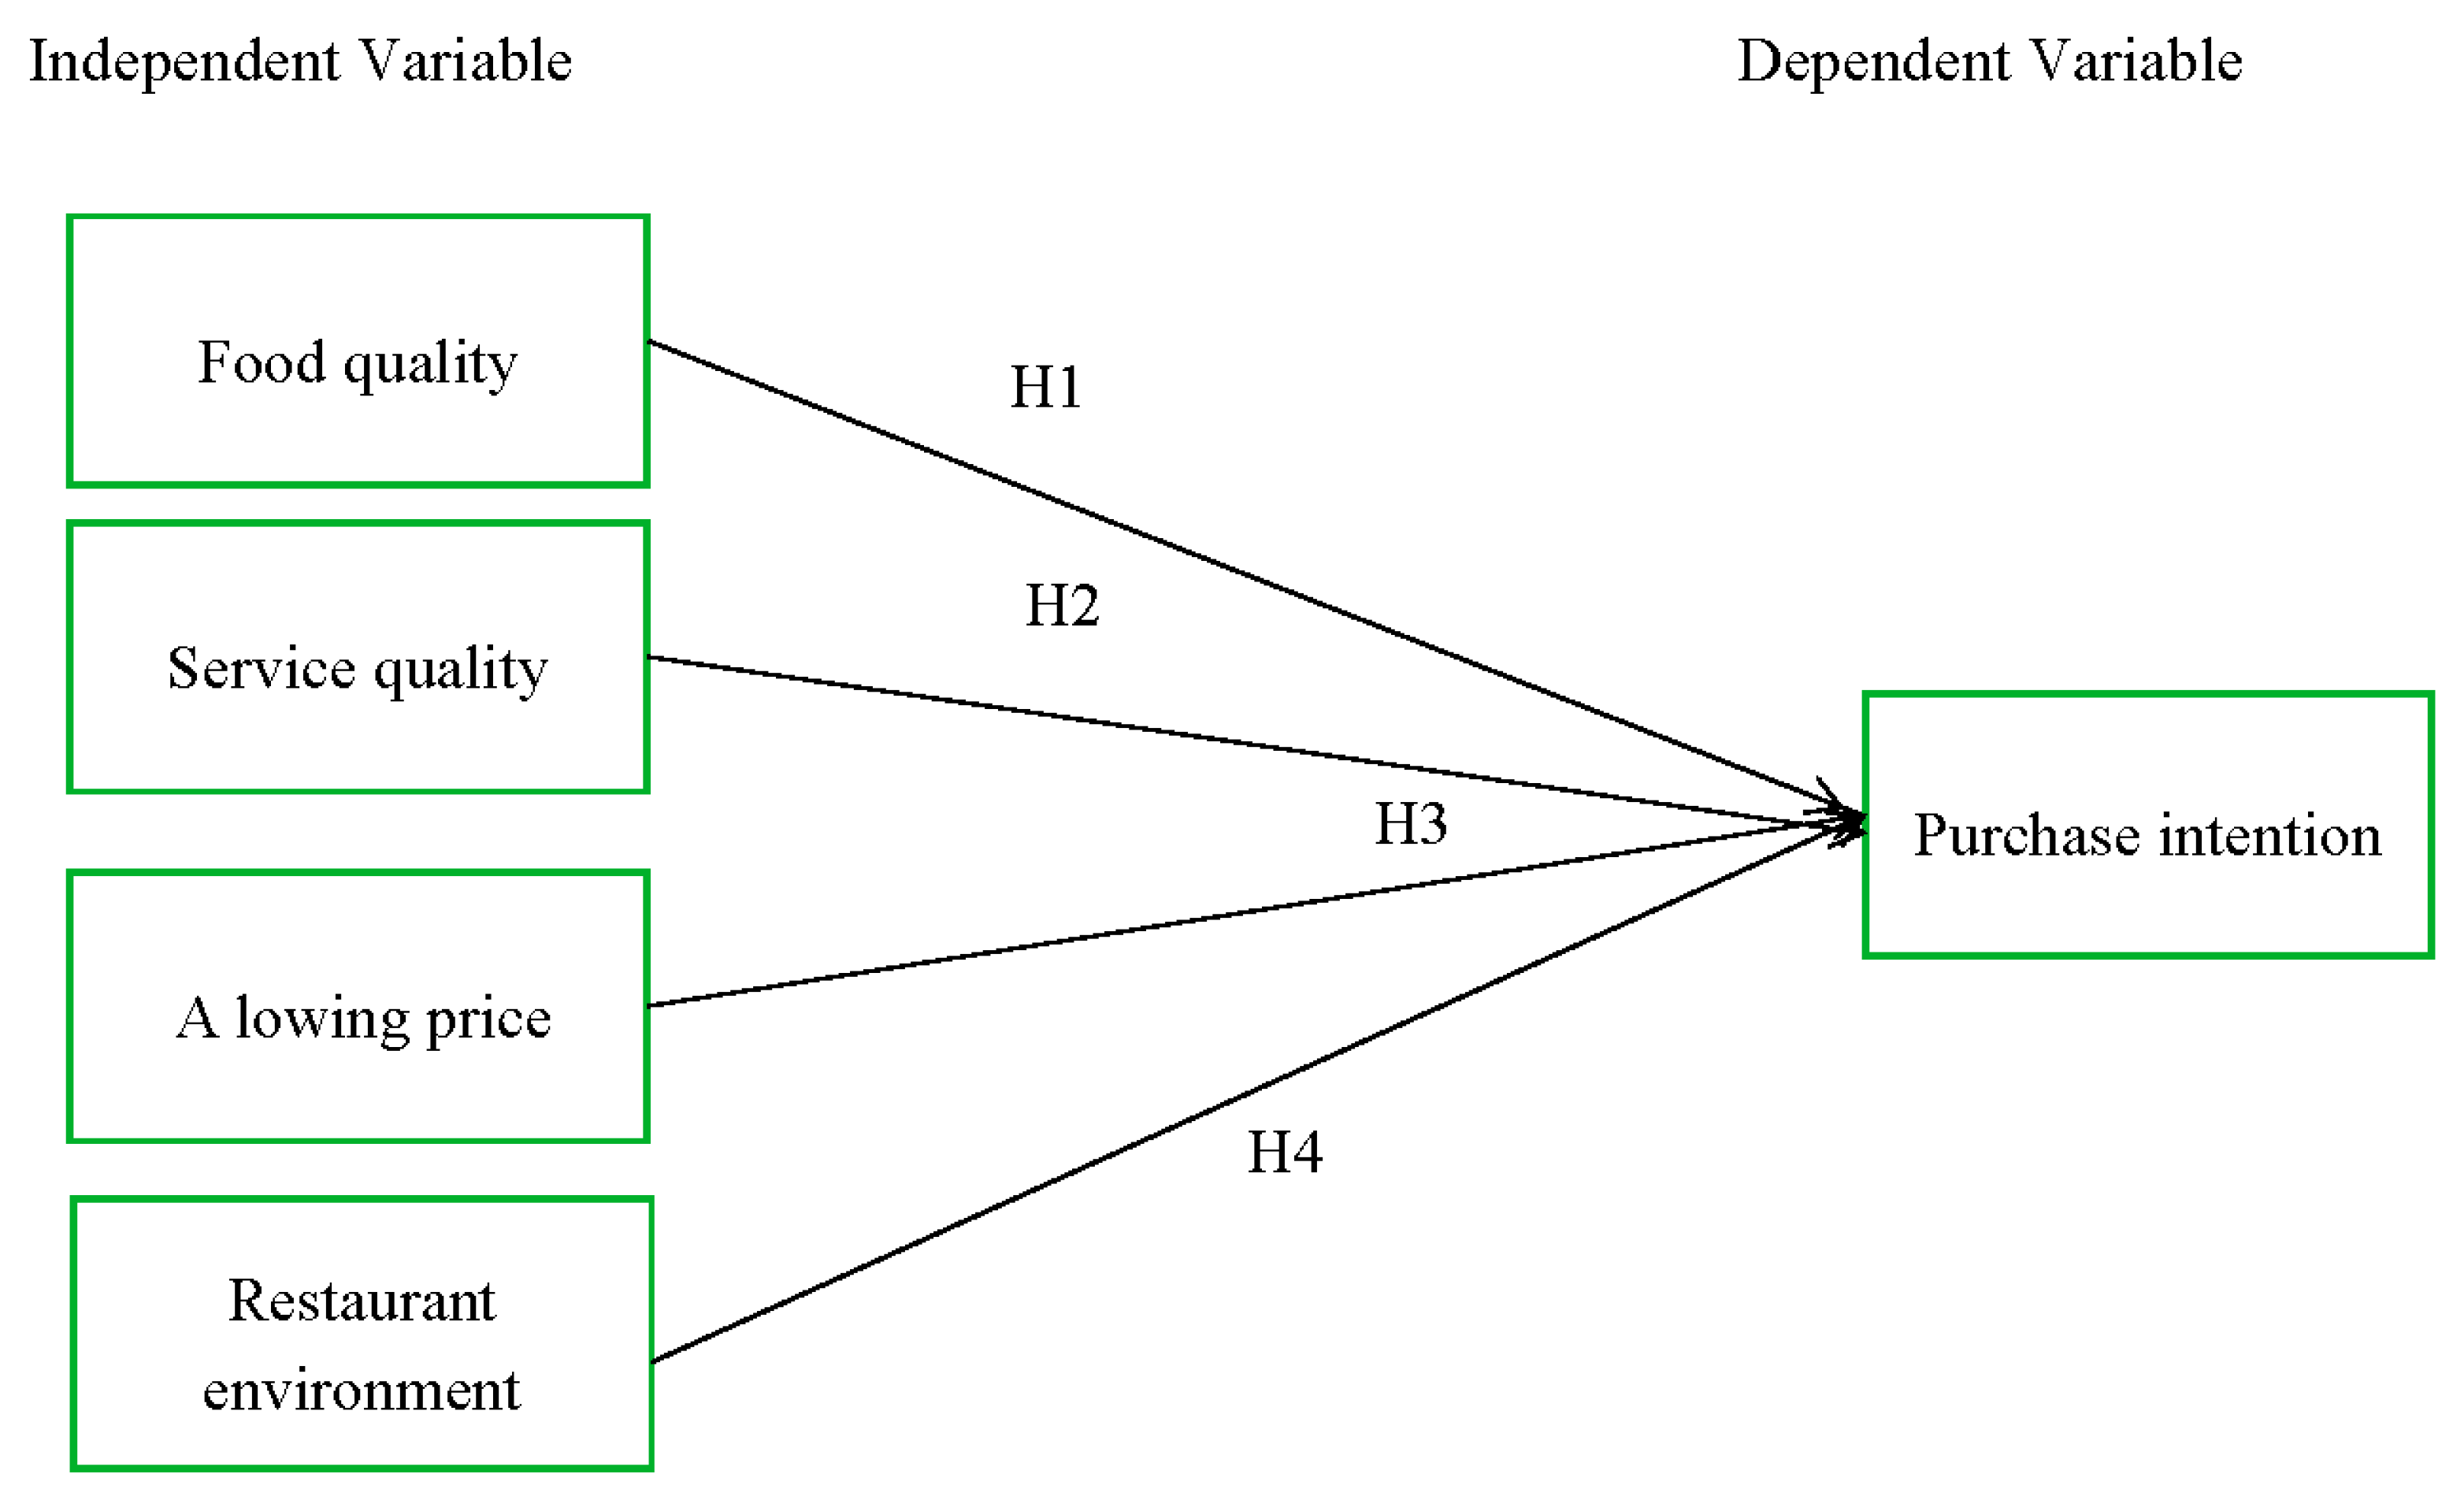
3. Research Framework

Based on the above literature, the antecedence of purchase intention is food quality, service quality, price, and restaurant environment. On the basis of previous study in different categories of context on these constructs including food quality, service quality, price, and purchase intention, following the research framework are proposed (see Figure 1). This study examined the interrelationships between these variables in the context fast food by providing empirical evidence.

4. Hypotheses Development

4.1. The Relationships among Food Quality as Well as Purchase Intention

Food quality is one of the most significant factors that influences purchase intention in the fast food industry. Sulek and Hensley (2014) stated that food quality can combine all the food characteristics into one variable. In regard to this, food quality has various characteristics, namely temperature, menu item variety, tastiness, and presentation. Enhanced food quality will positively effect purchase intentions among customers. Therefore, the hypothesis is as follows:
Hypothesis 1 (H1). 
Food quality has a positive influence on purchase intention.

4.2. The Relationship between Service Quality and Purchase Intention

A study by Malik (2012) surveyed the interval between the service expectation and customer’s service perception in regard to the service offered by four service industries, namely telecommunications, courier, transport, and banking as well as examined their influence on satisfaction. The results of the study revealed that service quality has a positive effect on purchase intention. This is supported by Choudhury (2013) who proposed four measurements of service quality, namely assurance, responsiveness, reliability, and tangibles which produce a significant and positive relationship with purchase intention. SERVQUAL (a measurement scale of service quality) can be utilized to examine the interval among the expectations and the perceptions of retailing customers to determine the factors that influence customers’ satisfaction. According to Iqbal et al. (2016), service quality positively influences customers’ loyalty, but its four dimensions operate differently across different countries based on customers’ preferences (Iqbal and Hassan 2016). In other words, service quality has a positive and significant influence on purchase intention Choudhury (2013). Boulding et al. (1993) found that enhanced service quality attracts customers and enforce them to repurchase. Therefore, it is suggested that service quality will positively influence purchase intentions among customers. Hence, it was hypothesized that:
Hypothesis 2 (H2). 
Service quality has a positive influence on purchase intention.

4.3. The Relationship between Price and Purchase Intention

Price is one of the most significant factors of purchase intention in the fast food industry. Price promotes the willingness of customers to purchase fast food and provide prompt service in fast food industry. In addition, price is integrated with the expenses of the fast food industry in regard to the services. High prices will cause greater costs for the consumers, which then reduces the willingness of customers to purchase the product (Dodds et al. 1991; Kim et al. 2011). Schiffman et al. (2012) supported that the perceived price of a product has a direct influence on consumers’ purchase intentions. Setiawan and Achyar (2013) found that there is a relationship between perceived price and purchase intentions in online shopping context. Fast food restaurants often utilize penetration pricing when selling their menu item to customers (Melanie 2018). In other words, the lowered price can attract more customers in fast food restaurants. In the context of the restaurants of fast food, this relationship may also occur for consumers’ purchase intentions. Hence, the hypothesis is as follows:
Hypothesis 3 (H3). 
A lowered price has a positive influence on purchase intention.

4.4. The Relationship between Restaurant Environment and Purchase Intention

According to Ryu and Jang (2007), restaurant environment is able to establish brand image and affect customers’ retention level, particularly in the fast food industry. Pleasant surroundings of restaurant will lead to a high extent of customer retention towards the fast food industry apart from the significance of food quality and service quality. Recent evidence illustrated how surrounding affects purchase intention as well as promotes repurchase behavior (Mattila 2001). In addition, surrounding can have an important collision on the perception of the entire quality, which indicates a positive influence on customer retention for a specific restaurant. The surroundings of a specific restaurant will affect customer retention and loyalty.
Lim (2010) confirmed that a pleasant atmosphere will repeatedly dedicate a beneficial scale of customer retention in the fast food industry. Restaurant environment is described based on the five dimensions of service quality, namely ice, tangibles, reliability, responsiveness, assurance, and empathy. These five dimensions of service quality are necessary to be utilized as per se culture and origin of the customers (Iqbal et al. 2016). Furthermore, there is an immediate integration between environment and customer retention in fast food industry. In particular, cleanliness of a restaurant, seating comfort, and facility aesthetics significantly influence customer retention. Moreover, surroundings of a fast food restaurant are an immediate pointer of customer satisfaction. Restaurant environment influences customers in either way. Therefore, good restaurant environment will incite customers to visit again and again. As a result, the hypothesis is executed as follows:
Hypothesis 4 (H4). 
Restaurant environment has a positive influence on purchase intention.

5. Research Methodology

5.1. Unit of Analysis, Sampling, and Data Collection

The current research targeted the Generation Y students in Malaysia who were residing in the state of Nilai in order to investigate their intentions in purchasing fast food. Currently, there are approximately 36, 720 students of Generation Y living in Nilai, Negeri Sembilan. However, the sample size only consisted of 313 respondents due to the constraints of time and resources. There are many universities in Nilai which include USIM, INTI, Nilai, and Xiamen University. In the case of the present study, the researchers personally met the students to collect data from them using survey forms.

5.2. Questionnaire Design

The questionnaire was designed in bilingual including Chinese and English language. In this questionnaire, the layout of the cover page presented a brief introduction as well as the purpose of the current research. The questionnaire was divided into two sections. The first section involved the social demographic information including the participant’s age, gender, nationality allowance, and education level which help to provide information of the respondents Meanwhile, section B provided the construct measurement of the present study involving four independent variables, namely service quality, food quality, price, and customer loyalty on the dependent variable (purchase intention) for the purpose of examine their relationships. The present study adopted the same scale used in the study of Iqbal et al. (2016) for an academic research investigating the service quality in service sector (Iqbal et al. 2016; Iqbal and Hassan 2016). Next, a total of 313 questionnaires were distributed to the target participants. In this case, to raise the reliability of the collected information, the participants were asked about their willingness to participate in the survey for the purpose of increasing the reliability of the collected information. The response rate of the survey was 91%.

6. Data Analysis

6.1. Descriptive Analysis

The demographic features of the present study include gender, age, nationality, education level, band working status. The following table outlines the demographic variables of this study.
As presented in Table 2, the frequency of female is 190 which accounts for 57.9% of all respondents. Hence, this indicates that the number of female respondents is higher than the male respondents. Next, it can be seen that most of the respondents who participated in the survey are Chinese which represents 80.5% of the total respondents. Meanwhile, Malay and Indian only take up 4.6%. In addition, the respondents are all Generation Y students with the age ranging from 18 to 35 years old. The age class between 18 and 24 years old takes up 90.9% (n = 298), followed by 25 to 30 years that is represented by 4.6% (n = 15), and over 35 years old takes up 4.6% (n = 15). Therefore, this indicates that the percentage of the age group from 18- to 24-year-old is the highest among all age groups.
As can be observed in the same table, most of respondents’ income level is below RM1000 which is represented by 80.2%, whereas 15.2% of the income level is between RM1001 to RM3000. The rest of the respondents have an income level of RM5001 and above only, which takes up 4.6%. The income for most of these respondents is not high because they are all students. In regard to the education level, 4.6% of the respondents have primary education, followed by the second highest percentage of secondary education at 76.5% with a total of 251 respondents representing the largest percentage of respondents. Meanwhile, 18.9% of the respondents have the highest academic qualification which is tertiary education. In summary, more than 95% of the respondents possess good education.

6.2. Reliability Analysis

The value of Cronbach’s alpha for all variables was 0.876, thus indicating that all the 25 questions were excellent. Table 3 shows that the most reliable independent variable is price (with four questions) because its Cronbach’s alpha value of 0.942 is greater than 0.70. Meanwhile, the Cronbach’s alpha for other variables are more than 0.70 as described follows: food quality (with three questions), service quality (with four questions), and restaurant environment (with five questions). Table 4 illustrates purchase intention factor with questions with the Cronbach’s alpha value of 0.818. Therefore, the question on purchase intention is regarded as reliable due to the Cronbach’s alpha exceeding 0.70.

6.3. Correlations Analysis

6.3.1. Correlation of Food Quality with Purchase Intention

As presented in Table 3, the correlation between food quality and purchase intention has a positive influence as the p-value is 0.000. In addition, the correlation is at 1% significant level which indicates that there is a link between purchase intention and food quality. Apart from that, the value of 0.550 indicates a moderate positive relationship. In other words, food quality has a moderate positive relationship with purchase intention.

6.3.2. Correlation of Service Quality with Purchase Intention

As shown in Table 3, the correlation results of service quality with purchase intention has a positive influence as the p-value is 0.000. In addition, the correlation is at 1% significant level which indicates that there is a link between purchase intention and service quality. Apart from that, the value of 0.515 shows a moderate positive relationship. In other words, it indicates a moderate positive relationship between service quality and purchase intention.

6.3.3. Correlation of Price with Purchase Intention

In Table 3, the correlation results between price and purchase intention shows a positive influence as the p-value is 0.000. Hence, there is a link between price and purchase intention since the correlation is at 1% significant level. Meanwhile, the value of 0.355 shows a negative relationship. In other words, this value indicates a negative relationship between price and purchase intention. This indicates the lowing price with menu, the higher intention to purchase fast food.

6.3.4. Correlation of Restaurant Environment with Purchase Intention

As presented in Table 3, the correlation results indicate that restaurant environment influences purchase intention as the p value is 0.000. Hence, there is a link between restaurant environment and purchase intention since the correlation is at 1% significant level. On the other hand, the value at 0.456 shows a negative relationship. In other words, this indicates a moderate negative relationship between restaurant environment and purchase intention.

6.3.5. Multiple Regression Analysis

In statistical package for the social sciences (SPSS), multiple correlation is an analysis measure which is employed to predict the value of the variables and the best predictions. First, it can be observed in Table 4 that the R value is 0.742 which is more than the expected value of 0.7. Therefore, this indicates a good level of prediction relation between the independent variables and dependent variables.
Table 4 shows that the p value of the test data is 0.000(Sig), which indicates that the result is less than 0.0005. Moreover, it can also be seen that the overall regression is significant; hence, the regression model is considered as a good fit of the data.
Table 4 illustrates the result of multiple regressions for the four proposed hypotheses. As can be observed, all the p value is lower than the value of 0.05 except for service quality and restaurant environment (H2), (H4), which indicates that H1, and H3 are supported.
  • X1 = Food Quality,
  • X2 = Service Quality,
  • X3 = Lowering price,
  • X4 = Restaurant Environment,
  • Y = Dependent variable is purchase intention.
  • Y = Constant Coefficients + aX1 + bX2 + cX3 + dX4 + eX5
The factors that influence purchase intention can be summarized as:
Y = 4.43 + 0.544X1 + 0.254X3
The results presented in Table 5 shows that food quality is the most significant factor of purchase intention, followed by service quality, price, and restaurant environment which has the least influence on purchase intention among Generation Y student in the fast food industry in Nilai, Malaysia. The next section will further discuss the results of the present study.

7. Discussion

The main objective of the present study was to investigate whether there is a positive relationship between the four independent variables (namely food quality, service quality, price, and restaurant environment) with purchase intention.
The result of Hypothesis 1 discovered that there is a positive relationship between food quality and purchase intention among Generation Y students in Malaysia. Table 5 shows that Hypothesis 1 is supported and the relationship between food quality and purchase intention is at a significant level with b-value = 0.544. In other words, there is a positive relationship between the two variables whereby each unit of food quality increases the purchase intention by 0.544. Consumers tend to be more concerned if the food is able to provide nutritional and healthy value. In regard to this, the finding analysis found that past consumers were not aware of healthy eating and nutritional diet due to the poor education level. Apart from that, it can be indicated that food quality has a significant relationship with purchase intention among Generation Y students in Malaysia. As presented in the same table, the statistics result of Hypothesis 3 indicates that there is a negative relationship between service quality and purchase intention because the p-value for this hypothesis is higher than 0.05 (p-value = 0.009 and b-value = 0.22). Hence, it can be implied from the current research that service quality has a negative relationship which will not affect the purchase intention of Generation Y students. The present study also exhibited results that were contrasted the findings of Iqbal et al. (2016) and Yang et al. (2017) which claimed that service quality enhances customers’ satisfaction and customers’ loyalty. However, based on suggestion of Iqbal and Hassan (2016), there is a need to investigate the dimensions of service quality in this context. The higher the level of income customer, the higher the attention will be given to the service quality of restaurant. Other than that, the higher the social income population, the higher the awareness on quality of life. Nevertheless, it can also mean that the customers prefer a better service quality provided by the restaurant. Unfortunately, the current research did not focus on service quality because all of the respondents were students and their income levels are below RM1000. As presented in Table 5 the statistics result of Hypothesis 3 shows a significant relationship between price and purchase intention because the p-value for this hypothesis is lower than 0.05 (p-value= 0.000 and b-value = 0.254). Hence, this indicates that Generation Y students in Malaysia tend to pay more attention to the price when they are consuming fast food. Price is one of the primary factors that influence the purchase intention of Generation Y students. According to Table 2, (Summary of Demographic Profile), it can be observed that both of the respondent’s education level and income level are not high. Shaharudin et al. (2011) implies that lower education has lower income, thus causing lower income households to be faced with more price sensitivity, thus it can be concluded that price is an issue for Generation Y students. According to Table 5, the statistics result of Hypothesis 4 shows there is a negative relationship between restaurant environment and purchase intention because the p-value for this hypothesis is higher than 0.05 (p-value = 0.533 and b-value = −0.38). Apart from that, it can also be indicated that the purchase intention of Generation Y students is not related to restaurant environment. Moreover, consumers tend to be more concerned about food quality and price among Generation Y students. Based on this data analysis, it was also stated that food quality and price are related to purchase intention, while price has no significant relationship with Generation Y students in Malaysia.

8. Conclusions and Limitations

The current research revealed that food quality is the most important factor of purchase intention in all businesses. Apart from that, it was examined as a more effective and valid feedback from the customers in regard to business. Hence, purchase intention in the market field is deemed crucial in determining the success of any business. The present study assessed purchase intention in terms of the service quality, price, food quality, and environment restaurants. Gender moderates the relationship between service quality and customer’s loyalty (Iqbal et al. 2016), so future research may provide empirical evidence in the context of gender for present research framework. The findings revealed that there is a significant relationship between purchase intention and the four independent variables based on different analysis.
In regard to this matter, it is recommended for future works to be conducted in a larger target population by expanding the location to a wider area. In addition, the questionnaire should be distributed to the entire population of Generation Y students in Malaysia, while interviews can be conducted to increase the accuracy of the results. Moreover, future research should analyze the factors that affect the purchase intention of Generation Z students towards the fast food industry in Nilai, Malaysia to provide insights that can help to develop Nilai’s fast food industry more rapidly. Finally, future research should improve the data collection method by incorporating the interview method instead of relying solely on the questionnaires, whereas the terms of the questionnaire can also be improved.

Author Contributions

The authors have contributed in the different tasks. This research project comes from first author’s MBA (Thesis). The second author and third author has contributed to convert thesis to a journal paper. The second author and third author has also contributed to do corrections.

Funding

This research received no external funding.

Conflicts of Interest

The authors declare no conflict of interest.

References

  1. Atkins, Peter, and Ian Bowler. 2001. Food in Society: Economy. London: Culture and Geography, Arnold. [Google Scholar]
  2. Boulding, William, Aja Kalra, Richard Staelin, and Valarie A. Zeithaml. 1993. A dynamic process model of service quality: from expectations to behavioural intentions. Journal of Marketing Research 30: 7–27. [Google Scholar] [CrossRef]
  3. Choudhury, Koushiki. 2013. Service quality and customers’ purchase intentions: An empirical study of the Indian banking sector. International Journal of Bank Marketing 31: 529–43. [Google Scholar] [CrossRef]
  4. Darian, Jean C., and Louis Tucci. 2011. Perceived Health Benefits and Food Purchasing Decisions. Journal of Consumer Marketing 28: 421–28. [Google Scholar] [CrossRef]
  5. Dodds, William B., Kent B. Monroe, and Dhruv Grewal. 1991. The Effects of Price, Brand and Store Informa- tion on Buyers’ Product Evaluations. Journal of Marketing Research 28: 307–19. [Google Scholar]
  6. Goyal, Anita, and N. P. Singh. 2007. Consumer Perception about Fast Food in India: An Exploratory Study. British Food Journal 109: 182–95. [Google Scholar] [CrossRef]
  7. Habib, Farzana Quoquab, Rozhan Abu Dardak, and Sabarudin Zakaria. 2011. Consumers’ Preference and Consumption towards Fast Food: Evidences from Malaysia. Business & Management Quarterly Review 2: 14–27. [Google Scholar]
  8. Iqbal, Qaisar, and Siti Hasnah Binti Hassan. 2016. Service Quality about Health Sector of UK and Pakistan: A Comparative Study. International Journal of Management, Accounting and Economics 3: 473–85. [Google Scholar]
  9. Iqbal, Qaisar, and Siti Hasnah Hassan. 2018. A Dyadic Analysis of Salespersons and Customers in Banking Sector: Humor Usage, Word of Mouth and Expectation of Continuity. International Academic Journal of Business Management 5: 109–120. [Google Scholar]
  10. Iqbal, Qaisar, Basheer Ahmad, and Adeel Nasim. 2016. A Gender Based Approach: Service Quality and Customer’s Loyalty. International Journal of Management, Accounting and Economics 3: 822–36. [Google Scholar]
  11. Jacoby, Jacob, and Jerry C. Olson. 1977. Consumer Response to Price: An Attitudinal, Information Processing Perspective. In Moving Ahead with Attitude Research. Edited by Yoram Wind and Marshall Greenberg. Chicago: American Marketing Association, pp. 73–86. [Google Scholar]
  12. Kandampully, Jay, and Dwi Suhartanto. 2000. Customer loyalty in the hotel industry: The role of customer satisfaction and image. International Journal of Contemporary Hospitality Management 12: 346–51. [Google Scholar] [CrossRef]
  13. Kassim, Norizan, and Nor Asiah Abdullah. 2010. The Effect of Perceived Service Quality Dimensions on Customer Satisfaction, Trust, and Loyalty in E-Commerce Settings: A Cross Cultural Analysis. Asia Pacific Journal of Marketing and Logistics 22: 351–71. [Google Scholar] [CrossRef]
  14. Kim, Hee-Woong, Yunjie Xu, and Sumeet Gupta. 2011. Which is More Important in Internet Shopping, Perceived Price or Trust? Electronic Commerce Research and Applications 11: 241–52. [Google Scholar] [CrossRef]
  15. Liew, Yean Sien. 2015. Factors Influencing Consumers Purchase Intention towards Online Group Buying in Malaysia. Ph.D. Dissertation, Faculty of Accountancy and Management, University Tunku Abdul Rahman, Kampar, Malaysia, December. [Google Scholar]
  16. Lim, Hoon. 2010. Understanding American Customer Perceptions on Japanese Food and Services in the US. Unpublished Master’s Thesis, University of Nevada, Las Vegas, NV, USA. Unpublished. [Google Scholar]
  17. Ma, Yaxin, and Shaohua Yang. 2018. An Empirical Study of Female E-shopper’s Satisfaction with Cosmetic Products in China. International Journal of Business and Management 13: 211. [Google Scholar]
  18. Malaysia Population. 2018. Demographics of Malaysia 2018. Available online: https://countrymeters.info/en/Malaysia (accessed on 12 December 2018).
  19. Malik, Saif Ulfah. 2012. Customer Satisfaction, Perceived Service Quality and Mediating Role of Perceived Value. International Journal of Marketing Studies 4: 68–76. [Google Scholar] [CrossRef]
  20. Martinez Garcia, Jose Antonio, and Laura Martinez Caro. 2010. Rethinking perceived service quality: An alternative to hierarchical and multidimensional models. Total Quality Management 21: 93–118. [Google Scholar] [CrossRef]
  21. Mattila, Anna S. 2001. Emotional Bonding and Restaurant Loyalty. Cornell Hotel and Restaurant Administration Quarterly 42: 73–79. [Google Scholar] [CrossRef]
  22. Melanie, H. 2018. The Pricing Strategy for Fast-Food Restaurants. Available online: https://smallbusiness.chron.com/pricing-strategy-fastfood-restaurants-23939.html (accessed on 11 November 2018).
  23. Parasuraman, Ananthanarayanan, Valarie A. Zeithaml, and Leonard L. Berry. 1988. Servqual: A Multiple-item Scale for Measuring Consumer Perceptions of Service Quality. Journal of Retailing 64: 12–14. [Google Scholar]
  24. Raajpoot, Nusser A. 2002. A Multiple Item Scale for Measuring Tangible Quality in Foodservice Industry. Journal of Foodservice Business Research 5: 109–27. [Google Scholar] [CrossRef]
  25. Ryu, Kisang, and SooCheong Shawn Jang. 2006. Intention to experience local cuisine in a travel destination: the modified theory of reasoned action. Journal of Hospitality & Tourism Research 30: 507–16. [Google Scholar]
  26. Ryu, Kisang, and SooCheong Shawn Jang. 2007. The effect of environmental perceptions on behavioural intentions through emotions: the case of upscale restaurants. Journal of Hospitality and Tourism Research 31: 56–72. [Google Scholar] [CrossRef]
  27. Ryu, Kisang, and SooCheong Shawn Jang. 2008. The influence of the physical environment on customer emotions and behavioural intentions: the application of modified Mehrabian–Russell model. The Service Industries Journal 28: 1151–65. [Google Scholar] [CrossRef]
  28. Schiffman, Leon G., Leslie Lazar Kanuk, and H. Hansen. 2012. Consumer Behaviour: A European Outlook, 2nd ed. Essex: Pearson Education. [Google Scholar]
  29. Setiawan, Ricky, and Adrian Achyar. 2013. Effects of Perceived Trust and Perceived Price on Customers’ Intention to Buy in Online Store in Indonesia. ASEAN Marketing Journal. [Google Scholar] [CrossRef]
  30. Shaharudin, Mohd Rizaimy, Suhardi Wan Mansor, and Shamsul Jamel Elias. 2011. Food Quality Attributes Among Malaysia’s Fast Food Customer. International Business and Management 2: 198–208. [Google Scholar]
  31. Sulek, Joanne M., and Rhonda L. Hensley. 2014. The Relative Importance of Food, Atmosphere, and Fairness of Wait: The Case of a Full-Service Restaurant. Cornell Hotel and Restaurant Administration Quarterly 45: 235–47. [Google Scholar] [CrossRef]
  32. Susskind, Alex M., and Edwin K. Chan. 2000. How Restaurant Features Affect Check Aberages: A Study of the Toronto Retaurant Market. Cornell Hotel and Restaurant Administration Quarterly 41: 56–63. [Google Scholar] [CrossRef]
  33. Wakefield, Kirk L., and J. Jeffrey Inman. 2003. Situational price sensitivity: The role of consumption occasion, social context and income. Journal of Retailing 79: 199–212. [Google Scholar] [CrossRef]
  34. Yang, Lusi, and Mao Mao. 2014. Antecendents of Online Group Buying Behavior: From Price Leverage and Crowd Effect Perspectives. Chengdu: PACIS. [Google Scholar]
  35. Yang, Shaohua, Xingxing Chen, and Xiaoli Shen. 2017. An Exploratory Study of Customer Satisfaction with International Student Recruitment Agencies: A Case Study in New Zealand. International Journal of Business and Management 12: 130–40. [Google Scholar] [CrossRef]
Figure 1. Research Framework.
Admsci 09 00004 g001
Table 1. Food Quality Measurements.
Material MeasurementFacilities MeasurementPersonnel MeasurementPrice
Food/drinks quality varietyPhysical environmentCommunication skillsPrice
AmbienceCompetence
Food/drinks quality (taste, presentation, freshness)Other visitorsProblem solving skills
LocationAppearance
CleanlinessEfficiency/waiting time
Size of the portionSafetyUnderstanding/knowing the customer
Hours of operationIndividualized attention and recognition
Table 2. Summary of Demographic Profile.
DemographicClassificationFrequencyPercentage (%)
GenderMale13842.1%
Female19057.9%
NationalityMalay154.6%
Chinese26480.5%
Indian154.6%
Others3410.4%
Age18–24 years old29890.9%
25–30 years old154.6%
31–35 years old00
Over 35 years old154.6%
Income levelBelow RM100026380.2%
RM1001 to RM30005015.2%
RM3001 to RM500000
RM5001 and above154.6%
Education levelPrimary154.6%
Secondary25176.5%
Tertiary education6218.9%
Others00
Table 3. Reliability Testing, Mean, Standard Deviation, and Correlation on Independent Variable.
FactorsCronbach’s Alpha (>0.70)Items#MeanStandard Deviation Food QualityService QualityLower PriceRestaurant EnvironmentPurchase Intentions
Food quality0.931350.4087.038Pearson Correlation
Sig (2-tailed)
N
1
Service quality0.826451.5249.963Pearson Correlation
Sig (2-tailed)
N
0.012
p < 0.05
328
1
Lowering Price0.942416.6943.266Pearson Correlation
Sig (2-tailed)
N
−0.230
p < 0.05
328
−0.331
p < 0.05
328
1
Restaurant Environment0.732531.6406.984Pearson Correlation
Sig (2-tailed)
N
0.125
p < 0.05
328
0.105
p < 0.05
328
−0.401
p < 0.05
328
1
Purchase Intentions0.818337.54324.373Pearson Correlation
Sig (2-tailed)
N
0.550
p < 0.05
328
0.515
p < 0.05
328
0.355
p < 0.05
328
0.456
p < 0.05
328
1
Table 4. Regression Analysis.
Model Summary b
RR SquareAdjusted R SquareStd. Error of the Estimate
0.742 a0.4700.4611.83960
ANOVA
ModelSum of SquaredfMean SquareFSig.
1Regression
Residual
Total
964.792
1089.684
2054.476
5
322
327
192.958
3.384
57.019
Correlations a
Unstandardized CoefficientsStandardized CoefficientstSig.
ModelBStd. ErrorBeta
1(Constant)4.4300.612 7.234
Food Quality (H1)0.4530.0730.5446.204p < 0.05
Service Quality (H2)−0.1530.058−0.220−2.620p < 0.05
A lowering price (H3)0.1770.0340.2545.277p < 0.05
Restaurant Environment (H4)0.0220.0250.0380.625p > 0.05
a Dependent Variable purchase intention; b Predictors: (Constant), Food Quality, Service Quality, A lowering price, Restaurant Environment.
Table 5. Summary of analysis.
HypothesisDescriptionp-Value and b-ValueResult
H1Food quality has a positive influence on purchase intention.p < 0.05
b-value = 0.544
Supported
H2Service quality has a positive influence on purchase intention.p < 0.05
b-value = −0.220
Not-Supported
H3The lowering price has a positive influence on purchase intention.p < 0.05
b-value = 0.254
Supported
H4Restaurant environment has a positive influence on purchase intention.p > 0.05
b-value = −0.38
Not Supported

