A DEMATEL-ISM Integrated Modeling Approach of Influencing Factors Shaping Destination Image in the Tourism Industry


Abstract
:1. Introduction
2. Literature Review
2.1. Tourism Destination Image (DI)
2.2. Multi-Criteria Decision-Making (MCDM) in the Tourism Industry Context
3. Materials and Methods
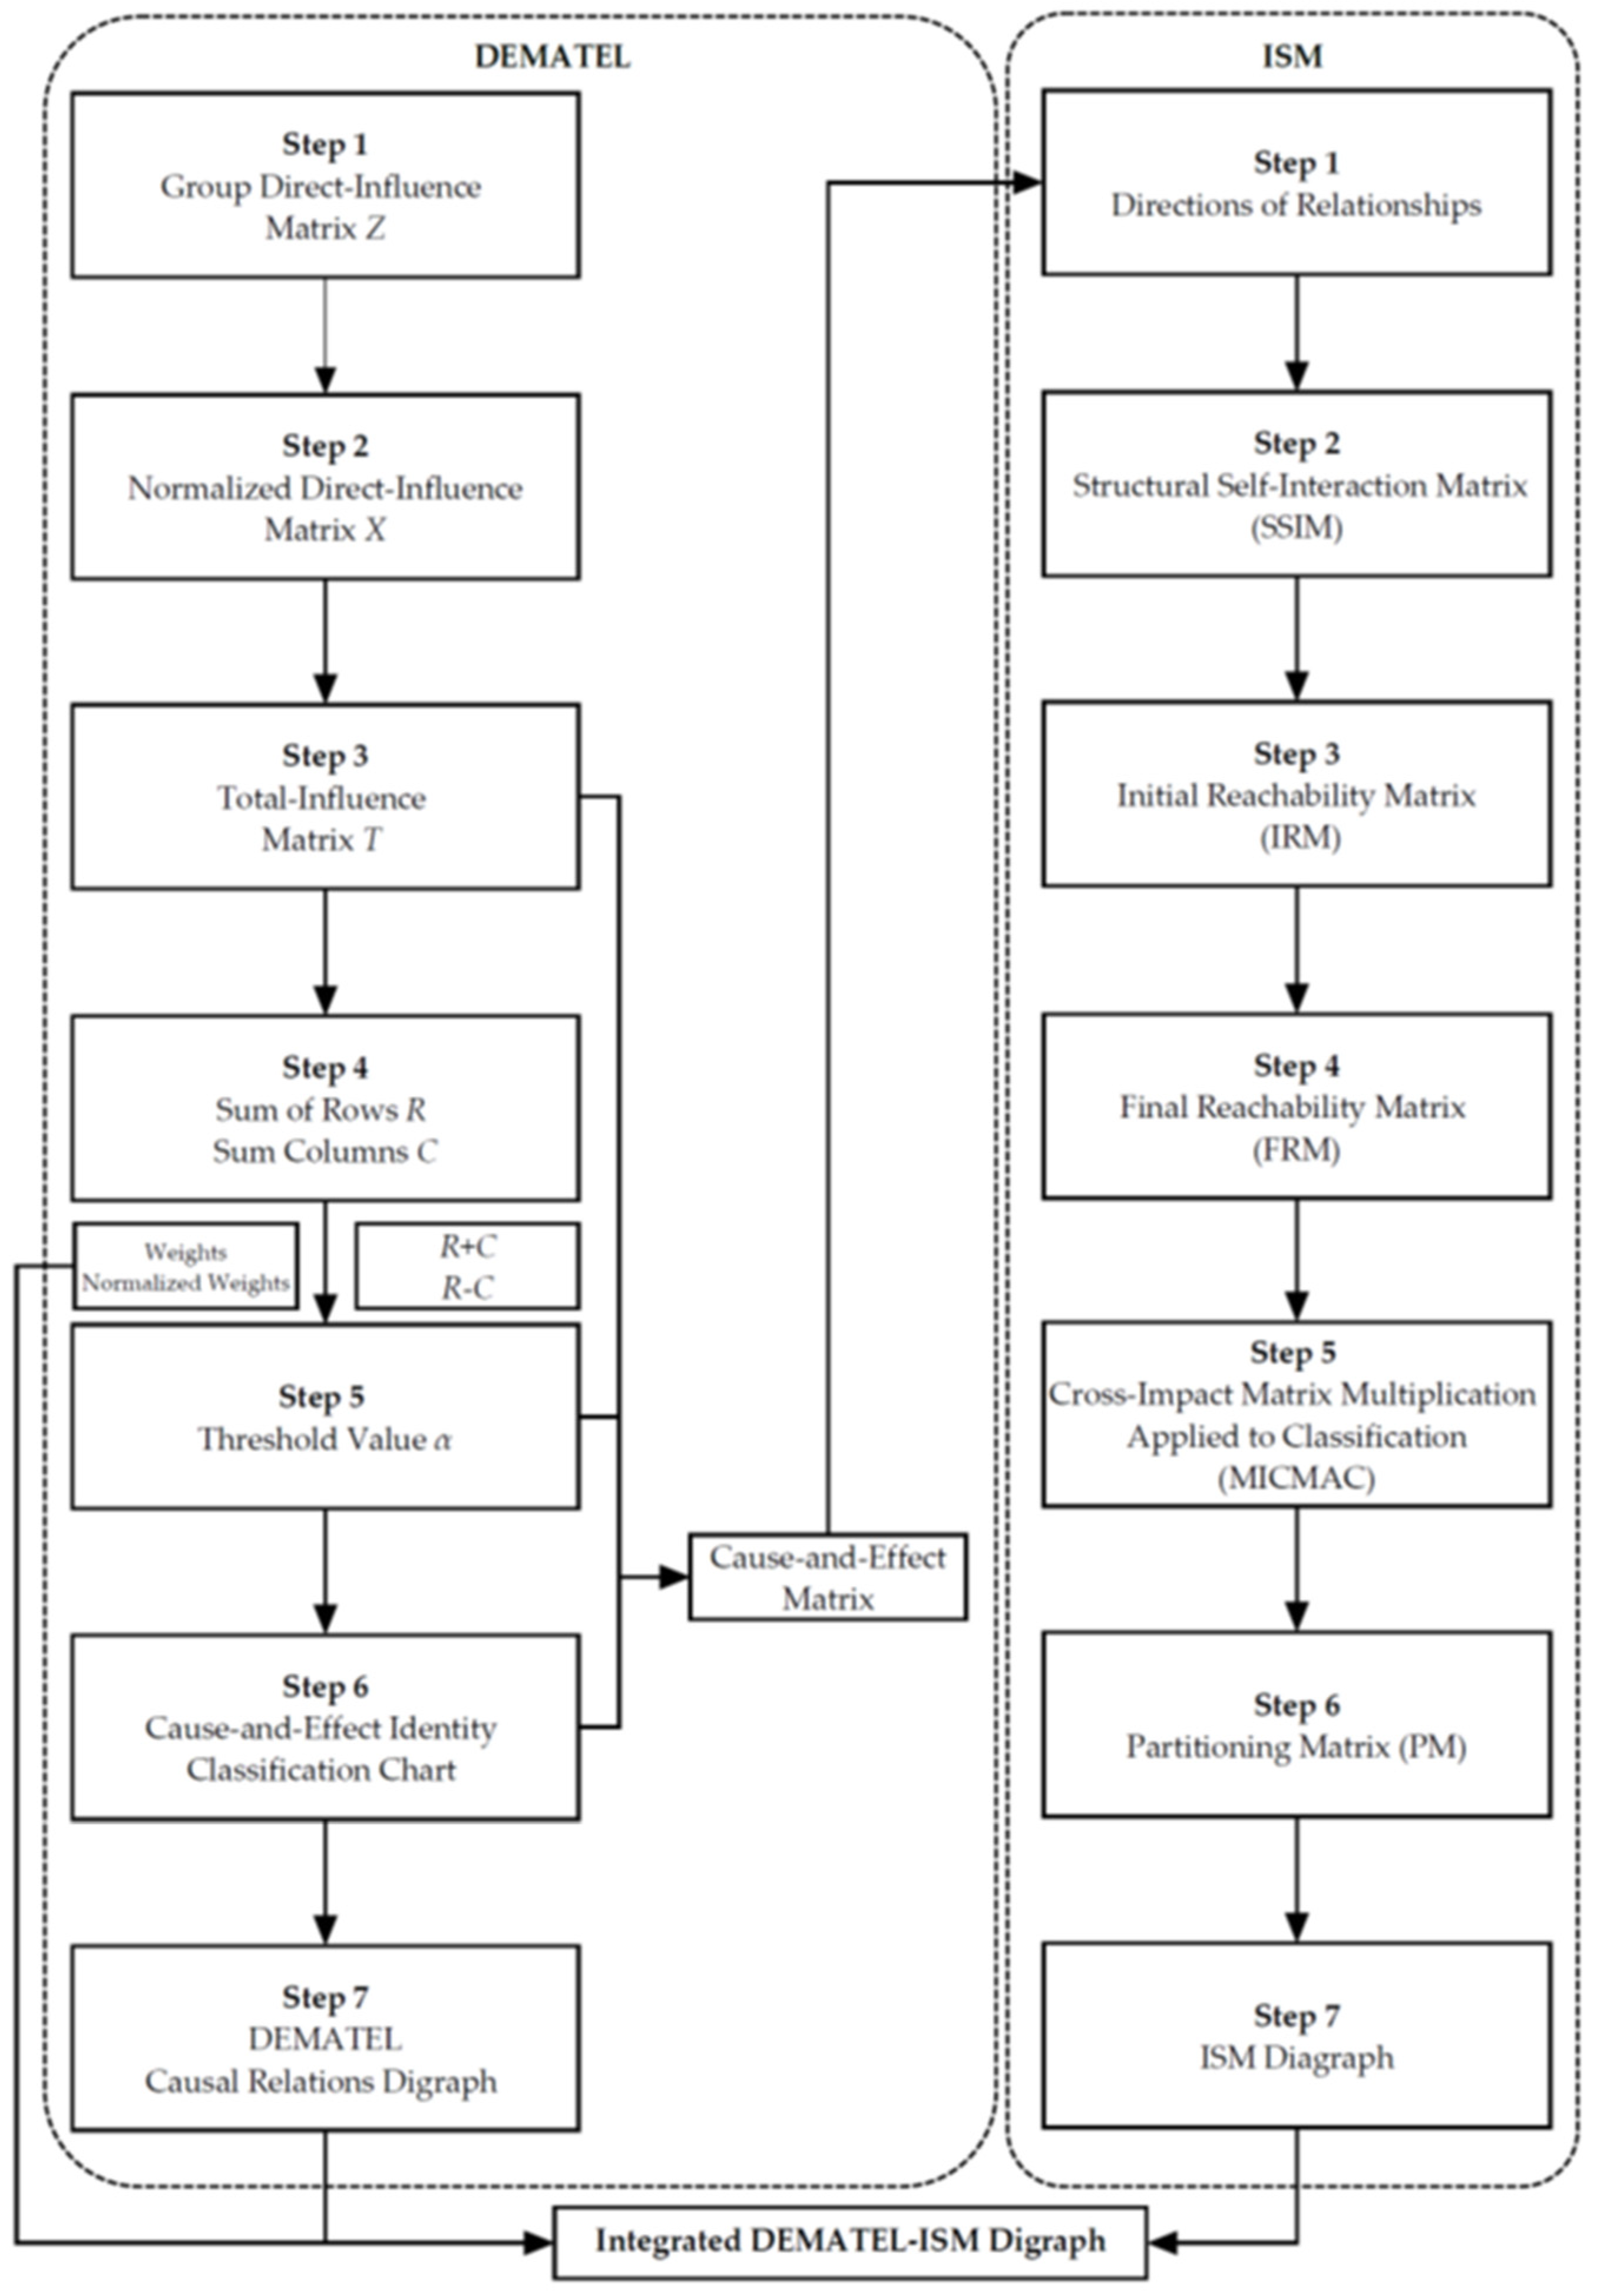
3.1. Decision-Making Trial and Evaluation Laboratory (DEMATEL)
- I: the identity matrix.
- ri: the ith row sum in the matrix T, representing the effects dispatching from factor Fi to other factors.
- cj: the jth column sum in the matrix T, representing the effects that factor Fi is receiving from other factors.
3.2. Interpretive Structure Modeling (ISM)
4. Results
4.1. Results of the Decision-Making Trial and Evaluation Laboratory (DEMATEL)
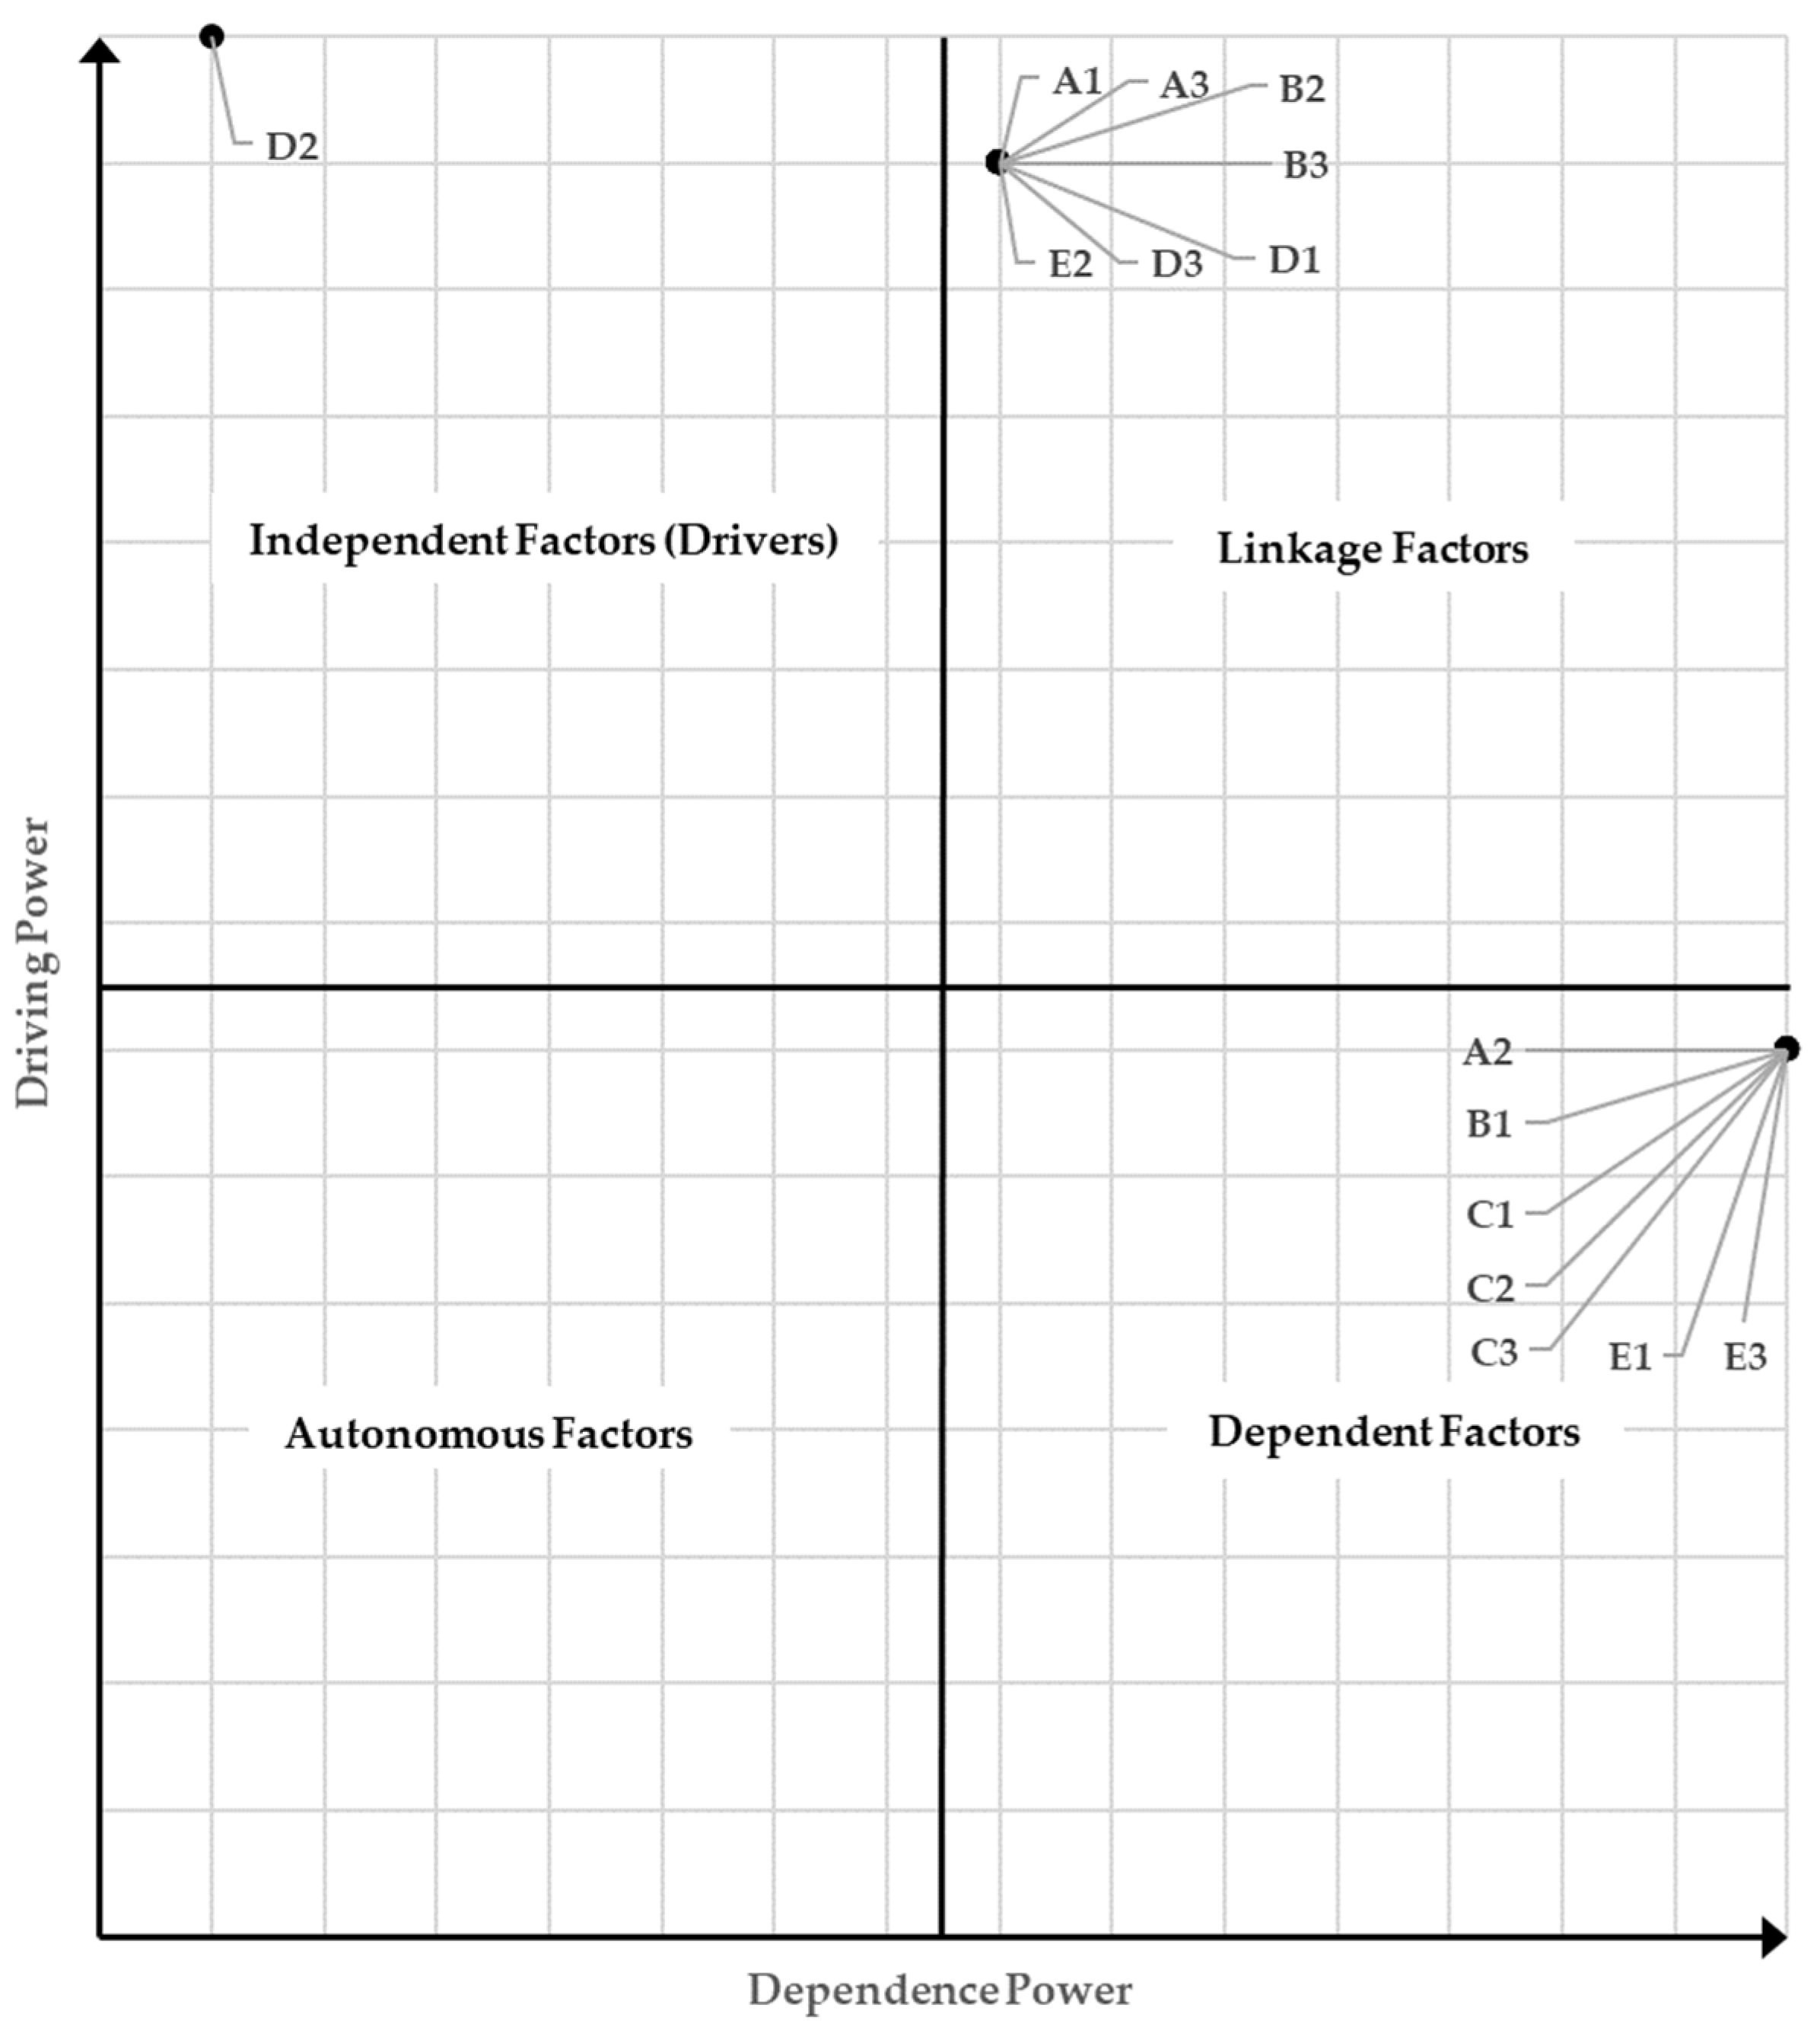
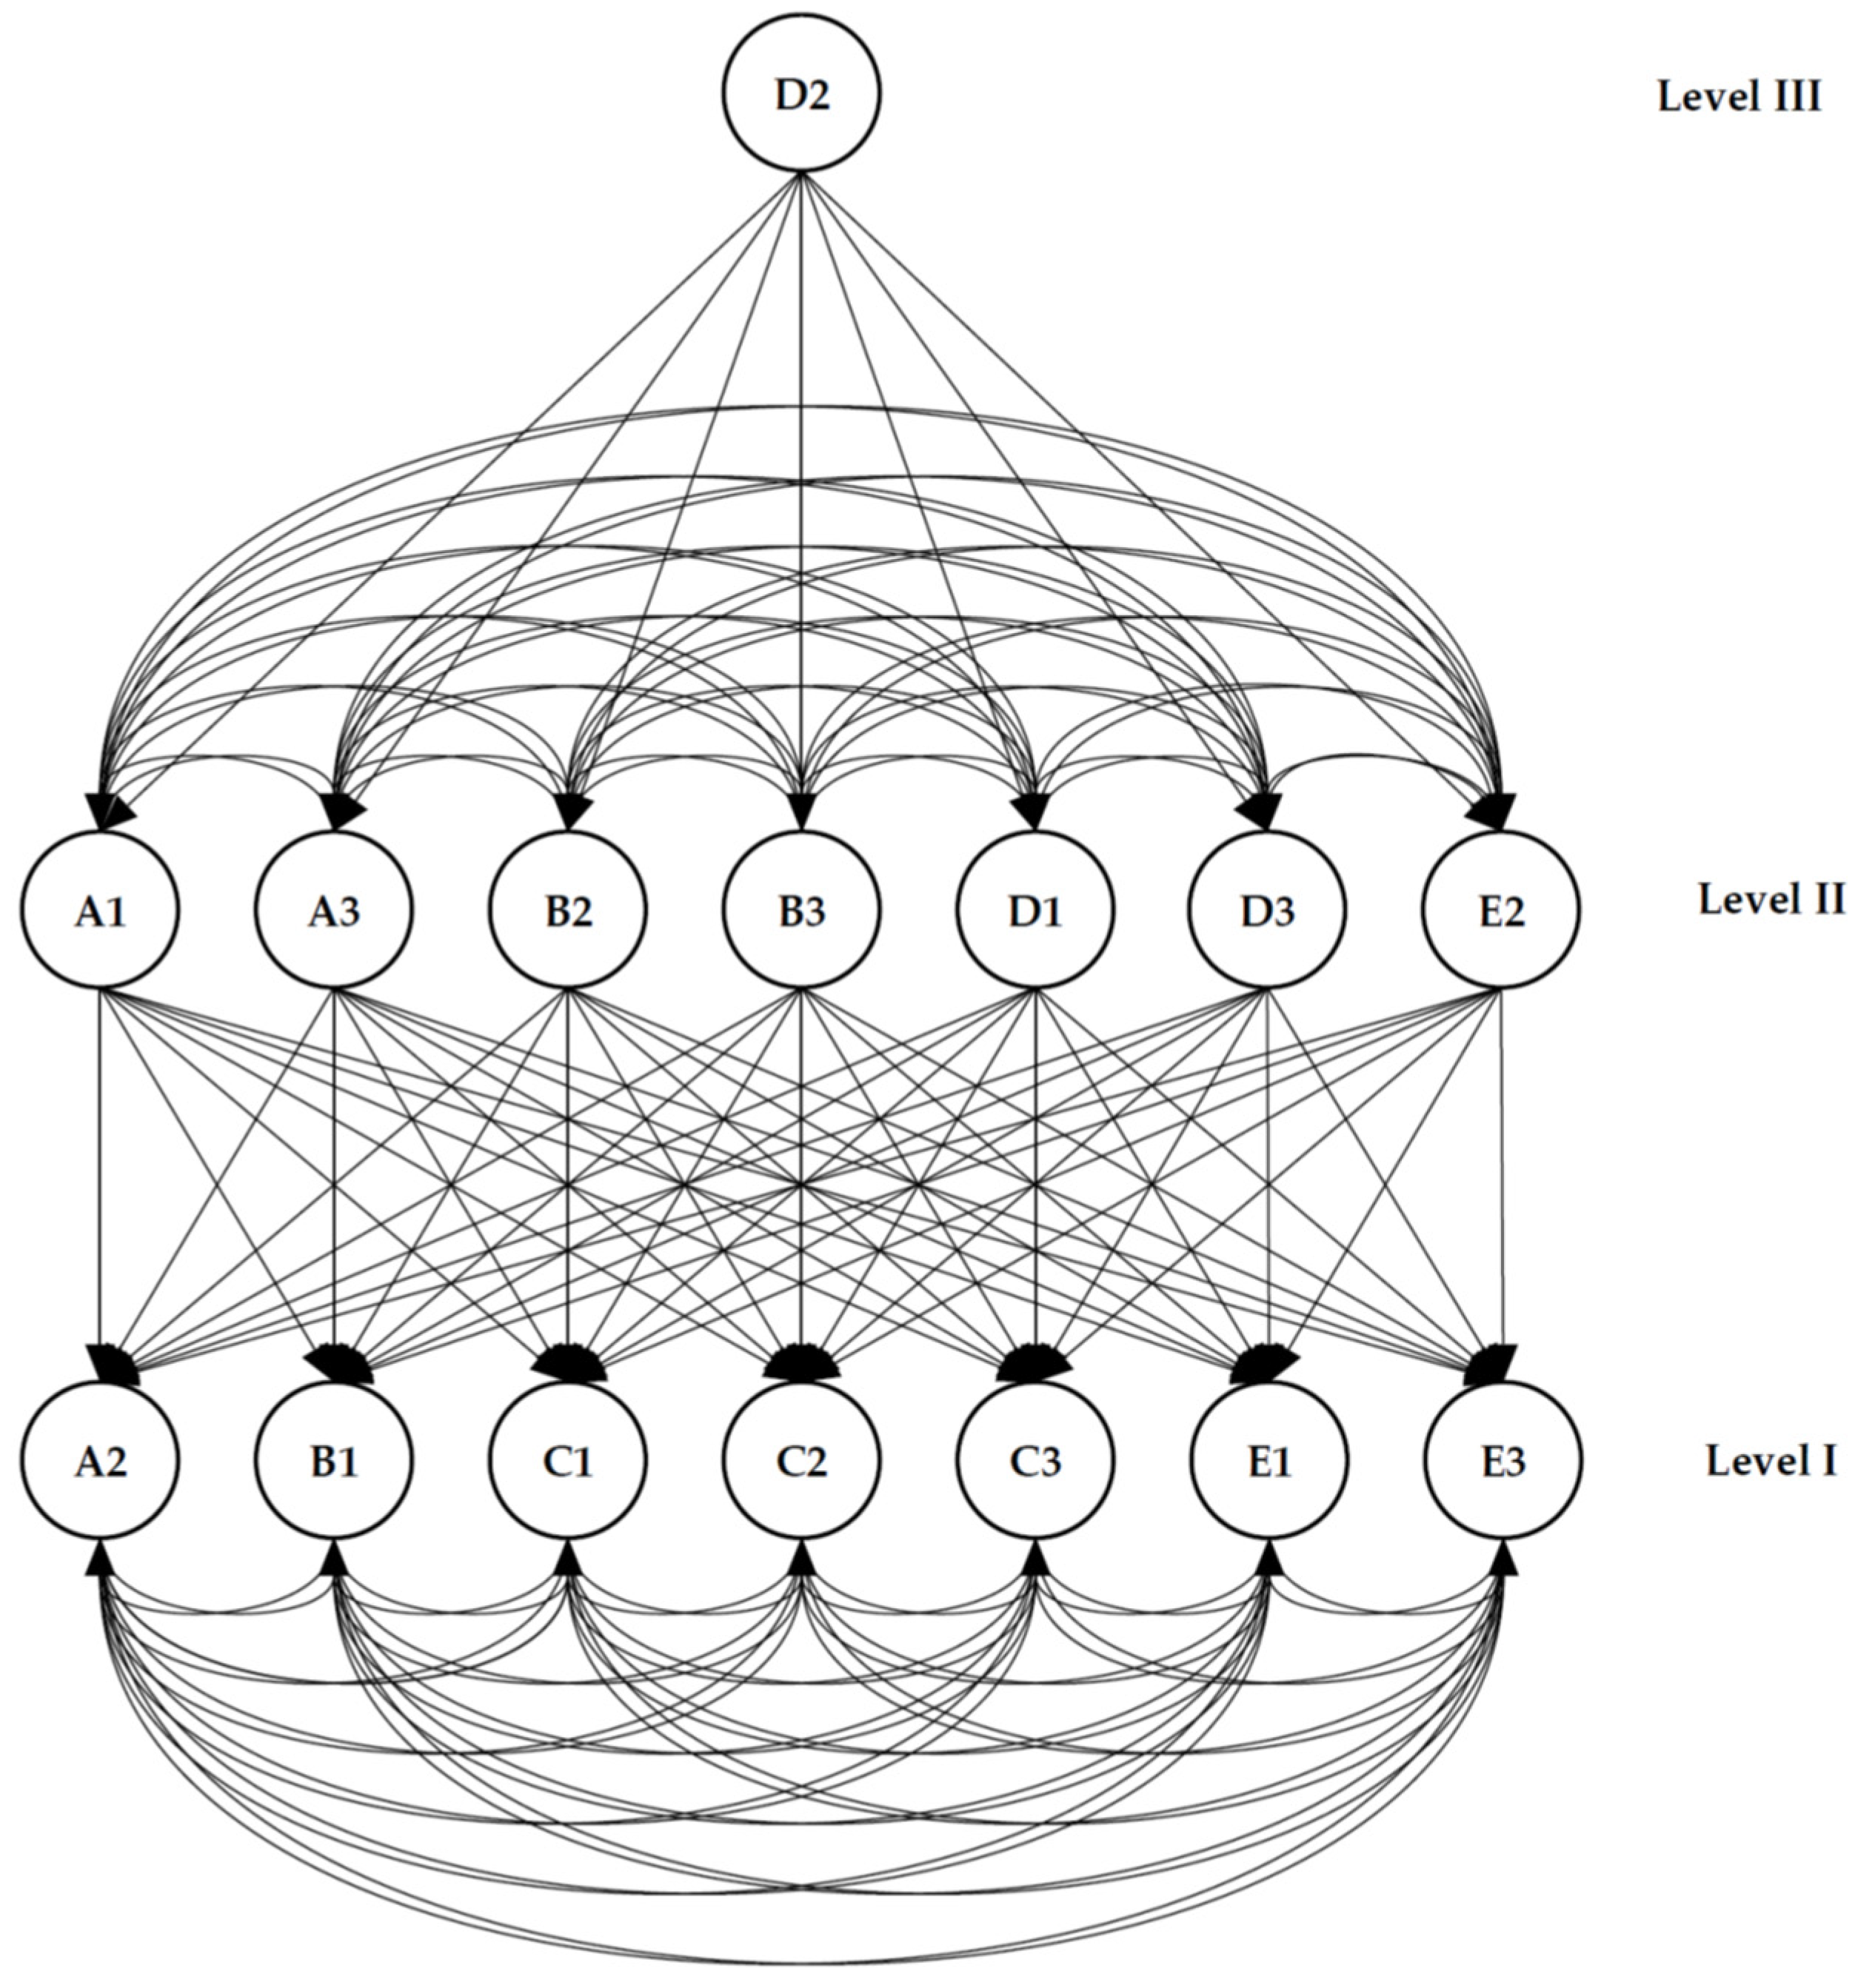
4.2. Results of the Interpretive Structure Modeling (ISM)
5. Discussion
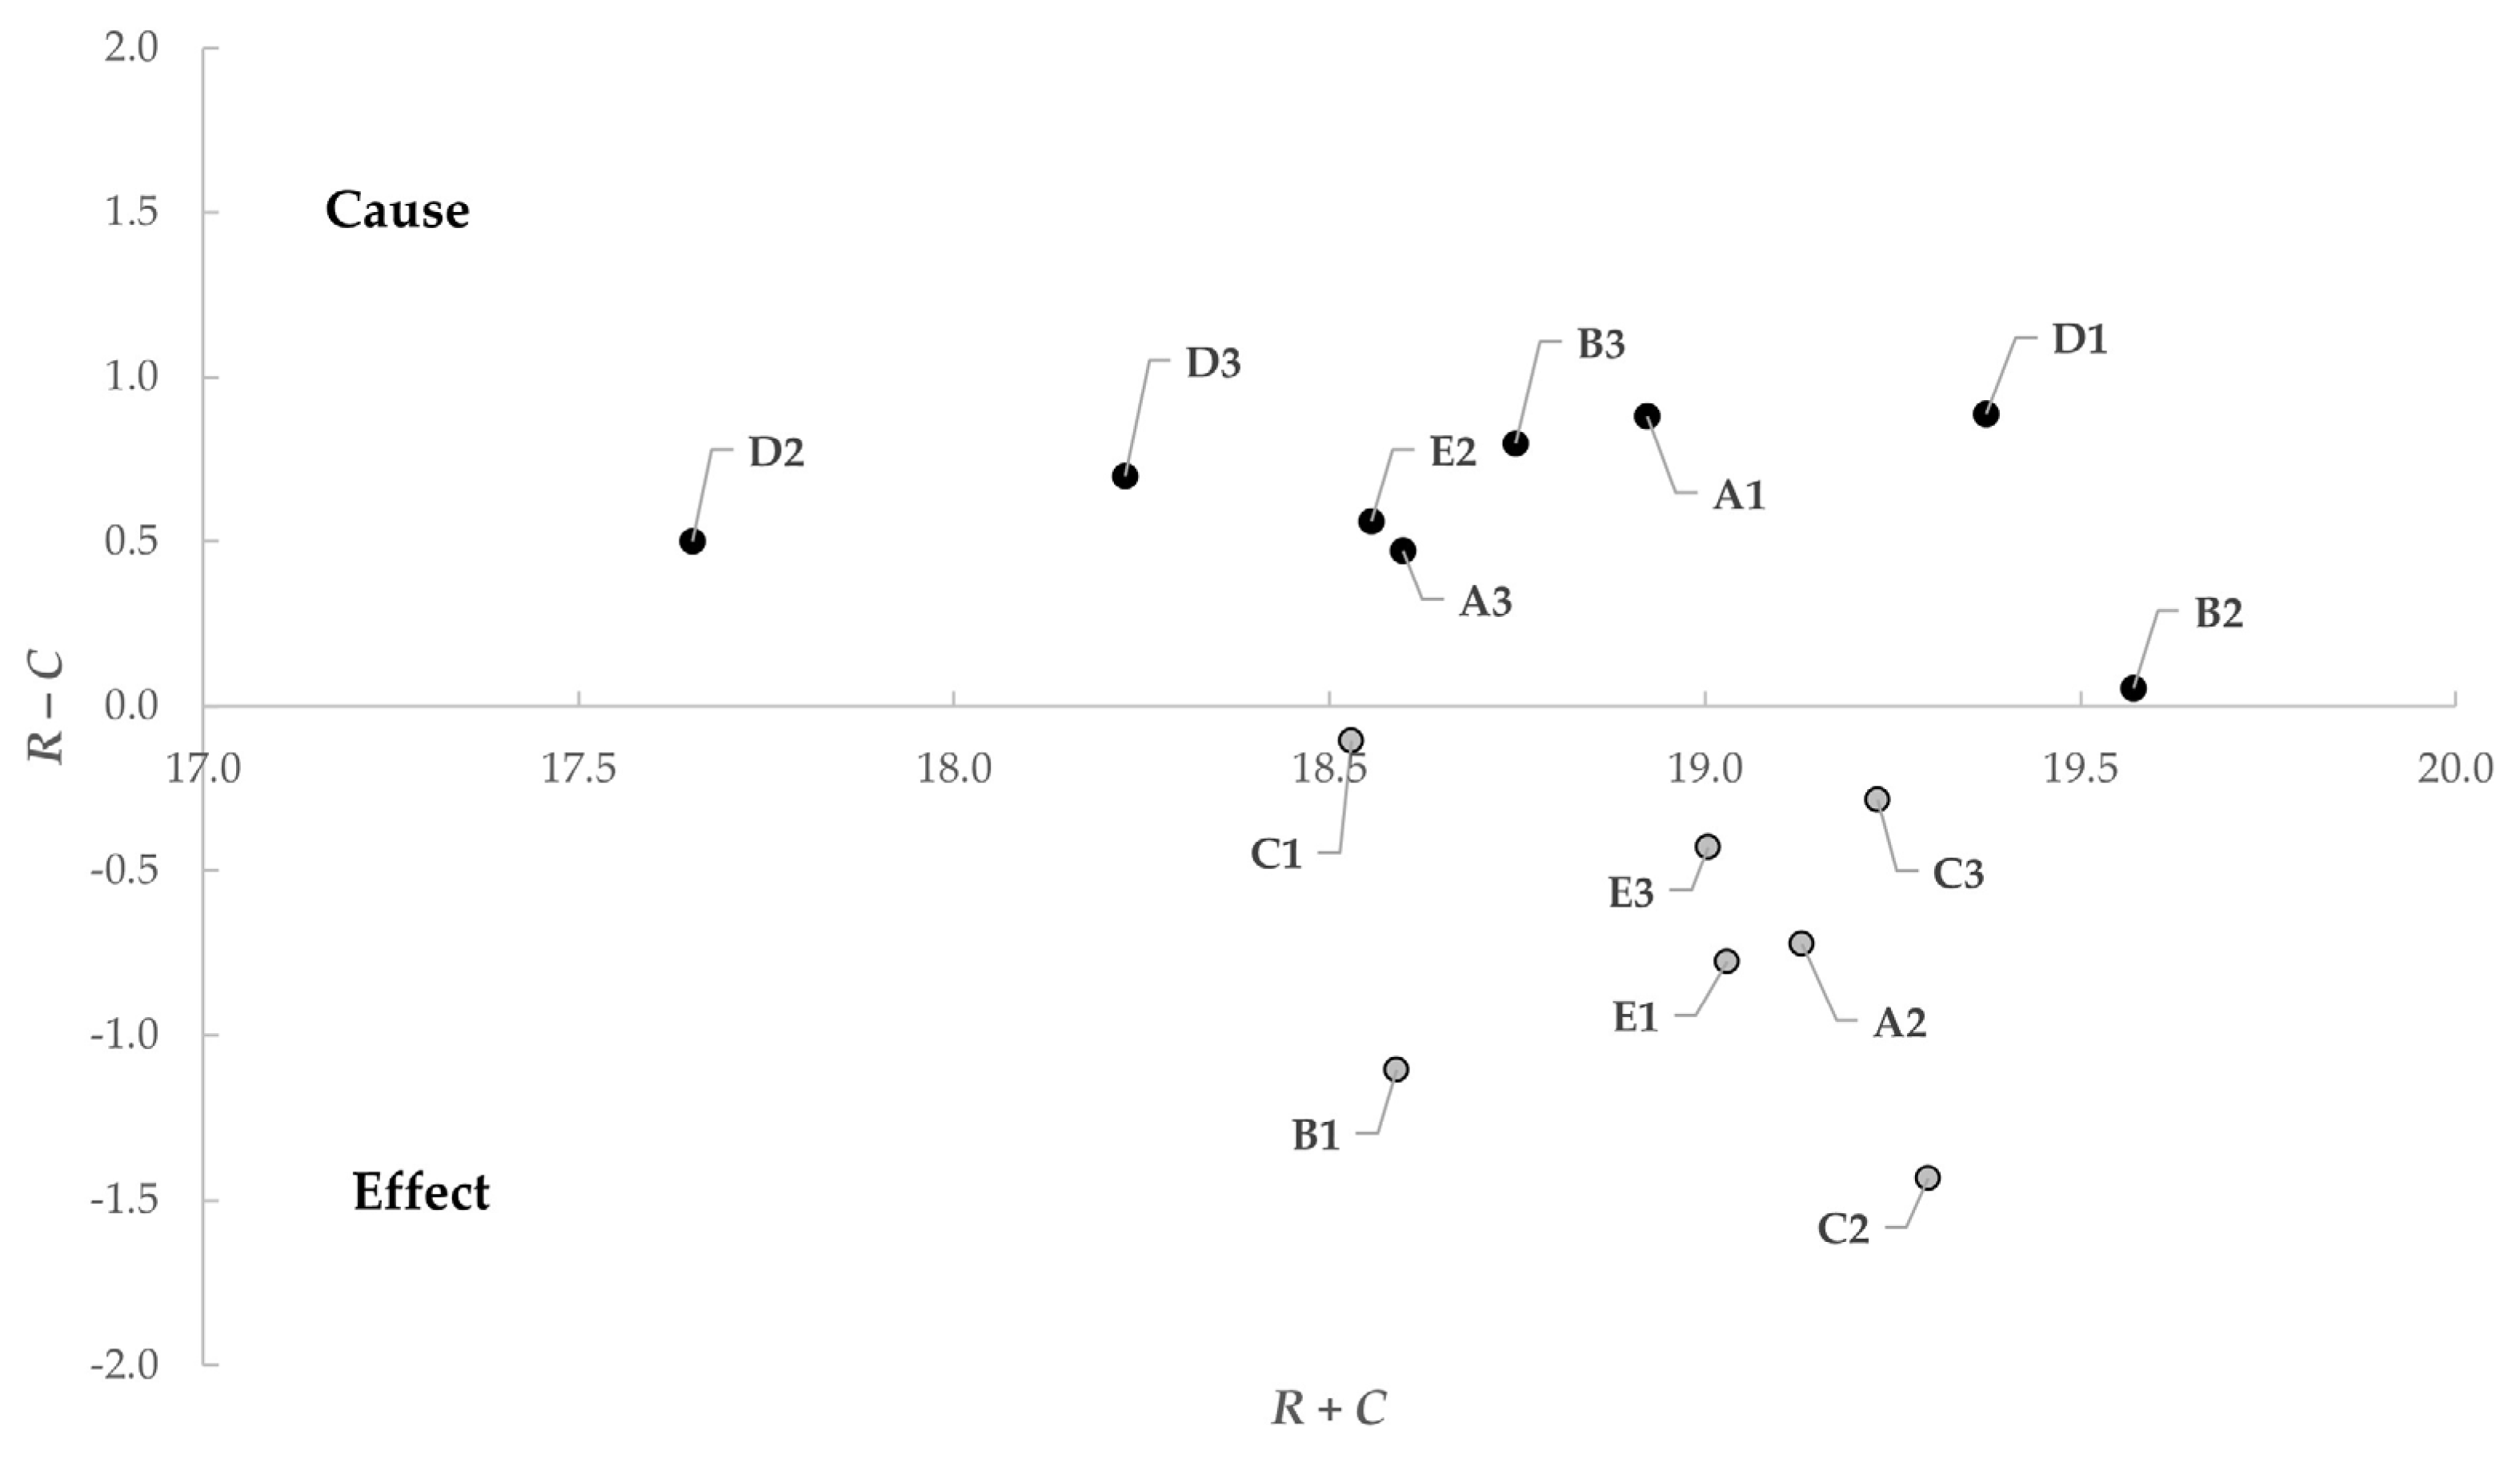
5.1. Discussion on the Results of DEMATEL
5.1.1. Cause Factors in Influencing Destination Image (DI)
5.1.2. Effect Factors in Influencing Destination Image (DI)
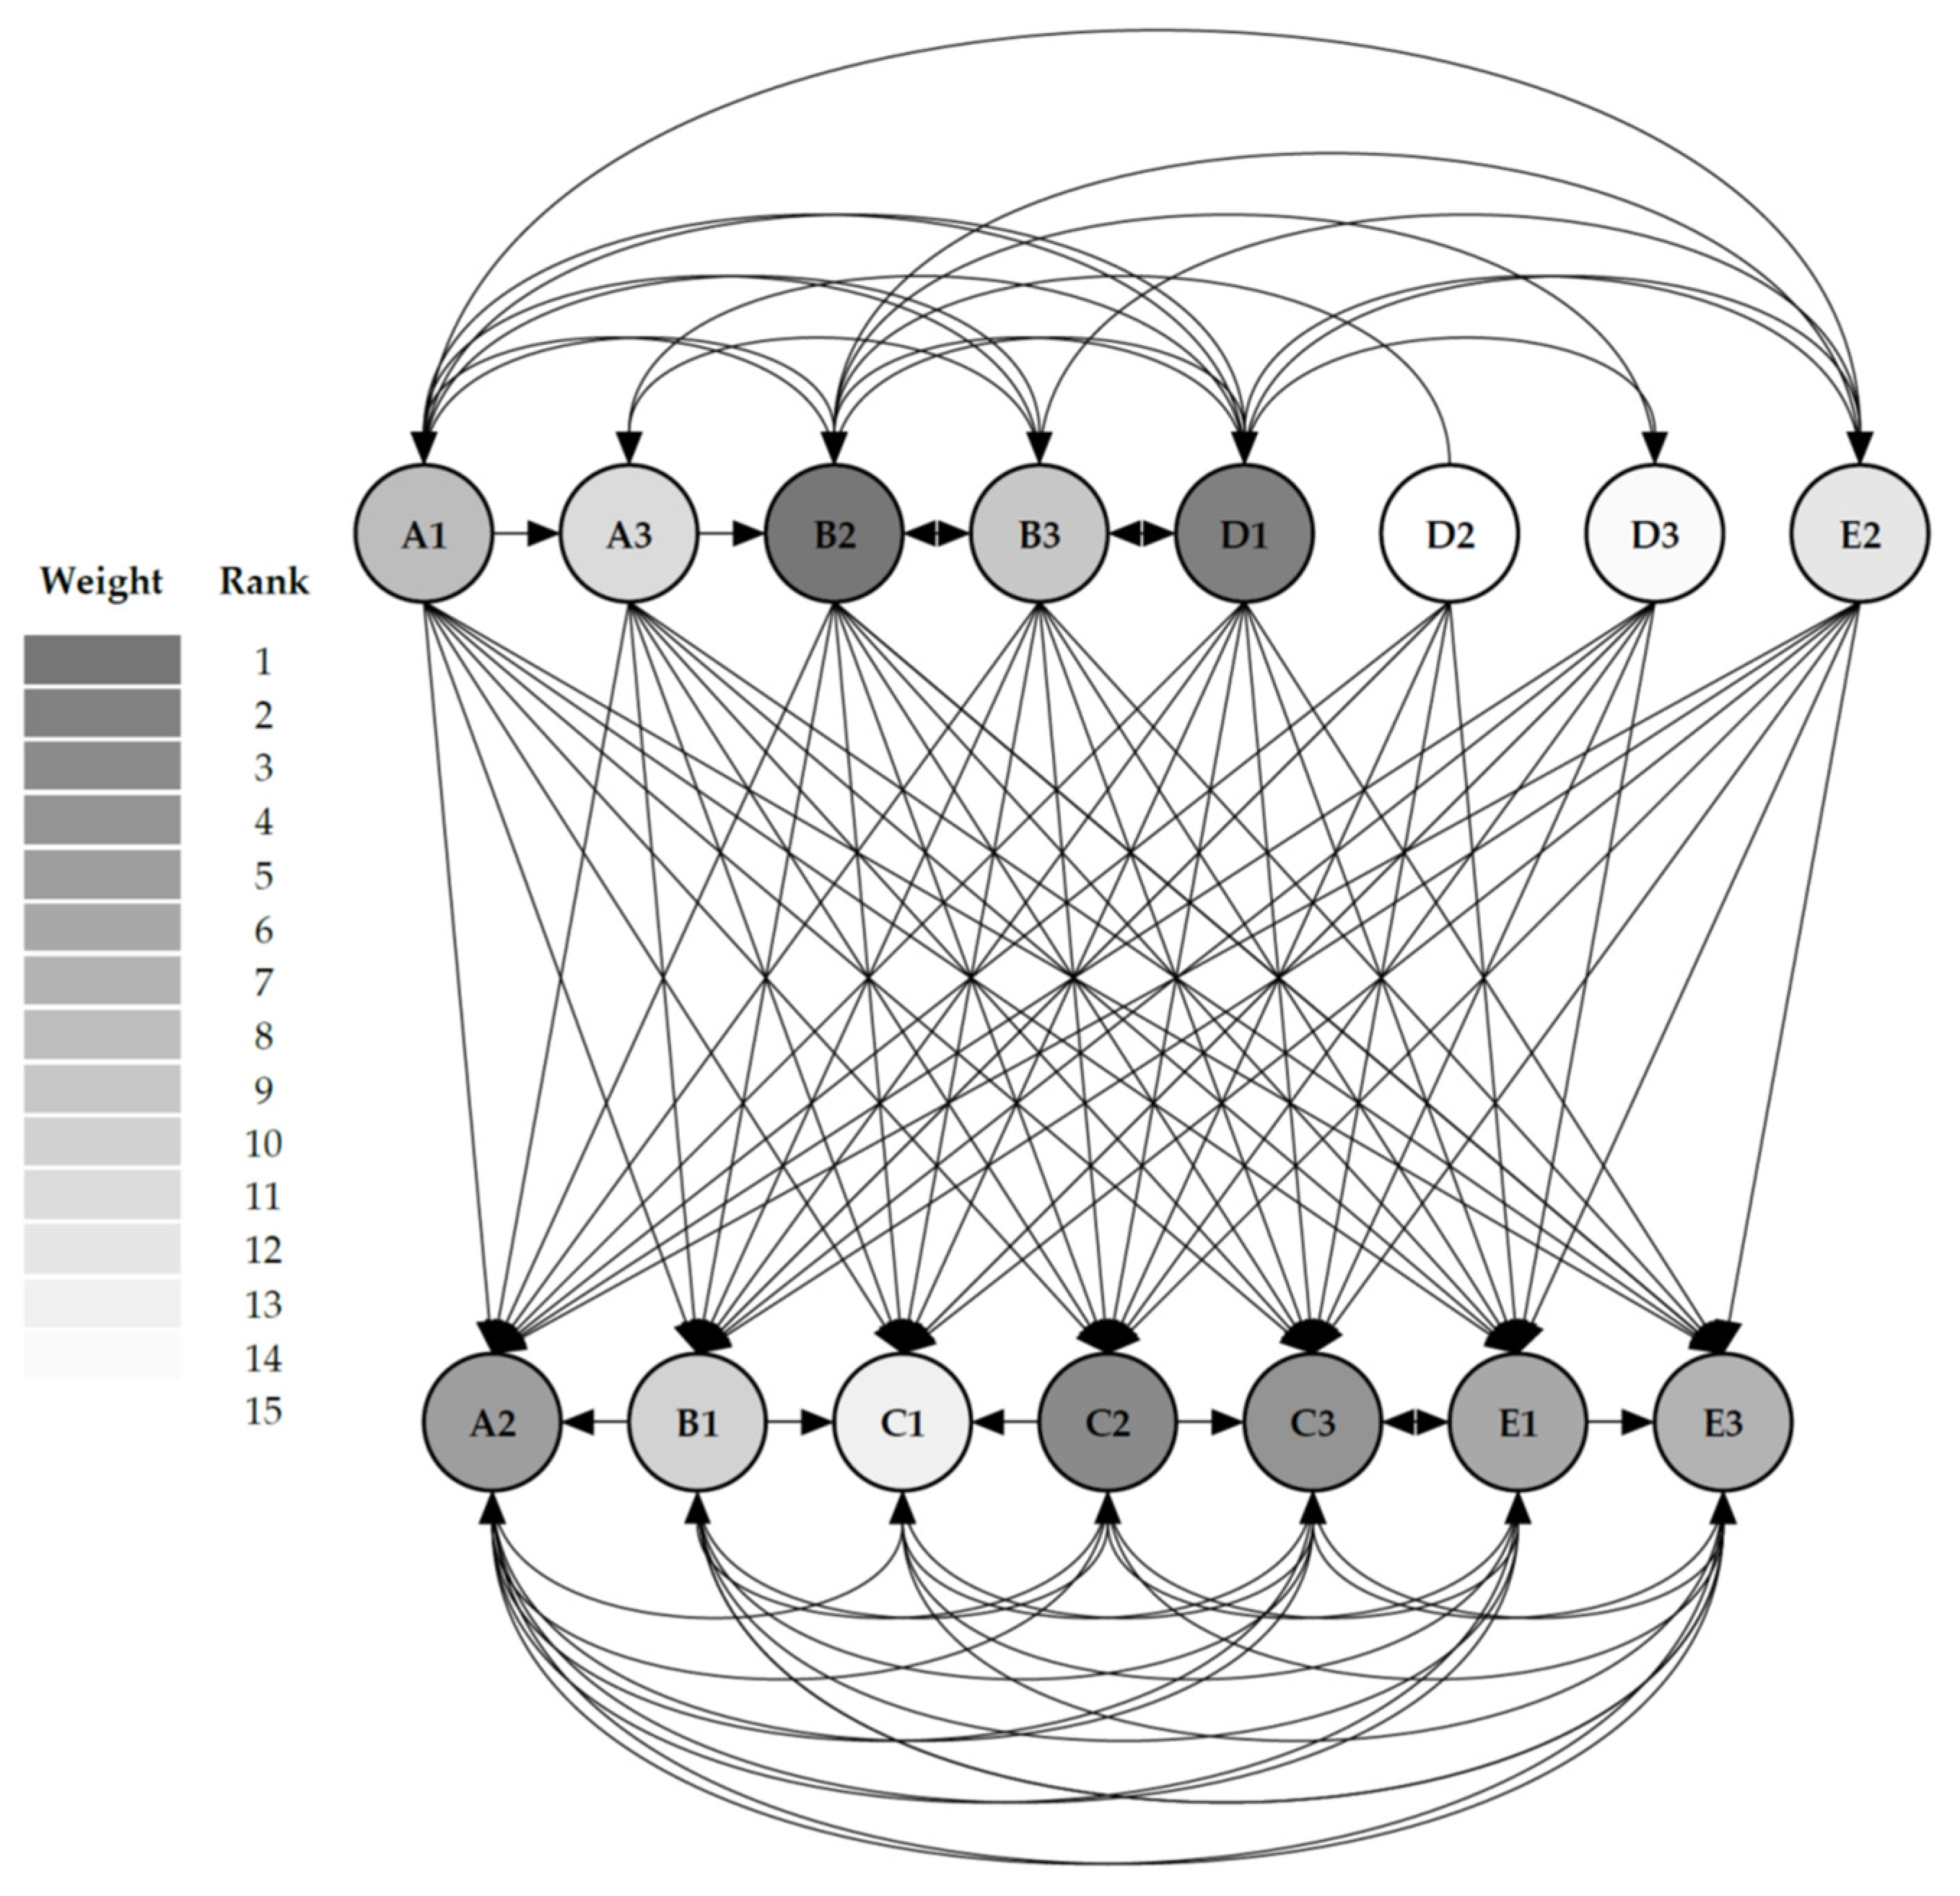
5.2. Discussion on the Results of ISM
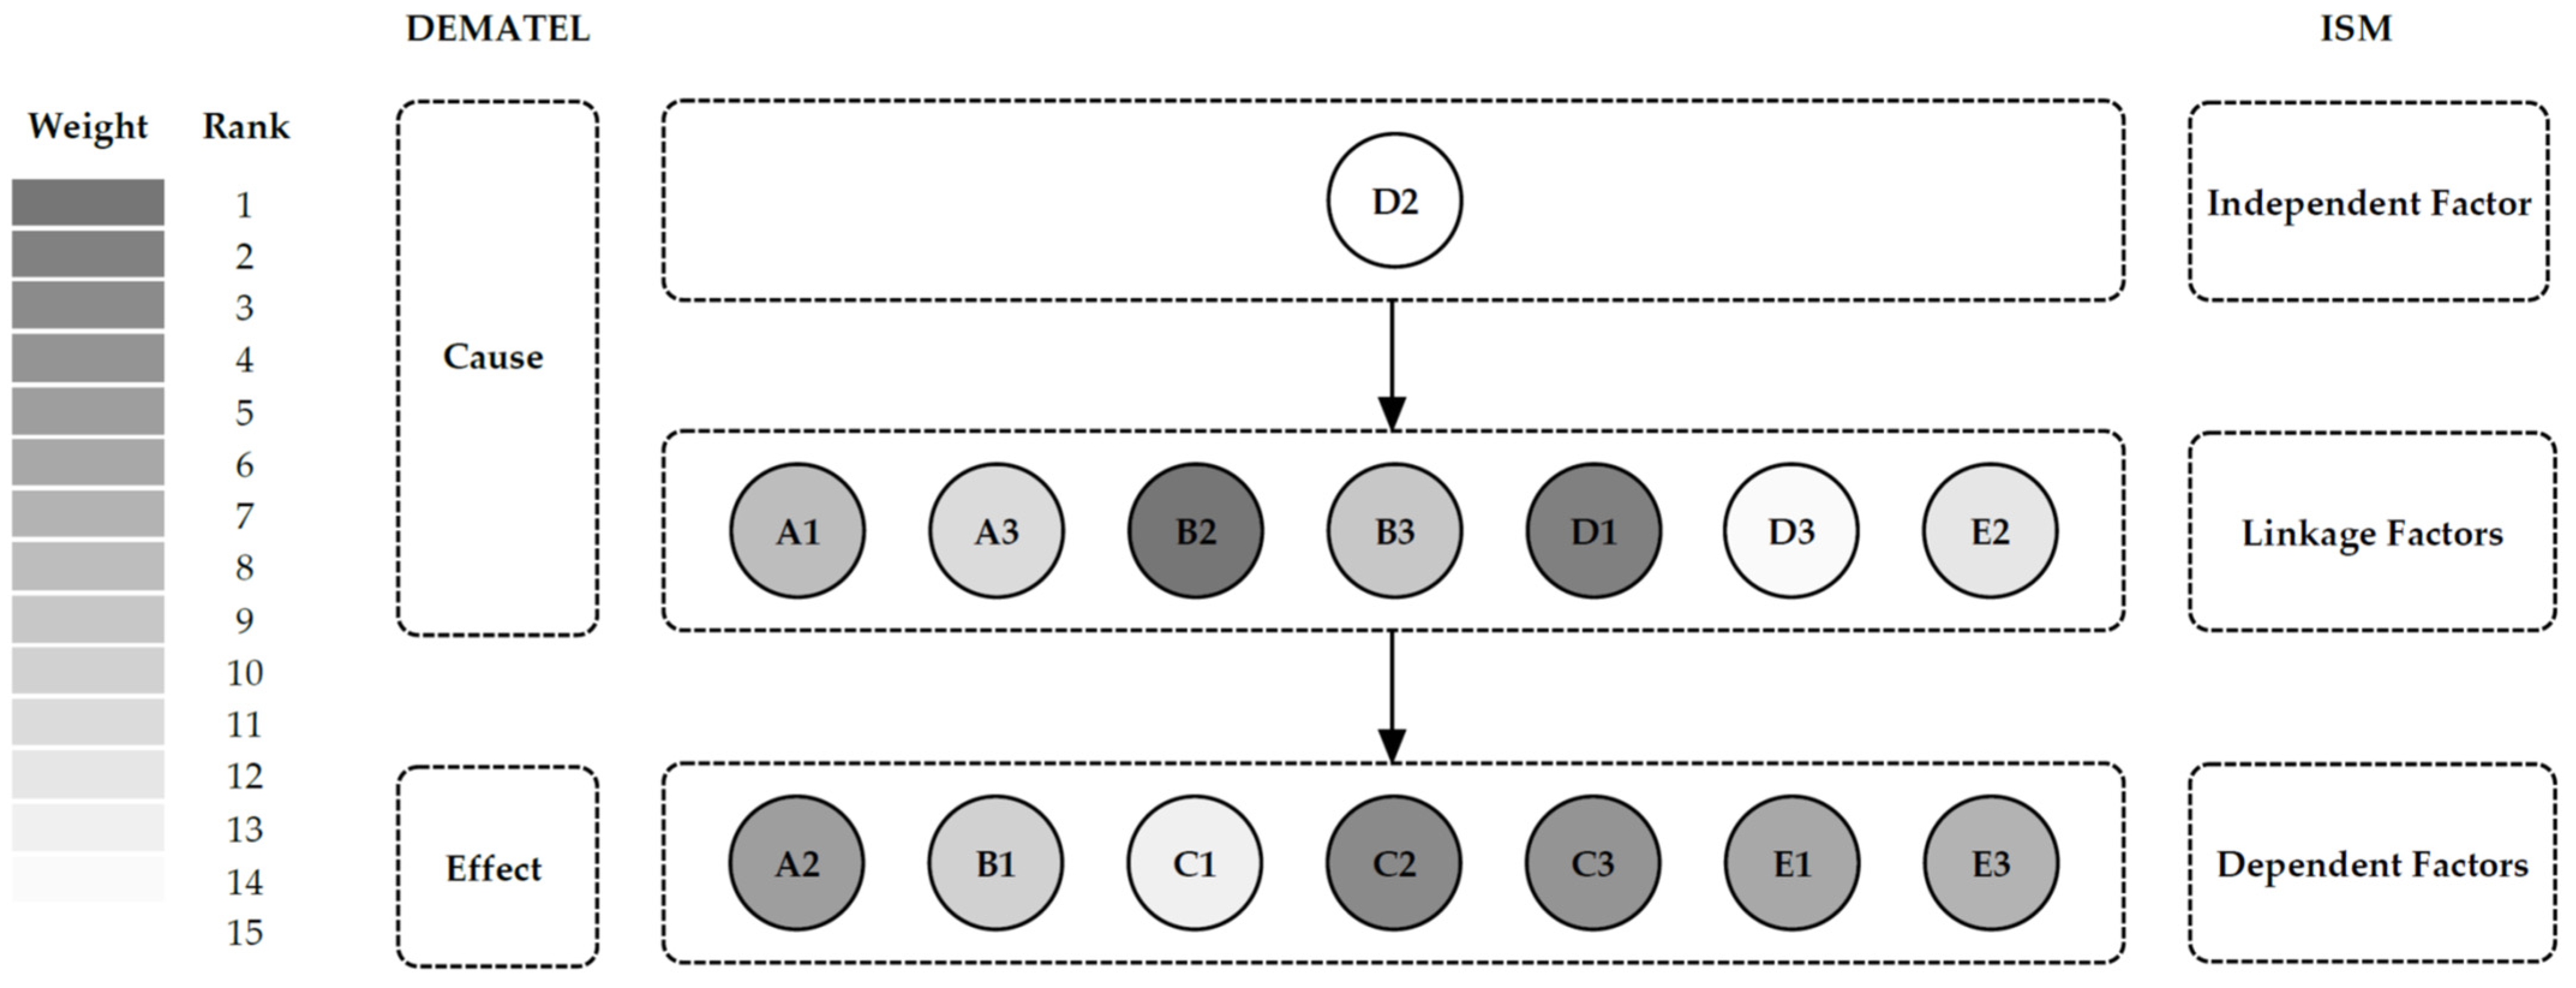
5.3. The Developed DEMATEL-ISM Model of Factors Influencing DI
6. Conclusions
Author Contributions
Funding
Institutional Review Board Statement
Informed Consent Statement
Data Availability Statement
Acknowledgments
Conflicts of Interest
Appendix A

| Expert Number | Qualification | Specialty | Occupational Sector | Years of Experience |
|---|---|---|---|---|
| 1 | Ph.D. | Tourism Management | University Professor | 20 |
| 2 | Master’s degree | Hospitality Management | Ministry of Tourism | 15 |
| 3 | Ph.D. | Tourism Management | Tourism Development Fund | 12 |
| 4 | Bachelor’s degree | Tourism | Ministry of Tourism | 10 |
| 5 | Ph.D. | Tourism Management | Tourism Authority | 7 |
| 6 | Master’s degree | Hospitality Management | Tourism Development Council | 6 |
| 7 | Bachelor’s degree | Tourism | Ministry of Tourism | 6 |
| 8 | Diploma | Travel and Tourism | Tourism Development Council | 5 |
| 9 | Bachelor’s degree | Tourism | Tourism Authority | 4 |
| 10 | Certificate | Tourism | Tourism Development Fund | 3 |
References
- Abellana, Dharyll Prince Mariscal, Donna Marie Canizares Rivero, Ma Elena Aparente, and Aries Rivero. 2021. Hybrid SVR-SARIMA model for tourism forecasting using PROMETHEE II as a selection methodology: A Philippine scenario. Journal of Tourism Futures 7: 78–97. [Google Scholar] [CrossRef]
- Afshardoost, Mona, and Mohammad Sadegh Eshaghi. 2020. Destination image and tourist behavioural intentions: A meta-analysis. Tourism Management 81: 104154. [Google Scholar] [CrossRef]
- Ageeva, Elena, and Pantea Foroudi. 2019. Tourists’ destination image through regional tourism: From supply and demand sides perspectives. Journal of Business Research 101: 334–48. [Google Scholar] [CrossRef]
- Akgün, Ali E., Hayat Ayar Senturk, Halit Keskin, and Izzet Onal. 2020. The relationships among nostalgic emotion, destination images and tourist behaviors: An empirical study of Istanbul. Journal of Destination Marketing & Management 16: 100355. [Google Scholar]
- Alcañiz, Enrique Bigné, Isabel Sánchez García, and Silvia Sanz Blas. 2005. Relationships among residents’ image, evaluation of the stay and post-purchase behaviour. Journal of Vacation Marketing 11: 291–302. [Google Scholar] [CrossRef]
- Andersen, Oddgeir, Hogne Øian, Øystein Aas, and Torvald Tangeland. 2018. Affective and cognitive dimensions of ski destination images. The case of Norway and the Lillehammer region. Scandinavian Journal of Hospitality and Tourism 18: 2–131. [Google Scholar] [CrossRef]
- Artuğer, Savaş, Burçin Cevdet Çetinsöz, and Ibrahim Kılıç. 2013. The effect of destination image on destination loyalty: An application in Alanya. European Journal of Business and Management 5: 124–36. [Google Scholar]
- Assaker, Guy, and Peter O’Connor. 2021. eWOM platforms in moderating the relationships between political and terrorism risk, destination image, and travel intent: The case of Lebanon. Journal of Travel Research 60: 503–19. [Google Scholar] [CrossRef]
- Aydoğan, Emel Kızılkaya, and Mihrimah Özmen. 2020. Travel and Tourism Competitiveness of Economies Around the World Using Rough SWARA and TODIM Method. In Strategic Innovative Marketing and Tourism. Cham: Springer, pp. 765–74. [Google Scholar]
- Ayhan, Çiğdem Kaptan, Tülay Cengiz Taşlı, Ferah Özkök, and Hasan Tatlı. 2020. Land use suitability analysis of rural tourism activities: Yenice, Turkey. Tourism Management 76: 103949. [Google Scholar] [CrossRef]
- Bakir, Mahmut, Şahap Akan, Kasım Kiraci, Darjan Karabasevic, Dragisa Stanujkic, and Gabrijela Popovic. 2020. Popovic, Multiple-criteria approach of the operational performance evaluation in the airline industry: Evidence from the emerging markets. Romanian Journal of Economic Forecasting 23: 149–72. [Google Scholar]
- Brans, Ph., and Jean Pierre Vincke. 1985. A preference ranking organization method: The PROMETHEE method for MCDM. Management Science 31: 647–56. [Google Scholar] [CrossRef]
- Brauers, Willem Karel, and Edmundas Kazimieras Zavadskas. 2006. The MOORA method and its application to privatization in a transition economy. Control and Cybernetics 35: 445–69. [Google Scholar]
- Chauhan, Ankur, Amol Singh, and Sanjay Jharkharia. 2018. An interpretive structural modeling (ISM) and decision-making trail and evaluation laboratory (DEMATEL) method approach for the analysis of barriers of waste recycling in India. Journal of the Air & Waste Management Association 68: 2–110. [Google Scholar]
- Dabphet, Siripen. 2017. Applying importance-performance analysis to identify competitive travel attributes: An application to regional destination image in Thailand. Journal of Community Development Research (Humanities and Social Sciences) 10: 3–21. [Google Scholar]
- Eid, Riyad, Yasser Ahmed El-Kassrawy, and Gomaa Agag. 2019. Integrating destination attributes, political (in) stability, destination image, tourist satisfaction, and intention to recommend: A study of UAE. Journal of Hospitality & Tourism Research 43: 6–866. [Google Scholar]
- Foroudi, Pantea, Tuğra Nazlı Akarsu, Elena Ageeva, Mohammad M. Foroudi, Charles Dennis, and T. C. Melewar. 2018. Promising the dream: Changing destination image of London through the effect of website place. Journal of Business Research 83: 97–110. [Google Scholar] [CrossRef]
- Gany, Kulsum Bibi. 2017. Visitors’ Perception of Destination Attractiveness: The Case of Selected Kimberley Resorts. Doctoral dissertation, Central University of Technology, Free State, Bloemfontein, South Africa. [Google Scholar]
- Garay, Lluís. 2019. Breaking down affective and cognitive attributes in the social media construction of the tourist destination image. Tourism Management Perspectives 32: 100560. [Google Scholar] [CrossRef]
- Gigović, Ljubomir, Dragan Pamučar, Zoran Bajić, and Milić Milićević. 2016. The combination of expert judgment and GIS-MAIRCA analysis for the selection of sites for ammunition depots. Sustainability 8: 372. [Google Scholar] [CrossRef]
- Gupta, Anjali, Shivangi Gupta, and Shekhar. 2021. Determining Interrelationship between Factors Impacting Foreign Direct Investment in Tourism: An ISM-based Approach. Asia-Pacific Journal of Management Research and Innovation 17: 17–30. [Google Scholar] [CrossRef]
- Haarhoff, Rene. 2018. Tourist perceptions of factors influencing destination image: A case study of selected Kimberley resorts. African Journal of Hospitality, Tourism and Leisure 7: 1–21. [Google Scholar]
- Haneef, Sunitha Kavunkil. 2017. A Model to Explore the Impact of Tourism Infrastructure on Destination Image for Effective Tourism Marketing. Salford: University of Salford. [Google Scholar]
- Hasan, Md Kamrul, Shamsul Kamariah Abdullah, Tek Yew Lew, and MD Faridul Islam. 2019. Determining factors of tourists’ loyalty to beach tourism destinations: A structural model. Asia Pacific Journal of Marketing and Logistics 32: 169–87. [Google Scholar] [CrossRef]
- Hassan, Salah, and Abeer A. Mahrous. 2019. Nation branding: The strategic imperative for sustainable market competitiveness. Journal of Humanities and Applied Social Sciences 1: 146–58. [Google Scholar] [CrossRef]
- Hosseini, Seyyed Mehdi, Mohammad Mahdi Paydar, and Mostafa Hajiaghaei-Keshteli. 2021. Recovery sol utions for ecotourism centers during the COVID-19 pandemic: Utilizing Fuzzy DEMATEL and Fuzzy VIKOR methods. Expert Systems with Applications 185: 115594. [Google Scholar] [CrossRef] [PubMed]
- Huete Alcocer, Nuria, and Víctor Raúl López Ruiz. 2020. The role of destination image in tourist satisfaction: The case of a heritage site. Economic Research-Ekonomska Istraživanja 33: 2444–61. [Google Scholar] [CrossRef]
- Huete-Alcocer, Nuria, Maria Pilar Martinez-Ruiz, Víctor Raúl López-Ruiz, and Alicia Izquiedo-Yusta. 2019. Archeological tourist destination image formation: Influence of information sources on the cognitive, affective and unique image. Frontiers in Psychology 10: 2382. [Google Scholar] [CrossRef]
- Huo, Tengfei, Xiaobo Cong, Cong Cheng, Weiguang Cai, and Jian Zuo. 2023. What is the driving mechanism for the carbon emissions in the building sector? An integrated DEMATEL-ISM model. Energy 274: 127399. [Google Scholar] [CrossRef]
- Ingram, Hadyn, Saloomeh Tabari, and Wanthanee Watthanakhomprathip. 2013. The impact of political instability on tourism: Case of Thailand. Worldwide Hospitality and Tourism Themes 5: 92–103. [Google Scholar] [CrossRef]
- Jafari-Moghadam, Saeed, M. Zali, and Hadi Sanaeepour. 2017. Tourism entrepreneurship policy: A hybrid MCDM model combining DEMATEL and ANP (DANP). Decision Science Letters 6: 233–50. [Google Scholar] [CrossRef]
- Jafari-Sadeghi, Vahid, Hannan Amoozad Mahdiraji, Stefano Bresciani, and Anna Claudia Pellicelli. 2021. Context-specific micro-foundations and successful SME internationalisation in emerging markets: A mixed-method analysis of managerial resources and dynamic capabilities. Journal of Business Research 134: 352–64. [Google Scholar] [CrossRef]
- Kani, Yusuf, Yuhanis Abdul Aziz, Murali Sambasivan, and Jamil Bojei. 2017. Antecedents and outcomes of destination image of Malaysia. Journal of Hospitality and Tourism Management 32: 89–98. [Google Scholar] [CrossRef]
- Keršuliene, Violeta, Edmundas Kazimieras Zavadskas, and Zenonas Turskis. 2010. Selection of ra tional dispute resolution method by applying new step-wise weight assessment ratio analysis (SWARA). Journal of Business Economics and Management 11: 243–58. [Google Scholar] [CrossRef]
- Khan, Mohammad J., Shankar Chelliah, Mahmod S. Haron, and Sahrish Ahmed. 2017. Role of travel motivations, perceived risks and travel constraints on destination image and visit intention in medical tourism: Theoretical model. Sultan Qaboos University Medical Journal 17: e11. [Google Scholar] [CrossRef] [PubMed]
- Khan, Naushad, Absar Ul Hassan, Shah Fahad, and Mahnoor Naushad. 2020. Factors Affecting Tourism Industry and Its Impacts on Global Economy of the World. Available online: https://ssrn.com/abstract=3559353 (accessed on 2 July 2023).
- Kim, Soyeon, Xinran Lehto, and Jay Kandampully. 2019. The role of familiarity in consumer destination image formation. Tourism Review 74: 885–901. [Google Scholar] [CrossRef]
- Koens, Ko, Albert Postma, and Bernadett Papp. 2018. Is Overtourism Overused? Understanding the Impact of Tourism in a City Context. Sustainability 10: 4384. [Google Scholar] [CrossRef]
- Kuok, Rockie U. Kei, Tay T. R. Koo, and Christine Lim. 2023. Economic policy uncertainty and international tourism demand: A global vector autoregressive approach. Journal of Travel Research 62: 540–62. [Google Scholar] [CrossRef]
- Lam, Jason M. S., Hishamuddin Ismail, and Sean Lee. 2020. From desktop to destination: User-generated content platforms, co-created online experiences, destination image and satisfaction. Journal of Destination Marketing & Management 18: 100490. [Google Scholar]
- Lee, Say Wah, and Ke Xue. 2020. A model of destination loyalty: Integrating destination image and sustainable tourism. Asia Pacific Journal of Tourism Research 25: 393–408. [Google Scholar] [CrossRef]
- Liang, Yi, Haichao Wang, and Xinyue Zhao. 2022. Analysis of factors affecting economic operation of electric vehicle charging station based on DEMATEL-ISM. Computers & Industrial Engineering 163: 107818. [Google Scholar]
- Mak, Athena H. N. 2017. Online destination image: Comparing national tourism organisation’s and tourists’ perspectives. Tourism Management 60: 280–97. [Google Scholar] [CrossRef]
- Martín, Martín, José María, Jose Manuel Guaita Martínez, and José Antonio Salinas Fernández. 2018. An Analysis of the Factors behind the Citizen’s Attitude of Rejection towards Tourism in a Context of Overtourism and Economic Dependence on This Activity. Sustainability 10: 2851. [Google Scholar] [CrossRef]
- Maymand, Mohammad Mahmoudi, Seyed Hojjat Bazazzadeh, and Roya Eghbal. 2017. hybrid MCDM model for identification and prioritization of the factors affecting shopping behaviour of foreign tourists. International Journal of Services and Operations Management 26: 294–317. [Google Scholar] [CrossRef]
- Medvedeva, Gayane. 2021. The Impact of Political Instability on Tourism Development in Developing Countries. International Business and Tourism Society (IB&TS) 7. Available online: http://ib-ts.org/index.php/journal/article/view/10 (accessed on 20 June 2023).
- Mi, Chuanmin, Yetian Chen, Chiung-Shu Cheng, Joselyne Lucky Uwanyirigira, and Ching-Torng Lin. 2019. Exploring the determinants of hot spring tourism customer satisfaction: Causal relationships analysis using ISM. Sustainability 11: 2613. [Google Scholar] [CrossRef]
- Millar, Michelle, Michael D. Collins, and David L. Jones. 2017. Exploring the relationship between destination image, aggressive street behavior, and tourist safety. Journal of Hospitality Marketing & Management 26: 735–51. [Google Scholar]
- Moon, Hyoungeun, and Heesup Han. 2019. Tourist experience quality and loyalty to an island destination: The moderating impact of destination image. Journal of Travel & Tourism Marketing 36: 43–59. [Google Scholar]
- Moradi, Erfan, Mohammad Ehsani, Marjan Saffari, and Rasool Norouzi Seyed Hosseini. 2023. How can destination competitiveness play an essential role in small destnation sports tourism development? Integrated ISM-MICMAC modelling of key factors. Journal of Hospitality and Tourism Insights 6: 1222–52. [Google Scholar] [CrossRef]
- Moreno-González, Antonio-Angel, Carmelo J. León, and Carlos Fernández-Hernández. 2020. Health destination image: The influence of public health management and well-being conditions. Journal of Destination Marketing & Management 16: 100430. [Google Scholar]
- Navarrete-Hernandez, Pablo, and P. Christopher Zegras. 2023. Mind the perception gap: The impact of bus rapid transit infrastructure on travelers’ perceptions of affective subjective well-being. Transportation Research Part A: Policy and Practice 172: 103670. [Google Scholar] [CrossRef]
- Nguyen Viet, Bang, Huu Phuc Dang, and Ho Hai Nguyen. 2020. Revisit intention and satisfaction: The role of destination image, perceived risk, and cultural contact. Cogent Business & Management 7: 1796249. [Google Scholar]
- Nilashi, Mehrbakhsh, Sarminah Samad, Azizah Abdul Manaf, Hossein Ahmadi, Tarik A. Rashid, Asmaa Munshi, Wafa Almukadi, Othman Ibrahim, and Omed Hassan Ahmed. 2019. Factors influencing medical tourism adoption in Malaysia: A DEMATEL-Fuzzy TOPSIS approach. Computers & Industrial Engineering 137: 106005. [Google Scholar]
- Ocampo, Lanndon, Junine Angela Ebisa, Jefferson Ombe, and Meredith Geen Escoto. 2018. Sustainable eco-tourism indicators with fuzzy Delphi method—A Philippine perspective. Ecological Indicators 93: 874–88. [Google Scholar] [CrossRef]
- Papadimitriou, Dimitra, Kyriaki Kaplanidou, and Artemisia Apostolopoulou. 2018. Destination image components and word-of-mouth intentions in urban tourism: A multigroup approach. Journal of Hospitality & Tourism Research 42: 503–27. [Google Scholar]
- Papavasiliou, Vasilis. 2022. Collective Memory and Narrated Destination Image: Interpreting the Tour Guides Narratives in Guided Tours. Available online: https://theses.lib.polyu.edu.hk/bitstream/200/11952/3/6384.pdf (accessed on 6 September 2023).
- Papić, Miloš, Dušan Garabinović, Marija Blagojević, Miljan Leković, Marija Kostić, and Darko Dimitrovski. 2023. Multi-criteria Decision-making in the Tourism Domain: The Past, Present and Future of the Research Field. Journal of Scientific & Industrial Research 82: 721–35. Available online: https://scidar.kg.ac.rs/bitstream/123456789/18647/1/Papi%c4%87_et_al_JSIR_2023.pdf (accessed on 6 September 2023).
- Pascual-Fraile, María Del Pilar, Pilar Talón-Ballestero, Teresa Villacé-Molinero, and Antonio-Rafael Ramos-Rodríguez. 2022. Communication for destinations’ image in crises and disasters: A review and future research agenda. Tourism Review. Available online: https://www.emerald.com/insight/content/doi/10.1108/TR-11-2021-0521/full/html (accessed on 2 July 2023).
- Peralta, Rachel Luna. 2019. How vlogging promotes a destination image: A narrative analysis of popular travel vlogs about the Philippines. Place Branding and Public Diplomacy 15: 244–56. [Google Scholar] [CrossRef]
- Perkumienė, Dalia, and Rasa Pranskūnienė. 2019. Overtourism: Between the Right to Travel and Residents’ Rights. Sustainability 11: 2138. [Google Scholar] [CrossRef]
- Perpiña, Laura, Raquel Camprubí, and Lluís Prats. 2019. Destination image versus risk perception. Journal of Hospitality & Tourism Research 43: 3–19. [Google Scholar]
- Pramod, Sharma, and Jogendra Kumar Nayak. 2018. Testing the role of tourists’ emotional experiences in predicting destination image, satisfaction, and behavioral intentions: A case of wellness tourism. Tourism Management Perspectives 28: 41–52. [Google Scholar]
- Prayag, Girish, Sameer Hosany, Birgit Muskat, and Giacomo Del Chiappa. 2017. Understanding the relationships between tourists’ emotional experiences, perceived overall image, satisfaction, and intention to recommend. Journal of Travel Research 56: 41–54. [Google Scholar] [CrossRef]
- Puri, Goldi, and Kuldeep Singh. 2018. The role of service quality and customer satisfaction in tourism industry: A review of SERVQUAL Model. International Journal of Research and Analytical Reviews 5: 745–51. Available online: https://ssrn.com/abstract=3846760 (accessed on 6 September 2023).
- Ragab, Hany, Abeer A. Mahrous, and Ahmed Ghoneim. 2020. Egypt’s perceived destination image and its impact on tourist’s future behavioural intentions. International Journal of Tourism Cities 6: 449–66. [Google Scholar] [CrossRef]
- Ragb, Hany, Abeer A. Mahrous, and Ahmed Ghoneim. 2020. A proposed measurement scale for mixed-images destinations and its interrelationships with destination loyalty and travel experience. Tourism Management Perspectives 35: 100677. [Google Scholar] [CrossRef]
- Rashmi, Rashmi, Rohit Singh, Mukesh Chand, and Shwetank Avikal. 2019. An MCDM-based approach for selecting the best state for tourism in India. In Harmony Search and Nature Inspired Optimization Algorithms: Theory and Applications, ICHSA 2018. Singapore: Springer, pp. 17–26. [Google Scholar]
- Ren, Jingzheng, and Jingzheng Ren. 2020. 2-Tuple DEMATEL for Complex Interrelationships Analysis: Barriers Identification, Cause-Effect Analysis and Policy Implications for Sustainable Tourism Industry. In Advanced Operations Management for Complex Systems Analysis. Cham: Springer, pp. 33–56. [Google Scholar]
- Ruan, Wen-Qi, Yong-Quan Li, and Chih-Hsing Sam Liu. 2017. Measuring tourism risk impacts on destination image. Sustainability 9: 1501. [Google Scholar] [CrossRef]
- Saaty, Thomas L. 1996. Decision Making with Dependence and Feedback: Analytic Network Process. Pittsburgh: RWS Publications. [Google Scholar]
- Saaty, Thomas L. 2008. Decision making with the analytic hierarchy process. International Journal of Services Sciences 1: 83–98. [Google Scholar] [CrossRef]
- Servidio, Rocco. 2015. Images, affective evaluation and personality traits in tourist behaviour: An exploratory study with Italian postcards. Tourism Management Perspectives 16: 237–46. [Google Scholar] [CrossRef]
- Shani, Amir, and Youcheng Wang. 2011. Destination image development and communication. In Destination marketing and management: Theories and Applications. Wallingford: Cabi, pp. 130–48. [Google Scholar]
- Shen, Pengyi. 2012. A study on the effects of social responsibility of tourism enterprises on destination image and tourist loyalty. Tourism Tribune/Lvyou Xuekan 27: 72–79. [Google Scholar]
- Simancas Cruz, Moisés, and María Pilar Peñarrubia Zaragoza. 2019. Analysis of the Accommodation Density in Coastal Tourism Areas of Insular Destinations from the Perspective of Overtourism. Sustainability 11: 3031. [Google Scholar] [CrossRef]
- Sorooshian, Shahryar, Madjid Tavana, and Samuel Ribeiro-Navarrete. 2023. From classical interpretive structural modeling to total interpretive structural modeling and beyond: A half-century of business research. Journal of Business Research 157: 113642. [Google Scholar] [CrossRef]
- Stević, Ivana, Stevan R. Stević, and Zélia Maria de Jesus Breda. 2019. Application of MCDM Methods to Tourism Evaluation of Cultural Sites. In Cultural Urban Heritage. Cham: Springer, pp. 357–81. [Google Scholar]
- Stylidis, Dimitrios, Amir Shani, and Yaniv Belhassen. 2017. Testing an integrated destination image model across residents and tourists. Tourism Management 58: 184–95. [Google Scholar] [CrossRef]
- Stylidis, Dimitrios, Kyle Maurice Woosnam, and Asli D. A. Tasci. 2022. The effect of resident-tourist interaction quality on destination image and loyalty. Journal of Sustainable Tourism 30: 1219–1239. [Google Scholar] [CrossRef]
- Thakkar, Jitesh J. 2021. Multi-Criteria Decision Making, Vol. 336. Singapore: Springer, pp. 1–365. [Google Scholar]
- Ukpabi, Dandison C., and Heikki Karjaluoto. 2017. Consumers’ acceptance of information and communications technology in tourism: A review. Telematics and Informatics 34: 618–44. [Google Scholar] [CrossRef]
- Van Niekerk, Mathilda. 2017. Contemporary issues in events, festivals and destination management. International Journal of Contemporary Hospitality Management 29: 842–47. [Google Scholar] [CrossRef]
- Virkar, Anjali R., and Prita D. Mallya. 2018. A review of dimensions of tourism transport affecting tourist satisfaction. Indian Journal of Commerce and Management Studies 9: 72–80. [Google Scholar] [CrossRef]
- Warshall, Stephen. 1962. A theorem on boolean matrices. Journal of the ACM (JACM) 9: 11–12. Available online: https://dl.acm.org/doi/pdf/10.1145/321105.321107 (accessed on 2 July 2023). [CrossRef]
- Weng, Gangmin, Yue Pan, and Jianpu Li. 2021. Study on the influencing factors and acting path of the sustainable development of rural tourism based on EEam-ISM model. Sustainability 13: 5682. [Google Scholar] [CrossRef]
- Widayati, Christina Catur, Hapzi Ali, Dudi Permana, and Arissetyanto Nugroho. 2020. The role of destination image on visiting decisions through word of mouth in urban tourism in Yogyakarta. International Journal of Innovation, Creativity and Change 12: 177–96. [Google Scholar]
- Woosnam, Kyle Maurice, Dimitrios Stylidis, and Milan Ivkov. 2020. Explaining conative destination image through cognitive and affective destination image and emotional solidarity with residents. Journal of Sustainable Tourism 28: 917–35. [Google Scholar] [CrossRef]
- WTTC. 2022. «Travel and Tourism Economic Impact 2019». Available online: https://wttc.org/Portals/0/Documents/Reports/2022/EIR2022-Global%20Trends.pdf (accessed on 22 May 2023).
- Xiahou, Xiaer, Yifan Wu, Tianle Duan, Peng Lin, Funing Li, Xiaojun Qu, Long Liu, Qiming Li, and Jiaxin Liu. 2022. Analyzing critical factors for the smart construction site development: A DEMATEL-ISM based approach. Buildings 12: 116. [Google Scholar] [CrossRef]
- Yang, Jen-Jen, Huai-Wei Lo, Chen-Shen Chao, Chih-Chien Shen, and Chin-Cheng Yang. 2020a. Establishing a Sustainable Sports Tourism Evaluation Framework with a Hybrid Multi-Criteria Decision-Making Model to Explore Potential Sports Tourism Attractions in Taiwan. Sustainability 12: 1673. [Google Scholar] [CrossRef]
- Yang, Jen-Jen, Yen-Ching Chuang, Huai-Wei Lo, and Ting-I. Lee. 2020b. A Two-Stage MCDM Model for Exploring the Influential Relationships of Sustainable Sports Tourism Criteria in Taichung City. International Journal of Environmental Research and Public Health 17: 2319. [Google Scholar] [CrossRef]
- Zavadskas, Edmundas Kazimieras, and Zenonas Turskis. 2010. A new additive ratio assessment (ARAS) method in multi-criteria decision-making. Technological and Economic Development of Economy 16: 159–72. [Google Scholar] [CrossRef]
- Zavadskas, Edmundas Kazimieras, Artūras Kaklauskas, and Vaidotas Šarka. 1994. The new method of multi-criteria complex proportional assessment of projects. Technological and Economic Development of Economy 1: 131–39. [Google Scholar]
- Zhang, Cheng, Li Luo, Huchang Liao, Abbas Mardani, Dalia Streimikiene, and Abdullah Al-Barakati. 2020. A priority-based intuitionistic multiplicative UTASTAR method and its application in low-carbon tourism destination selection. Applied Soft Computing 88: 106026. [Google Scholar] [CrossRef]
- Zhang, Ligang, Xingrong Wang, Yi Li, Yan Zhu, Feng Wei, and Shaoqiong Zhao. 2022. Social communication of transportation: A bridge model connecting tourism destination and psychological perception. Frontiers in Psychology 12: 823884. [Google Scholar] [CrossRef] [PubMed]
- Zhang, Meng, Guang-yu Zhang, Dogan Gursoy, and Xiao-rong Fu. 2018. Message framing and regulatory focus effects on destination image formation. Tourism Management 69: 397–407. [Google Scholar] [CrossRef]
- Zhu, Q. 2011. The Effect of Destination Image on Tourists’ Revisit Intention: A Case of Fenghuang Ancient Town. DBA thesis, Hunan Normal University, Changsha, China. [Google Scholar]


| Dimension | References | |
|---|---|---|
| Perceptual | Alcañiz et al. (2005); Gany (2017); Stylidis et al. (2017); Zhang et al. (2022) | |
| Image | Cognitive | Shen (2012); Ingram et al. (2013); Kim et al. (2019); Huete-Alcocer et al. (2019); Garay (2019); Perpiña et al. (2019) Woosnam et al. (2020); |
| Affective | Zhu (2011); Andersen et al. (2018); Kim et al. (2019); Huete-Alcocer et al. (2019); Garay (2019); Afshardoost and Eshaghi (2020); | |
| Collective | Artuğer et al. (2013); Mak (2017); Peralta (2019); Akgün et al. (2020); Papavasiliou (2022); | |
| Overall | Pramod and Nayak (2018); Papadimitriou et al. (2018); Lam et al. (2020); Stylidis et al. (2022) | |
| Outcome | Kani et al. (2017); Zhang et al. (2018); Moon and Han (2019); Stylidis et al. (2022) | |
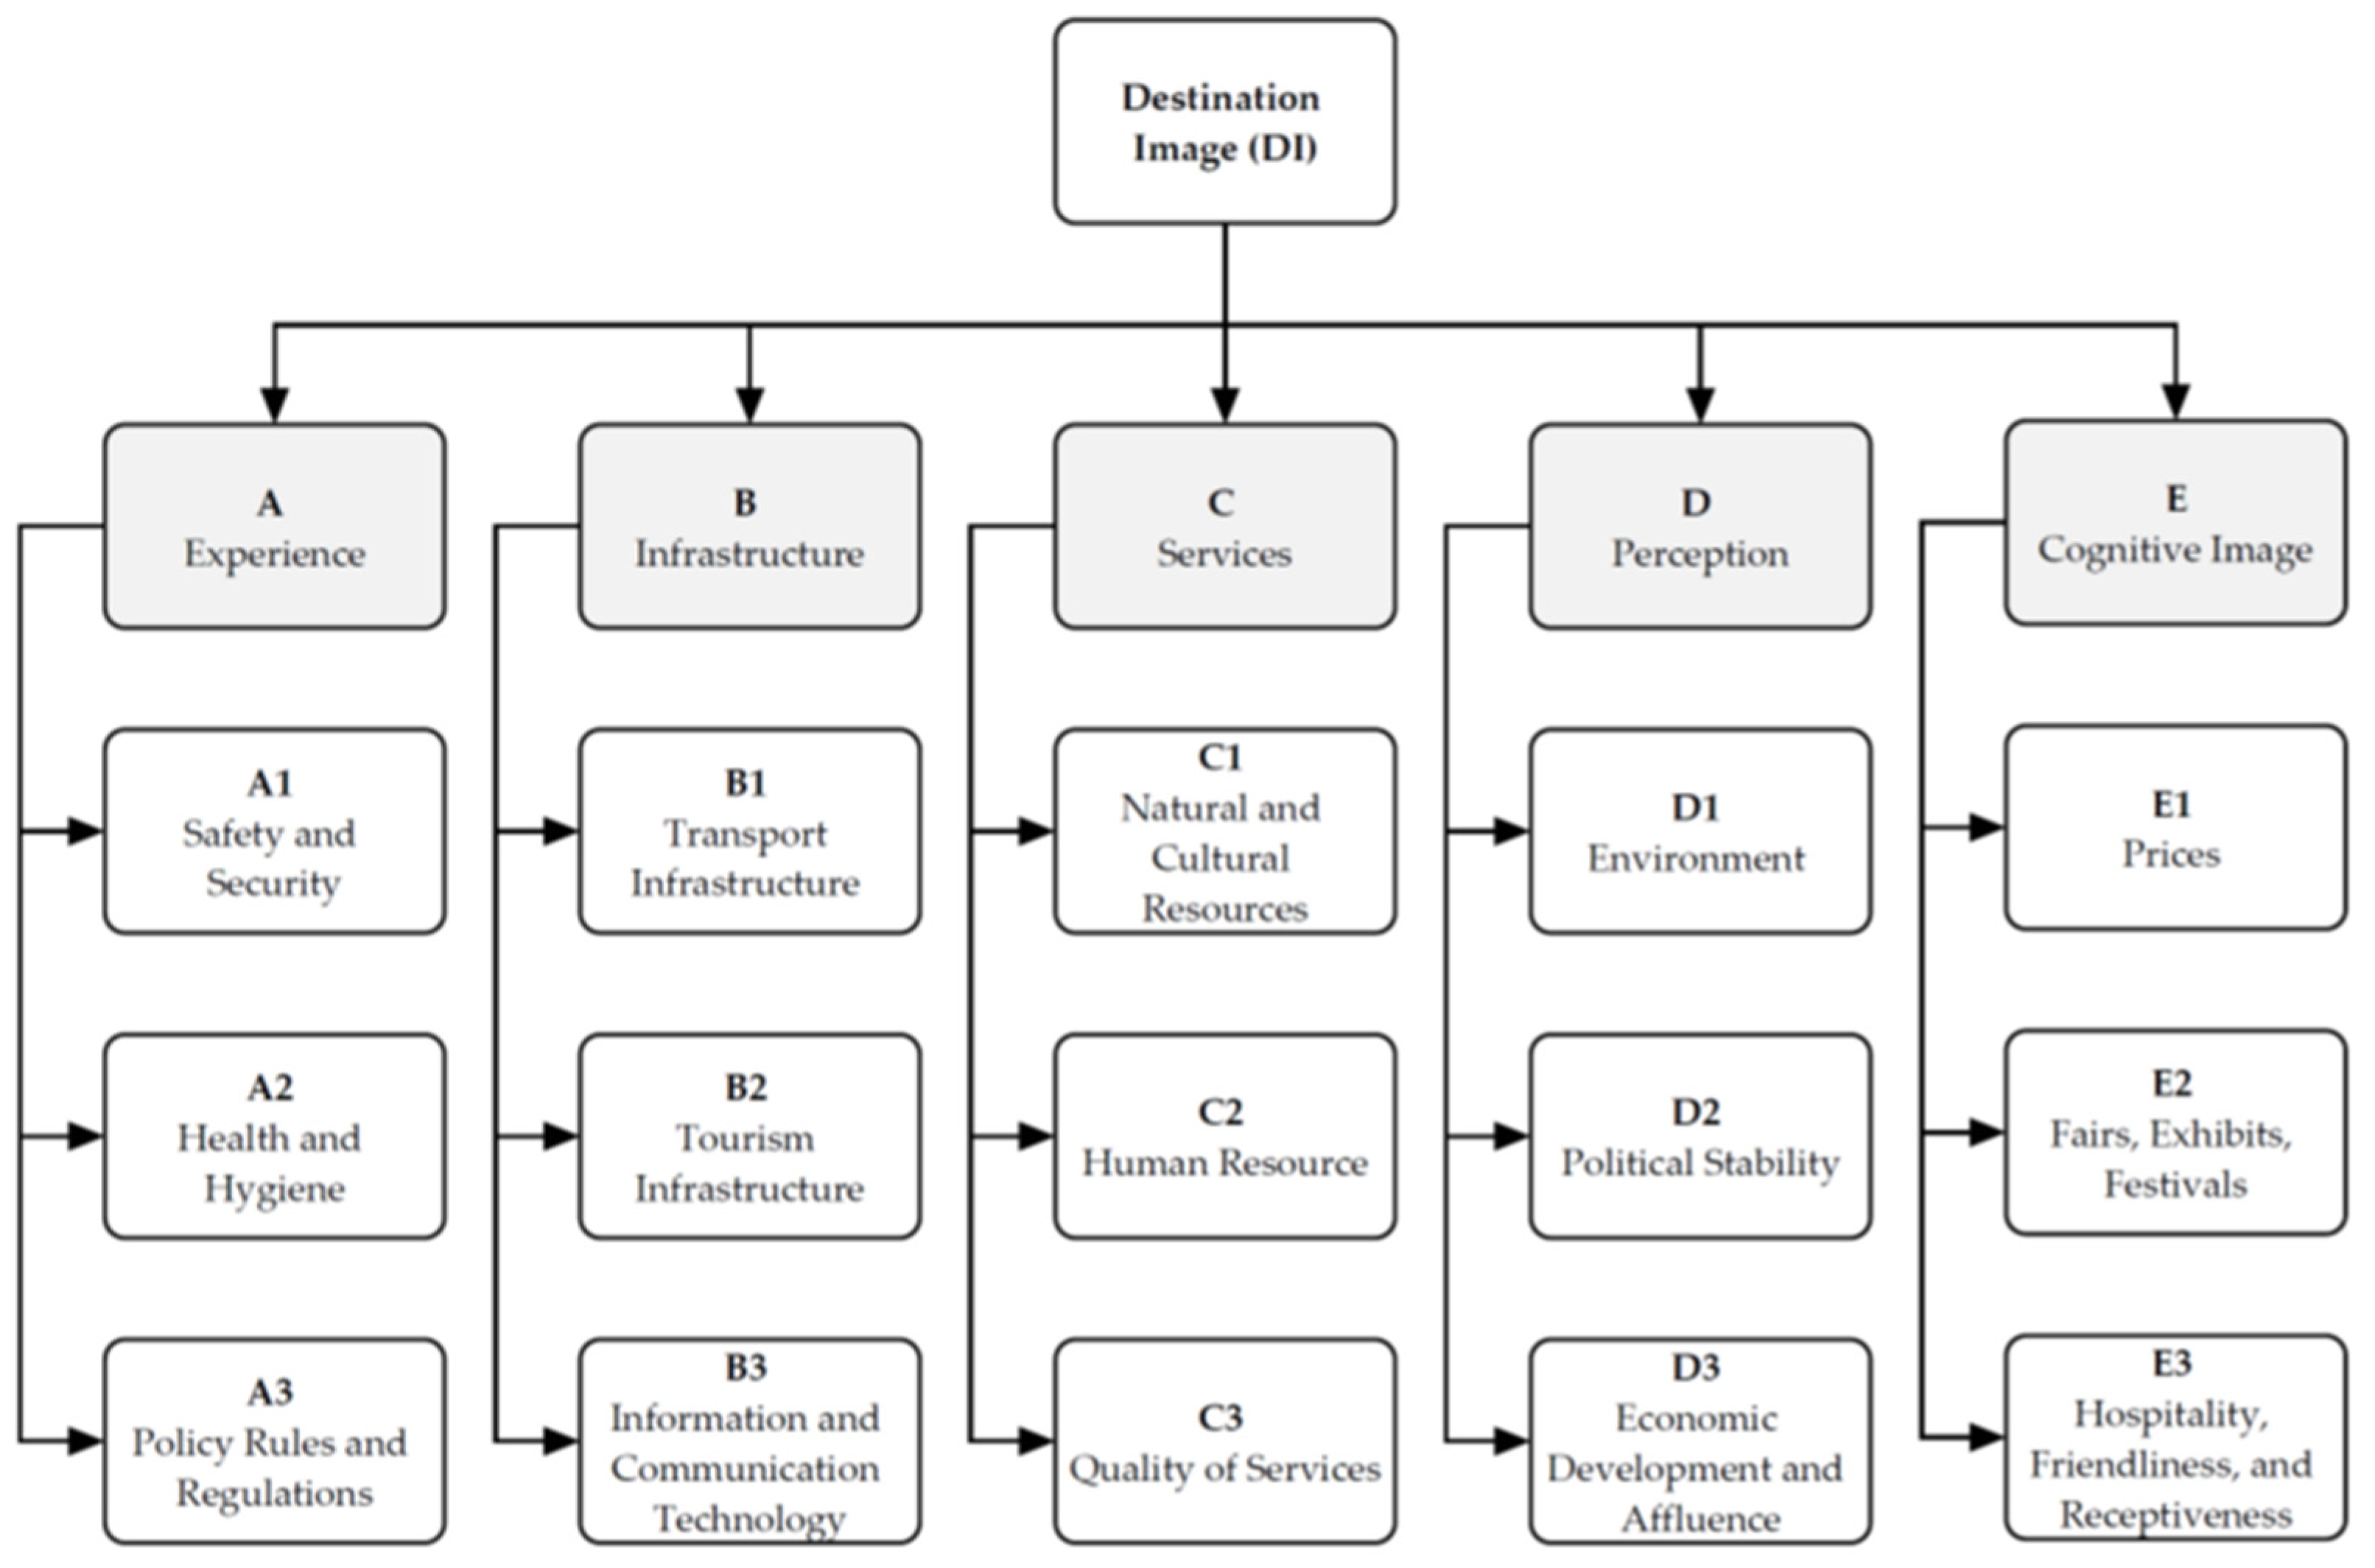
| Acronym | Dimension | Description | Acronym | Factors | Reference |
|---|---|---|---|---|---|
| A | Experience | Motivations for travel and the ways destinations can create memorable experiences that satisfy the complex desires of tourists. | A1 | Safety and Security | Millar et al. (2017) |
| A2 | Health and Hygiene | Moreno-González et al. (2020) | |||
| A3 | Policy Rules and Regulations | Ruan et al. (2017) | |||
| B | Infrastructure | The tourism industry stimulates investments in new infrastructure, most of which improve the living conditions of locals, residents, and tourists. | B1 | Transport Infrastructure (Air, Road, Railways, and port) | Virkar and Mallya (2018) |
| B2 | Tourism Infrastructure | Haneef (2017) | |||
| B3 | Information and Communication Technology (ICT) | Ukpabi and Karjaluoto (2017) | |||
| C | Services | Tourism and travel-related services, including hotels and restaurants (including catering), travel agencies and tour operator services, tourist guide services, and other related services. | C1 | Natural and Cultural Resources | Huete Alcocer and López Ruiz (2020) |
| C2 | Human Resource | Nguyen Viet et al. (2020) | |||
| C3 | Quality of Services | Puri and Singh (2018) | |||
| D | Perception | Tourist perceptions can be defined as tourists’ positive or negative opinions towards certain things. It is based on tourists’ previous experiences. | D1 | Environment | Lee and Xue (2020) |
| D2 | Political Stability | Eid et al. (2019) | |||
| D3 | Economic Development and Affluence | Khan et al. (2017) | |||
| E | Cognitive Image | Explains DI as a tourist’s knowledge and beliefs about a destination’s attributes. The cognitive image involves unique (such as distinctive tourist attractions), common (such as prices), and atmospheric (e.g., atmosphere or moods related to destinations) images. | E1 | Prices | Widayati et al. (2020) |
| E2 | Fairs, Exhibits, Festivals | Van Niekerk (2017) | |||
| E3 | Hospitality, Friendliness, and Receptiveness | Dabphet (2017) |
| Study | Methods | Summary |
|---|---|---|
| Jafari-Moghadam et al. (2017) | DEMATEL, ANP | Enhance the tourism entrepreneurship policy by suggesting a hybrid MCDM approach. |
| Koens et al. (2018) | Qualitative investigation | Examined the over-tourism issue using a qualitative research approach with 80 stakeholders across 13 European towns. |
| Martín et al. (2018) | Descriptive statistical methods | Studied what is driving the general anti-travel sentiment in Barcelona. |
| Ocampo et al. (2018) | Fuzzy set theory, DELPHI | Used the fuzzy Delphi technique to create eco-tourism sustainability indicators. |
| Stević et al. (2019) | SAW, TOPSIS | Cultural tourism assessment using MCDM techniques. |
| Simancas Cruz and Zaragoza (2019) | Observation method | Determined the limitations of the density of tourist accommodations as a measure of tourist congestion in Spain. |
| Perkumienė and Pranskūnienė (2019) | Integrative review | Investigated the tension that might arise between visitors’ and locals’ needs in overly visited areas. |
| Mi et al. (2019) | ISM | Employed an ISM to create a hierarchical structural model to explore hot spring tourist satisfaction factor interactions. |
| Rashmi et al. (2019) | Fuzzy-AHP, TOPSIS | Developed a Fuzzy-AHP and TOPSIS approach for selecting the best state for tourism in India based on multiple criteria. |
| Nilashi et al. (2019) | DEMATEL, Fuzzy TOPSIS | Used a mixed-methods MCDM approach to identify the most important factors for medical tourism adoption in Malaysia. |
| Zhang et al. (2020) | UTASTAR | Selection of low-carbon tourist destinations using a prioritization-based intuitionistic multiplicative UTASTAR algorithm. |
| Yang et al. (2020a) | Bayesian BWM, Rough DEMATEL | Formulated a new two-stage MCDM paradigm to integrate sustainable development into sports tourism. |
| Aydoğan and Özmen (2020) | Rough SWARA and TODIM | Used a hybrid MCDM approach that combines rough SWARA and TODIM to provide policymakers and stakeholders with accurate tourism and travel industry data. |
| Yang et al. (2020b) | Bayesian BWM, VIKOR | Used the Bayesian BWM and VIKOR to argue for the value of sustainable sport tourism and provide ideas for places to visit. |
| Ren and Ren (2020) | DEMATEL | Used the DEMATEL methodology to identify the most critical barriers to the growth of the tourism business. |
| Ayhan et al. (2020) | ELECTRE | Used the ELECTRE procedure to speed up the land-use suitability analysis for rural tourism. |
| Abellana et al. (2021) | SVR-SARIMA; PROMETEE II | Used a mixed-method MCDM to choose the most accurate tourist demand forecasting model for the future. |
| Weng et al. (2021) | Element Event Analysis Method (EEAM)-ISM | Used EEAM to identify 26 elements impacting rural tourism’s sustainability, examine their logical hierarchical link, and investigate ISM’s internal system operating mechanism. |
| Gupta et al. (2021) | ISM-MICMAC | Used ISM and MICMAC to create a hierarchical structure of the tourist sector foreign flow factors. |
| Hosseini et al. (2021) | Fuzzy DEMATEL, Fuzzy VIKOR | Used a hybrid MCDM model to prioritize the defined action plans to help these businesses recover and improve their activities during the pandemic. |
| Moradi et al. (2023) | ISM-MICMAC | Used ISM and MICMAC to examine the interactions between these factors and provide empirical evidence supporting their relationships. |
| Integer Scale | Definition |
|---|---|
| 0 | No influence |
| 1 | Low influence |
| 2 | Medium influence |
| 3 | High influence |
| 4 | Very high influence |
| Scenario | DEMATEL | ISM | ||||
|---|---|---|---|---|---|---|
| Cause-and-Effect Matrix | Direction of Relationship | SSIM Entry | IRM Entries | |||
| (Fi,Fj) a | (Fj,Fi) a | (Fi,Fj) a | (Fi,Fj) a | (Fi,Fj) a | (Fj,Fi) a | |
| 1 | Cause | Effect | Fi → Fj | V | 1 | 0 |
| Cause | None | |||||
| None | Effect | |||||
| 2 | Effect | Cause | Fi ← Fj | A | 0 | 1 |
| Effect | None | |||||
| None | Cause | |||||
| 3 | Cause | Cause | Fi ↔ Fj | X | 1 | 1 |
| Effect | Effect | |||||
| 4 | None | None | Fi × Fj | O | 0 | 0 |
| Factors | A1 | A2 | A3 | B1 | B2 | B3 | C1 | C2 | C3 | D1 | D2 | D3 | E1 | E2 | E3 | Sum |
|---|---|---|---|---|---|---|---|---|---|---|---|---|---|---|---|---|
| A1 | 0.000 | 2.500 | 2.100 | 2.700 | 1.700 | 2.100 | 2.500 | 2.800 | 2.200 | 2.000 | 1.500 | 2.000 | 2.300 | 1.800 | 2.100 | 30.30 |
| A2 | 2.000 | 0.000 | 2.000 | 1.900 | 2.100 | 1.300 | 2.100 | 2.900 | 2.100 | 2.100 | 1.400 | 2.400 | 1.600 | 2.100 | 2.000 | 28.00 |
| A3 | 1.700 | 2.300 | 0.000 | 1.700 | 1.900 | 2.200 | 2.200 | 2.500 | 1.800 | 2.300 | 1.400 | 2.300 | 2.600 | 2.200 | 1.800 | 28.90 |
| B1 | 1.100 | 1.900 | 1.300 | 0.000 | 2.100 | 3.000 | 1.500 | 1.900 | 1.700 | 2.000 | 1.800 | 1.600 | 2.000 | 2.200 | 2.300 | 26.40 |
| B2 | 2.200 | 2.500 | 1.600 | 2.200 | 0.000 | 2.400 | 2.600 | 2.300 | 2.700 | 2.100 | 1.800 | 1.900 | 2.400 | 0.900 | 2.300 | 29.90 |
| B3 | 2.200 | 2.600 | 2.200 | 2.200 | 2.300 | 0.000 | 1.500 | 2.000 | 1.300 | 2.300 | 2.100 | 1.500 | 1.600 | 2.400 | 3.500 | 29.70 |
| C1 | 1.800 | 1.800 | 2.100 | 2.400 | 2.200 | 1.600 | 0.000 | 1.300 | 1.900 | 2.400 | 2.000 | 1.900 | 2.400 | 1.800 | 2.300 | 27.90 |
| C2 | 2.400 | 1.500 | 2.400 | 2.400 | 1.400 | 1.400 | 2.600 | 0.000 | 1.800 | 1.200 | 2.100 | 1.700 | 2.800 | 1.500 | 2.000 | 27.20 |
| C3 | 0.700 | 2.300 | 1.600 | 2.200 | 2.500 | 1.500 | 2.100 | 2.200 | 0.000 | 2.200 | 2.100 | 2.400 | 1.700 | 2.900 | 2.400 | 28.80 |
| D1 | 2.000 | 2.200 | 1.800 | 2.600 | 2.900 | 2.500 | 2.200 | 2.700 | 1.900 | 0.000 | 2.000 | 1.900 | 2.200 | 2.300 | 1.700 | 30.90 |
| D2 | 2.000 | 2.800 | 1.900 | 1.800 | 3.100 | 1.600 | 1.500 | 2.300 | 2.200 | 1.000 | 0.000 | 1.800 | 2.000 | 1.600 | 1.900 | 27.50 |
| D3 | 2.100 | 2.200 | 1.700 | 1.900 | 2.000 | 2.200 | 2.600 | 1.900 | 2.400 | 1.600 | 1.600 | 0.000 | 1.900 | 2.300 | 2.300 | 28.70 |
| E1 | 3.200 | 2.000 | 2.400 | 2.400 | 1.200 | 1.700 | 1.700 | 2.400 | 2.400 | 2.400 | 1.800 | 1.700 | 0.000 | 1.200 | 1.100 | 27.60 |
| E2 | 1.900 | 2.300 | 1.900 | 1.500 | 2.500 | 1.900 | 1.800 | 1.800 | 2.700 | 2.500 | 1.800 | 2.000 | 2.500 | 0.000 | 1.900 | 29.00 |
| E3 | 2.000 | 1.500 | 2.400 | 2.000 | 2.000 | 1.800 | 1.400 | 2.600 | 2.600 | 1.900 | 2.500 | 1.400 | 2.100 | 2.100 | 0.000 | 28.30 |
| Sum | 27.30 | 30.40 | 27.40 | 29.90 | 29.90 | 27.20 | 28.30 | 31.60 | 29.70 | 28.00 | 25.90 | 26.50 | 30.10 | 27.30 | 29.60 |
| Factors | A1 | A2 | A3 | B1 | B2 | B3 | C1 | C2 | C3 | D1 | D2 | D3 | E1 | E2 | E3 |
|---|---|---|---|---|---|---|---|---|---|---|---|---|---|---|---|
| A1 | 0.000 | 0.079 | 0.066 | 0.085 | 0.054 | 0.066 | 0.079 | 0.089 | 0.070 | 0.063 | 0.047 | 0.063 | 0.073 | 0.057 | 0.066 |
| A2 | 0.063 | 0.000 | 0.063 | 0.060 | 0.066 | 0.041 | 0.066 | 0.092 | 0.066 | 0.066 | 0.044 | 0.076 | 0.051 | 0.066 | 0.063 |
| A3 | 0.054 | 0.073 | 0.000 | 0.054 | 0.060 | 0.070 | 0.070 | 0.079 | 0.057 | 0.073 | 0.044 | 0.073 | 0.082 | 0.070 | 0.057 |
| B1 | 0.035 | 0.060 | 0.041 | 0.000 | 0.066 | 0.095 | 0.047 | 0.060 | 0.054 | 0.063 | 0.057 | 0.051 | 0.063 | 0.070 | 0.073 |
| B2 | 0.070 | 0.079 | 0.051 | 0.070 | 0.000 | 0.076 | 0.082 | 0.073 | 0.085 | 0.066 | 0.057 | 0.060 | 0.076 | 0.028 | 0.073 |
| B3 | 0.070 | 0.082 | 0.070 | 0.070 | 0.073 | 0.000 | 0.047 | 0.063 | 0.041 | 0.073 | 0.066 | 0.047 | 0.051 | 0.076 | 0.111 |
| C1 | 0.057 | 0.057 | 0.066 | 0.076 | 0.070 | 0.051 | 0.000 | 0.041 | 0.060 | 0.076 | 0.063 | 0.060 | 0.076 | 0.057 | 0.073 |
| C2 | 0.076 | 0.047 | 0.076 | 0.076 | 0.044 | 0.044 | 0.082 | 0.000 | 0.057 | 0.038 | 0.066 | 0.054 | 0.089 | 0.047 | 0.063 |
| C3 | 0.022 | 0.073 | 0.051 | 0.070 | 0.079 | 0.047 | 0.066 | 0.070 | 0.000 | 0.070 | 0.066 | 0.076 | 0.054 | 0.092 | 0.076 |
| D1 | 0.063 | 0.070 | 0.057 | 0.082 | 0.092 | 0.079 | 0.070 | 0.085 | 0.060 | 0.000 | 0.063 | 0.060 | 0.070 | 0.073 | 0.054 |
| D2 | 0.063 | 0.089 | 0.060 | 0.057 | 0.098 | 0.051 | 0.047 | 0.073 | 0.070 | 0.032 | 0.000 | 0.057 | 0.063 | 0.051 | 0.060 |
| D3 | 0.066 | 0.070 | 0.054 | 0.060 | 0.063 | 0.070 | 0.082 | 0.060 | 0.076 | 0.051 | 0.051 | 0.000 | 0.060 | 0.073 | 0.073 |
| E1 | 0.101 | 0.063 | 0.076 | 0.076 | 0.038 | 0.054 | 0.054 | 0.076 | 0.076 | 0.076 | 0.057 | 0.054 | 0.000 | 0.038 | 0.035 |
| E2 | 0.060 | 0.073 | 0.060 | 0.047 | 0.079 | 0.060 | 0.057 | 0.057 | 0.085 | 0.079 | 0.057 | 0.063 | 0.079 | 0.000 | 0.060 |
| E3 | 0.063 | 0.047 | 0.076 | 0.063 | 0.063 | 0.057 | 0.044 | 0.082 | 0.082 | 0.060 | 0.079 | 0.044 | 0.066 | 0.066 | 0.000 |
| Factors | A1 | A2 | A3 | B1 | B2 | B3 | C1 | C2 | C3 | D1 | D2 | D3 | E1 | E2 | E3 | R |
|---|---|---|---|---|---|---|---|---|---|---|---|---|---|---|---|---|
| A1 | 0.575 | 0.705 | 0.640 | 0.707 | 0.673 | 0.634 | 0.668 | 0.743 | 0.687 | 0.649 | 0.592 | 0.618 | 0.700 | 0.628 | 0.682 | 9.902 |
| A2 | 0.594 | 0.588 | 0.597 | 0.641 | 0.640 | 0.572 | 0.616 | 0.699 | 0.641 | 0.610 | 0.551 | 0.591 | 0.637 | 0.595 | 0.635 | 9.204 |
| A3 | 0.607 | 0.677 | 0.557 | 0.656 | 0.655 | 0.616 | 0.638 | 0.710 | 0.653 | 0.636 | 0.569 | 0.606 | 0.685 | 0.618 | 0.650 | 9.535 |
| B1 | 0.543 | 0.616 | 0.550 | 0.554 | 0.612 | 0.593 | 0.569 | 0.640 | 0.600 | 0.580 | 0.538 | 0.541 | 0.616 | 0.572 | 0.616 | 8.742 |
| B2 | 0.635 | 0.700 | 0.622 | 0.689 | 0.616 | 0.637 | 0.665 | 0.724 | 0.695 | 0.646 | 0.597 | 0.611 | 0.696 | 0.597 | 0.683 | 9.813 |
| B3 | 0.634 | 0.700 | 0.637 | 0.685 | 0.683 | 0.565 | 0.631 | 0.713 | 0.655 | 0.650 | 0.602 | 0.596 | 0.672 | 0.637 | 0.713 | 9.774 |
| C1 | 0.589 | 0.643 | 0.599 | 0.655 | 0.645 | 0.582 | 0.552 | 0.655 | 0.636 | 0.620 | 0.568 | 0.577 | 0.658 | 0.588 | 0.644 | 9.212 |
| C2 | 0.590 | 0.616 | 0.593 | 0.638 | 0.602 | 0.559 | 0.612 | 0.596 | 0.615 | 0.569 | 0.555 | 0.555 | 0.653 | 0.562 | 0.617 | 8.932 |
| C3 | 0.573 | 0.673 | 0.601 | 0.665 | 0.670 | 0.593 | 0.630 | 0.697 | 0.596 | 0.629 | 0.586 | 0.606 | 0.656 | 0.634 | 0.663 | 9.473 |
| D1 | 0.648 | 0.713 | 0.645 | 0.719 | 0.721 | 0.660 | 0.674 | 0.755 | 0.693 | 0.603 | 0.619 | 0.628 | 0.712 | 0.654 | 0.686 | 10.131 |
| D2 | 0.587 | 0.663 | 0.586 | 0.630 | 0.660 | 0.573 | 0.591 | 0.675 | 0.637 | 0.572 | 0.501 | 0.567 | 0.638 | 0.573 | 0.625 | 9.076 |
| D3 | 0.611 | 0.670 | 0.604 | 0.657 | 0.654 | 0.612 | 0.644 | 0.688 | 0.666 | 0.613 | 0.572 | 0.534 | 0.660 | 0.617 | 0.661 | 9.463 |
| E1 | 0.622 | 0.643 | 0.603 | 0.651 | 0.610 | 0.579 | 0.600 | 0.681 | 0.643 | 0.614 | 0.557 | 0.567 | 0.582 | 0.567 | 0.605 | 9.126 |
| E2 | 0.612 | 0.680 | 0.615 | 0.652 | 0.674 | 0.609 | 0.628 | 0.693 | 0.680 | 0.643 | 0.582 | 0.600 | 0.683 | 0.554 | 0.654 | 9.558 |
| E3 | 0.599 | 0.639 | 0.613 | 0.648 | 0.643 | 0.591 | 0.600 | 0.697 | 0.660 | 0.609 | 0.587 | 0.567 | 0.655 | 0.600 | 0.581 | 9.288 |
| C | 9.020 | 9.925 | 9.063 | 9.848 | 9.757 | 8.974 | 9.318 | 10.365 | 9.756 | 9.243 | 8.575 | 8.764 | 9.903 | 8.998 | 9.716 |
| Factors | R | C | R + C | R − C | ω | ώ | Rank | Identity |
|---|---|---|---|---|---|---|---|---|
| A1 | 9.902 | 9.020 | 18.922 | 0.882 | 18.943 | 0.0670 | 8 | Cause |
| A2 | 9.204 | 9.925 | 19.129 | −0.722 | 19.143 | 0.0677 | 5 | Effect |
| A3 | 9.535 | 9.063 | 18.598 | 0.471 | 18.604 | 0.0658 | 11 | Cause |
| B1 | 8.742 | 9.848 | 18.589 | −1.106 | 18.622 | 0.0659 | 10 | Effect |
| B2 | 9.813 | 9.757 | 19.570 | 0.056 | 19.570 | 0.0692 | 1 | Cause |
| B3 | 9.774 | 8.974 | 18.748 | 0.800 | 18.765 | 0.0664 | 9 | Cause |
| C1 | 9.212 | 9.318 | 18.529 | −0.106 | 18.529 | 0.0656 | 13 | Effect |
| C2 | 8.932 | 10.365 | 19.297 | −1.433 | 19.350 | 0.0685 | 3 | Effect |
| C3 | 9.473 | 9.756 | 19.229 | −0.283 | 19.231 | 0.0680 | 4 | Effect |
| D1 | 10.131 | 9.243 | 19.375 | 0.888 | 19.395 | 0.0686 | 2 | Cause |
| D2 | 9.076 | 8.575 | 17.651 | 0.500 | 17.658 | 0.0625 | 15 | Cause |
| D3 | 9.463 | 8.764 | 18.227 | 0.698 | 18.240 | 0.0645 | 14 | Cause |
| E1 | 9.126 | 9.903 | 19.030 | −0.777 | 19.045 | 0.0674 | 6 | Effect |
| E2 | 9.558 | 8.998 | 18.556 | 0.560 | 18.564 | 0.0657 | 12 | Cause |
| E3 | 9.288 | 9.716 | 19.004 | −0.428 | 19.009 | 0.0672 | 7 | Effect |
| Factors | A1 | A2 | A3 | B1 | B2 | B3 | C1 | C2 | C3 | D1 | D2 | D3 | E1 | E2 | E3 |
|---|---|---|---|---|---|---|---|---|---|---|---|---|---|---|---|
| A1 | Cause | Cause | Cause | Cause | Cause | Cause | Cause | Cause | Cause | None | None | Cause | Cause | Cause | |
| A2 | None | None | Effect | Effect | None | None | Effect | Effect | None | None | None | Effect | None | Effect | |
| A3 | None | Cause | Cause | Cause | None | Cause | Cause | Cause | Cause | None | None | Cause | None | Cause | |
| B1 | None | None | None | None | None | None | Effect | None | None | None | None | None | None | None | |
| B2 | Cause | Cause | None | Cause | Cause | Cause | Cause | Cause | Cause | None | None | Cause | None | Cause | |
| B3 | Cause | Cause | Cause | Cause | Cause | Cause | Cause | Cause | Cause | None | None | Cause | Cause | Cause | |
| C1 | None | Effect | None | Effect | Effect | None | Effect | Effect | None | None | None | Effect | None | Effect | |
| C2 | None | None | None | Effect | None | None | None | None | None | None | None | Effect | None | None | |
| C3 | None | Effect | None | Effect | Effect | None | Effect | Effect | Effect | None | None | Effect | Effect | Effect | |
| D1 | Cause | Cause | Cause | Cause | Cause | Cause | Cause | Cause | Cause | None | Cause | Cause | Cause | Cause | |
| D2 | None | Cause | None | Cause | Cause | None | None | Cause | Cause | None | None | Cause | None | None | |
| D3 | None | Cause | None | Cause | Cause | None | Cause | Cause | Cause | None | None | Cause | None | Cause | |
| E1 | None | Effect | None | Effect | None | None | None | Effect | Effect | None | None | None | None | None | |
| E2 | None | Cause | None | Cause | Cause | None | Cause | Cause | Cause | Cause | None | None | Cause | Cause | |
| E3 | None | Effect | None | Effect | Effect | None | None | Effect | Effect | None | None | None | Effect | None |
| Factors | A1 | A2 | A3 | B1 | B2 | B3 | C1 | C2 | C3 | D1 | D2 | D3 | E1 | E2 | E3 |
|---|---|---|---|---|---|---|---|---|---|---|---|---|---|---|---|
| A1 | V | V | V | X | X | V | V | V | X | O | O | V | V | V | |
| A2 | A | A | A | A | V | A | X | A | A | A | X | A | X | ||
| A3 | V | V | A | V | V | V | X | O | O | V | O | V | |||
| B1 | A | A | V | X | V | A | A | A | V | A | V | ||||
| B2 | X | V | V | V | X | A | A | V | A | V | |||||
| B3 | V | V | V | X | O | O | V | V | V | ||||||
| C1 | A | X | A | O | A | A | A | A | |||||||
| C2 | V | A | A | A | X | A | V | ||||||||
| C3 | A | A | A | X | A | X | |||||||||
| D1 | O | V | V | X | V | ||||||||||
| D2 | O | V | O | O | |||||||||||
| D3 | V | O | V | ||||||||||||
| E1 | A | V | |||||||||||||
| E2 | V | ||||||||||||||
| E3 |
| Factors | A1 | A2 | A3 | B1 | B2 | B3 | C1 | C2 | C3 | D1 | D2 | D3 | E1 | E2 | E3 | Driving Power |
|---|---|---|---|---|---|---|---|---|---|---|---|---|---|---|---|---|
| A1 | 1 | 1 | 1 | 1 | 1 | 1 | 1 | 1 | 1 | 1 | 0 | 0 | 1 | 1 | 1 | 13 |
| A2 | 0 | 1 | 0 | 0 | 0 | 0 | 1 | 0 | 1 | 0 | 0 | 0 | 1 | 0 | 1 | 5 |
| A3 | 0 | 1 | 1 | 1 | 1 | 0 | 1 | 1 | 1 | 1 | 0 | 0 | 1 | 0 | 1 | 10 |
| B1 | 0 | 1 | 0 | 1 | 0 | 0 | 1 | 1 | 1 | 0 | 0 | 0 | 1 | 0 | 1 | 7 |
| B2 | 1 | 1 | 0 | 1 | 1 | 1 | 1 | 1 | 1 | 1 | 0 | 0 | 1 | 0 | 1 | 11 |
| B3 | 1 | 1 | 1 | 1 | 1 | 1 | 1 | 1 | 1 | 1 | 0 | 0 | 1 | 1 | 1 | 13 |
| C1 | 0 | 0 | 0 | 0 | 0 | 0 | 1 | 0 | 1 | 0 | 0 | 0 | 0 | 0 | 0 | 2 |
| C2 | 0 | 1 | 0 | 1 | 0 | 0 | 1 | 1 | 1 | 0 | 0 | 0 | 1 | 0 | 1 | 7 |
| C3 | 0 | 1 | 0 | 0 | 0 | 0 | 1 | 0 | 1 | 0 | 0 | 0 | 1 | 0 | 1 | 5 |
| D1 | 1 | 1 | 1 | 1 | 1 | 1 | 1 | 1 | 1 | 1 | 0 | 1 | 1 | 1 | 1 | 14 |
| D2 | 0 | 1 | 0 | 1 | 1 | 0 | 0 | 1 | 1 | 0 | 1 | 0 | 1 | 0 | 0 | 7 |
| D3 | 0 | 1 | 0 | 1 | 1 | 0 | 1 | 1 | 1 | 0 | 0 | 1 | 1 | 0 | 1 | 9 |
| E1 | 0 | 1 | 0 | 0 | 0 | 0 | 1 | 1 | 1 | 0 | 0 | 0 | 1 | 0 | 1 | 6 |
| E2 | 0 | 1 | 0 | 1 | 1 | 0 | 1 | 1 | 1 | 1 | 0 | 0 | 1 | 1 | 1 | 10 |
| E3 | 0 | 1 | 0 | 0 | 0 | 0 | 1 | 0 | 1 | 0 | 0 | 0 | 0 | 0 | 1 | 4 |
| Dependence Power | 4 | 14 | 4 | 10 | 8 | 4 | 14 | 11 | 15 | 6 | 1 | 2 | 13 | 4 | 13 |
| Factors | A1 | A2 | A3 | B1 | B2 | B3 | C1 | C2 | C3 | D1 | D2 | D3 | E1 | E2 | E3 | Driving Power |
|---|---|---|---|---|---|---|---|---|---|---|---|---|---|---|---|---|
| A1 | 1 | 1 | 1 | 1 | 1 | 1 | 1 | 1 | 1 | 1 | 0 | 1* | 1 | 1 | 1 | 14 |
| A2 | 0 | 1 | 0 | 1* | 0 | 0 | 1 | 1* | 1 | 0 | 0 | 0 | 1 | 0 | 1 | 7 |
| A3 | 1* | 1 | 1 | 1 | 1 | 1* | 1 | 1 | 1 | 1 | 0 | 1* | 1 | 1* | 1 | 14 |
| B1 | 0 | 1 | 0 | 1 | 0 | 0 | 1 | 1 | 1 | 0 | 0 | 0 | 1 | 0 | 1 | 7 |
| B2 | 1 | 1 | 1* | 1 | 1 | 1 | 1 | 1 | 1 | 1 | 0 | 1* | 1 | 1* | 1 | 14 |
| B3 | 1 | 1 | 1 | 1 | 1 | 1 | 1 | 1 | 1 | 1 | 0 | 1* | 1 | 1 | 1 | 14 |
| C1 | 0 | 1* | 0 | 1* | 0 | 0 | 1 | 1* | 1 | 0 | 0 | 0 | 1* | 0 | 1* | 7 |
| C2 | 0 | 1 | 0 | 1 | 0 | 0 | 1 | 1 | 1 | 0 | 0 | 0 | 1 | 0 | 1 | 7 |
| C3 | 0 | 1 | 0 | 1* | 0 | 0 | 1 | 1* | 1 | 0 | 0 | 0 | 1 | 0 | 1 | 7 |
| D1 | 1 | 1 | 1 | 1 | 1 | 1 | 1 | 1 | 1 | 1 | 0 | 1 | 1 | 1 | 1 | 14 |
| D2 | 1* | 1 | 1* | 1 | 1 | 1* | 1* | 1 | 1 | 1* | 1 | 1* | 1 | 1* | 1* | 15 |
| D3 | 1* | 1 | 1* | 1 | 1 | 1* | 1 | 1 | 1 | 1* | 0 | 1 | 1 | 1* | 1 | 14 |
| E1 | 0 | 1 | 0 | 1* | 0 | 0 | 1 | 1 | 1 | 0 | 0 | 0 | 1 | 0 | 1 | 7 |
| E2 | 1* | 1 | 1* | 1 | 1 | 1* | 1 | 1 | 1 | 1 | 0 | 1* | 1 | 1 | 1 | 14 |
| E3 | 0 | 1 | 0 | 1* | 0 | 0 | 1 | 1* | 1 | 0 | 0 | 0 | 1* | 0 | 1 | 7 |
| Dependence Power | 8 | 15 | 8 | 15 | 8 | 8 | 15 | 15 | 15 | 8 | 1 | 8 | 15 | 8 | 15 |
| Factor | Reachability Set | Antecedent Set | Intersection Set | Level |
|---|---|---|---|---|
| A1 | A1, A3, B2, B3, D1, D3, E2 | A1, A3, B2, B3, D1, D2, D3, E2 | A1, A3, B2, B3, D1, D3, E2 | II |
| A2 | A2, B1, C1, C2, C3, E1, E3 | A1, A2, A3, B1, B2, B3, C1, C2, C3, D1, D2, D3, E1, E2, E3 | A2, B1, C1, C2, C3, E1, E3 | I |
| A3 | A1, A3, B2, B3, D1, D3, E2 | A1, A3, B2, B3, D1, D2, D3, E2 | A1, A3, B2, B3, D1, D3, E2 | II |
| B1 | A2, B1, C1, C2, C3, E1, E3 | A1, A2, A3, B1, B2, B3, C1, C2, C3, D1, D2, D3, E1, E2, E3 | A2, B1, C1, C2, C3, E1, E3 | I |
| B2 | A1, A3, B2, B3, D1, D3, E2 | A1, A3, B2, B3, D1, D2, D3, E2 | A1, A3, B2, B3, D1, D3, E2 | II |
| B3 | A1, A3, B2, B3, D1, D3, E2 | A1, A3, B2, B3, D1, D2, D3, E2 | A1, A3, B2, B3, D1, D3, E2 | II |
| C1 | A2, B1, C1, C2, C3, E1, E3 | A1, A2, A3, B1, B2, B3, C1, C2, C3, D1, D2, D3, E1, E2, E3 | A2, B1, C1, C2, C3, E1, E3 | I |
| C2 | A2, B1, C1, C2, C3, E1, E3 | A1, A2, A3, B1, B2, B3, C1, C2, C3, D1, D2, D3, E1, E2, E3 | A2, B1, C1, C2, C3, E1, E3 | I |
| C3 | A2, B1, C1, C2, C3, E1, E3 | A1, A2, A3, B1, B2, B3, C1, C2, C3, D1, D2, D3, E1, E2, E3 | A2, B1, C1, C2, C3, E1, E3 | I |
| D1 | A1, A3, B2, B3, D1, D3, E2 | A1, A3, B2, B3, D1, D2, D3, E2 | A1, A3, B2, B3, D1, D3, E2 | II |
| D2 | D2 | D2 | D2 | III |
| D3 | A1, A3, B2, B3, D1, D3, E2 | A1, A3, B2, B3, D1, D2, D3, E2 | A1, A3, B2, B3, D1, D3, E2 | II |
| E1 | A2, B1, C1, C2, C3, E1, E3 | A1, A2, A3, B1, B2, B3, C1, C2, C3, D1, D2, D3, E1, E2, E3 | A2, B1, C1, C2, C3, E1, E3 | I |
| E2 | A1, A3, B2, B3, D1, D3, E2 | A1, A3, B2, B3, D1, D2, D3, E2 | A1, A3, B2, B3, D1, D3, E2 | II |
| E3 | A2, B1, C1, C2, C3, E1, E3 | A1, A2, A3, B1, B2, B3, C1, C2, C3, D1, D2, D3, E1, E2, E3 | A2, B1, C1, C2, C3, E1, E3 | I |
Disclaimer/Publisher’s Note: The statements, opinions and data contained in all publications are solely those of the individual author(s) and contributor(s) and not of MDPI and/or the editor(s). MDPI and/or the editor(s) disclaim responsibility for any injury to people or property resulting from any ideas, methods, instructions or products referred to in the content. |
© 2023 by the authors. Licensee MDPI, Basel, Switzerland. This article is an open access article distributed under the terms and conditions of the Creative Commons Attribution (CC BY) license (https://creativecommons.org/licenses/by/4.0/).
Share and Cite
Alqahtani, A.Y.; Makki, A.A. A DEMATEL-ISM Integrated Modeling Approach of Influencing Factors Shaping Destination Image in the Tourism Industry. Adm. Sci. 2023, 13, 201. https://doi.org/10.3390/admsci13090201
Alqahtani AY, Makki AA. A DEMATEL-ISM Integrated Modeling Approach of Influencing Factors Shaping Destination Image in the Tourism Industry. Administrative Sciences. 2023; 13(9):201. https://doi.org/10.3390/admsci13090201
Chicago/Turabian StyleAlqahtani, Ammar Y., and Anas A. Makki. 2023. "A DEMATEL-ISM Integrated Modeling Approach of Influencing Factors Shaping Destination Image in the Tourism Industry" Administrative Sciences 13, no. 9: 201. https://doi.org/10.3390/admsci13090201