Analysis of Warehouse Value-Added Services Using Pareto as a Quality Tool: A Case Study of Third-Party Logistics Service Provider


Abstract
:1. Introduction
2. Literature Review
2.1. Third-Party Logistics Providers
2.2. Value-Added Services in Warehouses
2.3. Total Quality Management Tools Used to Improve Warehouse Operations Efficiency
2.4. Pareto Analysis in Warehouse Operations
2.5. VAS in Warehouse Context
3. Materials and Methods
3.1. Sampling and Data Collection
3.2. Method of Data Analysis
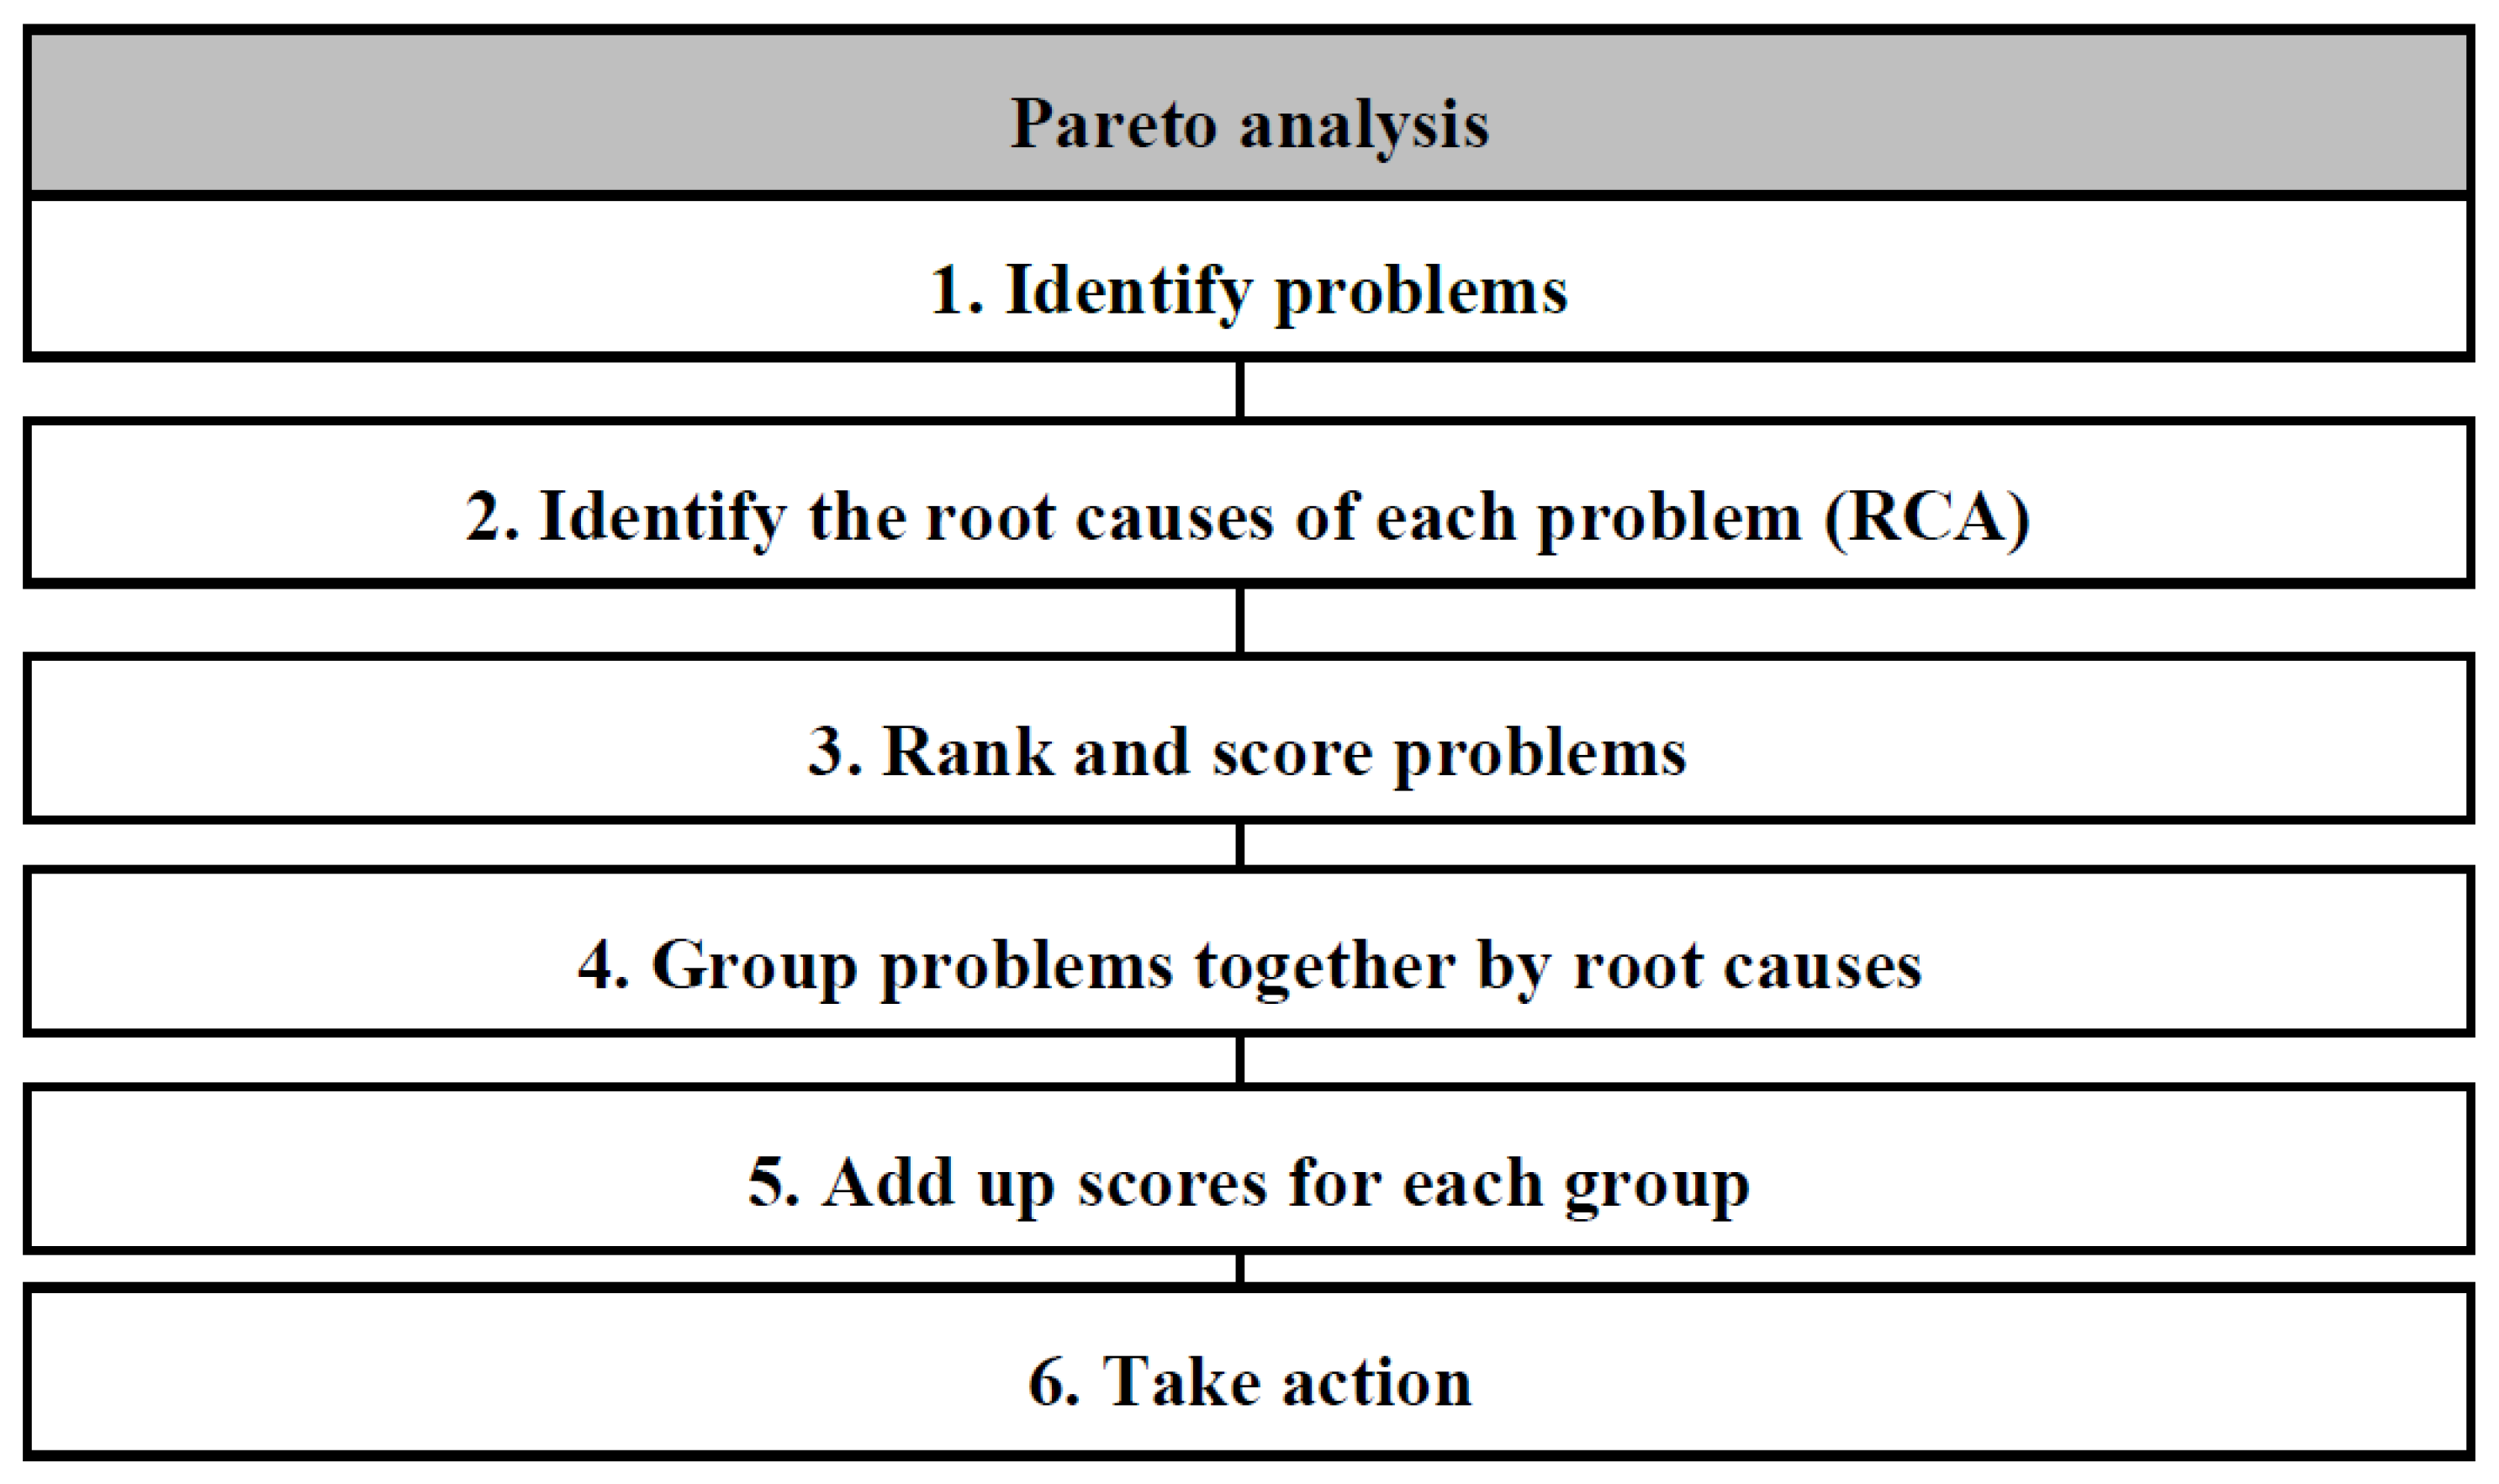
3.3. Pareto Analysis Methodology
4. Results and Discussion
4.1. Steps 1 and 2: Identify Problems and Identify the Root Causes of Each Problem
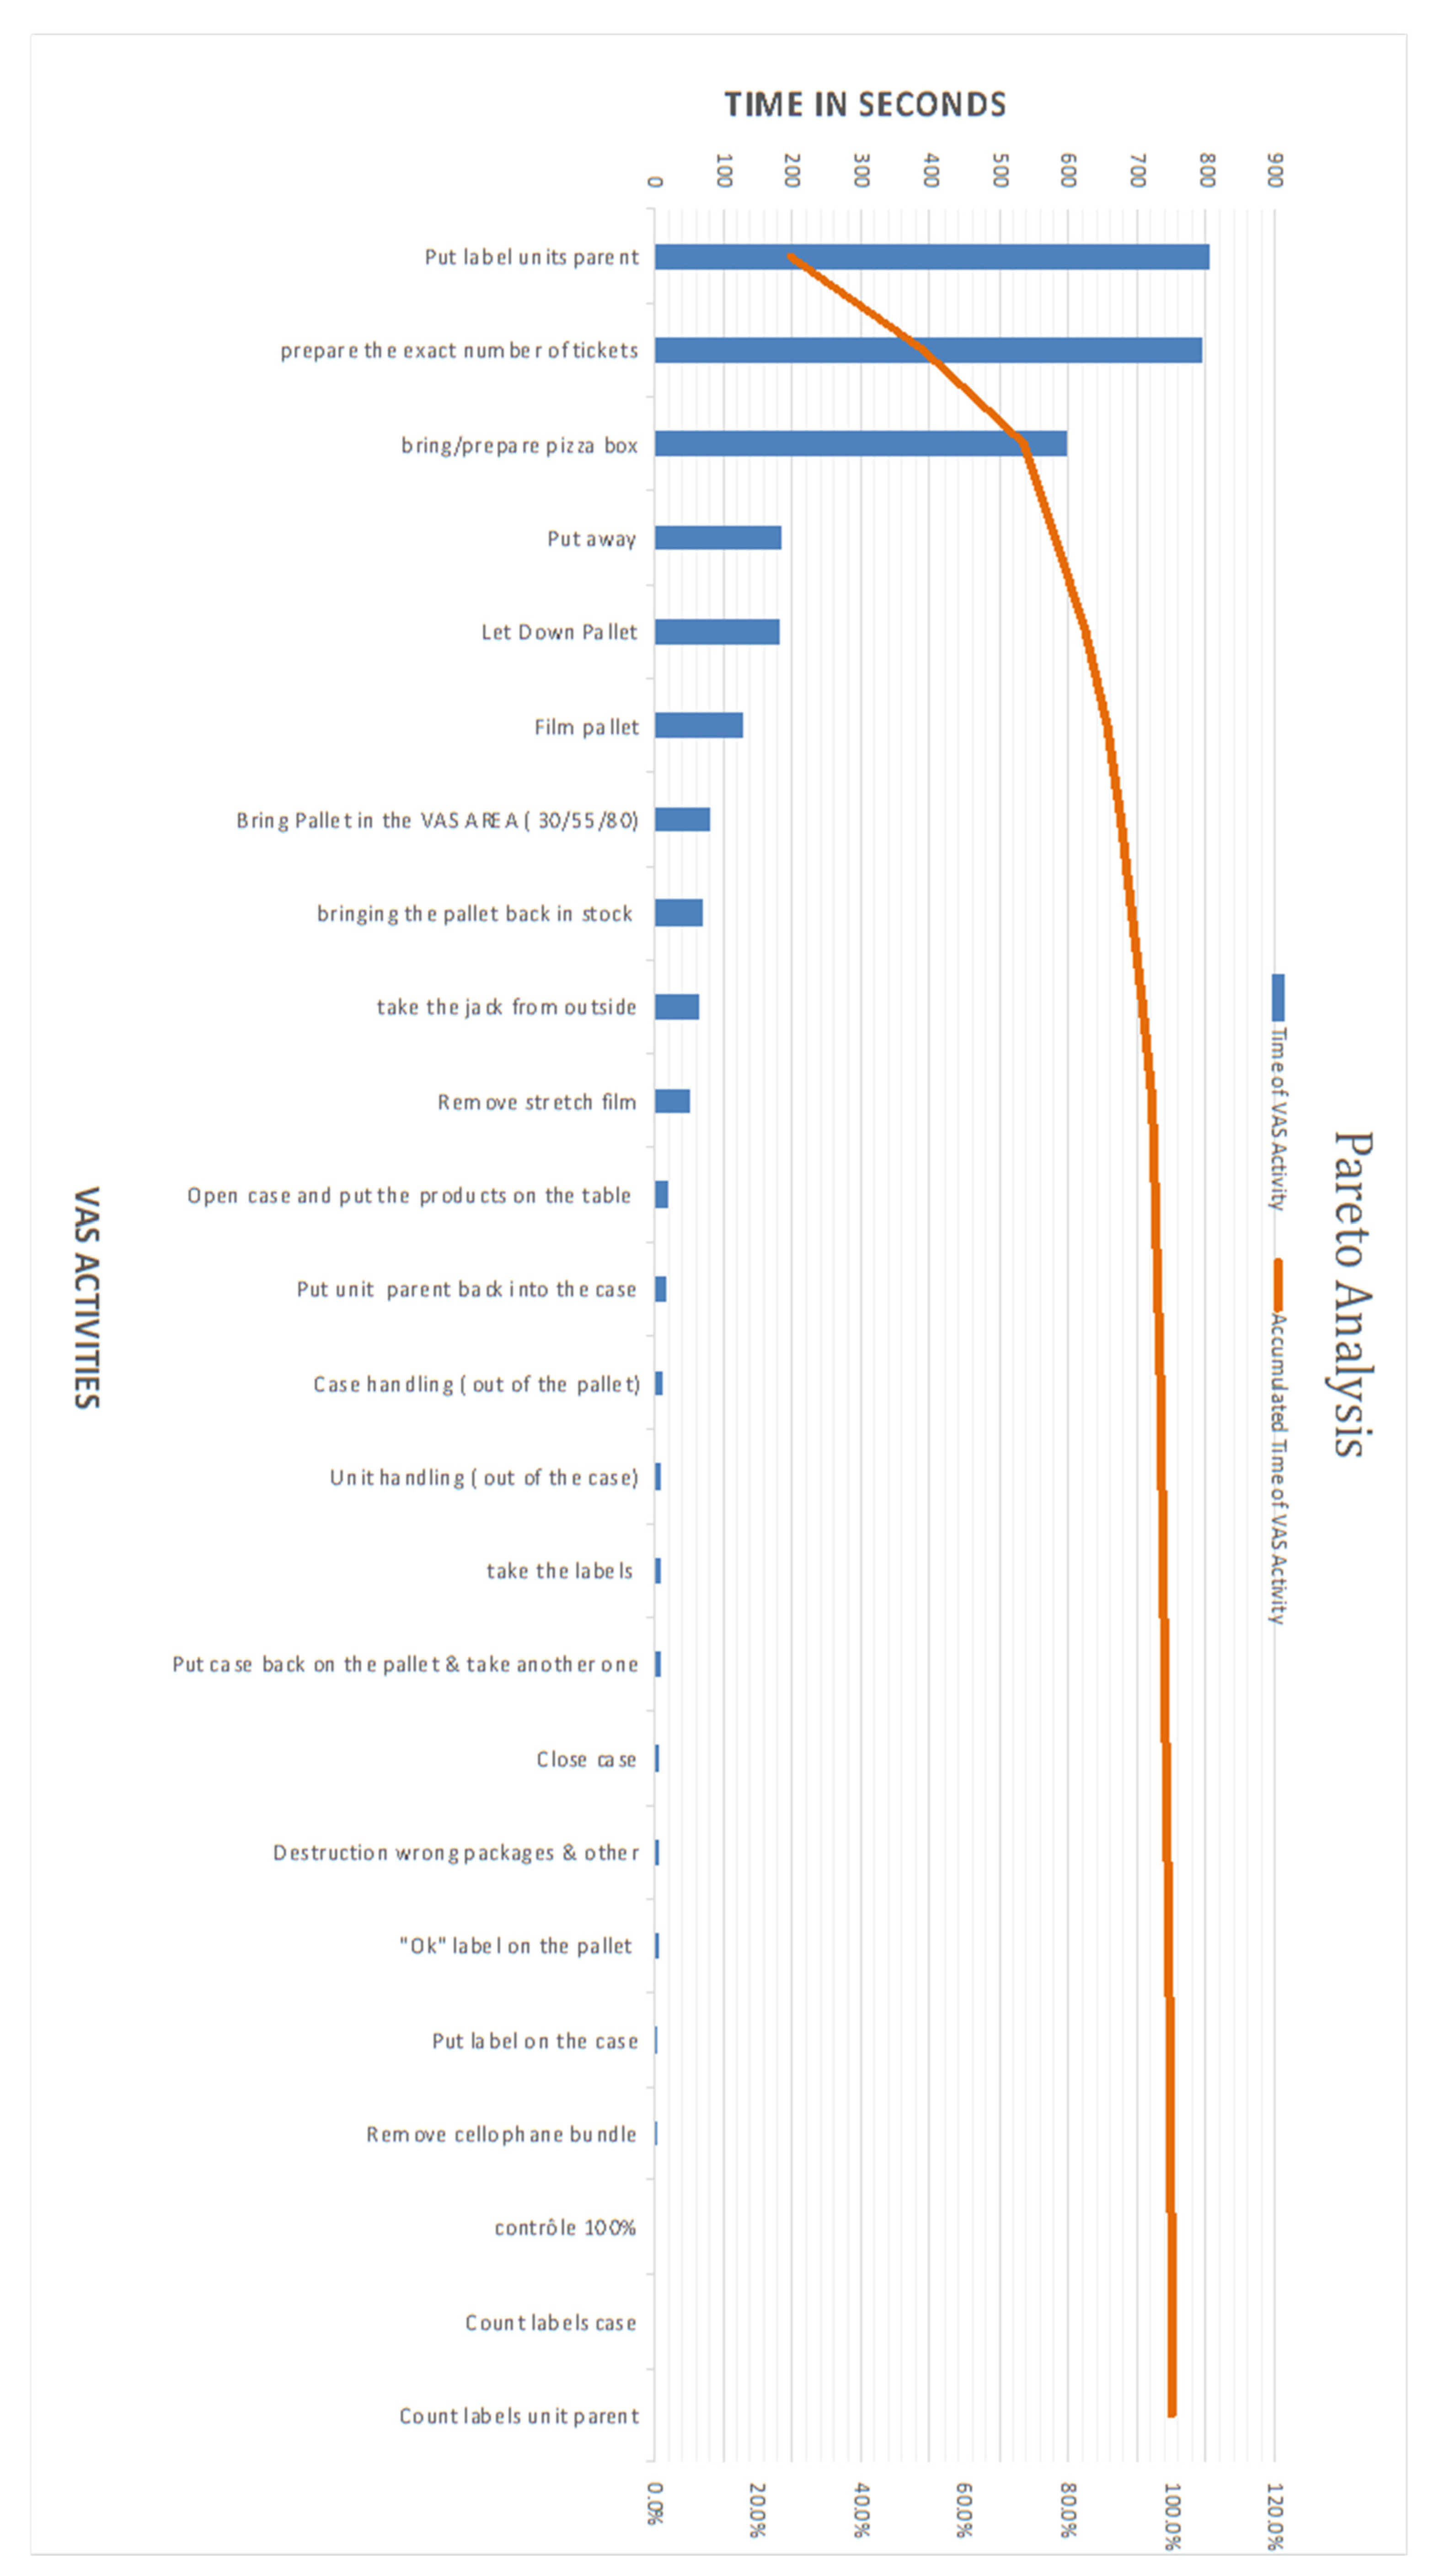
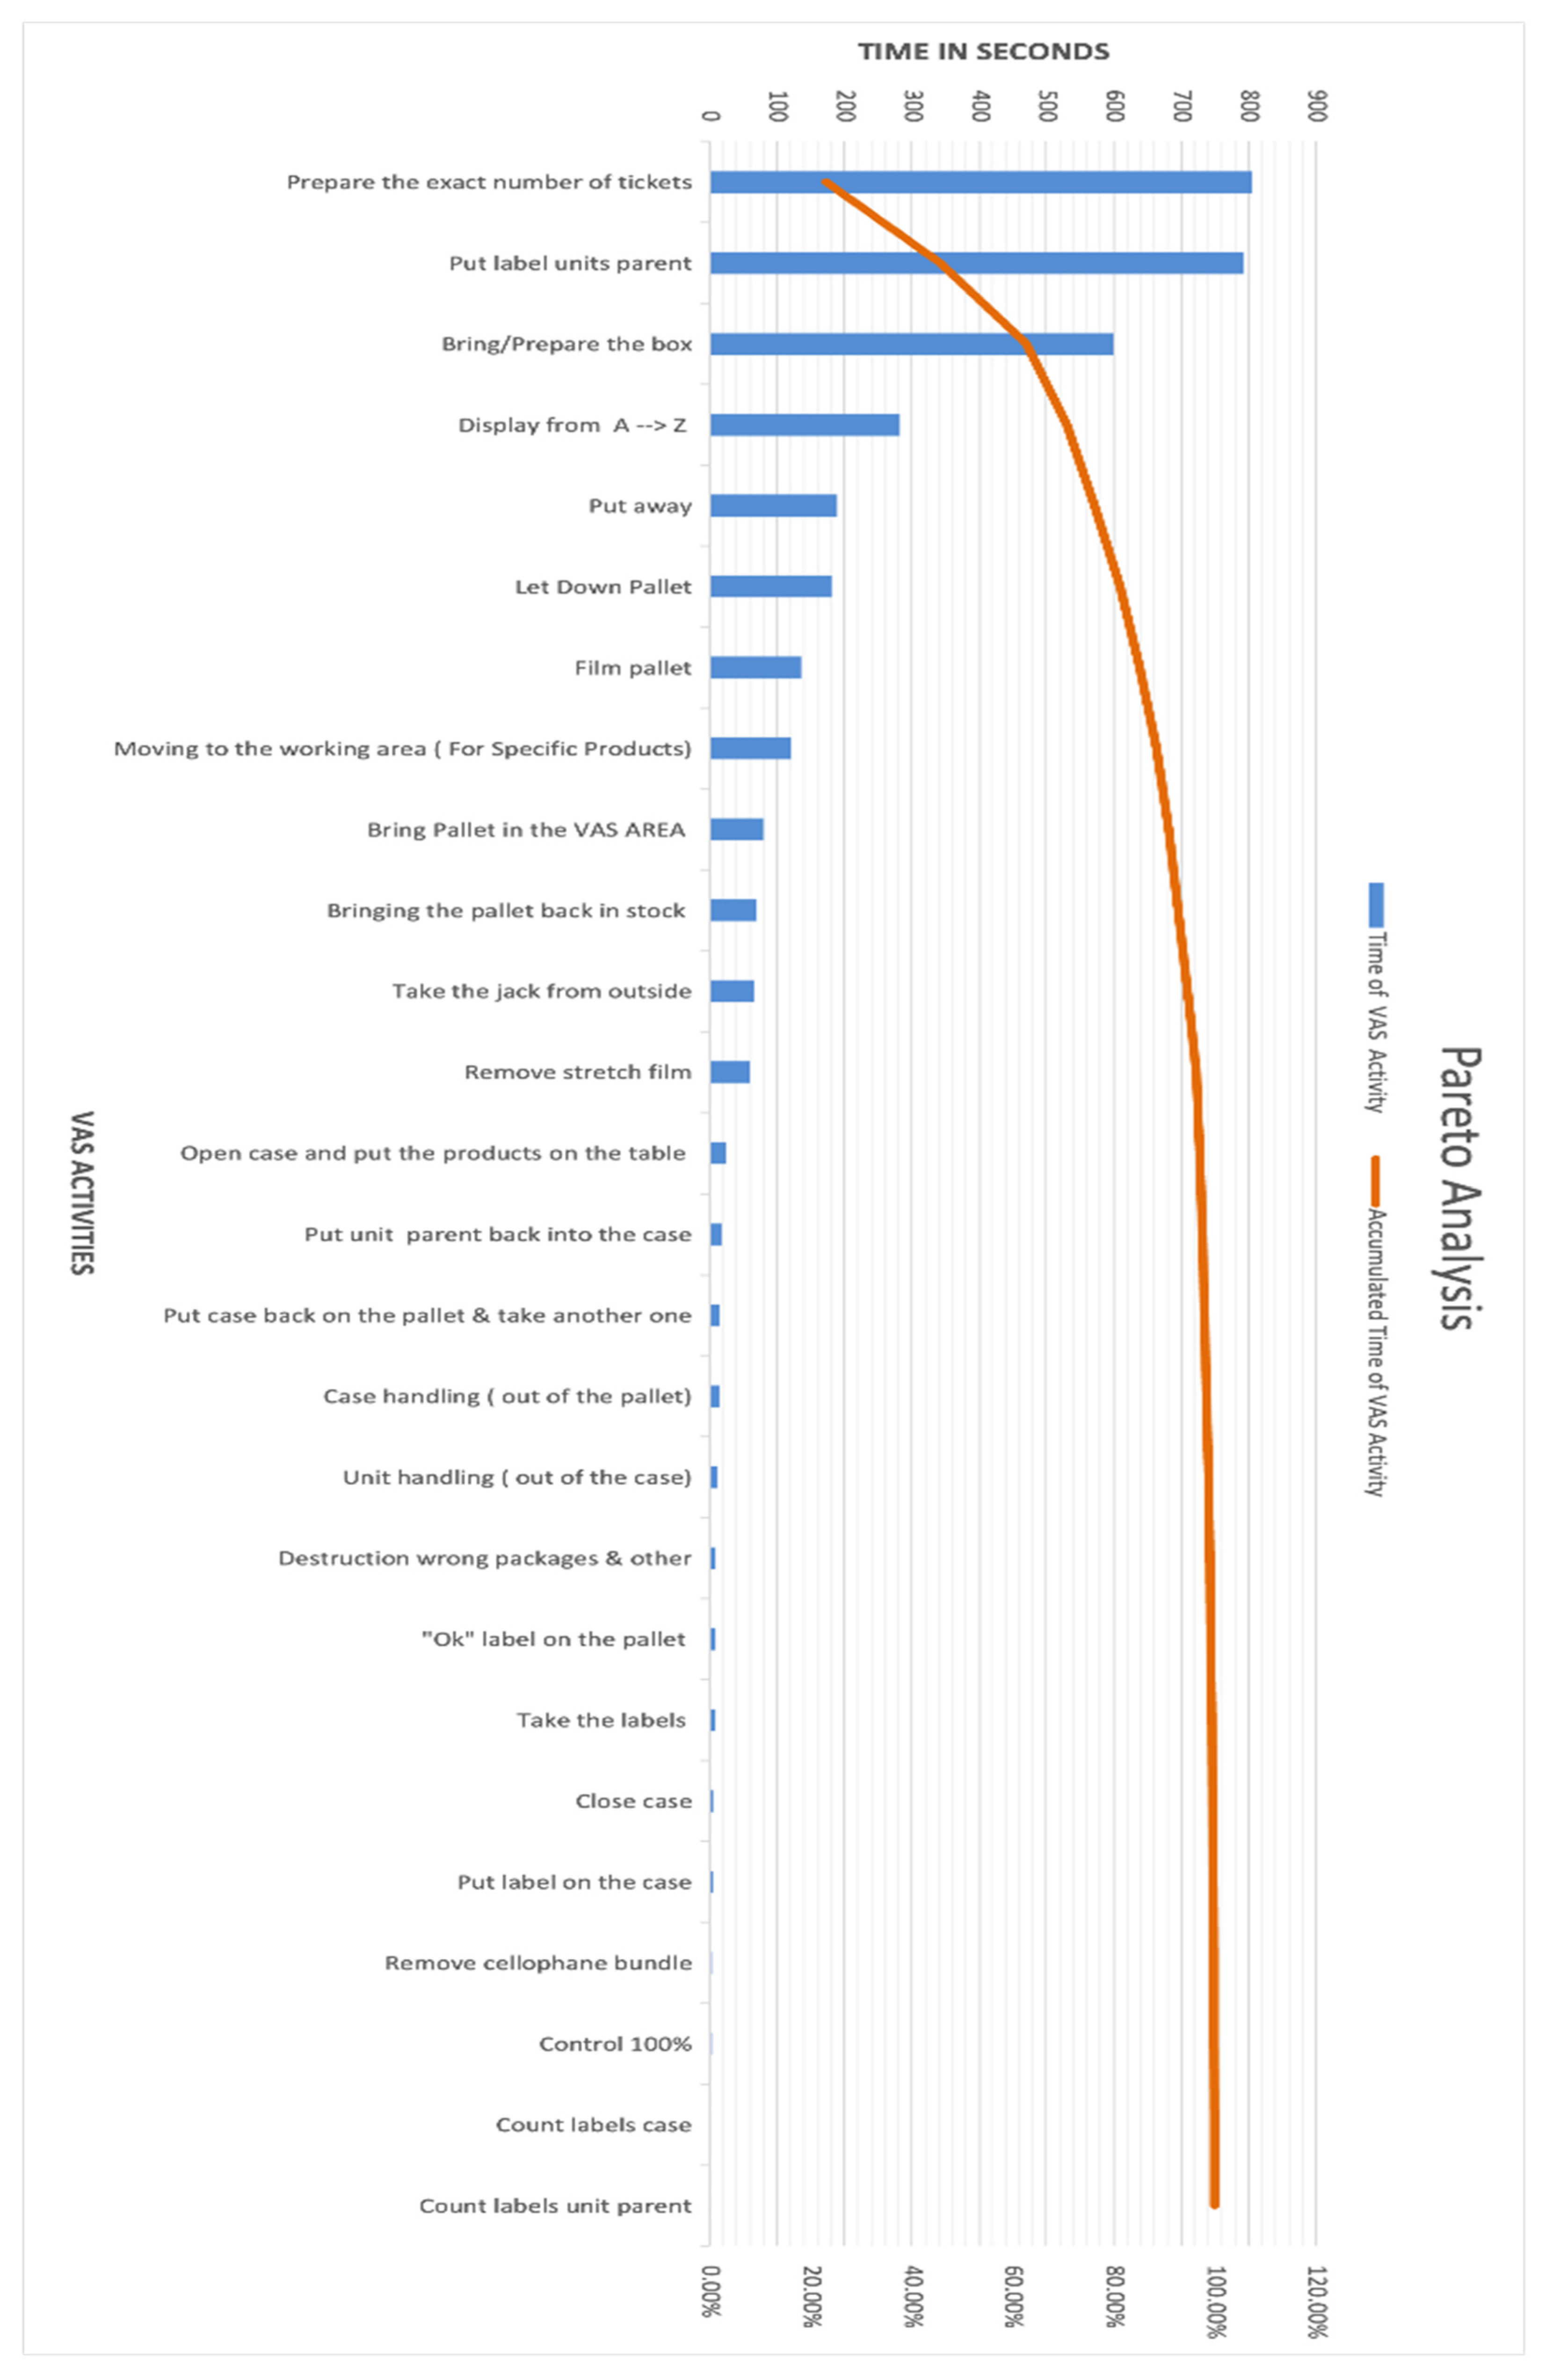
4.2. Steps 3, 4, and 5: Rank, Score, Group Problems (Prioritization)
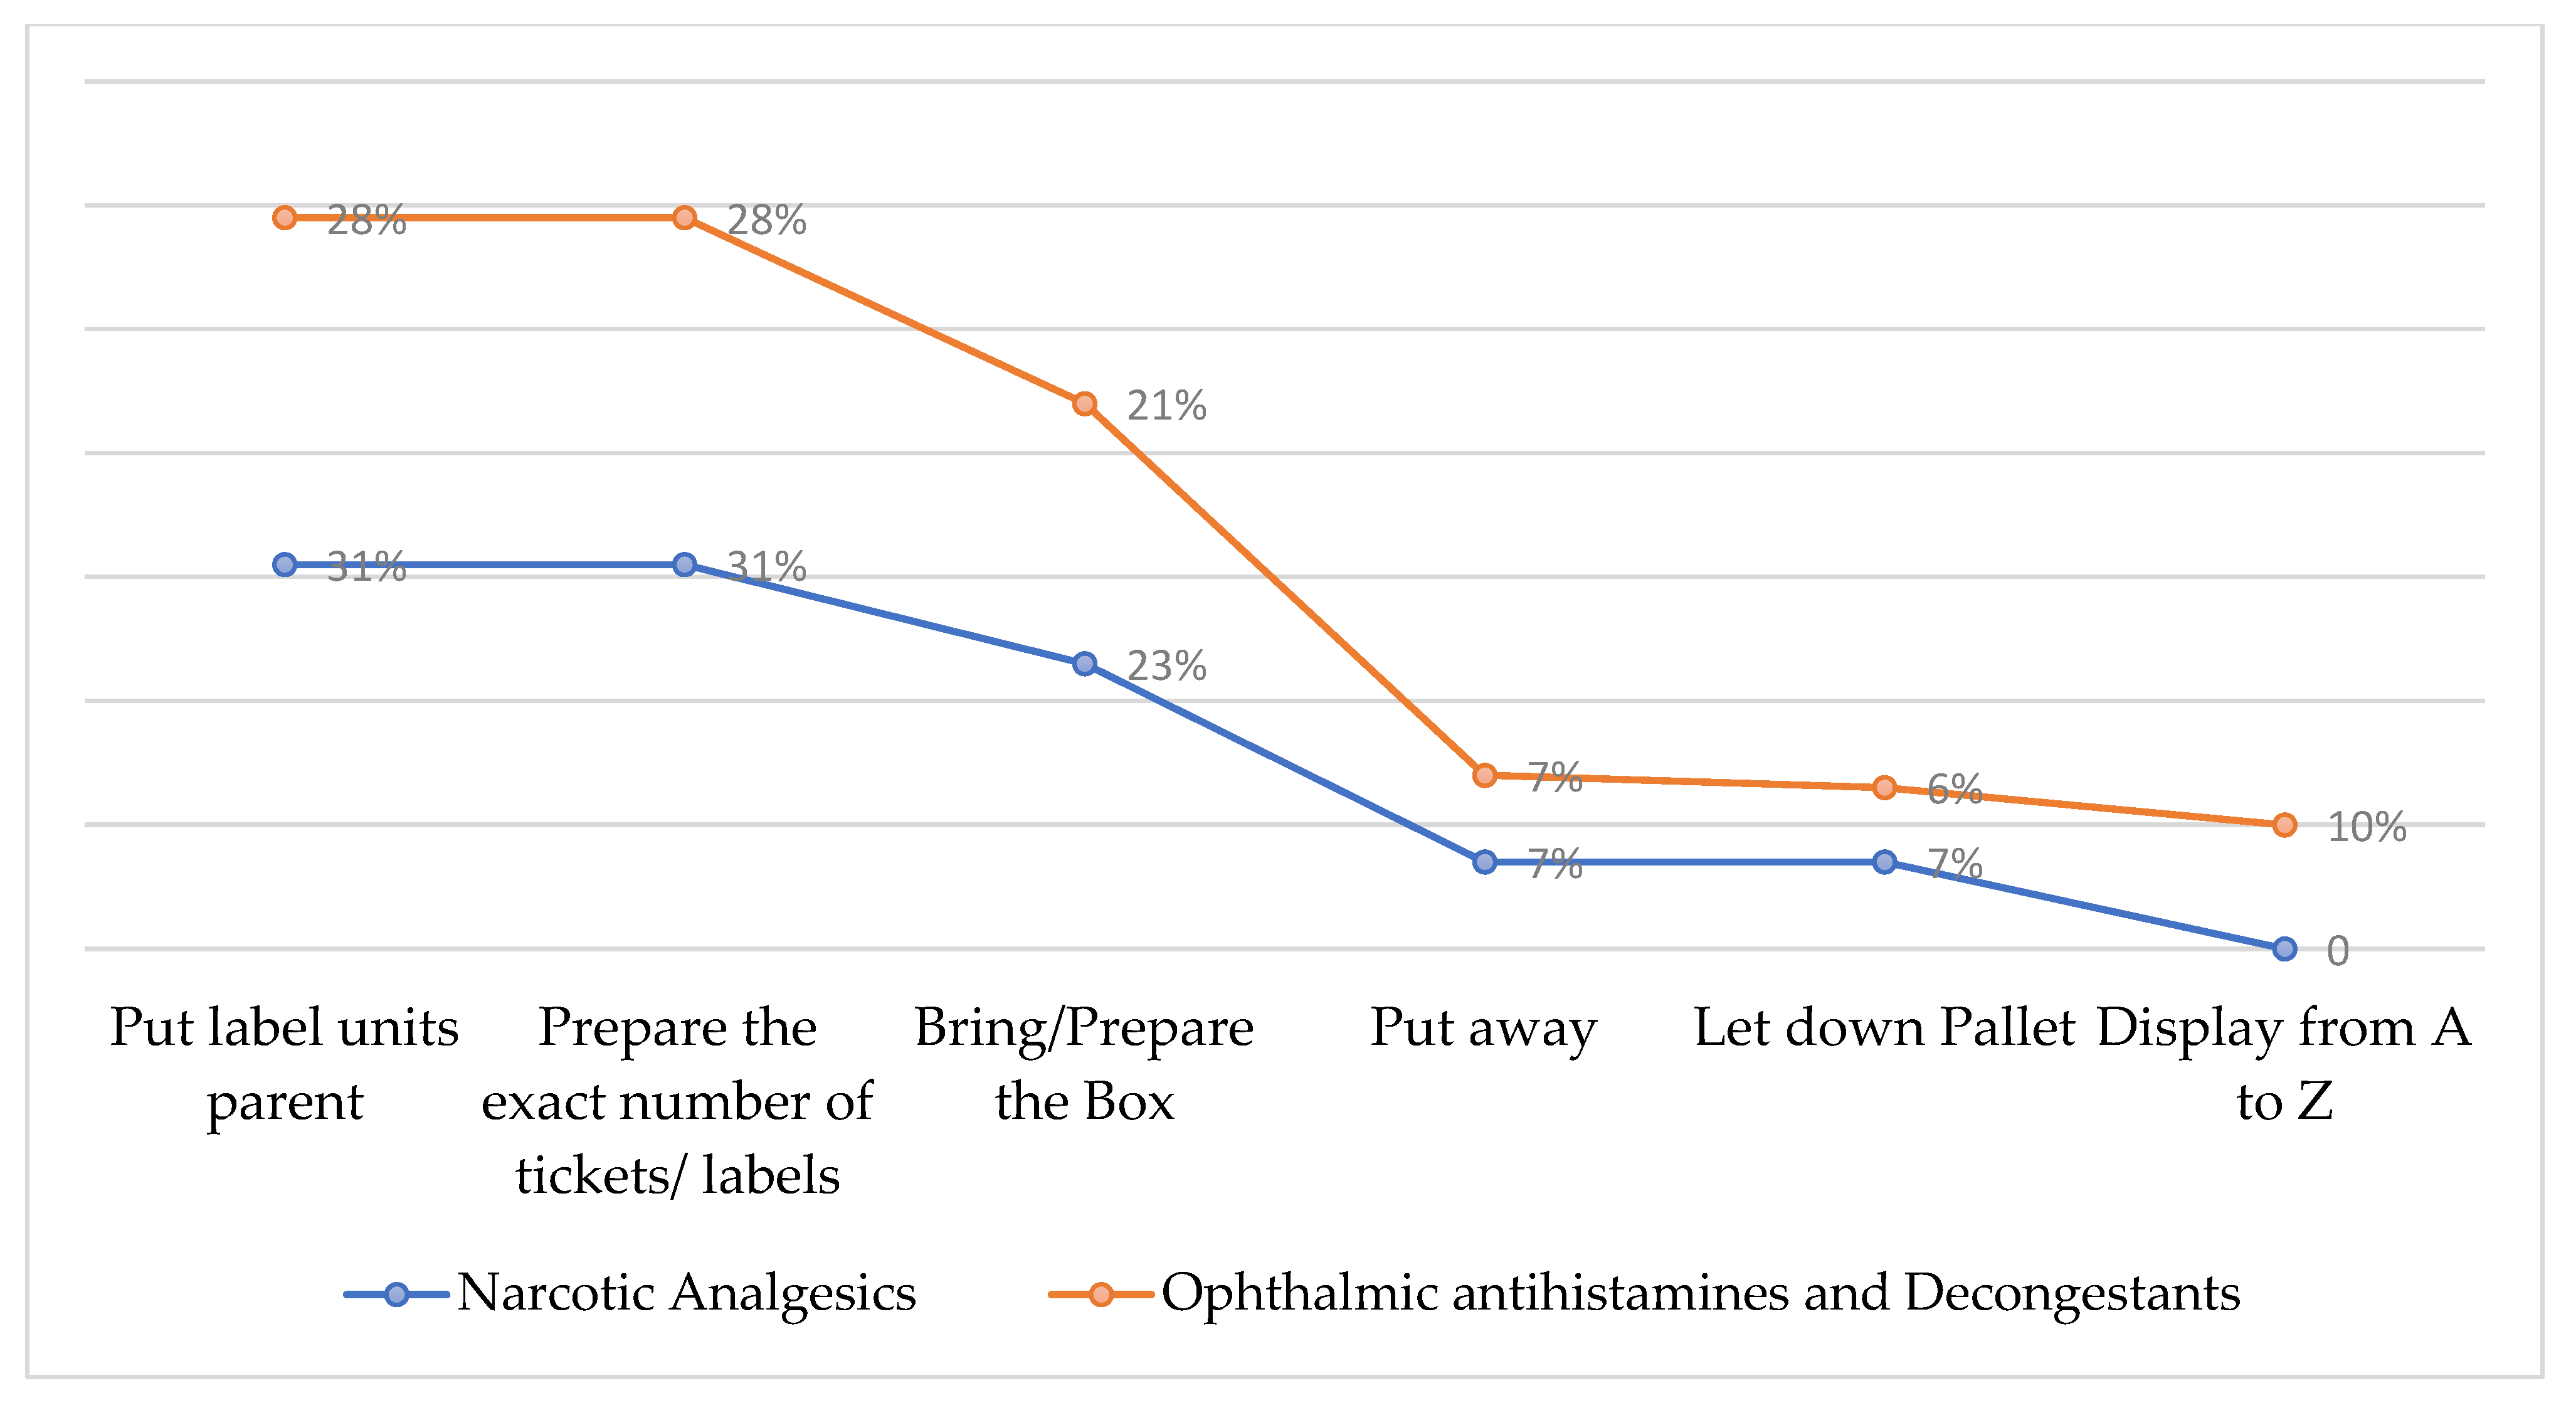
- Put label units parent (put price label or QR code sticker on each individual item)
- Prepare the exact number of tickets/labels (count exactly the right number of price label or QR code sticker for each employee per case)
- Bring/prepare the box (picking up the specific box from the station and build it as a box from flat cartoon to box)
- Put away (put away the finished pallet in the specific area)
- Let down pallet (bringing the pallet from the warehouse aisles to the added value services station area)
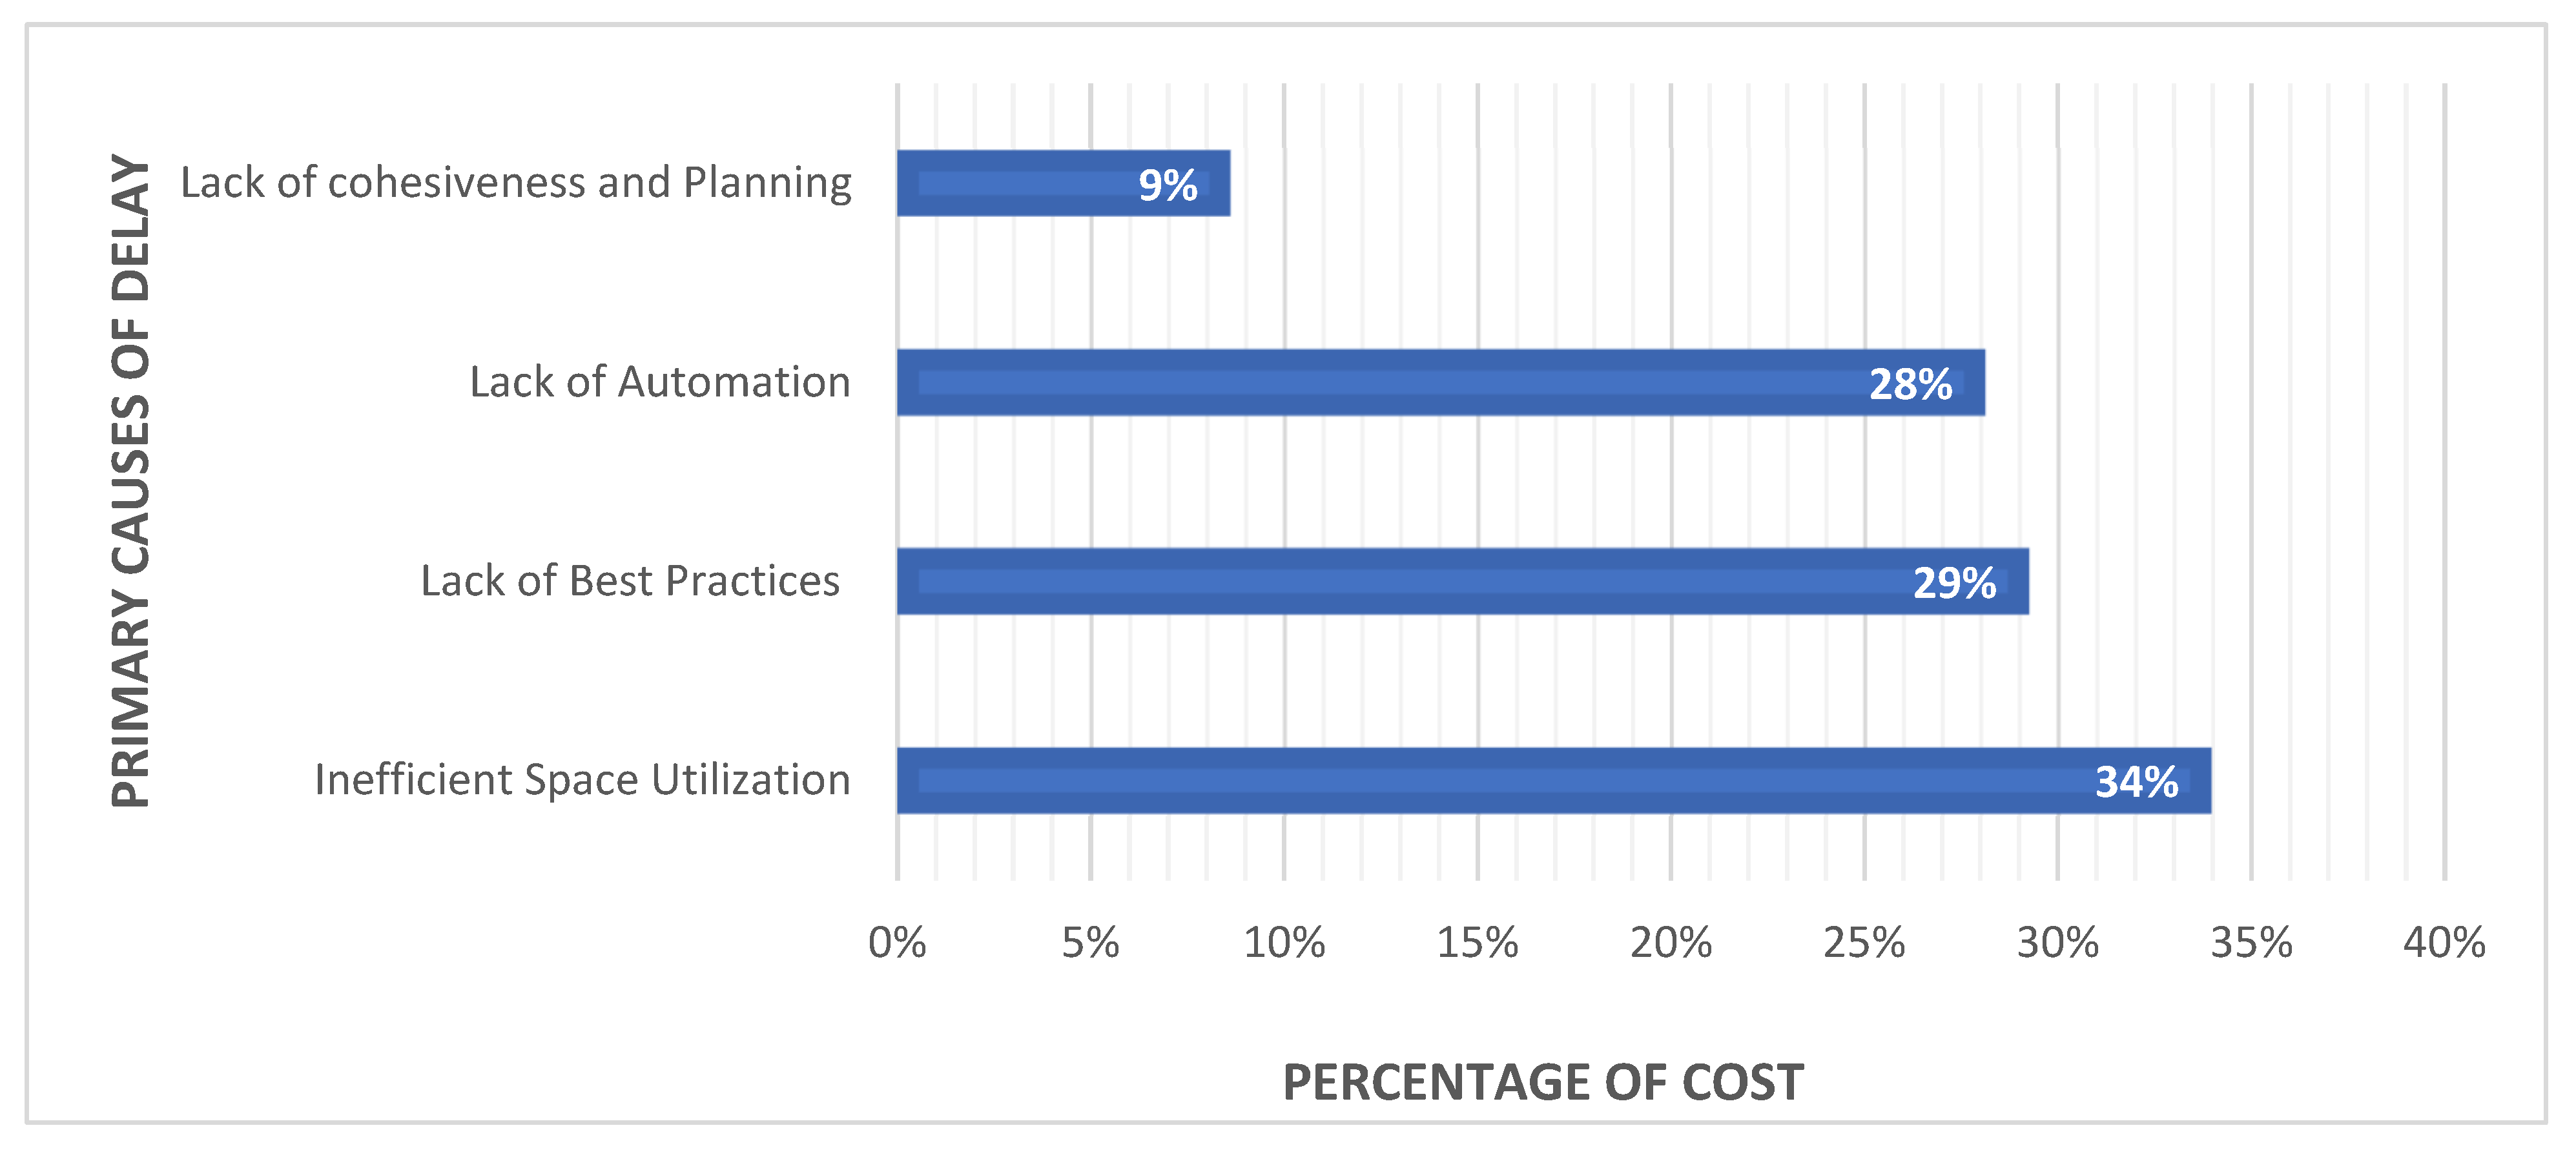
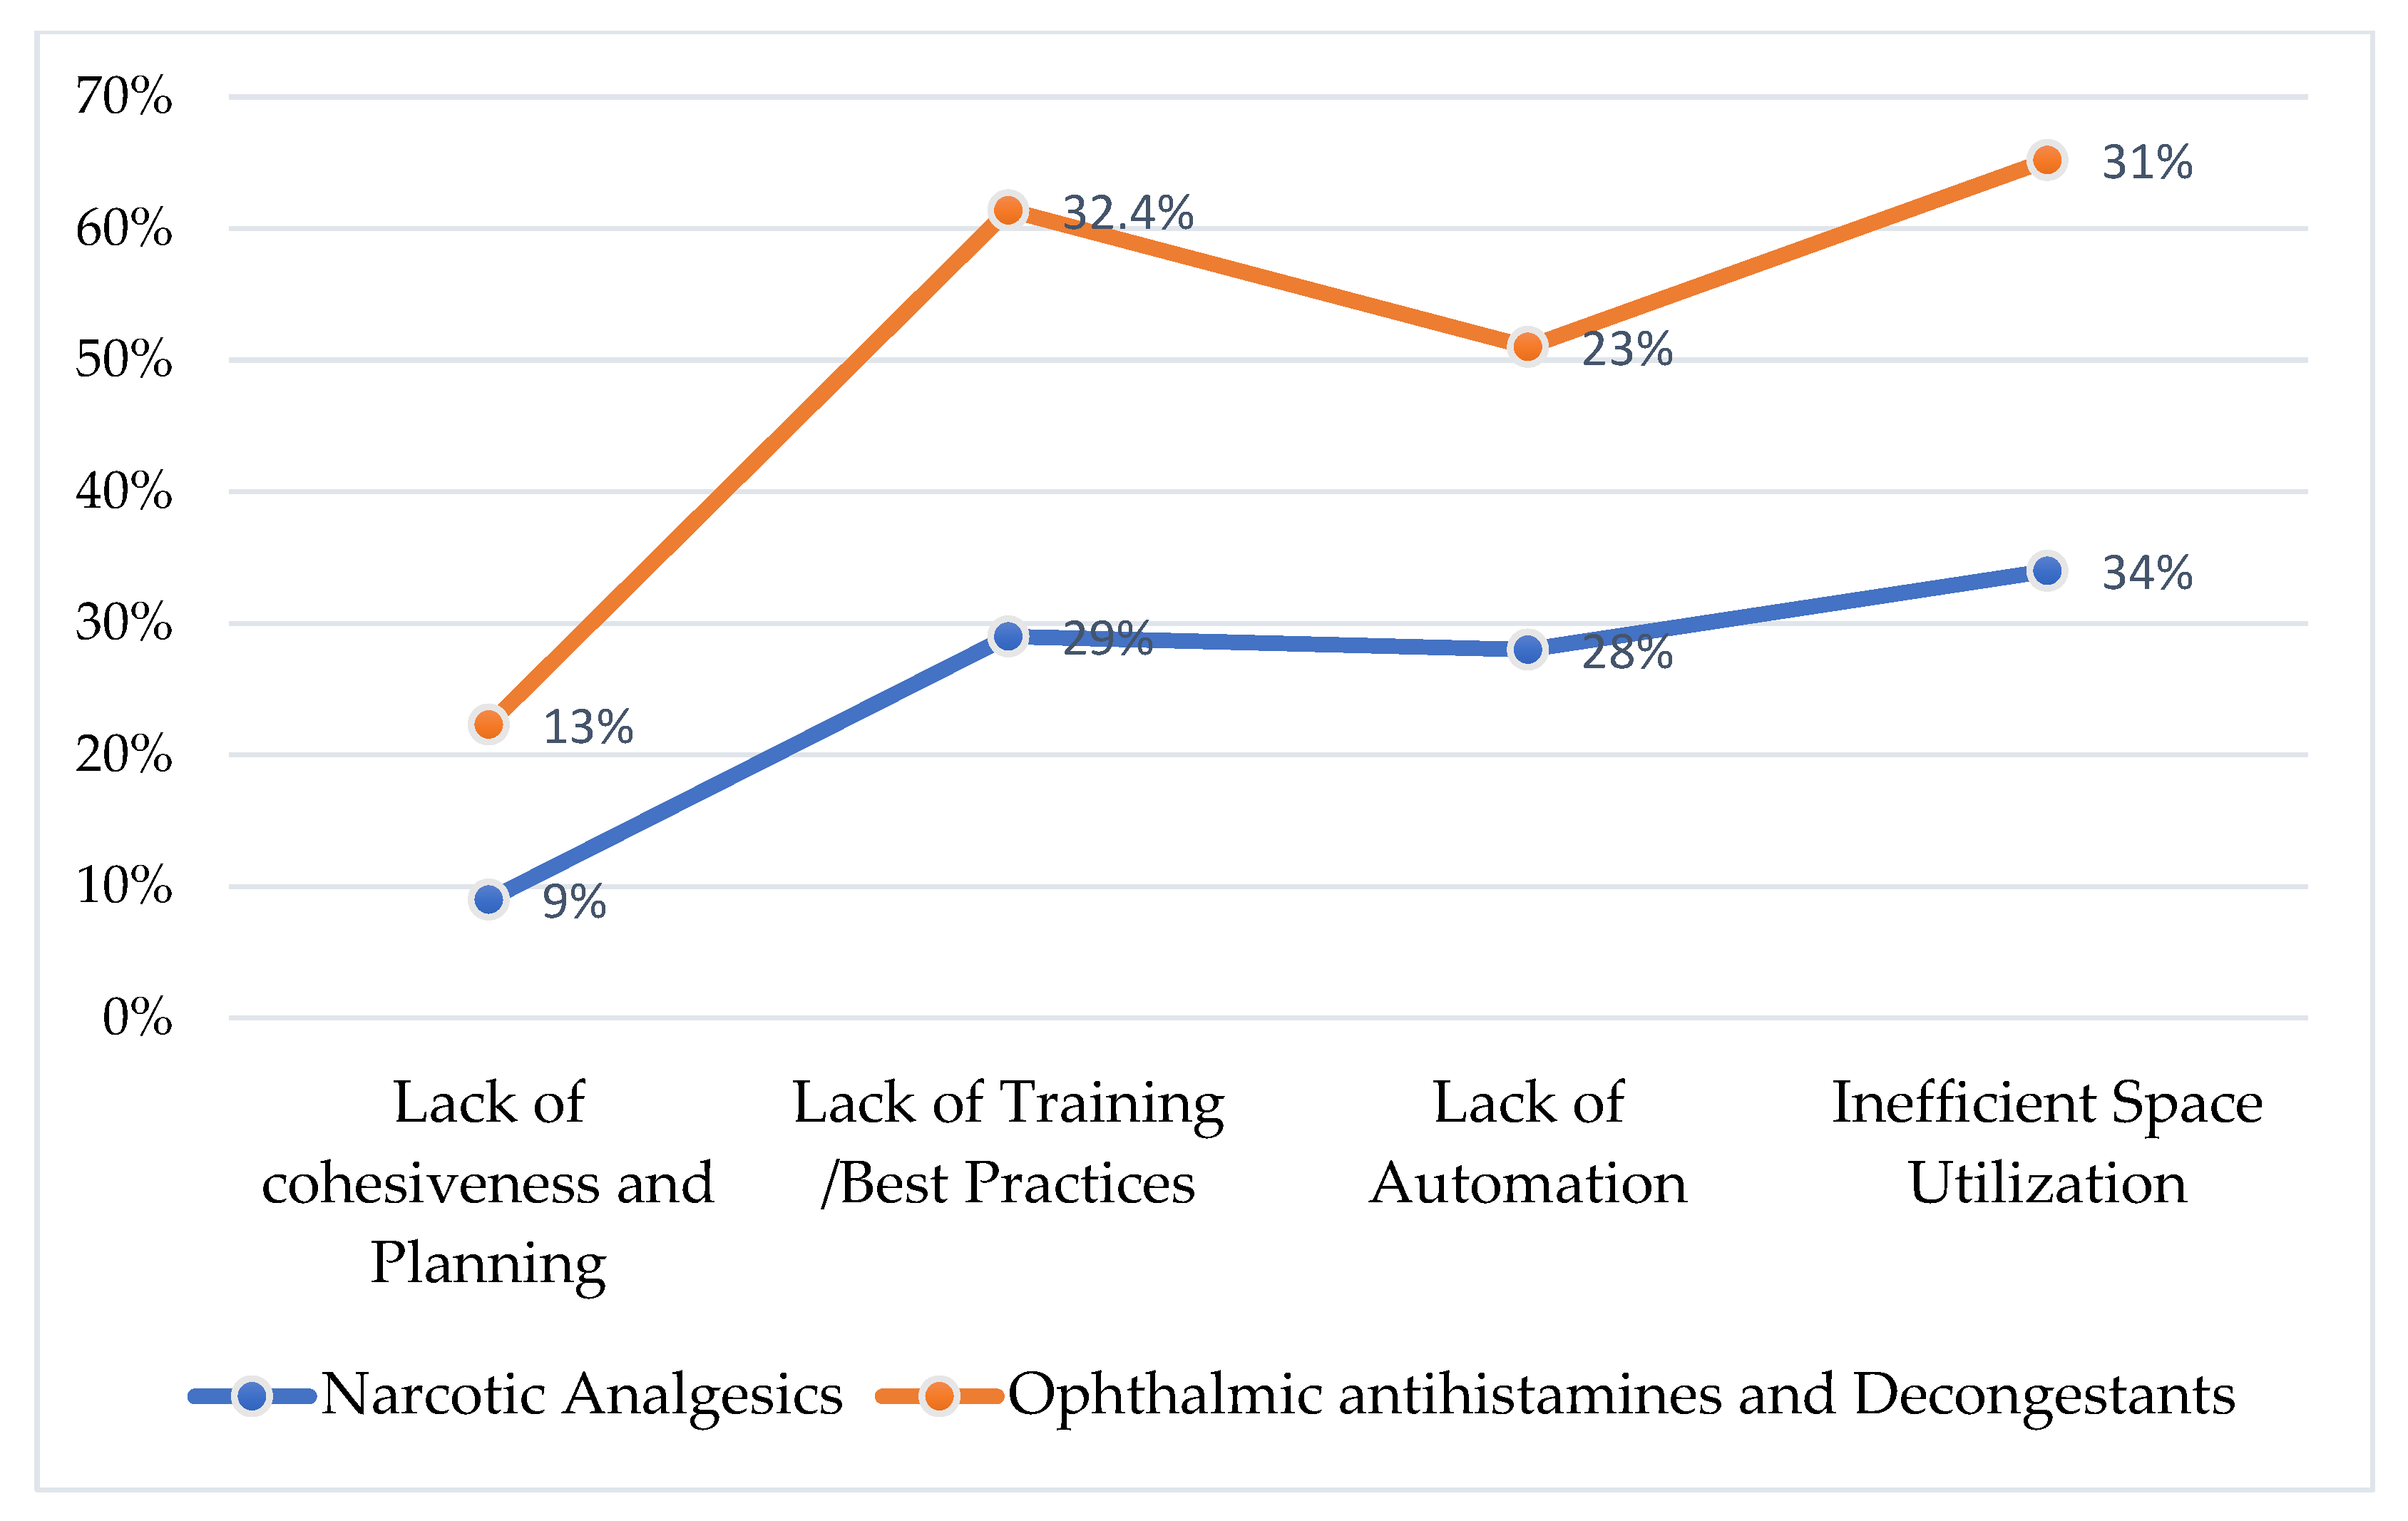
- Inefficient space utilization 34%
- Lack of training/best practices 29%
- Lack of automation 28%
- Lack of cohesiveness and planning 9%
- Prepare the exact number of tickets/labels
- Put label units parent
- Bring/prepare the box
- Display from A to Z
- Put away
- Let down pallet
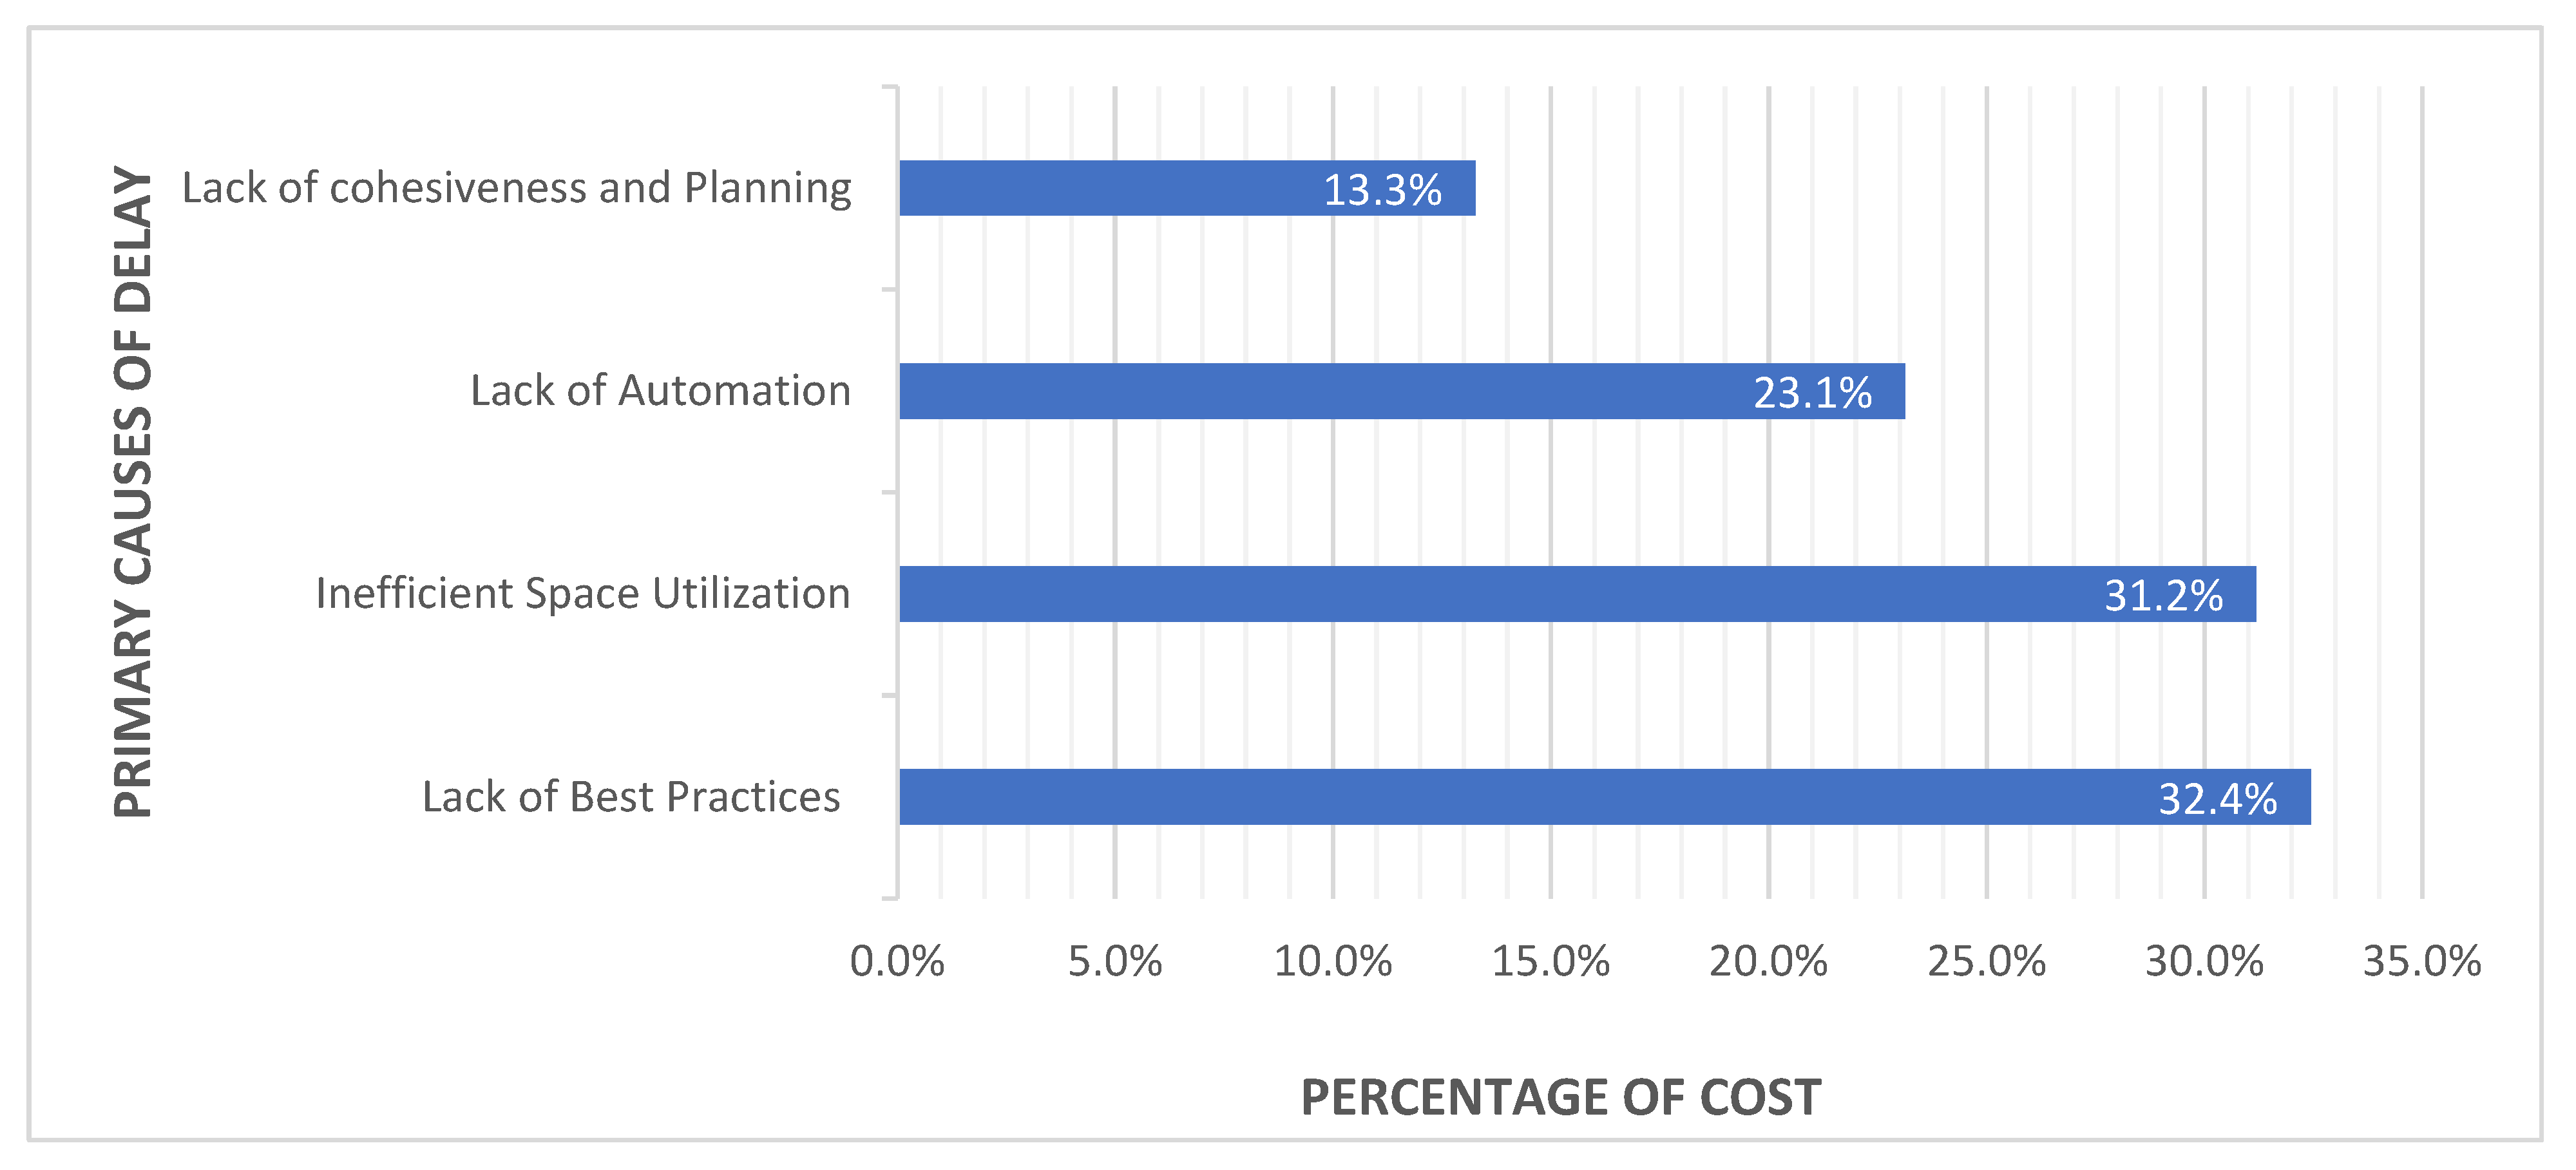
- Lack of training/best practices 32.4%
- Inefficient space utilization 31.2%
- Lack of automation 23.1%
- Lack of cohesiveness and planning 13.3%
4.3. Step 6: Corrective Actions
5. Conclusions
Author Contributions
Funding
Institutional Review Board Statement
Informed Consent Statement
Data Availability Statement
Conflicts of Interest
References
- Abideen, Ahmed, and Fazeeda Binti Mohamad. 2020. Improving the performance of a Malaysian pharmaceutical warehouse supply chain by integrating value stream mapping and discrete event simulation. Journal of Modelling in Management 16: 70–102. [Google Scholar] [CrossRef]
- Abushaikha, Ismail, Loay Salhieh, and Neil Towers. 2018. Improving distribution and business performance through lean warehousing. International Journal of Retail & Distribution Management 46: 780–800. [Google Scholar]
- Accorsi, Riccardo, Riccardo Manzini, and Fausto Maranesi. 2014. A decision-support system for the design and management of warehousing systems. Computers in Industry 65: 175–86. [Google Scholar] [CrossRef]
- Ahmed, Mohiuddin, and Nafis Ahmed. 2011. An application of Pareto analysis and cause-and-effect diagram (CED) for minimizing rejection of raw materials in lamp production process. Management Science and Engineering 5: 87–95. [Google Scholar]
- Alkalha, Ziad, Zu’bi B. M. Al-Zu’bi, and Luay Jum’a. 2022. Investigating the impact of servitization architecture and development on supply Chain design. Supply Chain Forum: An International Journal 23: 68–80. [Google Scholar] [CrossRef]
- Anderson, Edward J., Tim Coltman, Timothy M. Devinney, and Byron Keating. 2011. What drives the choice of a third-party logistics provider? Journal of Supply Chain Management 47: 97–115. [Google Scholar] [CrossRef]
- Baghizadeh, Komeyl, Nafiseh Ebadi, Dominik Zimon, and Luay Jum’a. 2022. Using Four Metaheuristic Algorithms to Reduce Supplier Disruption Risk in a Mathematical Inventory Model for Supplying Spare Parts. Mathematics 11: 42. [Google Scholar] [CrossRef]
- Barker, Jordan M., Andrew R. Gibson, Adriana R. Hofer, Christian Hofer, Issam Moussaoui, and Marc A. Scott. 2021. A competitive dynamics perspective on the diversification of third-party logistics providers’ service portfolios. Transportation Research Part E: Logistics and Transportation Review 146: 102219. [Google Scholar] [CrossRef]
- Baruffaldi, Gulia, Riccardo Accorsi, and Riccardo Manzini. 2019. Warehouse management system customization and information availability in 3pl companies: A decision-support tool. Industrial Management & Data Systems 119: 251–73. [Google Scholar]
- Baruffaldi, Gulia, Riccardo Accorsi, Riccardo Manzini, and E. Ferrari. 2020. Warehousing process performance improvement: A tailored framework for 3PL. Business Process Management Journal 26: 1619–41. [Google Scholar] [CrossRef]
- Berglund, Magnus, P. V. Laarhoven, G. Sharman, and S. Wandel. 1999. Third-party logistics: Is there a future? The International Journal of Logistics Management 10: 59–70. [Google Scholar] [CrossRef]
- Biadacz, Renata. 2020. Quality cost management in the SMEs of Poland. The TQM Journal 33: 1–38. [Google Scholar] [CrossRef]
- Bowersox, Donald J., David J. Closs, and O. K. Helferich. 1996. Logistical Management. New York: McGraw-Hill, vol. 6. [Google Scholar]
- Brooks, Chad. 2014. What is a pareto analysis? Business News Daily Senior 29: 1–5. [Google Scholar]
- Darko, Eric Owusu, and Ilias Vlachos. 2022. Creating Valuable Relationships with Third-Party Logistics (3PL) Providers: A Multiple-Case Study. Logistics 6: 38. [Google Scholar] [CrossRef]
- Davarzani, Hoda, and Andreas Normann. 2015. Toward a relevant agenda for warehousing research: Literature review and practitioners’ input. Logistics Research 8: 1–18. [Google Scholar] [CrossRef]
- De Jesus Pacheco, Diego Augusto, Daniel M. Clausen, and Jendrik Bumann. 2023. A multi-method approach for reducing operational wastes in distribution warehouses. International Journal of Production Economics 256: 108705. [Google Scholar] [CrossRef]
- Faber, Nynke, Rene B. M. De Koster, and Ale Smidts. 2013. Organizing warehouse management. International Journal of Operations & Production Management 33: 1230–56. [Google Scholar]
- Fannon, S. R., J. Eduardo Munive-Hernandez, and Felican Campean. 2021. Mastering continuous improvement (CI): The roles and competences of mid-level management and their impact on the organisation’s CI capability. The TQM Journal 34: 102–24. [Google Scholar] [CrossRef]
- Frankin, Sanne, and Karolina Johannesson. 2013. Analyzing Warehouse Operations in a 3PL Company. Master of Science thesis, Chalmers University of Technology, Gothenburg, Sweden. [Google Scholar]
- Gotzamani, Katerina, Pantelis Longinidis, and Fotis Vouzas. 2010. The logistics services outsourcing dilemma: Quality management and financial performance perspectives. Supply Chain Management: An International Journal 15: 438–53. [Google Scholar] [CrossRef]
- Hamdan, Amer, and K. Jamie Rogers. 2008. Evaluating the efficiency of 3PL logistics operations. International Journal of Production Economics 113: 235–44. [Google Scholar] [CrossRef]
- Herrera, Quintana Arcelly Ingrid, and Lisui Yang. 2017. Understanding Value-Added Service Offering by 3PL Providers: VAS as a Source of Competitive Advantage for the Provider and the Customer. Master thesis, Jönköping University, Småland, Sweden. [Google Scholar]
- Ivančić, Valentina. 2014. Improving the decision making process trought the Pareto principle application. Ekonomska misao i praksa 2: 633–56. [Google Scholar]
- Jager, Kerstin, Per Hilletofth, and Sandor Ujvari. 2009. From standard 3PL provider to service developer: A case study from the Swedish furniture industry. World Review of Intermodal Transportation Research 2: 376–90. [Google Scholar] [CrossRef]
- Juga, Jari, Jouni Juntunen, and Mikko Paananen. 2018. Impact of value-adding services on quality, loyalty and brand equity in the brewing industry. International Journal of Quality and Service Sciences 10: 61–71. [Google Scholar] [CrossRef]
- Jum’a, Luay, Muhammad Ikram, Ziad Alkalha, and Maher Alaraj. 2022. Do companies adopt big data as determinants of sustainability: Evidence from manufacturing companies in Jordan. Global Journal of Flexible Systems Management 23: 479–94. [Google Scholar] [CrossRef]
- Jum’a, Luay. 2020. The effect of value-added activities of key suppliers on the performance of manufacturing firms. Polish Journal of Management Studies 22: 231–46. [Google Scholar] [CrossRef]
- Karim, Nur Hazwani, Noorul Shaiful Fitri Abdul Rahman, Rudiah Md Hanafiah, Saharuddin Abdul Hamid, Alisa Ismail, A. S. Abd Kader, and Mohd Shaladdin Muda. 2021. Revising the warehouse productivity measurement indicators: Ratio-based benchmark. Maritime Business Review 6: 49–71. [Google Scholar] [CrossRef]
- Kolinski, Adam, and Boguslaw Sliwczynski. 2015. IT support of production efficiency analysis in ecological aspect. In Technology Management for Sustainable Production and Logistic. Berlin/Heidelberg: Springer, pp. 205–19. [Google Scholar]
- Kopecki, Tomasz, Jerzy Bakunowicz, and Tomasz Lis. 2016. Post-critical deformation states of composite thin-walled aircraft load-bearing structures. Journal of Theoretical and Applied Mechanics 54: 195–204. [Google Scholar] [CrossRef]
- Langley, C. J. 2013. Third-Party Logistics Study: The State of Logistics Outsourcing. Atlanta: Capgemini Consulting. [Google Scholar]
- Laosirihongthong, Tritos, Dotun Adebanjo, Premarante Samaranayake, Nachiappan Subramanian, and S. Boon-itt. 2018. Prioritizing warehouse performance measures in contemporary supply chains. International Journal of Productivity and Performance Management 67: 1703–26. [Google Scholar] [CrossRef]
- Manzini, Riccardo, Yavuz Bozer, and Sunderesh Heragu. 2015. Decision models for the design, optimization and management of warehousing and material handling systems. International Journal of Production Economics 170: 711–16. [Google Scholar] [CrossRef]
- Martin, Heinrich. 2018. Warehousing and Transportation Logistics: Systems, Planning, Application and Cost Effectiveness. London: Kogan Page Publishers. [Google Scholar]
- Mou, Jin-Jin, and Ying-Mei Jiang. 2021. Value-added Service of Distribution Center on Integrated Cold Chain Performance. In E3S Web of Conferences. Les Ulis: EDP Sciences, vol. 261, p. 03042. [Google Scholar]
- Moussa, Fatima Zahra Ben, Ronald De Guio, Sebastien Dubois, Ivana Rasovska, and Rachid Benmoussa. 2019. Study of an innovative method based on complementarity between ARIZ, lean management and discrete event simulation for solving warehousing problems. Computers & Industrial Engineering 132: 124–40. [Google Scholar]
- Olya, Hossein, Levent Altinay, and Glauco De Vita. 2018. An exploratory study of value added services. Journal of Services Marketing 32: 334–45. [Google Scholar] [CrossRef]
- Pandey, Priyanka, Nishant Agrawal, Teena Saharan, and R. D. Raut. 2021. Impact of human resource management practices on TQM: An ISM-DEMATEL approach. The TQM Journal 34: 199–228. [Google Scholar] [CrossRef]
- Pereira, Caroline Morito, Rosley Anholon, Izabela Simon Rampasso, Osvaldo L.G. Quelhas, Walter Leal Filho, and Luis Antonio Santa-Eulalia. 2020. Evaluation of lean practices in warehouses: An analysis of Brazilian reality. International Journal of Productivity and Performance Management 70: 1–20. [Google Scholar] [CrossRef]
- Raghuram, P., and Mahesh Kuman Arjunan. 2022. Design framework for a lean warehouse–a case study-based approach. International Journal of Productivity and Performance Management 71: 2410–31. [Google Scholar] [CrossRef]
- Richards, Gwynne. 2017. Warehouse Management: A Complete Guide to Improving Efficiency and Minimizing Costs in the Modern Warehouse. London: Kogan Page Publishers. [Google Scholar]
- Rivera, Liliana, Yossi Sheffi, and Desiree Knoppen. 2016. Logistics clusters: The impact of further agglomeration, training and firm size on collaboration and value added services. International Journal of Production Economics 179: 285–94. [Google Scholar] [CrossRef]
- Ruiz-Pérez, Fernando, Álvaro Lleó, Elisabeth Viles, and Daniel Jurburg. 2020. Enhancing participation through organizational drivers. The TQM Journal 33: 823–40. [Google Scholar] [CrossRef]
- Sangka, Bayu Khresana, Shams Rahman, Aswini Yadlapalli, and Ferry Jie. 2019. Managerial competencies of 3PL providers. The International Journal of Logistics Management 30: 1054–77. [Google Scholar] [CrossRef]
- Shi, Yangyan, Abraham Zhang, Tiru Arthanari, Yanping Liu, and T. C. E. Cheng. 2016. Third-party purchase: An empirical study of third-party logistics providers in China. International Journal of Production Economics 171: 189–200. [Google Scholar] [CrossRef]
- Shi, Ye, Xiaolong Guo, and Yugang Yu. 2018. Dynamic warehouse size planning with demand forecast and contract flexibility. International Journal of Production Research 56: 1313–25. [Google Scholar] [CrossRef]
- Soinio, Juho, Kari Tanskanen, and Max Finne. 2012. How logistics-service providers can develop value-added services for SMEs: A dyadic perspective. The International Journal of Logistics Management 23: 31–49. [Google Scholar] [CrossRef]
- Statista. 2021. Size of the Value-Added Warehousing and Distribution (VAWD) Market in the United States from 2010 to 2020. Available online: https://www.statista.com/statistics/957494/value-added-warehousing-distribution-market-size-united-states/ (accessed on 1 December 2021).
- Sugathadasa, R., Deshan Wakkumbura, H. Niles Perera, and Amila Thibbotuwawa. 2021. Analysis of risk factors for temperature-controlled warehouses. Operations and Supply Chain Management: An International Journal 14: 320–37. [Google Scholar] [CrossRef]
- Tubis, Agnieszka A., Jacek Ryczyński, and Arkadiusz Żurek. 2021. Risk assessment for the use of drones in warehouse operations in the first phase of introducing the service to the market. Sensors 21: 6713. [Google Scholar] [CrossRef] [PubMed]
- Wang, Shuyn. 2018. Developing value added service of cold chain logistics between China and Korea. Journal of Korea Trade 22: 247–64. [Google Scholar] [CrossRef]
- Zhang, Xumei, Xiaopeng Han, Xiangyu Liu, Ru Liu, and Jinzhong Leng. 2015. The pricing of product and value-added service under information asymmetry: A product life cycle perspective. International Journal of Production Research 53: 25–40. [Google Scholar] [CrossRef]
- Zimon, Dominik. 2017. The impact of TQM philosophy for the improvement of logistics processes in the supply chain. International Journal for Quality Research 11: 3–16. [Google Scholar]


| Inventory and Logistics Management | Customer Service | Warehouse Management | Transportation |
|---|---|---|---|
| Freight Consolidation Freight Distribution Shipment planning & Management Traffic Management Inventory Management Carrier Selection Order entry/Management Back-order capability & fulfilment Forecasting Cycle count and auditing | Freight Payments Auditing Order Management Fulfilment Help desk Carrier selection Rate Negotiation Warranty parts recovery Custom brokerage Selection of software Consulting services After sale services Operation of IT systems Reverse logistics | Packaging Product Making Labelling/re-labelling Warehousing Receiving Sort and direct put away Merge and pack-out Manifest documents Bar code printing Pick and pack Product testing Assembly & Installation | Fleet Management & operations Cross-docking Product return Merge in transit |
| Author | Main Purpose | Approach/Method | Context | Country |
|---|---|---|---|---|
| (Raghuram and Arjunan 2022) | To create a simple framework for designing a warehouse that incorporates lean principles. Multiple objectives are considered, including revising value-added and non-value-added warehouse activities. | Simulation | Heavy machinery manufacturer | India |
| (Darko and Vlachos 2022) | The study looked at how 3PL services are changing, as well as relationship-based aspects that affect how well they get along with their customers, including value-added services. | Semi-structured interviews | 3PL | UK |
| (Soinio et al. 2012) | To produce value-added logistics services framework to improve 3PL services. | Semi-structured interviews | 3PL | Finland |
| (Wang 2018) | The paper focuses on developing value-added cold chain logistics services between China and Korea. | Secondary data analysis | Agriculture | China and Korea |
| (Juga et al. 2018) | To examine how perceived service quality and value-added logistics services affect a beer company’s B2B clients’ perceptions of its brand equity. | Survey | Brewery company | Finland |
| (Abideen and Mohamad 2020) | To employ the discrete event simulation technique to dynamically quantify and visualize the state of a value stream map for a warehouse supply chain. | Simulation | Pharmaceutical | Malaysia |
| (Karim et al. 2021) | To revise the important warehouse performance metrics into a set of productivity measurement indicators that could be used globally to compare productivity performance. | Semi-structured survey | All industries | Malaysia |
| (Olya et al. 2018) | Based on the eight indicators of the prosperity index, this study indicates a value-added predictor for the service sector. | Qualitative comparative analysis | Service industry | 104 countries |
| (Herrera and Yang 2017) | To better understand how a 3PL decides, based on the particular logistics situation, which customer–supplier connections and service development methods should be pursued, as well as which value-added services or service adaptations can be profitable. | Survey | 3PL | Sweden |
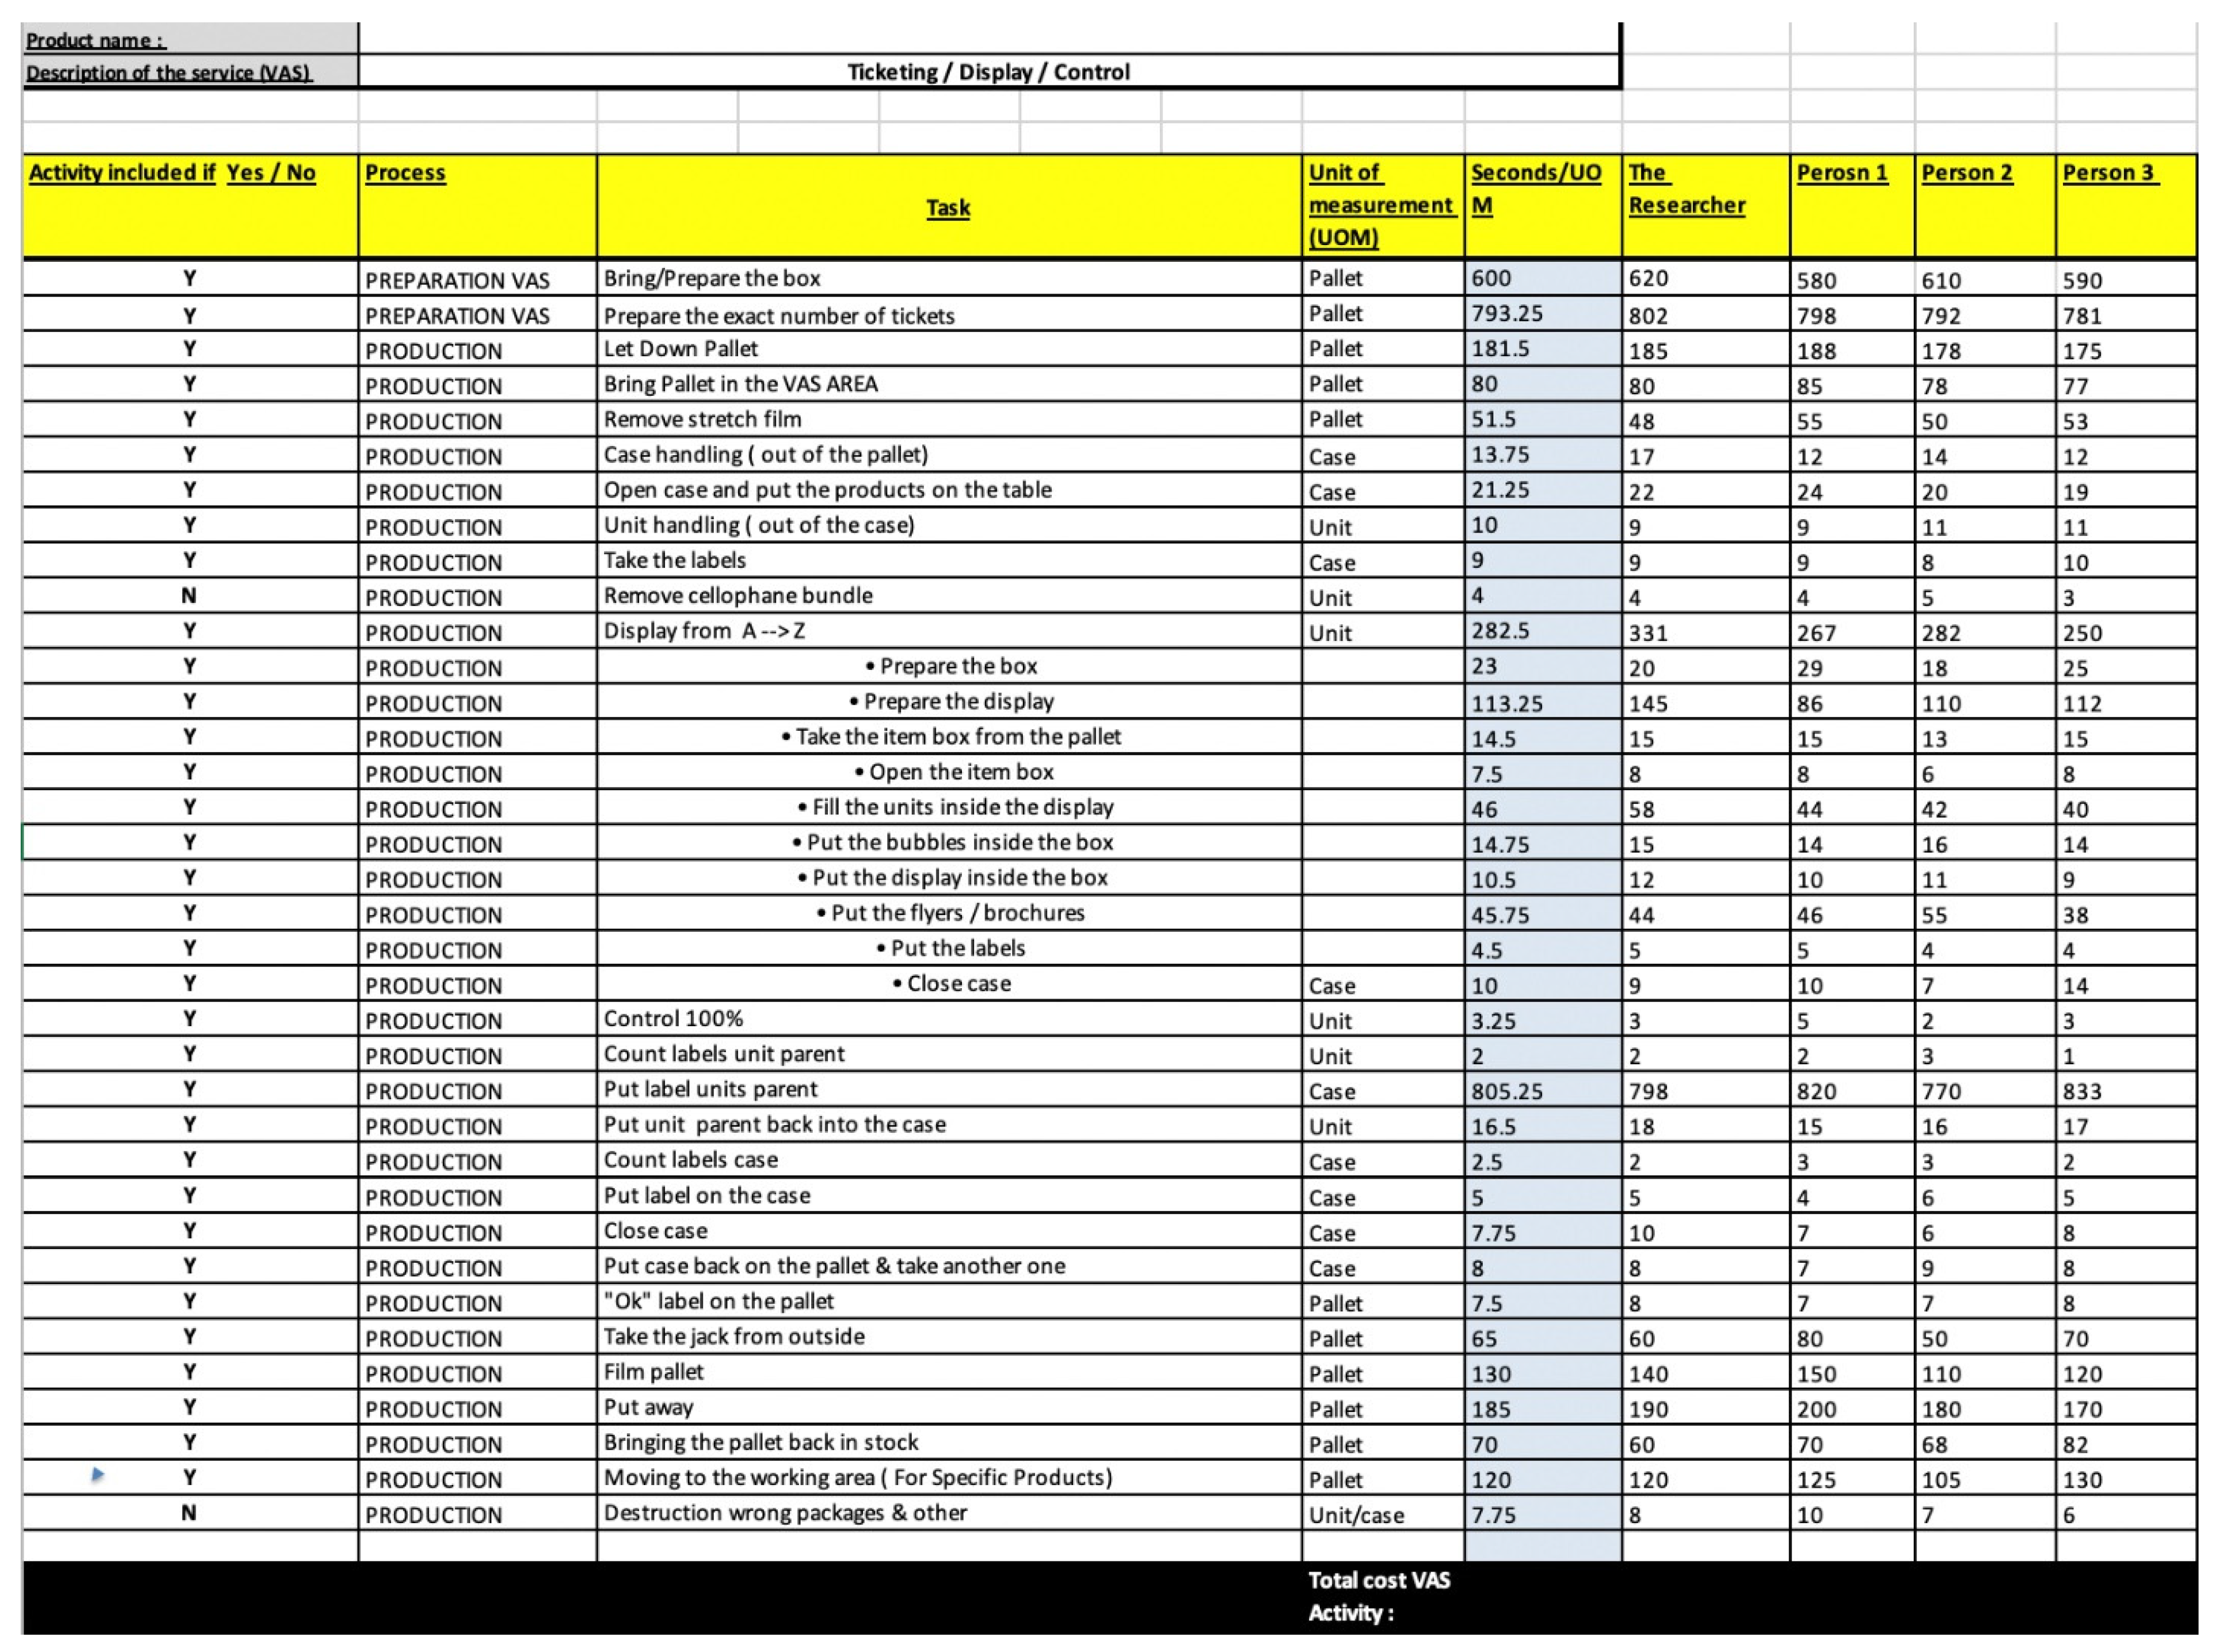
| Activity Type | Time Consumed in Seconds | Cause of Delay | Cost Percentage Per Total Cost VAS |
|---|---|---|---|
| Bring/prepare the box | 600 | Inefficient Space Utilization | 19.48% |
| Prepare the exact number of tickets | 793.25 | Lack of Automation | 25.76% |
| Let Down Pallet | 181.5 | Inefficient Space Utilization | 5.89% |
| Bring Pallet in the VAS AREA | 80 | Inefficient Space Utilization | 2.60% |
| Remove stretch film | 51.5 | Lack of Best Practices | 1.67% |
| Case handling (out of the pallet) | 13.75 | Lack of Best Practices | 0.45% |
| Open case and put the products on the table | 21.25 | Lack of Best Practices | 0.69% |
| Unit handling (out of the case) | 10 | Lack of Best Practices | 0.32% |
| Take the labels | 9 | Lack of Best Practices | 0.29% |
| Remove cellophane bundle | 4 | Lack of Best Practices | 0.13% |
| Control 100% | 3.25 | lack of automation | 0.11% |
| Count labels unit parent | 2 | lack of automation | 0.06% |
| Put label units parent | 805.25 | Lack of Best Practices | 26.15% |
| Put unit parent back into the case | 16.5 | Lack of Best Practices | 0.54% |
| Count labels case | 2.5 | Lack of Best Practices | 0.08% |
| Put label on the case | 5 | Lack of Best Practices | 0.16% |
| Close case | 7.75 | lack of cohesiveness and Planning | 0.25% |
| Put case back on the pallet and take another one | 8 | lack of cohesiveness and Planning | 0.26% |
| “Ok” label on the pallet | 7.5 | lack of cohesiveness and Planning | 0.24% |
| take the jack from outside | 65 | lack of cohesiveness and Planning | 2.11% |
| Film pallet | 130 | lack of cohesiveness and Planning | 4.22% |
| Put away | 185 | Inefficient Space Utilization | 6.01% |
| Bringing the pallet back in stock | 70 | lack of cohesiveness and Planning | 2.27% |
| Destruction wrong packages and other | 7.75 | Inefficient Space Utilization | 0.25% |
| Activity Type | Time Consumed in Seconds | Cause of Delay | Cost Percentage Per Total Cost VAS |
|---|---|---|---|
| Bring/prepare the box | 600 | Inefficient Space Utilization | 17.6% |
| Prepare the exact number of tickets | 805 | Lack of Automation | 23.7% |
| Let Down Pallet | 180 | Inefficient Space Utilization | 5.3% |
| Bring Pallet in the VAS AREA | 80 | Inefficient Space Utilization | 2.4% |
| Remove stretch film | 60 | Lack of Best Practices | 1.8% |
| Case handling (out of the pallet) | 14 | Lack of Best Practices | 0.4% |
| Open case and put the products on the table | 24 | Lack of Best Practices | 0.7% |
| Unit handling (out of the case) | 12 | Lack of Best Practices | 0.4% |
| Take the labels | 7 | Lack of Best Practices | 0.2% |
| Remove cellophane bundle | 3 | Lack of Best Practices | 0.1% |
| Display from A → Z | 282.5 | Lack of Best Practices | 6.8% |
| Control 100% | 3 | lack of automation | 0.1% |
| Count labels unit parent | 2 | lack of automation | 0.1% |
| Put label units parent | 794 | Lack of Best Practices | 23.3% |
| Put unit parent back into the case | 17 | Lack of Best Practices | 0.5% |
| Count labels case | 2.5 | Lack of Best Practices | 0.1% |
| Put label on the case | 5 | Lack of Best Practices | 0.1% |
| Close case | 6 | lack of cohesiveness and Planning | 0.2% |
| Put case back on the pallet and take another one | 15 | lack of cohesiveness and Planning | 0.4% |
| “Ok” label on the pallet | 8 | lack of cohesiveness and Planning | 0.2% |
| take the jack from outside | 65 | lack of cohesiveness and Planning | 1.9% |
| Film pallet | 135 | lack of cohesiveness and Planning | 4.0% |
| Put away | 190 | Inefficient Space Utilization | 4.0% |
| Bringing the pallet back in stock | 70 | lack of cohesiveness and Planning | 2.1% |
| Moving to the working area “For Specific Products” | 120 | Inefficient Space Utilization | 3.5% |
| Destruction wrong packages and other | 9 | Inefficient Space Utilization | 0.3% |
Disclaimer/Publisher’s Note: The statements, opinions and data contained in all publications are solely those of the individual author(s) and contributor(s) and not of MDPI and/or the editor(s). MDPI and/or the editor(s) disclaim responsibility for any injury to people or property resulting from any ideas, methods, instructions or products referred to in the content. |
© 2023 by the authors. Licensee MDPI, Basel, Switzerland. This article is an open access article distributed under the terms and conditions of the Creative Commons Attribution (CC BY) license (https://creativecommons.org/licenses/by/4.0/).
Share and Cite
Jum’a, L.; Basheer, M.E. Analysis of Warehouse Value-Added Services Using Pareto as a Quality Tool: A Case Study of Third-Party Logistics Service Provider. Adm. Sci. 2023, 13, 51. https://doi.org/10.3390/admsci13020051
Jum’a L, Basheer ME. Analysis of Warehouse Value-Added Services Using Pareto as a Quality Tool: A Case Study of Third-Party Logistics Service Provider. Administrative Sciences. 2023; 13(2):51. https://doi.org/10.3390/admsci13020051
Chicago/Turabian StyleJum’a, Luay, and Muath Esam Basheer. 2023. "Analysis of Warehouse Value-Added Services Using Pareto as a Quality Tool: A Case Study of Third-Party Logistics Service Provider" Administrative Sciences 13, no. 2: 51. https://doi.org/10.3390/admsci13020051