Article

Improving Strategic Planning: The Crucial Role of Enhancing Relationships between Management Levels

by
Daniel Mandel Gandrita
Department of Strategy, Universidade Europeia, 1500-210 Lisboa, Portugal
Adm. Sci. 2023, 13(10), 211; https://doi.org/10.3390/admsci13100211
Submission received: 9 June 2023 / Revised: 11 September 2023 / Accepted: 14 September 2023 / Published: 22 September 2023
(This article belongs to the Section Strategic Management)

Abstract

:
Having a fruitful relationship with all levels of management can increase the likelihood of better opportunities within and outside the organization. In some environments, it is known that participation in strategic planning creates better overall conditions for all partners, better conditions for retention, and above all, loyalty to talent. The very acceptance of contributions to this desideratum entails knowledge sharing and knowledge management. Our study examines how the relationship between management levels can disrupt strategic planning, particularly in contexts of resistance to change, situations that can affect talent retention and loyalty. Gathering the essential data to enhance the recommendations and contributions, the organization’s overall robustness takes shape through a combination of participant and nonparticipant observation, alongside interviews and questionnaires administered within the company. Initially, a qualitative approach was employed, involving interviews with a cohort of n = 14 top management executives. Subsequently, a qualitative method was employed, involving questionnaires distributed to a group of n = 204 individuals encompassing middle and lower management levels. Our conclusions, therefore, reflect the continuation of a research study. This paper contributes to the literature of work pursued by exploring how social actors and different stakeholders can make a difference in participating in strategic planning and how they can overcome, in counterpoint, the limitations of possibly not being able to participate in such strategic planning. Our contribution will also result in a critical understanding of the need for talent retention and loyalty, highlighting how retention efforts, especially the small nudges that are absolutely significant in terms of employee participation and even emotional pay purposes, are differentiators and can overcome, very concretely, resistance to change.

1. Introduction

Strategic planning has been advocated as a process of determining the major objectives, mission, strategies, and policies that govern allocating and acquiring resources to achieve organizational aims (Pearce et al. 1987; Glaister and Falshaw 1999). Although researchers (Steiner 1980; Mintzberg 1994; Bonn and Christodoulou 1996; Gallo et al. 2019; Posch and Cristian 2020) have seen its ups and downs over the years, the question of how strategic planning can be effective in improving organizational performance continues to affect every member of the organization (Langley and Klag 2014).
To accomplish this achievement, strategic planning faces several challenges that might be considered a failure factor with repercussions at various levels of the organization. For instance, to the best of our knowledge, these difficulties could create more prolonged separation in relationships between management levels, increasing the likelihood of one’s work becoming less meaningful, causing work pressure, and organizational impediments (Amabile 1997; Hober and Schaarschimt 2021).
Additionally, from this gap, a barrier could rise and bring a distorted perception, vague strategic priorities, and interpretation barriers (Del Val and Fuentes 2003), which could be negatively perceived as resistance to change affecting retainment and loyalty. Although the responsibilities of each level are well defined, we understand that top management must deal with the intense responsibility of making the company more competitive and sustainable for an extended period of time, middle managers must execute and put in place the strategy with the difficult task of aligning and orienting their coworkers, and the employees must be able to comply with the given orientations and maintain the operations running.
To establish guidelines for improvement and provide contributions to overcome challenges, it is required that the focal actor/actors know how to impact others and do not rely only on their single solutions but search for answers within the stakeholders (Muller et al. 2019). In other words, to display organizational purpose and significance, it is necessary to shorten the distance between actors and straighten relations to increase opportunities in the company while improving strategic planning.
In this paper, we examine how the relationship between management levels can disrupt strategic planning, particularly in contexts of resistance to change, and have a prominent effect on talent retention and loyalty. Assuming that the culture of distance from top management is a diversity attribute that has a direct effect on company performance (Dzung and Lo 2023) and that resistance to change is important in determining how resistance can have a significant influence on the success or failure of change efforts (Warrick 2022), we ask: How is the relationship between the levels of management could be improved in order to ensure participation in planning? What efforts are needed to increase participation and motivation within the organization? What can be made to have better retention and why is there a lack of it? What are the factors that contribute to resistance to change?
We examine these questions through a mixed-method setting. Our research will first introduce the literature on strategic planning to understand its relation with the actors and the impact on the organizational process. The literature also includes subjects related to resistance to change affecting retention and strategic planning.
Second, we empirically analyze the organizations’ three levels (top, middle, and low management) to seek patterns regarding their work and participation in the organization’s activities. This will be followed by interviews and questionnaires that will give the necessary information to answer our questions.
Third, the paper contributes to a critical understanding (Dempsey and Sanders 2010; Schabram and Maitlis 2017) of exploring how social actors and different stakeholders can make a difference in strategic planning participation based on our contributions and recommendations. Additionally, we explore a need for talent retention and loyalty to increase participation, as well as a need for knowledge participation and knowledge management.

2. Strategic Planning, Change, and Management Levels

2.1. Improvement and Disruption

Due to the growing demands from markets, governments, and citizens, several stakeholders were compelled to adopt new practices to improve their organizations (Bolivar et al. 2020). To put in place these adaptations and design initiatives, managers were required to establish a volume of processes, tasks, and procedures, including stakeholder involvement, making it necessary to formalize strategic planning as a guideline for achieving not only societal but organizational goals as well (Amrollahi and Rowlands 2018; Krier 2022; Weston 2020). The development and application of planning should be, as mentioned by Lee et al. (2017), high quality, providing a baseline for evaluating strategic performance that serves as a public relations document and a form of communication for external and internal audiences. Additionally, this systematic process contributes to the overall accountability of those involved in the organization, which helps them to make more transparent policies guided by clear goals and objectives (Guyadeen et al. 2023).
Although the planning process can be used in any organization, several studies have denoted differences between the public and private sectors. According to George (2017), there are more challenges in the public sector, which could lead to a more bureaucratic process with managers less committed to their organizations, making processes more difficult (Boyne et al. 2002; George et al. 2019) compared with the private sector where the impact is noticeable.
Nevertheless, the principle of planning requires continuous improvement to maintain stability with markets and stakeholders. According to Bossink and Blauw (2002), these refinements can be made through developing and implementing programs, identifying the improved areas, making a rigorous assessment of performance, understanding every stakeholder’s point of view, and reporting on the financial, social, and environmental levels. The idea of having better results is also supported by Hellberg and Fauskanger (2022) by stating that a strong involvement of people who work closely is necessary for the operations of the organization to be successful—in other words, a higher level of commitment.
However, despite planning benefits, managers have rarely integrated this tool into scenarios and land-change simulations due to many challenges that could cause disruption and instability to the company (Hersperger et al. 2018). Considering the integration of this method within management levels, Vecchiato (2012) observed that top management cases showed a more resilient and cautious foresight to prepare themselves for environmental shocks in moments of crisis, with some managers disconnecting from their teams and starting to lead into a more divergent thought (Ranucci and Wang 2022), thus creating disengagement and less receptiveness to focus on strategic future (Wang et al. 2022).
On the workforce side, if managers cannot include a competency plan in strategic planning, the possibility of uncertainty would be much higher, and as a result, workers will not be able to take care of themselves and will be unable to build resilient work–life scenarios (Claus 2019). This interference level can translate into inherent resilience, which can harm operations and performance in the short term and devastate supply chain efficiency, customer satisfaction, and service levels (Arji et al. 2023).

2.2. Resistance to Change and Retention

Resistance is defined as various forms of covert or open opposition to material actions; it is considered a vague term even though it has been deeply discussed and analyzed in different works in the literature (Mumby et al. 2017). The term is often understood to concern organizational control (Ezzamel et al. 2001; Paulsen 2015; Ybema and Horvers 2017), which is combined with several forms of resistance varying from open and concrete expressions such as protests or strikes to more subtle forms as non-complying with the routines, distancing in the shape of cynicism, humor, skepticism, gossip, and nostalgic talk (Fleming and Sewell 2002; Fleming and Spicer 2008).
It is also well acknowledged that this topic unveils dynamic, unrelenting, and unpredictable change becoming the norm and that resistance accompanies change or lack thereof. However, whatever form resistance takes, it is considered one of the primary reasons change efforts fail (Erwin and Garman 2010), and becoming skilled at effectively managing resistance has significant payoffs for companies while a lack of such skill can have noteworthy costs (Burnes 2015).
Resistance to change in management is considered a serious key topic in management (Del Val and Fuentes 2003) and determines the inability to change, with negative consequences on performance, which may be more noticeable in the case of centralization (Giannoccaro 2018). Some of the motives involving resistance to change can include the changes in the working format of employees, which could turn out to be either a nuisance or “bad apples”.
Personal reasons can also be a motive based on uncertainty about what that change will mean for the organization, conflict information, or lack of knowledge. As pointed out by Buckingham (2022) and Leinwand et al. (2022), there are two main causes for potential resistance in organizations’ internal (management philosophy, culture, structure, power, and control) and external (markets, changes in technology, customer expectations, competitor’s activities, government legislation, quality and standards, and economy) systems.
On the other side of the organizational coin, there is a significant value in employee loyalty, defined as a behavioral and attitudinal element (Cachón-Rodríguez et al. 2021) and retention as an intention to carry on within company activities (Book et al. 2019). Both these activities are relational variables of a long-term relationship whose absence leads to undesirable outcomes for those involved in the organization, such as decreased productivity, employee satisfaction, and profitability (Cachón-Rodríguez et al. 2022).

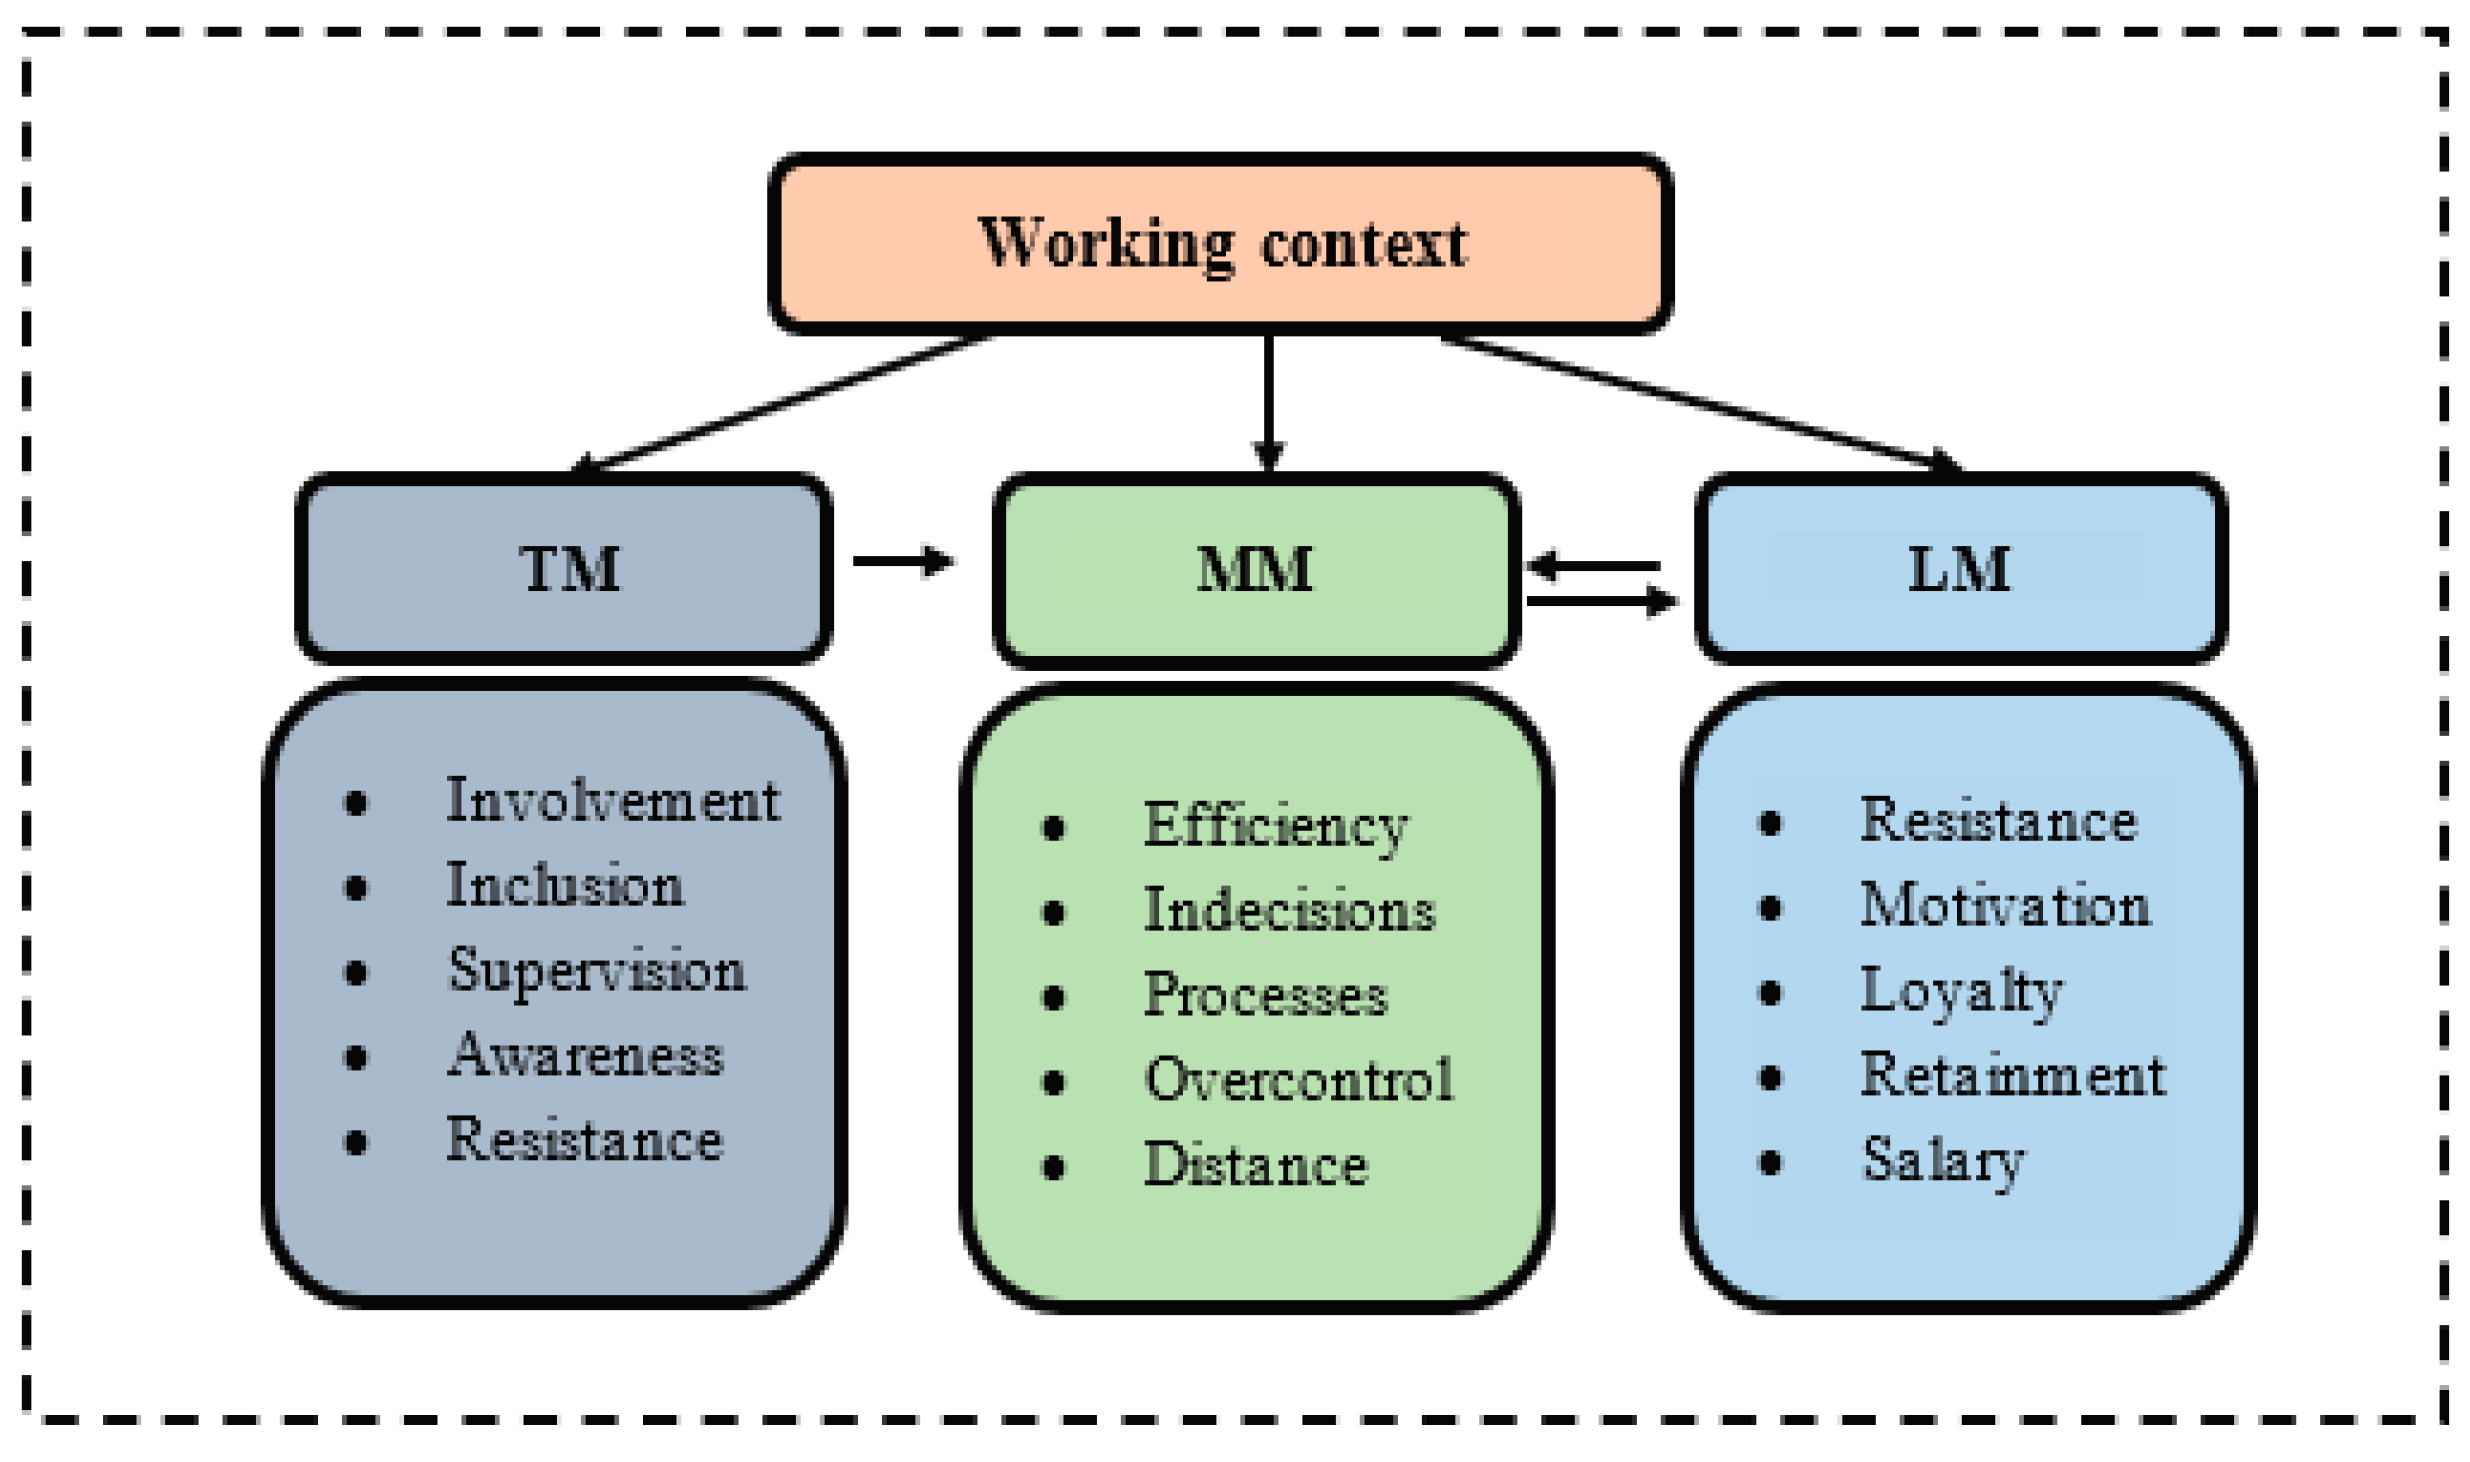
2.3. Management Levels

The concept of MR, in the words of Alsawafi et al. (2021), is generally defined as a management commitment toward improved qualities, which produces better and positive performance results (Tarí et al. 2017) for the organization. Each management level requires this effort; without these connections, it becomes difficult to attain any payback or return, especially for employee relations (Kim et al. 2012).
Considered one of the strongest and most difficult relations to attain, top management primarily deals with strategic choices regarding environmental activities (Shahab et al. 2018) and, as a result, performs a task that is nonroutine and invariably complex (Nadkarni and Barr 2008). Elbanna and Newman (2022) conceptualize top management support as an exclusively positive phenomenon, whose heterogeneity can be analyzed from two perspectives. First, the decision-making and the information processing highlight the positive impact of TMT in the company, assuming that teams have a broader knowledge and skills that eventually provide teams with several resources to be used in the construction and making of strategic decisions for the organization (Van Knippenberg and Schippers 2007).
The second shows the need for an identity perspective, assuming that the diversity among coworkers produces a categorization that will stimulate interpersonal clashes and compelling conflict among team members (Jehn et al. 1999). This theory is also supported by previous studies that conclude that homogeneous teams positively affect group performance rather than heterogenous (Murnighan and Conlon 1991).
Middle management is a part of the institutionalized structure in most companies but is also challenged by new organizational models (Diefenbach and Silince 2011; Farrell and Morris 2013; Foster et al. 2019). The term describes managers below top management but above operations in the hierarchy chain (Floyd et al. 2008). These levels of managers are executing any strategy and self-managing the implementation process (Foster et al. 2019). Although change can be directed from the top, it is still essential for employees to understand its intent and change, as well as its implications. Middle management needs to interpret strategy in an everyday context, communicate clearly, clarify their intentions to their subordinates, and identify the actions required to implement daily strategies (Ou et al. 2014). They have the task of providing a conduit for employees to implement and accept the change (Stensaker et al. 2008). Additionally, middle management needs to be driven through different mechanisms that shape the way organizational members think, namely, management control systems and the development of knowledge structures (Guo and Ren 2011), which shape how organization members think and act and also mobilize them (Rouhani and Ghazanfari 2012) toward some actions contributing to the minimization of the resistance to change (Hortovanyi et al. 2021).
Finally, lower management workers are an integral part of the success of the organization. These consist of employees that have attitudes, commitment, knowledge (Li et al. 2008), and skills that will be applied directly to and used for organizational growth. These frontline supervisors play a vital role in the effectiveness of the institutions. Conversely, there is compelling evidence that lower management is excluded from the management decision process resulting in decreased job performance and difficulties in retaining competent workers (Anzengruber et al. 2017).
This level of management typically has the most frequent or direct interaction with frontline employees (Chen and Bliese 2002), and due to their maintenance at the bottom of the pyramid, they are also less dependent on their behavioral capabilities (Chen and Bliese 2002). Furthermore, low-management employees tend to have a lesser impact on organizational performance when compared with other levels (Munjuri and Maina 2013).
Last, it is also established that employees are less involved in the development of strategy, and even if there is an opportunity to be in that position, top management is not sure that they have the strategic intent or strategic awareness to fully support the company’s strategy (Engberg et al. 2015).

3. Research Setting

To address both our research questions—“What is the impact of the relationship between management levels on strategic planning and how does this impact vary in contexts of resistance to change?” and “How does this impact affect talent retention and loyalty?”—we present a mixed methodology (qualitative and quantitative) study based on observations, interviews, and questionnaires from different management levels, with presented questions answered according to the experience of each participant. This is introduced as crucial research that can reveal some of the discrepancies and mechanisms in organizational strategic planning and relate to other less extreme cases within the same working area. The qualitative nature of our approach is reserved for top management due to their requests. This allows our interviewees (Muller et al. 2019) to describe their points regarding planning, working tasks, and future plans. The quantitative approach focuses on middle and lower management allowing us to gather more information on their views regarding planning, retention, and loyalty. This helps us to understand and envision the present and future of organizations.
Finally, the participants were instructed to provide genuine and truthful responses followed by their own experience and understanding of their line of work. There were no correct or incorrect answers, and their confidentiality was protected.

Empirical Setting and Context

According to the aim of our research and the present context, we came to understand that organizations need a new approach to solve some issues that may become a disruptive factor in their future competitiveness. With that in mind, researchers pointed out the (Figure 1) lack of involvement of top management in the overall operations and occasional noninclusion of middle/low management in strategic planning (Hermano and Martín-Cruz 2016; Elbanna and Newman 2022).
Middle management (Figure 1) must re-evaluate the processes and work on efficiency, not delaying decisions and procedures, and be open to welcoming others’ opinions. Sometimes overcontrol becomes harmful for the organization and social interactions (Balogun and Johnson 2004; Schuler et al. 2023), with the distance between workers to be more assertive causing conflict, and the non-use of instruments to evaluate performance.
Last, the lower management (Figure 1) is resistant to change in several situations, such as the need to introduce new patterns for workers to be more loyal to the organization and its supervisors and the motivation to increase the organization profile, identifying the talents within the organization and their needs (Lines et al. 2015).

4. Methods and Data Collection

4.1. Qualitative Approach

Semi-structured interviews and purposive method were used to recruit executives with expertise in the management area. Sampling and data collection continued until the ongoing analysis revealed data redundancy (Aceituno et al. 2022). The inclusion criteria were as follows: strategists, administrators, and board members. The question guide was developed based on previous experiences and the research literature review. Subsequently, all the disclosed information was carefully analyzed, and their answers were used to ask for further clarification.
The information (Table 1) was collected based on the participants’ perspectives, but only 14 had the required information for our research. In addition, face-to-face interviews were conducted to encourage participants to give relevant information and provide details. The Zoom platform (www.zoom.com, accessed on 24 May 2023), was also used for interviews. We obtained permissions to record video and audio from each participant using an informed digital consent form. In order to guarantee confidentiality, each participant was assigned an alpha-numeric code. Each interview lasted between 00:30 min and 00:53 min.
From our sociodemographic data, we could determine that 50% of the respondents were female and the remaining 50% were male. The number of respondents between 18 and 25 years old was 35.7%; 26 to 35 years old, 28.6%; 36 to 45 years old, 14.3%; and 46 to 55 years old, 21.4%. The countries with a higher percentage of participants were Portugal at 35.7%, followed by Poland and Greece at 14.3% each, and the remaining countries had a total of 35.7%. In terms of the organization type, private companies comprised 78.6% and public companies 21.4%, respectively. The company size was established according to the number of employees that work within the company—below 500 employees, 71.4%; between 501 and 999, 21.4%; and above 1000 workers, 7.2%. Finally, the working sector with the higher rate of respondents was technology at 50%, management at 35.5%, education at 7.1%, and food at 7.1%.

4.2. Results (Qualitative Data)

The participants talked about their experiences regarding the topic resulting in valuable data that helped to answer our questions. We observed and tried to unveil several sides of the interviewers that could help us to find answers with new information that can contribute to a higher inclusion of strategic planning and organizational growth. During our interviews, we posed the following questions:
(1)
What do you consider essential for the implementation of strategic planning?
To answer this question, an anonymous interviewee number four stated that “frequent feedback about the new implementation and the new results are crucial as long as with often training”. The anonymous interviewee number eleven added that strategic planning is “time spent by each employee on certain tasks “and “when creating a strategy employees need to focus on optimizing their workflow or even change their daily duties creating a place for them also developed themselves”.
(2)
In your opinion, what contributions can your employees make to improve strategic planning?
With this question, it was possible to reach a consensus by interviewees that they generalize the importance of sharing knowledge and expertise benefiting strategic planning with innovative ideas and that feedback on company metrics could increase customer satisfaction, productivity metrics, etc., without the fear of being punished. Interviewee number ten highlighted that employees must make the exercise of “how they see themselves working within the next years, what does he/she want to achieve in the company, and what should be changed in order to function better”. In insight, it is pointed out in what are the pain of the organization and what needs to be fixed, seeking that gap between competitors’. Additionally, the creation of a survey or individual talks can contribute to understanding ideas and opinions. Interviewee number thirteen also underlined the importance of employees knowing “how to handle customer leads to achieve the desire profit margin. And on those rare occasions when employees actually get to see the company financials”.
(3)
Describe a situation in which communication did not go as expected in the workplace. How do you think communication could have been more effective in that situation?
To address this question, interviewees three and four considered 360° review a great tool to assess communication and other issues. However, it can be considered misleading because “it can lead to false interpretations and false decisions”. A factor that can decrease effectiveness in the workplace, especially in international teams, can be language and cultural diversity, and at this stage, top managers must improve relations through “live meetings and team bonding activities to better understand each other”. The improvement of communication should be ensured “by all parties involved in the communication process, understand the same language, terms, and definitions. This can be achieved by providing clear and concise instructions, asking questions, and clarifying any ambiguities”. The tenth interviewee also added that it is “important to establish regular check-ins or status updates to ensure all the involved are on the same page”. Last, the interviewer number thirteen stated that there were some points that should be addressed for future improvement: “Delayed communication from leadership, forgotten hybrid or remote employees, lack of accountability after the fact, confusion amid change, a lack of knowing leads to negativity, employee mistrust, absenteeism, and low morale, and bad interpersonal relationship”.
(4)
Describe your relationship with your peers, department, directors, and other employees.
Top managers understand that they do not have all the answers to all situations in the organization and that it is necessary to have a closer relationship with their peers, meaning that (interviewee number twelve), to have better relations, the focus “should be on building trust, being a good listener, aligning goals and priorities, seeking feedback, being empathetic, and supportive”.
(5)
How can you create stronger relationships with the company’s employees?
A consensus has been reached that relationships need to be better for organizational goals. However, it is also important to build a stronger relationship with employees to create a “positive impact on their job, satisfaction, motivation, and overall productivity” (interviewees number nine/twelve). Sometimes managers should ask about employees’ hobbies, interests, and families. This will create a closer environment where “employees feel comfortable approaching with questions that concern them”. The thirteen interviewees also underlined some elements that can be considered valuable: “bond of trust, merge the gap with communication, appreciate your employees, be friendly to your employees, respect them, implement autonomy, show value, and one-to-one interactions” interviewee number fourteen).
(6)
Which areas most need your attention at the strategic planning level? In your experience what can be done differently to improve the mentioned areas?
To some executives, the areas that need more attention are human resources, which can be enhanced through communication between employees, technology, implementing “good techniques of programming software and guiding through good and agile methodologies” (second interviewee), and the sales department, which needs to be more goal-oriented and share those objectives with the remaining organizational colleagues for everybody to understand, be aligned, and have a common goal (third interviewee). The improvement should be made during brainstorming with employees and peers to have a “clear understanding of the company priorities and a roadmap that identifies the technology initiatives that will support those priorities” and the “hiring and retaining top talent as a critical factor to the success” (interviewee ten). For the sales department, interviewee eleven stated the importance of creating a playbook with guidelines, which every member could consult to obtain help with the daily challenges. This could be upgraded by showing the benefits of the plan, tailoring the pitch to the audience, communicating the progress, leveraging feedback, and inviting others’ ideas (interviewee thirteen).
(7)
From your perspective, what disruptions can there be in strategic planning? What are the solutions to these changes?
Regarding this question, the first interviewee thought that the biggest disruption could be the “changes in the leadership, staffing, or resources availability”. The third interviewer stated that the main disruption is that the lower management level “does not understand the importance of a common understanding of the goal and the scope of the organizations” and that, as a solution, it could be necessary to deploy “external consultants with prestige and authority that may help to initiate the right improvements and changes”. However, the tenth interviewee considered the common disruptions in strategic planning to be market changes, technological advancements, competitors, economic shifts, and consumer behavior. A solution for these interferences is a revision and revisit of strategic planning and the creation of contingency plans to address these situations. Other critical disruptions (interviewee eleven) are related to the loss of crucial employees, motivation, and resources. This respondent considered that although some companies lose potential employees, there is immense talent in the market and uncovered knowledge that could contribute to the organization. Last, the importance of having faster decision-making was brought to our attention. Interviewee thirteen mentioned that with “innovation at the forefront of all. All too often, this translates into strategic planning that taken weeks to finesse becoming obsolete soon after their inception” and “if teams are slow to adopt the plan, it will become outdated and irrelevant to everyday process and priorities”.
(8)
In your experience, what solutions do you consider viable to overcome resistance to change?
To overcome the resistance to change, the first and main topic among all interviewees is that communication is the foundation of surpassing that resistance. In that segment, the interviewee added that employees needed to see the reasons for the change, the expected benefits, and how that change would be implemented. The fourth interviewee specified the need to talk more often to senior management and to add visual results for any small change. The openness to inputs was also a variable that needed to be considered, and interviewee ten added that it was necessary to search for feedback and suggestions for employees to feel more invested and to reduce their resistance. This was supported by interviewee thirteen who suggested including “support, agreement, co-opting, and coercion”.
(9)
What factors do you consider indispensable for talent retention?
Competitive compensation is considered indispensable for talent retention, which “organizations need to offer salaries and benefits that are competitive with other organizations in the industry” (first interviewee). Other factors included a good track record, knowledge, being a motivated employee, proven onboarding and training to coworkers, mentoring, and career development programs, remote work, work–life balance, relevant benefits, and an enjoyable workplace.
(10)
Describe how important is the integration of your team for you and how this can contribute to the company’s strategic planning.
Integration for top management is a synonym of “productivity, innovation, and creativity” (first interviewee). Another part is cohesion and collaboration in which it is possible “to leverage each other’s strengths and compensate for each other weaknesses” and also be able to “value employee’s ideas and opinions” (tenth interviewee). This can be achieved by “fostering an environment that values diversity and inclusivity, encourages open communication and collaboration, and provides opportunities for team building and skill development”.
(11)
What benefits can be made available to employees to increase their participation in the organization?
Regarding benefits, managers concluded that to increase participation in the organization, employees should have a better work–life balance, new positions with new challenges, performance rewards, on-the-job training, mentoring, workshops, and courses. Additionally, interviewee thirteen talked about three types that could help employees engage in their work; cognitive, emotional, and physical engagement.

5. Quantitative Approach

The quantitative approach was used to analyze the middle and lower management. We started our questionnaire with a broad and brief introduction to the study in which we gave some guidelines stating to each respondent that there were no right or wrong answers and that their confidentiality was ensured. The questionnaires were created through Google online survey forms and were written in a such way that the respondents could read and react to the questions (Razek et al. 2008). The link was shared on several social networks, such as Facebook, LinkedIn, via email, WhatsApp, and some interviewees were called to answer in person.
This survey consisted of two parts. The first part contained the sociodemographic features of each inquiry with responses to our sociodemographic questions (Table 2), including gender, age, academic position, management level, and country. The second part was the analysis of the results using instruments to analyze the reliability (with Cronbach’s alpha), assess and find patterns (using the exploratory factor analysis (EFA)) and, finally, measure and confirm the relationships between the suggested patterns (using the confirmatory factorial analysis (CFA)).
To help the validation of our questions, a Likert scale was presented to the inquiries with a five-point response scale (1—totally disagree; 2—disagree; 3—neither agree nor disagree; 4—agree; 5—totally agree).
From the initial sample, only 204 within the scope were considered eligible for our survey. With that in mind, we could determine that 46.57% were female, 51.9% were male, and 1.47% other (nonbinary). The participants were all above the legal age of working. The higher percentage was between the ages of 18–25 with 34.8%; 26–35 years old, 38.73%; 36–45 years old, 16.18%; 46–55 years old, 7.84%; the remaining ages (56–65 years old), 1.96%; and over 65 years old, 0.49%. Concerning school qualifications, some in our sample had basic education, at 0.98%; middle school, 23.53%; bachelor’s degree, 35.78%; master’s degree, 36.76%, Ph.D., 1.96%; and other qualifications, 0.98%. As previously mentioned, the management levels studied with this method (quantitative) are the middle (37.25%) and lower management (62.75%). Last, countries with a higher rate are Portugal at 25.49%, Poland at 22.55%, and the United Kingdom at 21.57%, and the remaining with small percentages make a total of 30.39%.

5.1. Data Procedure

The scales and the questions were written in two languages (English and Portuguese) and revised by two persons with knowledge in areas of strategic planning and human behavior. After we finalized this process, the survey was sent to random people to obtain their feedback regarding the perceptibility and understanding of the questions. Our choice of method (quantitative) is related to the fact that some of the workers felt uncomfortable being recognized as the ones who answered a questionnaire related to the organization.
To assess/test, measure, evaluate, and validate the constructs, we used JASP software (Jeffreys´s Amazing Statistics Program, version 0.7.1). We started by assessing the consistency of the responses using Cronbach´s alpha. Then, to discover patterns/relationships and reduce dimensions, we applied a principal component analysis (PCA). Given that some dimensions were not reflected in any of the components and in order to improve the different evaluation measures of the analysis, we removed these dimensions and obtained four principal components with measures that demonstrated high robustness in the application of the method.
Cronbach’s alpha was applied in order to assess the consistency of the components obtained. Finally, a confirmatory analysis was applied to validate and measure the relationships between components/factors and the weights that dimensions had in the different factors, finishing with a multigroup analysis in order to identify differences between lower and middle management.

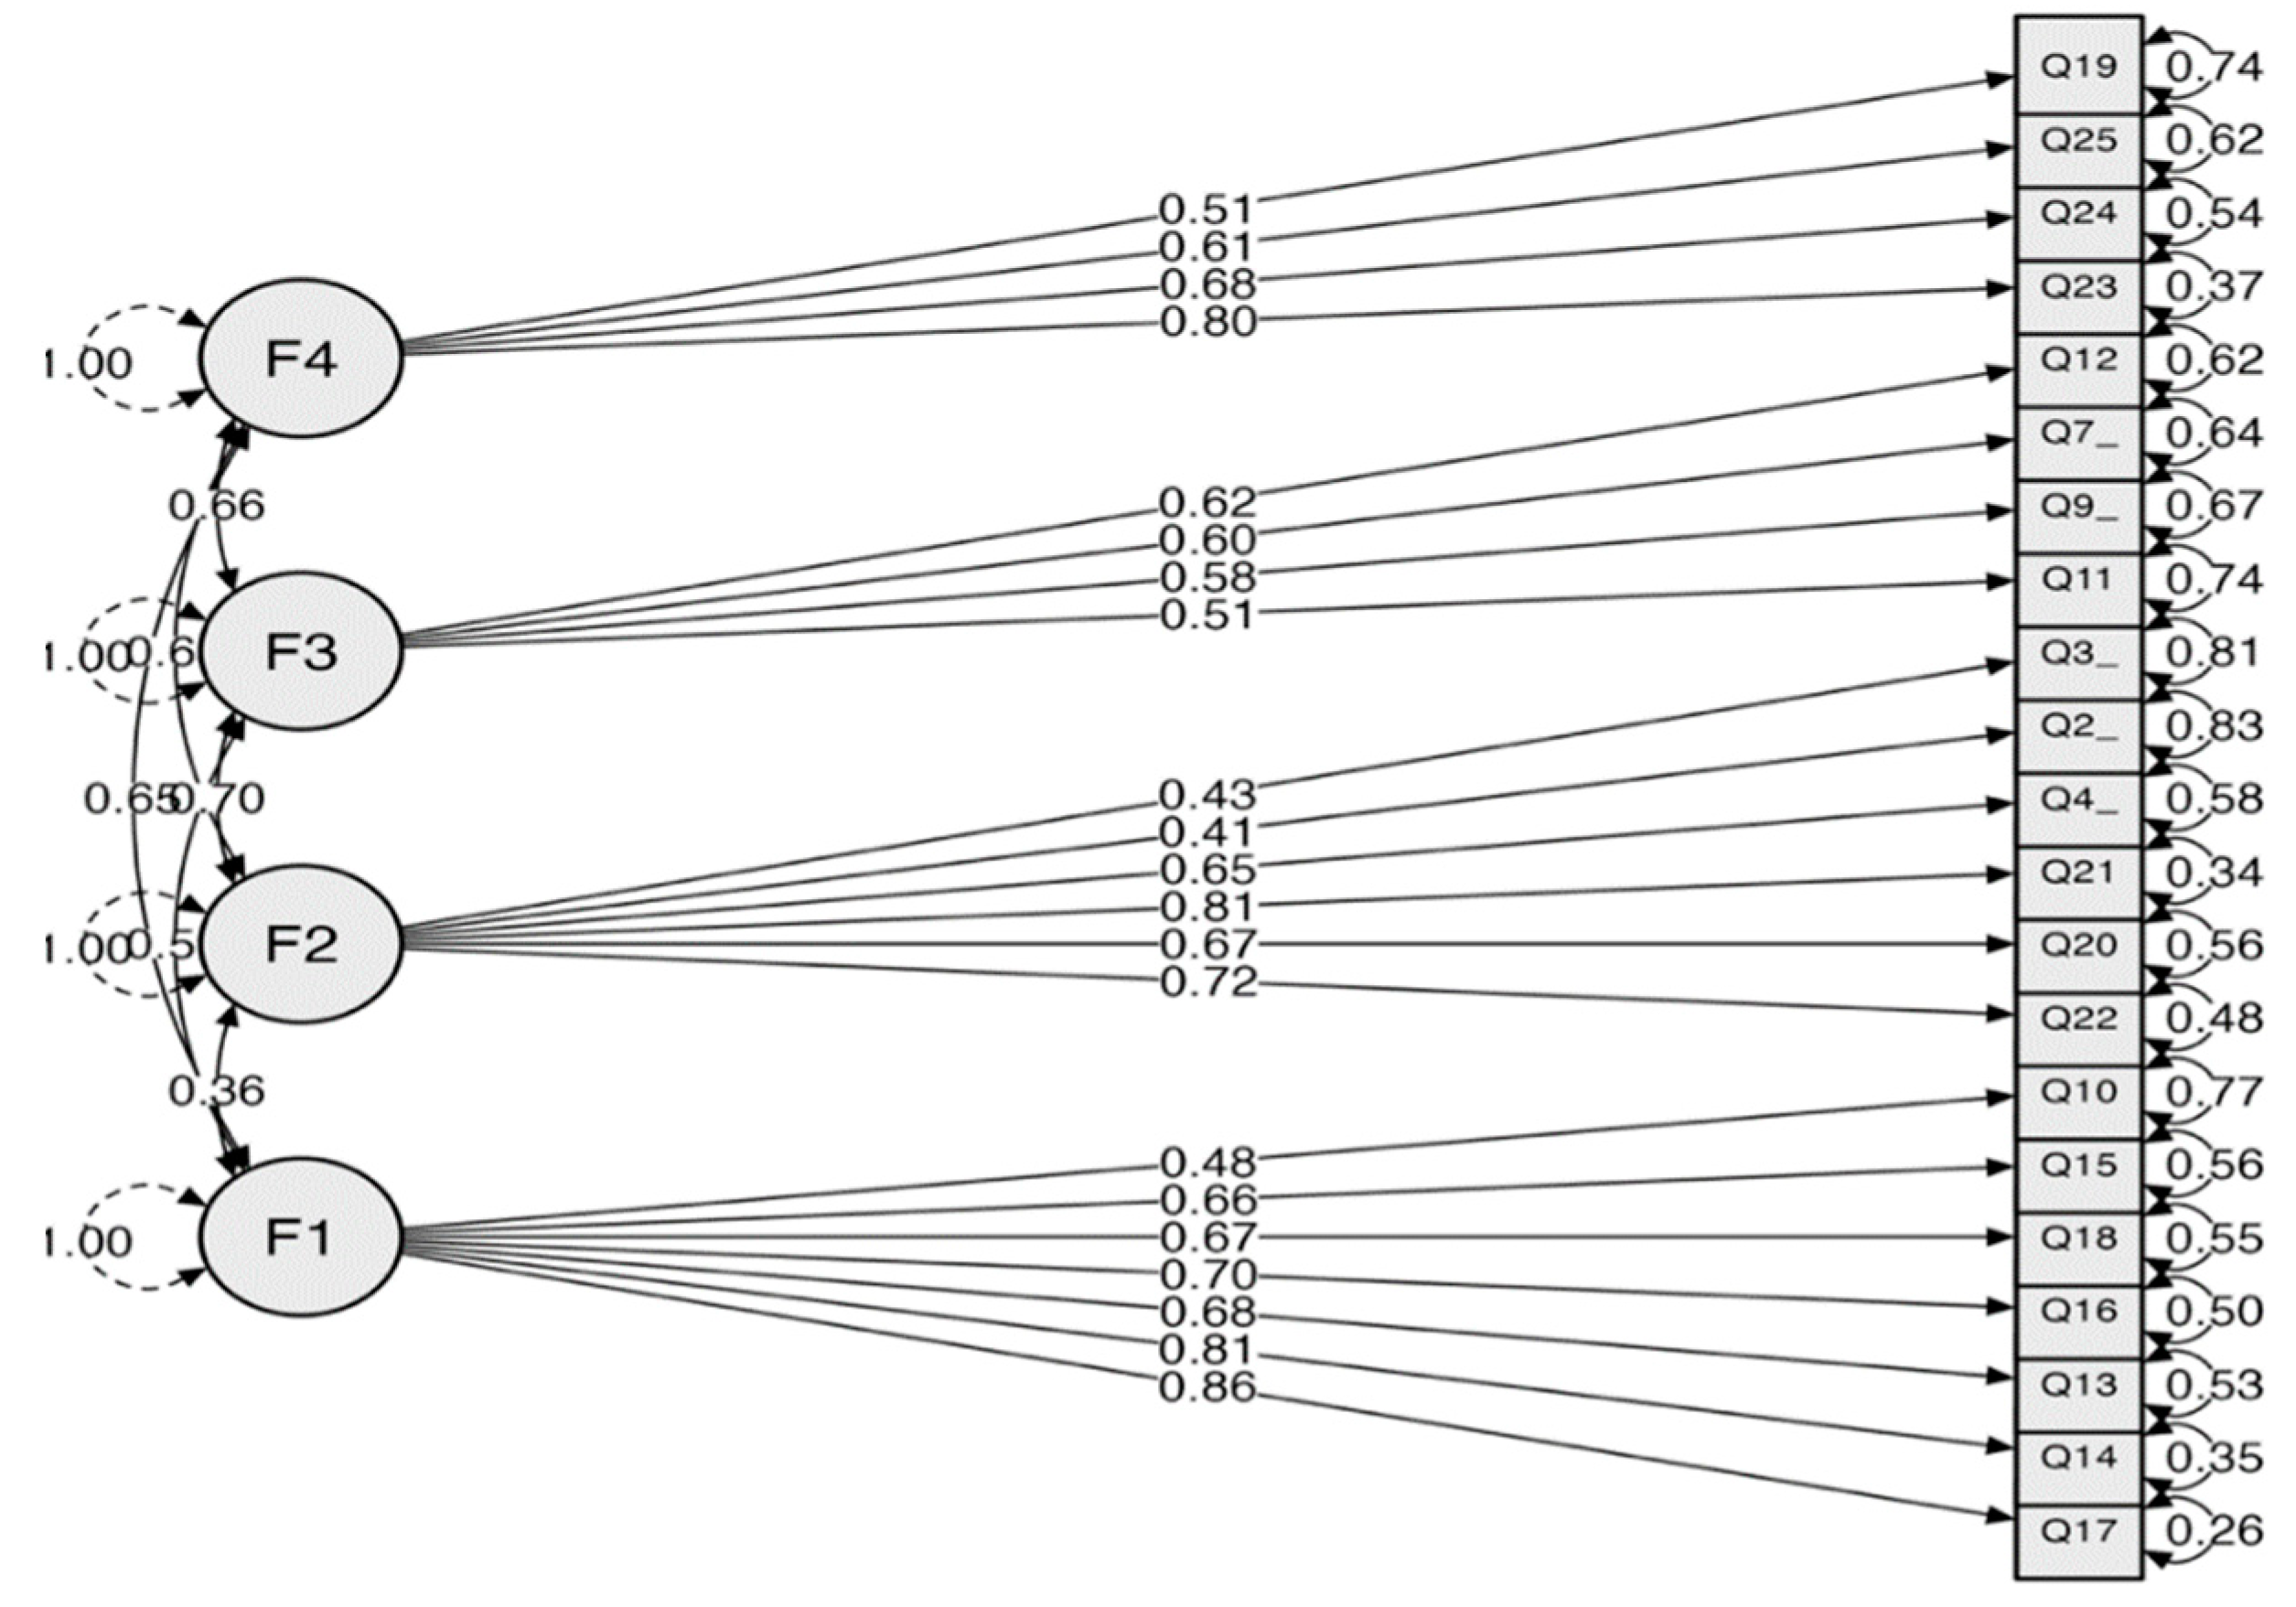
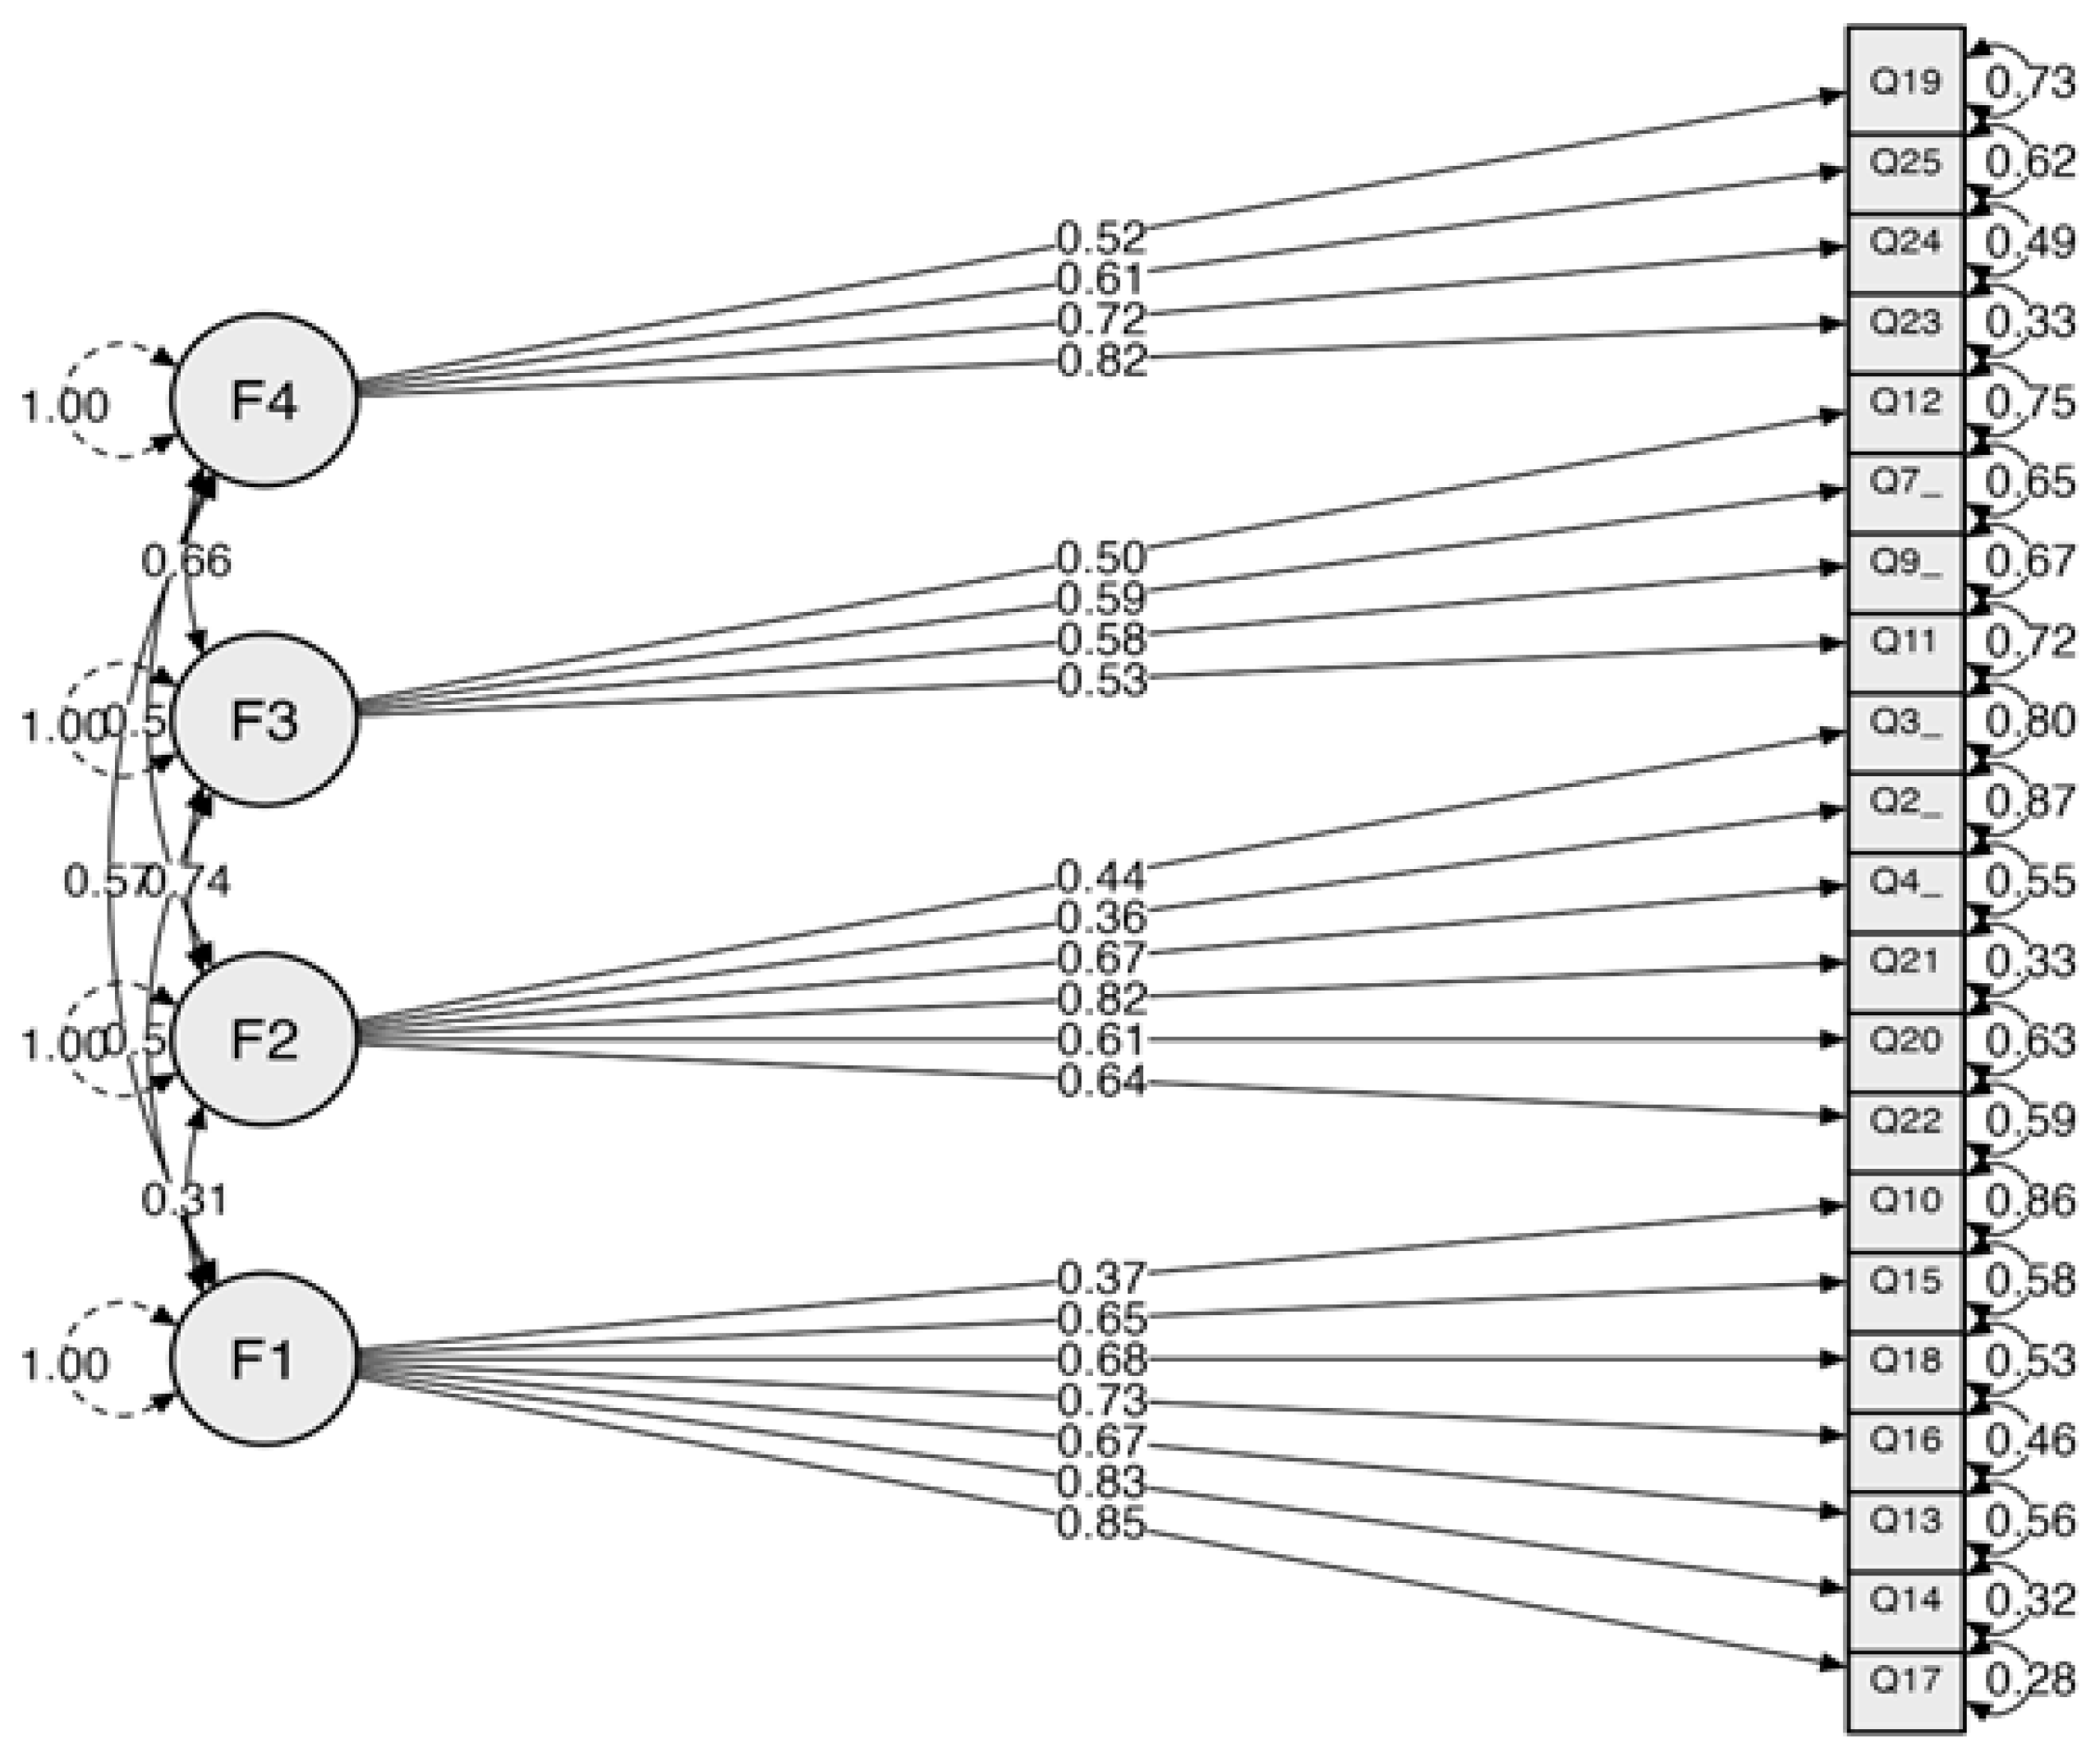
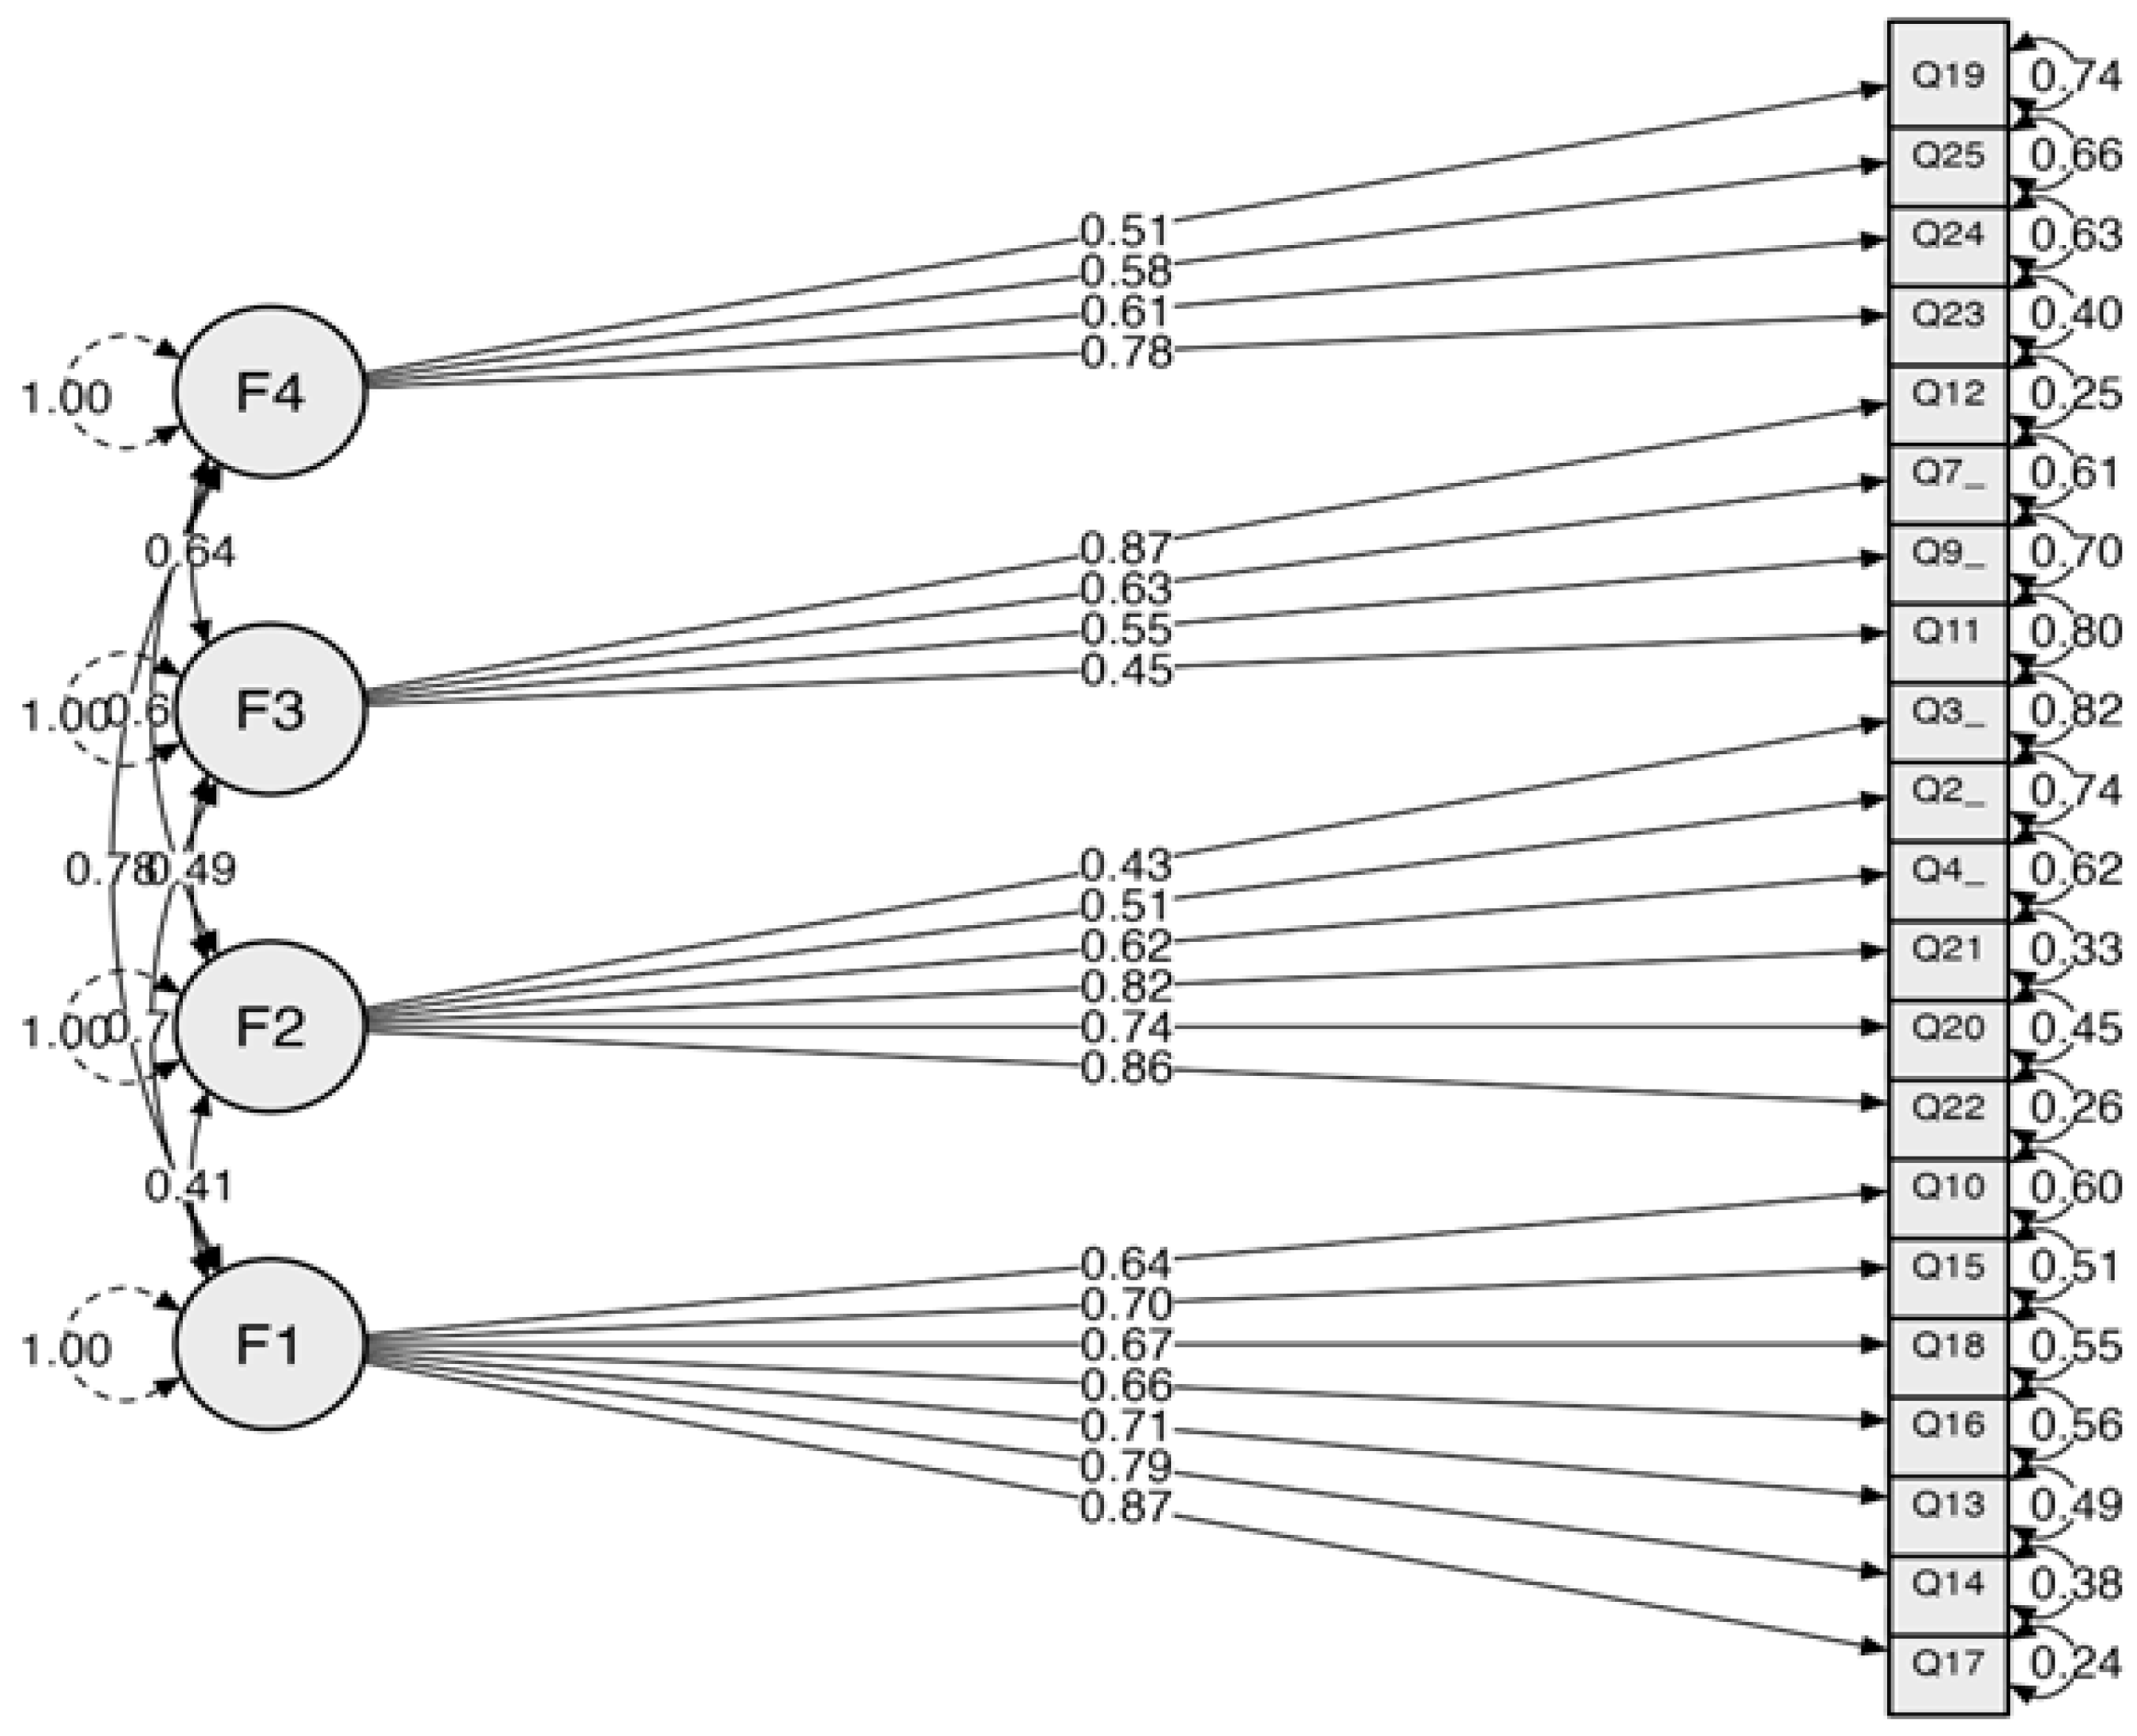
5.2. Results (Quantitative Data)

In this section, we present the main results for the reader. In relation to the internal consistency, as measured by Cronbach’s alpha (Cronbach 1951), we obtained values that were at least considered acceptable. The work of Nunnally (1994) provided that the lower cutoff (i.e., 0.70) was appropriate in the early stages of research (i.e., exploratory), as is the case. The values obtained, total or partial values, are, rounded off, equal or greater than 0.70 (Cortina 1993).
In order to reduce the dimension and to obtain a pattern of association of items, a principal component analysis (exploratory data analysis) was applied. In the first analysis, and after Varimax rotation, we found that 4 of the 25 items were not reflected in any of the 4 components obtained (using the retention criterion of the items with eigenvalue >1 and loadings greater than or equal to 0.5 (Loehlin 2004; Bryant and Yarnold 1995) and Varimax rotation) (Table 3). Given the type of data under analysis, we obtained measures of adequacy that can be considered good, as shown in Table 3 and Table 4 (sampling adequacy test, Kaiser-Meyer-Olkin (KMO) = 0.885, sphericity test, Bartlett´s test with χ2(210) = 1638.957; Sig. < 0.001 and, proportion of cumulative variance equal 55.2%).
Table 4 presents the analysis of principal components, which is divided into two parts: first, an unrotated solution composed of eigenvalue, proportion variance, and cumulative analysis; then, a rotated solution with SumSq. loadings, proportion variance, and cumulative analysis.
A confirmatory analysis was performed to investigate the four factors that confirm the goodness of the model fit (Table 5). In this study, the model was assessed by chi-square goodness of fit statistics (p < 0.001, df = 183), and we encountered satisfactory results (CFI = 0.932, RMSEA = 0.065, 95% confidence interval, χ2 = 285.166) (Marôco 2021).
Based on the eigenvalues of the four factors, the value presented in the simulated model was lower than the value in the real model. By performing a CFA, we could evaluate this new model and obtain the following results. These were supported by values determined on the chi-square (p ≤ 0.001, df = 132, CFI = 0.899, RMSEA = 0.052, 90% confidence interval, χ2 = 524.821). The most important goodness-of-fit indices, presented in Table 5 below and in bold, generally indicate a good model fit (Marôco 2021).
Thus, the four-dimensional model fitted to the sample shows reasonable/good quality of fit. Based on Table 6, we can see that the correlations with 95% confidence interval/scores between factors, between items, and between factors and items are statistically significant.
With the results presented above, we can confirm the four factors obtained in the exploratory analysis initially presented.
Figure 2 diagrammatically presents the CFA global model with unstandardized estimates. Based on the results presented, it was possible to understand the ranges associated with each one of the four factors. Sustainable inclusion (F4, see Table 7), expressed the importance of certain practices that contribute to company success. These can be achieved by introducing a belief system that involves everyone in the organization’s strategic planning, increasing competitiveness and social inclusion, and helps put people first in the development process and promote a collaborative approach to decision-making. The results also indicated the importance of having good interaction with all employees to achieve higher effectiveness compared with a distant relationship with no attachment between different hierarchy levels, emphasizing communication and a positive workplace culture. To increase strategic planning proficiency, it is necessary to adapt to new settings and promote sustainability inside the organizations. These changes can be achieved using environmentally friendly messages and behaviors from the top management, contributing to retention and the intent to apply planning. Additionally, it is necessary for everybody within the organization to continue receiving training and education on environmentally friendly actions to improve company results and environmental awareness. This action highlights the importance of ongoing learning and development in the workplace.
Regarding employee motivation (F3, see Table 7), we could understand that employees who are happy with their career paths are likely to stay in the organization, reducing redundancies, which can lead to reduced turnover and associated costs for the company. Our sample (74.6%) also indicates that individuals with academic achievements have already defined their career paths and are more committed to their jobs, better managing their perspectives and expectations. For most teams, the satisfaction of achieving joint goals is a motivating factor. However, when new positions or activities require specific training, they feel that the company needs to provide training to improve job performance. This reinforcement and encouragement due to the development of competencies can further enhance employee motivation and increase performance.
In organizational development (F2, see Table 7), strategic planning is crucial, and it should involve two-way communication with top management for updating strategies. When guidelines are effectively transmitted, workers can align their efforts toward common goals and work efficiently. The application should contain a streamline of procedures that increase efficiency and reduce delays. In addition, the integration of diverse perspectives enhances the comprehension and effectiveness of the organization by tapping into the creativity and knowledge of a diverse workforce, generating innovative solutions that cater to different needs and preferences. Collaboration is also an important aspect of planning. By involving everyone with ideas, it is possible to harness collective intelligence and create a sense of ownership and commitment toward achieving shared goals. Finally, it is necessary to consider the impact of everyone’s actions on the environment and take steps toward sustainable development. This measure can not only attract and retain environmentally conscious employees but also enhance the organization’s reputation and contribute to long-term success. The aim is to create a model that encompasses happiness, productivity, and talent retention.
Employee engagement (F1, see Table 7), is a critical component of a successful organization and requires creating an environment that fosters trust, respect, and open communication. Encouraging employees to share their knowledge and expertise will make them feel valued for their contributions and empower them to share their ideas—in other words, the higher the contribution, the more they are invested in the organization’s success. Employees need to feel appreciated for the hard work that they put in because it is essential for motivation and job satisfaction. This acknowledgment can come in several ways, including recognition from management, opportunities to grow and develop, and a positive work environment. Furthermore, when positive feedback comes from a close person in the workplace, the probability of acceptance and investment in the organization is higher. Employees also need to have a proactive attitude by contributing to a culture of continuous learning and development, thus increasing job satisfaction. As their willingness to get training increases, the interest of their leaders in their ability to acquire new responsibilities, and invest time and money into their growth also increases. As a reflection of the effort placed into a more effective organization, there is a higher probability for top management to let employees participate in strategic planning and contribute to reshaping the organization’s future direction.
Table 7 represents the global model factors and indicators.
After reviewing the overall results obtained in the global model, we conducted a multigroup analysis (χ2(366) = 524.821, p-value < 0.001, CFI = 0.932, RMSEA = 0.065) approach to gain a deeper understanding of the ranges that are applied to each level of management (Figure 3 and Figure 4). This approach allowed us to identify specific areas where improvements can be made at different levels of the organization.
This can lead to more targeted and effective solutions, resulting in better outcomes for the organization as a whole. To achieve our desired outcomes, we utilize a model fit and a coefficient of determination. These tools enable us to draw the necessary conclusions.
Thus, from the difference of the chi-square values of the model with equal covariances and the chi-square with free covariances, approximately zero, we conclude that for the invariance of the covariances between factors in the two groups, the difference between the CFI values is −0.033, lower than −0.01 (Marôco 2021), therefore demonstrating the model invariance, though there are some absolute differences between the coefficients of determination in the two groups, as shown in bold in Table 8.
By analyzing the data in this manner, we can tailor our strategies and interventions to address the unique needs and challenges of each management level.
Based on the model fit for multigroup analysis, we proceed to a coefficient of determination, the maximum value (R2 = 1) of 0.763 (Q17) in lower management and the smallest value of 0.181 (Q3). Regarding middle management, the high value is 0.723, attributed to Q17, and the lowest is 0.126, attributed to Q2.
Considering our global model (Figure 2) results during the previous analysis, we could determine the coefficient of determination (R2) in which it was possible to predict the outcomes of our research. Due to the proximity of some results in R2 (Table 9), we only worked with the higher values of each variable.
In that sense, middle management exhibits the strongest adherence to factor four. It is suggested that the inclusion of several members in strategic planning can increase competitiveness, creating more opportunities for everyone. However, that is only possible while fostering positive interactions among all members of the organization, leading to greater effectiveness when compared with managers who nurture a more distant relationship. As the world evolves, there is the need to adapt planning to new adventures, making it more refined and closer to reality. The results also suggest that environmental sustainability has become a needed topic and its guidelines should be included in strategic planning, which contributes to the protection of the brand, higher indices of retention, and long-term profitability. Additionally, middle managers also believe that to attract the new generation, organizations should outline more environmentally friendly messages to preserve organizational sustainability and become an example of top management behavior, with the intention of applying strategic planning.
In factor three, the perks (payment, work–life balance, etc.), are a necessary condition to retain middle managers in the organization. It was also noticed that most of the people in our sample had higher education degrees, creating more opportunities in the marketplace and making these managers happier with their career paths. For lower management, specific training is considered necessary to increase performance —the organization needs to be aware and provide conditions for employees to have more tools to perform their work and evolve within the organization. As a result, this will increase performance and satisfaction while working as a team, help them achieve their professional goals, and change their mindset for personal achievement.
Regarding factor two, middle management agrees on the significance of strategic planning and that it should be continuously communicated to the superiors for strategy updates. This should be integrated with diverse perspectives to enhance an understanding of what is happening in the organization and how to make it more effective; internal stakeholders need to understand that it is joint work, which needs everyone’s collaboration leading to company improvement and better results. Additionally, lower management considers that the guidelines of planning should be communicated to employees, so they can understand what is required to improve the organization. In order to do more effective work and increase proficiency, it is required that processes become less bureaucratic so that employees can have more initiative, more innovation, and free their creative side.
In factor one, middle management thinks that it is necessary to encourage employees to share their knowledge and expertise, adding to strategic planning, thus resulting in a more competitive force. During this research, it was possible to understand that most of middle managers are willing to work hard for the organization and their internal goals. However, these managers need to sense that there is a reward for their efforts or initiatives as this operates as a motivator for each goal achieved and, as a result, the effort to learn new skills and not constantly look for a new job.
To promote employee growth and career advancement, it is essential for lower-level management workers to have opportunities to advance within the organization. Middle managers can facilitate this by actively listening to their colleagues, measuring employee performance so that they can allocate them to the right places, valuing feedback, and acting as active listeners. Additionally, the top management level should have the time to meet with their teams, see the progress of their employees, and encourage them to acquire new skills and knowledge by offering training opportunities, making new tools available, and considering the contributions provided for strategic planning.

6. Discussion and Conclusions

To help organizations unlock success in the use of strategic planning, we focus our research on the three management levels, particularly in the context of resistance to change and situations that can affect talent retention and loyalty. In that regard, the key findings of our study are discussed as follows. First, the findings from top management indicate that employees should provide frequent feedback on ongoing development and implementation of programs, identifying the improved areas, making a rigorous assessment of performance, understanding the viewpoint of every stakeholder, and reporting on the financial, social, and environmental level (Bossink and Blauw 2002).
This feedback should be accompanied by continuous training to facilitate the development of new workflow strategies and provide opportunities for personal development. To reinforce professionalism, it is necessary that lower management engage in mental exercises that explore future possibilities, workplace changes, and accomplishments in order to understand how they can contribute to the organization. However, for this exercise to be effective, employees sometimes need to be briefed and enlightened about financials and overall status.
A 360° assessment can serve as a tool to enable communication, eliminating false interpretations or decisions, particularly in international teams where language and cultural diversity can be challenging. In today’s digital world, each department bears the responsibility to evolve and align its understanding with the company priorities and a roadmap that identifies the technology initiatives that will support those priorities.
Throughout our research, we observed that there was a consensus among managers that the most significant disruptions arise in leadership changes, staffing, or resource availability. These can result in long delays in strategic planning or render plans obsolete soon after their inception. If teams are slow to adopt the plan, it will become outdated and irrelevant to everyday processes and priorities.
Resistance to change in is considered a serious key topic in management (Del Val and Fuentes 2003), especially for top management. To overcome this resistance, managers believe it is crucial to focus on communication as a foundation for bridging the gap. Additional solutions include helping employees understand the reasons for the change, the expected benefits, and the implemented process. Senior employees can be consulted, and visual aids can be provided to demonstrate the results or incremental changes over time. Furthermore, seeking the opinions, knowledge, and expertise of workers in a particular situation can foster an environment that values diversity and inclusivity, encourages open communication and collaboration, and provides opportunities for team building and skill development.
As mentioned by Cachón-Rodríguez et al. (2021) and Book et al. (2019), there is a significant value in employee loyalty and retention as an intention to carry on company activities. Both levels of management (top and middle management) agree that by offering better salaries and participation in the organization employees should have a better work–life balance, new positions with new challenges, performance rewards, on-the-job training, mentoring, workshops, and courses. But, to achieve these benefits, it is required for these employees to have a good track record, be knowledgeable and motivated, help in the development of new programs, and be open to continuous training/education for more opportunities internally.
For middle managers, strategic planning also needs to have a sustainable component, which helps them create more awareness and new policies attracting new generational members that will assume a key role in transformations and are more likely to see the organization succeed.
The reduction of bureaucratization of processes is an important factor in eliminating the passivity of employees, scenarios of resistance to change (George 2017), creating practical strategies, and removing barriers to the fulfillment of activities. Considering this point of view, executives need to see a higher state of involvement of the remaining levels before starting to accept any advice, changes, or updates on planning.
When examining the perspectives and needs of respondents aged 18–25 (Table 2), it becomes evident that they possess distinct viewpoints and expectations when pursuing employment opportunities. Consequently, organizations are compelled to adopt a distinct set of regulations, along with innovative benefits and conditions, in order to enhance their appeal to this demographic. However, it is important to highlight that individuals in this age group are more concerned about these matters. They desire greater engagement with the organization and are capable of providing valuable insights regarding employability and strategies for improvement.
On the other hand, individuals within the age bracket of 26–35 (Table 2) have already established themselves within the labor market. Nevertheless, it remains imperative for them to dynamically adjust to evolving requirements and proactively enhance their skill sets. This adaptation is crucial for maintaining competitiveness and ensuring their continued effectiveness in their current roles.
The educational backgrounds of these individuals serve as a pivotal turning point and a significant factor that plays a pivotal role in facilitating training and development for internal stakeholders. This factor significantly contributes to fostering a deeper comprehension of the field and subsequently enhances the accumulation of valuable experience within the organization.
In conclusion, this study also highlights the importance of incorporating factors like training, certification, communication, and sustainability into strategic planning. By focusing on employee engagement (F1), organizational development (F2), employee motivation (F3), and sustainable inclusion (F4), management can foster a positive work environment and enhance overall organizational performance.
Furthermore, internal stakeholders need to recognize the impact of their actions on the organization. It becomes imperative for them to proactively identify certain parameters, address the issues that could create new gaps or pitfalls, and reduce resistance to learning/training. By embracing these approaches, it is possible to be one step closer to the success of the organization and drive positive outcomes.

7. Recommendations

The purpose of these recommendations is to provide some guidelines to organization members and promote a standard blueprint of what should be introduced in the organization. Under no circumstance should these guidelines be seen as an (Bjorck et al. 2017) obligation or a requirement for managers or coworkers.
On-job formation—The training and development of professionals must be inserted within the organization’s culture, although sometimes it is necessary to go outside the organization and bring in new knowledge. Nevertheless, organization professionals need to be certified in their designated area to provide training to coworkers/colleagues. Reflecting this point in strategic planning and gradually associating it with the annual training plan will reduce costs, giving the opportunity to coworkers ask questions and understand possible transformations in the organization, motivating teamwork and exchange of opinions.
Programs for growth and performance evaluation—The objective of these programs is to enhance knowledge sharing and foster experiential learning among employees, leading to the establishment of effective evaluation methods. Through this exercise, employees will undergo tests and face situations directly related to their work in order to assess their responses and identify areas for improvement. Gamification tools will facilitate the learning process for top, middle, and lower management, enabling them to exchange roles and experiences, thus fostering a two-way learning experience. This approach allows each party to gain a comprehensive understanding of the challenges and perspectives of the other.
Benefits package—Nowadays, organizations must design a comprehensive benefits package that increases motivation, retention, and loyalty. Based on our data, employees prioritize certain elements in their interests. First, they desire salary revisions as a reward for their performance. Additionally, they value the emotional salary that caters to their personal needs. Furthermore, they seek opportunities to actively participate in the organization, particularly those who consistently make extra efforts. They also appreciate access to a variety of workshops that promote mentoring and skill development for all employees. To ensure the realization of these benefits, candidates should possess a solid track record, relevant expertise, motivation, and a willingness to contribute to the development of new programs.
Sustainability—The use of sustainable certification to provide a trustworthy work environment demonstrates the organization’s commitment to sustainability. By obtaining this certification from a recognized third party, it is possible to validate their sustainability claim and build trust with consumers, investors, and other stakeholders. Additionally, it is a way of obtaining higher revenues.

8. Theoretical and Practical Implications

This study contributes to enhancing relations between management levels within organizations, promoting a more sustainable environment, integrating strategic planning, and providing better solutions for retention by involving top management and pro-environment behavior. However, each organization and nation has a different working methodology, culture, work setting, and tradition. It is important to delve into future investigations comparing the working format between countries and sectors. Our results reinforce the need for faster processes, communication-enhancing tools, higher learning curves, and technology to increase decision-making.
Strategic planning should include talent retention parameters as a crucial aspect, particularly focusing on high-performance workers who meet the necessary criteria. Investing in these employees creates opportunities for developing the next generation of managers. Creating a sustainable environment should remain a priority for all stakeholders, with everyone contributing to the reduction of carbon footprint and fostering a greener organization through sustainable actions. Managers should also prioritize providing the necessary training and development opportunities to address sustainable actions, gain experience, expand their knowledge in their respective fields, and bridge any daily operational gaps to ensure smooth functioning.

9. Limitations and Future Research Implications

The study has limitations that may affect the extrapolation of the qualitative data, such as administrating questionnaires due to the demanding schedules, confidentiality concerns, and the need to conduct interviews in a conversational format. Another notable limitation relates to the cultural diversity and the diverse sectors that each respondent is drawn to, requiring careful consideration and potential adjustments in the analysis and interpretation of the study findings.
In the future, experimental studies can be conducted in order to check if there is progress regarding the application of new variables of strategic planning in organizations and the results encountered.
These research studies can include evaluating other relevant theoretical frameworks and other areas of study—for example, gamification, which can be applied to scenarios at every management level to see how can they deal with numerous situations, register the evolution, and if there is a positive/negative result. A longitudinal study has recorded the progress of stakeholders, including both failure and recovery, and explored their internal and external impacts.

Funding

This research received no specific grant from any funding agency in the public, commercial, or not-for-profit sectors.

Informed Consent Statement

Informed consent was obtained from all subjects involved in the study.

Data Availability Statement

Not applicable.

Acknowledgments

We thank the assistant editor, David Pascoal Rosado, Ana Gandrita, the four anonymous reviewers from the review board for their valuable comments, and the participants who answered our interviews and questionnaires.

Conflicts of Interest

The author declares no conflict of interest.

Abbreviations

CFA, confirmatory factor results; JASP, Jeffreys´s Amazing Statistics Program; TMT, top management team; MM, middle management; LM, lower management; SP, strategic planning.

References

  1. Aceituno, Alicia, Andrea Bernal, Jorge Pérez-Corrales, César Fernández-de-las-Peñas, Domingo Palacios-Ceña, and Javier Güeita-Rodríguez. 2022. The impact of digital physical therapy during COVID-19 lockdown in children with developmental disorders: A qualitative study. Brazilian Journal of Physical Therapy 26: 5. [Google Scholar] [CrossRef]
  2. Alsawafi, Ahmed, Fred Lemke, and Ying Yang. 2021. The impacts of internal quality management relations on the triple bottom line: A dynamic capability perspective. International Journal of Production Economics 232: 107927. [Google Scholar] [CrossRef]
  3. Amabile, Teresa. 1997. Motivating creativity in organizations: On doing what you love and loving what you do. California Management Review 40: 39–58. [Google Scholar] [CrossRef]
  4. Amrollahi, Alireza, and Bruce Rowlands. 2018. OSPM: A design methodology for open strategic planning. Information & Management 55: 667–85. [Google Scholar] [CrossRef]
  5. Anzengruber, Johanna, Martin Goetz, Herbert Nold, and Marco Woelfle. 2017. Effectiveness of managerial capabilities at different hierarchical levels. Journal of Managerial Psychology 32: 134–48. [Google Scholar] [CrossRef]
  6. Arji, Goli, Hassein Ahmadi, Pejman Avazpoor, and Morteza Hemmat. 2023. Identifying resilience strategies for disruption management in the healthcare supply chain during COVID-19 by digital innovations: A systematic literature review. Informatics in Medicine Unlocked 38: 101199. [Google Scholar] [CrossRef]
  7. Balogun, Julia, and Gerry Johnson. 2004. Organizational restructuring and middle manager sensemaking. Academy of Management Journal 47: 523–49. [Google Scholar] [CrossRef]
  8. Bjorck, Martin, Mark Koelemay, Tilo Kölbel, Timothy Lees, S. Acosta, F. Bastos Goncalves, J. J. Kolkman, J. H. Lefevre, G. Menyhei, G. Oderich, and et al. 2017. Editor’s Choice—Management of the Diseases of Mesenteric Arteries and Veins: Clinical Practice Guidelines of the European Society of Vascular Surgery (ESVS). European Journal of Vascular and Endovascular Surgery 53: 460–510. [Google Scholar] [CrossRef]
  9. Bolivar, Manuel, Cristina Muñoz, and Laura Munõz. 2020. Characterising smart initiatives’ planning in smart cities: An empirical analysis in Spanish smart cities. Paper presented at 13th International Conference on Theory and Practice of Electronic Governance, online, September 23–25; pp. 585–95. [Google Scholar] [CrossRef]
  10. Bonn, Ingrid, and Chris Christodoulou. 1996. From Strategic Planning to Strategic Management. Long Range Planning 29: 543–51. [Google Scholar] [CrossRef]
  11. Book, Laura, Anthony Gatling, and Jungsun Kim. 2019. The effects of leadership satisfaction on employee engagement, loyalty, and retention in the hospitality industry. Journal of Human Resources in Hospitality & Tourism 18: 368–93. [Google Scholar] [CrossRef]
  12. Bossink, Bart, and Jan-Nico Blauw. 2002. Strategic ambitions as drivers of improvement at DaimlerChrysler. Measuring Business Excellence 6: 5–11. [Google Scholar] [CrossRef]
  13. Boyne, George, Julian Gould-Williams, Jennifer Law, and Richard M. Walker. 2002. Plans, Performance Information and Accountability: The Case of Best Value. Public Administration 80: 691–710. [Google Scholar] [CrossRef]
  14. Bryant, Fred, and Paul Yarnold. 1995. Principal Components Analysis and Exploratory and Confirmatory Factor Analysis. Edited by Laurence Grimm and Paul Yarnold. Reading and Understanding Multivariate Analysis. Washington, DC: American Psychological Association, pp. 99–136. [Google Scholar]
  15. Buckingham, Marcus. 2022. Designing work that love people. Harvard Business Review 100: 66–75. [Google Scholar]
  16. Burnes, Bernard. 2015. Understanding resistance to change—Building on Coch and French. Journal of Change Management 15: 92–116. [Google Scholar] [CrossRef]
  17. Cachón-Rodríguez, Gabriel, Alicia Blanco-González, Camilo Prado-Román, and Cristina Del-Castillo-Feito. 2022. How sustainable human resources management helps in the evaluation and planning of employee loyalty and retention: Can social capital make a difference? Evaluation and Program Planning 95: 102171. [Google Scholar] [CrossRef] [PubMed]
  18. Cachón-Rodríguez, Gabriel, Camilo Prado-Román, and Alicia Blanco-González. 2021. The relationship between corporate identity and university loyalty: The moderating effect of brand identification in managing an institutional crisis. Journal of Contingencies and Crisis Management 29: 265–80. [Google Scholar] [CrossRef]
  19. Chen, Gilad, and Paul Bliese. 2002. The role of different levels of leadership in predicting self- and collective efficacy: Evidence for discontinuity. Journal of Applied Psychology 87: 549–56. [Google Scholar] [CrossRef]
  20. Claus, Lisbeth. 2019. HR disruption—Time already to reinvent talent management. BRQ Business Research Quarterly 22: 207–15. [Google Scholar] [CrossRef]
  21. Cortina, Jose. 1993. What is coefficient alpha? An examination of theory and applications. Journal of Applied Psychology 78: 98. [Google Scholar] [CrossRef]
  22. Cronbach, Lee Joseph. 1951. Coefficient alpha and the internal structure of tests. Psychometrika 16: 297–334. [Google Scholar] [CrossRef]
  23. Del Val, Manuel, and Clara Fuentes. 2003. Resistance to change: A literature review and empirical study. Management Decision 41: 148–55. [Google Scholar] [CrossRef]
  24. Dempsey, Sarah, and Matthew Sanders. 2010. Meaningful work? Nonprofit marketization and work/life imbalance in popular autobiographies of social entrepreneurship. Organization 17: 437–59. [Google Scholar] [CrossRef]
  25. Diefenbach, Thomas, and Jonh Silince. 2011. Formal and informal hierarchy in different types of organization. Organization Studies 32: 1515–37. [Google Scholar] [CrossRef]
  26. Dzung, Thuy, and Fang Lo. 2023. How does top management team diversity influence firm performance? A causal complexity analysis. Technological Forecasting and Social Change 186: 122162. [Google Scholar] [CrossRef]
  27. Elbanna, Ammany, and Mike Newman. 2022. The bright side and the dark side of top management support in Digital Transformation—A hermeneutical reading. Technological Forecasting and Social Change 175: 121411. [Google Scholar] [CrossRef]
  28. Engberg, Robert, Sven Horte, and Magnus Lundback. 2015. Strategy implementation and organizational levels: Resourcing for innovation as a case. Journal of Organizational Effectiveness: People and Performance 2: 157–75. [Google Scholar] [CrossRef]
  29. Erwin, Dennis, and Andrew Garman. 2010. Resistance to organizational change: Linking research and practice. Leadership & Organization Development Journal 31: 39–56. [Google Scholar] [CrossRef]
  30. Ezzamel, Mahmoud, Hugh Willmott, and Frank Worthington. 2001. Power, Control and Resistance in ‘The Factory That Time Forgot’. Journal of Management Study 38: 1053. [Google Scholar] [CrossRef]
  31. Farrell, Catherine, and Jonathan Morris. 2013. Managing the neo-bureaucratic organization: Lessons from the UK’s prosaic sector International. Journal of Human Resource Management 24: 1376–92. [Google Scholar] [CrossRef]
  32. Fleming, Peter, and Aandré Spicer. 2008. Beyond power and resistance. Management Communication Quarterly 21: 301–9. [Google Scholar] [CrossRef]
  33. Fleming, Peter, and Granham Sewell. 2002. Looking for the good soldier, Svejk: Alternative modalities of resistance in the contemporary workplace. Sociology 36: 857–72. [Google Scholar] [CrossRef]
  34. Floyd, Steven, Torsten Schmid, and Bill Wooldridge. 2008. The middle management perspective on strategy process: Contributions, synthesis, and future research. Journal of Management 34: 1190–221. [Google Scholar] [CrossRef]
  35. Foster, William, Jonh Hassar, Jonh Morris, and Julie Cox. 2019. The changing nature of managerial work: The effects of corporate restructuring on management jobs and careers. Human Relations 72: 473–504. [Google Scholar] [CrossRef]
  36. Gallo, Peter, Eva Benkova, and Beáta Mihalcova. 2019. The Effects of Using Strategic Planning as a Managerial Tool: A Case of Industrial Companies. Polish Journal of Management Studies 20: 145–60. [Google Scholar]
  37. George, Bert. 2017. Does strategic planning ‘work’ in public organizations? Insights from Flemish municipalities. Public Money & Management 37: 527–30. [Google Scholar] [CrossRef]
  38. George, Bert, Richard Walker, and Joost Monster. 2019. Does strategic planning improve organizational performance? A meta-analysis. Public Administration Review 79: 810–19. [Google Scholar] [CrossRef]
  39. Giannoccaro, Ilaria. 2018. Centralized vs. decentralized supply chains: The importance of decision maker’s cognitive ability and resistance to change. Industrial Marketing Management 73: 59–69. [Google Scholar] [CrossRef]
  40. Glaister, Keith, and Richard Falshaw. 1999. Strategic Planning: Still going Strong? Long Range Planning 32: 107–16. [Google Scholar] [CrossRef]
  41. Guo, Chao, and Charllotte Ren. 2011. Middle managers’ strategic role in the corporate entrepreneurial process: Attention-based effects. Journal of management 37: 1586–610. [Google Scholar] [CrossRef]
  42. Guyadeen, Dave, Daniel Henstra, Shivani Kaup, and Grace Wright. 2023. Evaluating the quality of municipal strategic plans. Evaluation and Program Planning 96: 102186. [Google Scholar] [CrossRef]
  43. Hellberg, Rolland, and Eivind Fauskanger. 2022. Learning of quality improvement theory—Experiences with reflective learning from a student perspective. International Journal of Lean Six Sigma. ahead-of-print. [Google Scholar] [CrossRef]
  44. Hermano, Victor, and Natalia Martín-Cruz. 2016. The role of top management involvement in firms performing projects: A dynamic capabilities approach. Journal of Business Research 69: 3447–58. [Google Scholar] [CrossRef]
  45. Hersperger, Anna, Eduardo Oliveira, Sofia Pagliarin, Gaetan Palka, Peter, and Janine Bolliger. 2018. Urban land-use change: The role of strategic spatial planning. Global Environmental Change 51: 32–42. [Google Scholar] [CrossRef]
  46. Hober, Bjoern, and Mario Schaarschimt. 2021. Internal idea contests: Work environment perceptions and the moderating role of power distance. Journal of Innovation & Knowledge 6: 1. [Google Scholar] [CrossRef]
  47. Hortovanyi, Lilla, Roland Szabo, and P. Fuzes. 2021. Extension of the strategic renewal journey framework: The changing role of middle management. Technology in Society 65: 101540. [Google Scholar] [CrossRef]
  48. Jehn, Karen, Gregory Northcraft, and Margaret Neale. 1999. Why differences make a difference: A field study of diversity, conflict and performance in workgroups. Administrative Science Quarterly 44: 741–63. [Google Scholar] [CrossRef]
  49. Kim, Don, Vinod Kumar, and Uma Kumar. 2012. Relationship between quality management practices and innovation. Journal Operational Management 30: 295–315. [Google Scholar] [CrossRef]
  50. Krier, Laura. 2022. A framework for shared leadership: A perspective on strategic planning for academic libraries. The Journal of Academic Librarianship 62: 899–930. [Google Scholar] [CrossRef]
  51. Langley, Ann, and Malvina Klag. 2014. Critical junctures in strategic planning: Understanding failure to enable success. Organizational Dynamics 43: 274–83. [Google Scholar] [CrossRef]
  52. Lee, David, Michael Mc Guire, and J. Kim. 2017. Collaboration, strategic plans, and government performance: The case of efforts to reduce homelessness. Public Management Review 20: 360–76. [Google Scholar] [CrossRef]
  53. Leinwand, Paul, Blair Shepard, and M. Mani. 2022. Reinventing your leadership team. Harvard Business Review 100: 61–69. [Google Scholar]
  54. Li, Jing, Richard Pike, and Roszaini Haniffa. 2008. Intellectual capital disclosure and corporate governance structure in UK firms. Accountability Business Research 38: 137–59. [Google Scholar] [CrossRef]
  55. Lines, Brian, Kenneth Sullivan, Jake Smithwick, and Josh Mischung. 2015. Overcoming resistance to change in engineering and construction: Change management factors for owner organizations. Journal of Business Research 160: 113782. [Google Scholar] [CrossRef]
  56. Loehlin, Jonh. 2004. Latent Variable Models: An Introduction to Factor, Path, and Structural Equation Analysis, 4th ed. Hillsdale: Erlbaum Associates. [Google Scholar]
  57. Marôco, João. 2021. Análise de Equações Estruturais, Fundamentos teóricos, Software & aplicações, 3rd ed. Pêro Pinheiro: ReportNumber, Lda. [Google Scholar]
  58. Mintzberg, Henry. 1994. Rethink Strategic Planning Part I: Pitfalls and Fallacies. Long Range Planning 27: 12–121. [Google Scholar] [CrossRef]
  59. Muller, Monika, Christian Huber, and Martin Messner. 2019. Meaningful work at a distance: A case study in a hospital. European Management Journal 37: 719–29. [Google Scholar] [CrossRef]
  60. Mumby, Dennis, Robyn Thomas, I. Marti, and David Seidl. 2017. Resistance Redux. Organization Study 38: 1157–83. [Google Scholar] [CrossRef]
  61. Munjuri, Mercy Gacheri, and Raquel Muthoni Maina. 2013. Workforce diversity management and employee performance in the banking sector in Kenya. DBA Africa Management Review 3: 1–21. [Google Scholar]
  62. Murnighan, Keith, and Donald Conlon. 1991. The dynamics of intense workgroups: A study of British string quartets. Administrative Science Quarterly 36: 165–86. [Google Scholar] [CrossRef]
  63. Nadkarni, Sucheta, and Pamela Barr. 2008. Environmental context, managerial cognition, and strategic action: An integrated view. Strategic Management Journal 29: 1395–427. [Google Scholar] [CrossRef]
  64. Nunnally, Jum. 1994. Psychometric Theory, 3rd ed. New York: Tata McGraw-Hill. [Google Scholar]
  65. Ou, Amy, Anne Tsui, Angelo Kinicki, David Waldman, Z. Xiao, and Linda Song. 2014. Humble chief executive officers’ connections to top management team integration and middle managers’ responses. Administration Science Quarterly 59: 34–72. [Google Scholar] [CrossRef]
  66. Paulsen, Rolland. 2015. Non-work at work: Resistance or what? Organization 22: 351–67. [Google Scholar] [CrossRef]
  67. Pearce, Jonh, Elizabeth Freeman, and Richard Robinson. 1987. Formal Strategic Planning and Financial Performance. Academy of Management Review 12: 658–75. [Google Scholar] [CrossRef]
  68. Posch, Arthur, and Garaus Cristian. 2020. Boon or Curse? A Contingent View on the Relationship between Strategic Planning and Organizational Ambidexterity. Long Range Planning 53: 6. [Google Scholar] [CrossRef]
  69. Ranucci, Rebecca, and Shirley Wang. 2022. Resilience in Top Management Teams: Responding to crisis by focusing on the future. Long Range Planning 15: 102268. [Google Scholar] [CrossRef]
  70. Razek, Mohamed, Hesham Basssioni, and Ahmed Mobarak. 2008. Causs of delay in building constructions projects in Egypt. Journal of Construction Engineering and Management 134: 831–41. [Google Scholar] [CrossRef]
  71. Rouhani, Saeed, and Mehdi Ghazanfari. 2012. Evaluation model of business intelligence for enterprise systems using fuzzy TOPSIS. Expert Systems with Applications 39: 3764–71. [Google Scholar] [CrossRef]
  72. Schabram, Kira, and Sally Maitlis. 2017. Negotiating the challenges of a calling: Emotion and enacted sensemaking in animal shelter work. Academy of Management Journal 60: 584–609. [Google Scholar] [CrossRef]
  73. Schuler, Benedikt, Kevin Orr, and Jeffrey Hughes. 2023. My colleagues (do not) think the same: Middle managers’ shared and separate realities in strategy implementation. Journal of Business Research 160: 113782. [Google Scholar] [CrossRef]
  74. Shahab, Yasir, Collins Ntim, Chengang Ye, Farid Ullah, and Samuel Fosu. 2018. Environmental policy, environmental performance, and financial distress in China: Do top management team characteristics matter? Business Strategic Environment 27: 1635–52. [Google Scholar] [CrossRef]
  75. Steiner, George. 1980. Strategic Planning: What Every Manager Should Know. Strategic Management Journal 1: 191–92. [Google Scholar]
  76. Stensaker, Inger, Joyce Falkenberg, and Kjell Gronhaug. 2008. Implementation activities and organizational sensemaking. Journal of Applied Behavior Sciences 44: 162–85. [Google Scholar] [CrossRef]
  77. Tarí, Juan, Jorge Pereira-Moliner, Eva Pertusa-Ortega, Maria López-Gamero, and José Molina-Azorín. 2017. Does quality management improve performance or vice versa? Evidence from the hotel industry. Service Business 11: 23–43. [Google Scholar] [CrossRef]
  78. Van Knippenberg, Daan, and Michaélla Schippers. 2007. Workgroup diversity. Annual Review of Psychology 58: 515–41. [Google Scholar] [CrossRef] [PubMed]
  79. Vecchiato, Riccardo. 2012. Environmental uncertainty, foresight and strategic decision making: An integrated study. Technological Forecasting and Social Change 79: 436–47. [Google Scholar] [CrossRef]
  80. Wang, Junhua, Hao Song, Ting Fu, Molly Behan, Lei Jie, Yingxian He, and Qianggiang Shangguan. 2022. Crash prediction for freeway work zones in real time: A comparison between Convolutional Neural Network and Binary Logistic Regression model. International Journal of Transportation Science and Technology 11: 484–95. [Google Scholar] [CrossRef]
  81. Warrick, Donald. 2022. Revisiting resistance to change and how to manage it: What has been learned and what organizations need to do. Business Horizons 66: 433–41. [Google Scholar] [CrossRef]
  82. Weston, Marla. 2020. Strategic planning in an age of uncertainty: Creating clarity in uncertain times. Nurse Leader 18: 54–58. [Google Scholar] [CrossRef]
  83. Ybema, Sierk, and Martha Horvers. 2017. Resistance through compliance: The strategic and subversive potential of frontstage and backstage resistance. Organizational Study 38: 1233–51. [Google Scholar] [CrossRef]
Figure 1. Working context. Source: our own elaboration.
Admsci 13 00211 g001
Figure 2. Global model. Source: JASP software (version 0.7.1).
Admsci 13 00211 g002
Figure 3. Middle management. Source: JASP software (version 0.7.1). (Factor: F1—Employee engagement; F2—Organizational Development; F3—Employee Motivation; F4—Sustainable Inclusion). (Indicators: Q17—Skills; Q14—Feedback; Q13—Appreciation; Q16—Growth; Q18—Participation; Q15—Job integration; Q10—Encouragement; Q22—Intention; Q20—New perspectives; Q21—Collaboration; Q4—Bureaucracy; Q2—Communications; Q3—Guidelines; Q11—Teamwork; Q9—Training; Q7—Perks; Q12—Work satisfaction; Q23— Environmental messages; Q24—Sustainable training; Q25—Inclusion; Q19—Interaction).
Admsci 13 00211 g003
Figure 4. Lower management. Source: JASP software (version 0.7.1). (Factor: F1—Employee engagement; F2—Organizational Development; F3—Employee Motivation; F4—Sustainable Inclusion). (Indicators: Q17—Skills; Q14—Feedback; Q13—Appreciation; Q16—Growth; Q18—Participation; Q15—Job integration; Q10—Encouragement; Q22—Intention; Q20—New perspectives; Q21—Collaboration; Q4—Bureaucracy; Q2—Communications; Q3—Guidelines; Q11—Teamwork; Q9—Training; Q7—Perks; Q12—Work satisfaction; Q23— Environmental messages; Q24—Sustainable training; Q25—Inclusion; Q19—Interaction).
Admsci 13 00211 g004
Table 1. Sociodemographic for qualitative data.
CharacteristicClassificationTotal Sample (n = 14)Percentage (100%)
GenderFemale750.0
Male750.0
Age18–25535.7
26–35428.6
36–45214.3
46–55321.4
CountryPortugal535.7
Greece214.3
Poland214.3
OrganizationOther535.7
Private1178.6
Public321.4
Company Size<500 workers1071.4
501–999 workers321.4
>1000 workers17.2
Working sectorTechnology750.0
Management535.5
Education17.1
Food17.1
Source: our own elaboration.
Table 2. Sociodemographic for quantitative data.
CharacteristicClassificationTotal Sample (n = 204)Percentage (100%)
GenderFemale9546.57
Male10651.96
Other31.47
Age18–257134.80
26–357938.73
36–453316.18
46–55167.84
56–6541.96
Over 6510.49
Academic QualificationsBasic education20.98
Middle school4823.53
Bachelor’s degree7335.78
Master’s degree7536.76
Ph.D.41.96
Other20.98
Management LevelMiddle7637.25
Lower12862.75
CountryPortugal4525.49
Poland4622.55
United Kingdom4421.57
Other6230.39
Source: our own elaboration.
Table 3. Component loadings.
Factors and ItemsPC1PC2PC3PC4Cronbach’s Alpha by Component
F1- Employee Engagement 0.866
Skills—Q170.822
Feedback—Q140.776
Appreciation—Q130.771
Growth—Q160.763
Participation—Q180.681
Job retention—Q150.588
Encouragement—Q100.524
F2- Organizational Development 0.780
Intentions—Q22 0.737
New perspective—Q20 0.723
Collaboration—Q21 0.668
Bureaucracy—Q4 0.598
Communication—Q2 0.592
Guidelines—Q3 0.555
F3- Employee Motivation 0.663
Teamwork—Q11 0.652
Training—Q9 0.620
Perks—Q7 0.604
Work satisfaction—Q12 0.500
F4- Sustainable Inclusion 0.730
Environmentally messages—Q23 0.665
Sustainable training—Q24 0.620
Inclusion—Q25 0.617
Interaction—Q19 0.575
KMO0.885
Bartlett´s Test of Sphericityχ2(210) = 1638.957; Sig. < 0.001
Cronbach´s Alpha Global0.889
Source: JASP software (version 0.7.1).
Table 4. Component characteristics.
Principal ComponentsUnrotated SolutionRotated Solution
EigenvalueProportionCumulativeSumSq.ProportionCumulative
VarianceLoadingsVariance
PC16.6990.3190.3194.1720.1990.199
PC22.4960.1190.4382.9010.1380.337
PC31.2250.0580.4962.3180.1100.447
PC41.1730.0560.5522.2020.1050.552
Source: JASP software (version 0.7.1).
Table 5. Fit measures.
IndexValue
Comparative fit index (CFI)0.932
Tucker–Lewis Index (TLI)0.922
Bentler–Bonett normed fit index (NFI)0.902
Information criteria
Log-likelihood−18,665.809
Number of free parameters69.000
Akaike (AIC)37,469.618
Bayesian (BIC)37,698.569
Other fit measures
Root-mean-square error of approximation (RMSEA)0.052
RMSEA 90% CI lower-bound0.040
RMSEA 90% CI upper-bound0.064
Standardized root-mean-square residual (SRMR)0.055
Hoelter’s critical N (α = 0.05)155.208
Hoelter’s critical N (α = 0.01)165.838
Goodness of fit index (GFI)0.985
Source: JASP software (version 0.7.1).
Table 6. Factor loadings.
95% Confidence Interval
FactorIndicatorSymbolEstimateStd. Errorz-Valuep-ValueLowerUpper
F1Q17λ1125.9071.74114.881<0.00122.49529.319
Q14λ1221.9801.62913.494<0.00118.78825.173
Q13λ1318.1431.70110.663<0.00114.80821.478
Q16λ1421.1881.90811.104<0.00117.44824.928
Q18λ1516.7171.61010.384<0.00113.56219.872
Q15λ1617.5311.72210.182<0.00114.15620.905
Q10λ1713.0711.8816.950<0.0019.38516.757
F2Q22λ2115.4731.39111.121<0.00112.74618.200
Q20λ2212.9921.3009.997<0.00110.44515.539
Q21λ2316.1521.23713.062<0.00113.72818.575
Q4λ2410.5561.1029.581<0.0018.39612.715
Q2λ258.9361.5915.615<0.0015.81712.056
Q3λ267.7871.3055.968<0.0015.23010.344
F3Q11λ317.6751.1336.772<0.0015.4549.896
Q9λ3210.6281.3547.847<0.0017.97413.283
Q7λ3310.0461.2478.055<0.0017.60212.490
Q12λ3411.0171.3048.446<0.0018.46113.574
F4Q23λ4120.0681.64512.199<0.00116.84423.293
Q24λ4215.5331.5629.947<0.00112.47218.593
Q25λ4316.3471.8548.817<0.00112.71319.980
Q19λ4413.0481.8497.055<0.0019.42316.673
Source: JASP software (version 0.7.1). (Factor: F1—Employee engagement; F2—Organizational Development; F3—Employee Motivation; F4—Sustainable Inclusion). (Indicators: Q17—Skills; Q14—Feedback; Q13—Appreciation; Q16—Growth; Q18—Participation; Q15—Job integration; Q10—Encouragement; Q22—Intention; Q20—New perspectives; Q21—Collaboration; Q4—Bureaucracy; Q2—Communications; Q3—Guidelines; Q11—Teamwork; Q9—Training; Q7—Perks; Q12—Work satisfaction; Q23— Environmental messages; Q24—Sustainable training; Q25—Inclusion; Q19—Interaction).
Table 7. Global model representation.
F1—Employee
Engagement
F2—Organizational
Development
F3—Employee
Motivation
F4—Sustainable
Inclusion
Q10—EncouragementQ03—GuidelinesQ12—Work SatisfactionQ19—Interaction
Q15—Job RetentionQ02—CommunicationsQ07—PerksQ25—Inclusion
Q18—ParticipationQ04—BureaucracyQ09—TrainingQ24—Sustainable training
Q16—GrowthQ21—CollaborationQ11—TeamworkQ23—Environmental
messages
Q14—FeedbackQ20—New perspectives
Q17—SkillsQ22—Intentions
Source: our own elaboration.
Table 8. Model fit for multigroup analysis.
IndexValue
Comparative fit index (CFI)0.899
Tucker–Lewis index (TLI)0.885
Other Fit measures
Root-mean-square error of approximation (RMSEA)0.065
RMSEA 90% CI lower-bound0.052
RMSEA 90% CI upper-bound0.077
Goodness of fit index (GFI)0.976
Source: JASP software (version 0.7.1).
Table 9. Coefficient of determination.
R2
Middle ManagementLower Management
Q170.7230.763
Q140.6840.623
Q130.4440.509
Q160.5360.438
Q180.4680.449
Q150.4180.486
Q100.1380.404
Q220.4100.742
Q200.3680.554
Q210.6680.671
Q40.4510.379
Q20.1260.263
Q30.1970.181
Q110.2830.200
Q90.3310.305
Q70.3460.391
Q120.2510.752
Q230.6700.601
Q240.5130.371
Q250.3750.336
Q190.2680.256
Source: JASP software (version 0.7.1). (Indicators: Q17—Skills; Q14—Feedback; Q13—Appreciation; Q16—Growth; Q18—Participation; Q15—Job integration; Q10—Encouragement; Q22—Intention; Q20—New perspectives; Q21—Collaboration; Q4—Bureaucracy; Q2—Communications; Q3—Guidelines; Q11—Teamwork; Q9—Training; Q7—Perks; Q12—Work satisfaction; Q23— Environmental messages; Q24—Sustainable training; Q25—Inclusion; Q19—Interaction).
Disclaimer/Publisher’s Note: The statements, opinions and data contained in all publications are solely those of the individual author(s) and contributor(s) and not of MDPI and/or the editor(s). MDPI and/or the editor(s) disclaim responsibility for any injury to people or property resulting from any ideas, methods, instructions or products referred to in the content.

