Article

Entrepreneurial Orientation and Open Innovation Promote the Performance of Services SMEs: The Mediating Role of Cost Leadership

by
Mahendra Kumar Chelliah
1,2,*,
Kalisri Logeswaran Aravindan
2,* and
Saravanan Muthaiyah
2
1
Faculty of Accountancy and Management, Universiti Tunku Abdul Rahman, Kajang 43000, Selangor, Malaysia
2
Faculty of Management, Multimedia University, Cyberjaya 63100, Selangor, Malaysia
*
Authors to whom correspondence should be addressed.
Adm. Sci. 2023, 13(1), 1; https://doi.org/10.3390/admsci13010001
Submission received: 14 October 2022 / Revised: 4 November 2022 / Accepted: 4 November 2022 / Published: 20 December 2022

Abstract

:
In the 21st century, small and medium service firms face difficulty sustaining their performance. Additionally, the literature on entrepreneurial orientation (EO) in SMEs is scarce. Moreover, the role of cost leadership strategy as a mediator lacks researchers’ attention. Therefore, this research aims to examine the relationship between EO and SMEs performance with the mediating role of cost leadership strategy. Based on the contingency theory, a theoretical model has been drawn. A survey approach with a questionnaire technique has been adapted to achieve the study objectives. The data were collected from 283 service SMEs in three states of Malaysia. The Partial Least Square Structural Equation Modelling (PLS-SEM) technique was employed to analyze the empirical data. The study findings highlight that risk-taking and open innovation have no direct relationship with SMEs’ performance. However, through the mediation role of cost leadership, risk-taking and open innovation have a significant association with performance. Furthermore, the findings indicate that proactiveness, competitive aggressiveness, and autonomy have a positive and direct relationship with performance, whereas in the presence of cost leadership, competitive aggressiveness has a partial mediating effect. The empirical findings are helpful to policymakers, researchers, and practitioners.

1. Introduction

Over the past decades, organizations have dramatically changed their strategies and processes. The prime motives behind these changes are digitization (Fang et al. 2021) and the dynamic and turbulent business environment (Fan et al. 2021). Moreover, the constant development of new technologies has led to high competition (Ali et al. 2022; Ali and Johl 2022a). Additionally, the current pandemic situation further accelerates the situation (Alsharif et al. 2021). Therefore, the competitive nature of the firm environment has further accelerated the need for organizations to articulate strategies that support the firms’ interests and give them competitive advantages (Isichei et al. 2020). To gain a competitive advantage in this situation, an organization needs deliberate internal behavior that promotes fundamental changes in the process. Consequently, it allows organizational creativity, commitment, and new ideas (Nguyen et al. 2021). Such internal behavior is referred to as entrepreneurial orientation (EO).
The entrepreneurial orientation (EO) concept emerged in the 1970s, after which it gained considerable attention from researchers and practitioners. According to Miller (1983), EO means “entrepreneurial firm engages in product-market innovation, undertakes somewhat risky ventures, and is first to come up with proactive innovations beating competitors to the punch”. The prior literature highlights that entrepreneurial orientation (EO) plays an important role in enhancing firm performance (Bin Yusoff et al. 2021; Fang et al. 2021). However, much research has provided varying evidence on the relationship between EO and performance. For instance, Isichei et al. (2020) found a positive relationship between EO and performance. Likewise, Hernandez-Perlines and Cisneros (2017) found a positive association between EO–performance relationships. On the other hand, some studies found a weak, negative, or no relationship between EO performance (Shirokova et al. 2016; Mazhar et al. 2022a). Moreover, some dimensions of EO positively affect performance, and others have no relationship. For instance, the research of Isichei et al. (2020) found that two dimensions of EO (innovativeness and proactiveness) have a positive relationship with performance, whereas risk-taking has no significant effect on performance. Similarly, Rezaei and Ortt (2018) affirmed that innovativeness and proactiveness (EO) have a positive relationship with performance, and risk-taking negatively affects performance. In a nutshell, the existing studies cannot resolve the contradictions between EO and performance relationships.
Rezaei and Ortt (2018) and Wang (2008) pointed out that past studies on the EO–performance relationship indicated that simply studying EO’s direct effect on performance does not provide a complete picture. Many different mediating variables have been involved in unraveling the mechanism by which EO enhances firm performance. Prior literature has adopted various strategic constructs as mediating variables, such as social media (Fang et al. 2021; Fan et al. 2021), marketing communication (Butkouskaya et al. 2020), outsourcing (Irwin et al. 2018), and the knowledge creation process (Li et al. 2009). However, the prior studies ignored the role of a firm competitive strategy as a mediator between the EO–performance relationship, especially cost leadership (Galbreath et al. 2020). Based on the above discussion, the following research questions have been developed:
RQ1: Does EO has an association with firm performance?
RQ2: Does cost leadership mediate between EO and firm performance?
In the context of this research, the focus area is small- and medium-sized enterprises (SMEs), especially Malaysian SMEs. The selection of SMEs is based on several reasons. First, SMEs contribute more than 70% of the GDP and 80% of the labor market in emerging economies. But still, they lack resources and challenges (Ali and Johl 2022b; Fang et al. 2021). Second, Nguyen et al. (2021) argued that the industrial society of several emerging economies is based on SMEs that are considered the core elements of a country’s success and failure. Finally, SMEs located in emerging countries usually struggle with their survival. Malaysia, which is an important emerging economy, faces the same dilemma. Therefore, the selection of Malaysian SMEs as the study scope is quite rational.

2. Literature Review and Theoretical Framework

2.1. Entrepreneurial Orientation (EO)

In the entrepreneurship literature, the EO has been conceptualized as behavioral factors (Fatima and Bilal 2019) or organizational factors (Zarrouk et al. 2020). In the current study, EO has been considered as an internal behavioral factor. In this respect, an entrepreneurial company innovates the market for its products, takes on certain risky business endeavors, and develops proactive advancements before its rivals (Miller 1983). The initial work of Miller (1983) conceptualized EO as proactiveness, risk-taking, and innovativeness. Later, Lumpkin and Dess (1996) added two more dimensions: autonomy and competitive aggressiveness. According to Hernández-Linares et al. (2019), all five dimensions are vital for EO–performance relationships, but each dimension’s level varies due to organizational and environmental factors.
In EO studies, risk-taking as a sub-dimension has gained considerable attention. In the prior literature, risk-taking has various meanings. From a behavioral point of view, risk-taking refers to a sense of uncertainty and may apply some risks such as personal, social, or psychological (Lumpkin and Dess 1996). Proactiveness is another vital element in EO research. Lumpkin and Dess (2001) described proactiveness as a forward-looking perspective factor of a marketplace leader that has the foresight to act in anticipation of future demand and shape the environment.
In contrast, competitive aggressiveness refers to the intensity of an organization’s efforts to outperform industry rivals (Lumpkin and Dess 2001). In the digital era, the term innovativeness has gained considerable attention. According to Lumpkin and Dess (1996, 2001), innovativeness refers to a firm tendency to support and engage in new, novelty, and creative ideas to develop new products, services, and technology. Finally, the term autonomy refers to the independent action of an individual or team to develop a firm mission or vision and execute it until completion (Lumpkin and Dess 1996).

2.2. Contingency Theory

This research applies contingency theory to explain the relationship between EO and performance through the cost leadership strategy as a mediator. The basic work of contingency theory has been found in the early literature of organizational theory. According to Miller (1988), the contingency theory suggests that the congruence or fit between key variables is crucial for achieving a higher level of performance. Kessler (2013) explains that the contingency theory states that there is no best way to lead people or organizations, rather the choices that are made must fit the situation. Williams et al. (2017) argued that organizations would perform better when certain contextual factors are considered. Therefore, the central notation of contingency theory is “good/best fit”. Naidu et al. (2021) argued that contingency theory is especially useful when there is a lack of an established theoretical framework. In prior EO–performance literature, the resource-based view (RBV) theory has taken the dominant position (Bin Yusoff et al. 2021; Susanto et al. 2021; Meekaewkunchorn et al. 2021; Mazhar et al. 2022b), although a few researchers underpin their work on contingency theory. For instance, Galbreath et al. (2020) examined the relationship between EO and firm performance under the influence of low-cost and differentiation strategies. However, this study highlights that another strategy (cost leadership) should be included in future studies. Likewise, Naidu et al. (2021) analyzed the effect of EO on retail franchisee performance under the impact of contingency factors (strategic fits).
Moreover, the prior studies on the EO–performance relationship underpinned under contingency theory have been developed in different contexts such as large and franchisee firms (Naidu et al. 2021; Galbreath et al. 2020; Mazhar et al. 2021; Hussain et al. 2022). Thus, there is a theoretical gap in the SME domain. Key reasons have justified the application of contingency theory. It represents a firm internal behavioral (EO)–strategy–performance relationship for most organizations (Galbreath et al. 2020). This enables us to conceptualize the association between EO and SMEs’ performance and how contingency factors such as cost leadership strategy affect the relationship.

3. Hypothesis Development

3.1. Entrepreneurial Orientation and Firm Performance

Based on the contingency theory perspective, EO and sub-dimensions have been considered contingency factors. Contingency theory explains that entrepreneurial orientation affects the firm’s performance. In the prior literature, the relationship between EO as a multidimensional construct and firm performance is well established (Alvarez-Torres et al. 2019; Susanto et al. 2021; Le Roux et al. 2014).
In the era of digitalization, both entrepreneurs and SMEs operate in a risky and uncertain environment. Within this context, entrepreneurs need to take risks to remain competitive in the market. Therefore, an entrepreneur must have a risk-taking approach to maximize the firm performance. In the past literature, risk-taking as a sub-dimension of EO has a positive association with firm performance. For instance, Alvarez-Torres et al. (2019) hypothesized that risk-taking as an EO dimension has a positive and significant relationship with SME performance. Likewise, Rezaei and Ortt (2018) affirmed that risk-taking has a positive and significant relationship with the production performance of Dutch SMEs. On the other hand, Le Roux et al. (2014) found that risk-taking has no significant relationship with firm performance. Based on the above discussion, the results are inconclusive; thus, the following hypothesis has been proposed:
H1. 
Risk-taking has a positive and significant effect on firm performance.
In the EO literature, proactiveness is regarded as an individual forward-looking perspective and opportunity-seeking behavior (Le Roux et al. 2014). Such EO constructs are called the first mover’s advantage. The past literature showed that proactiveness has a significant relationship with firm performance. For instance, Le Roux et al. (2014) argued that proactiveness has a significant and positive association with firm performance. Alvarez-Torres et al. (2019) hypothesized that proactiveness as an EO dimension has a positive and significant relationship with SME performance. Similarly, Rezaei and Ortt (2018) affirmed that proactiveness has a positive and significant relationship with the production performance of Dutch SMEs. Isichei et al. (2020) examined the relationship between proactiveness and firm performance in Nigeria. Based on the above discussion, the following hypothesis has been proposed:
H2. 
Proactiveness has a positive and significant effect on firm performance.
In addition to the above two EO dimensions, competitive aggressiveness considers a driver to face the intense rivalry competition. Miller (1983) argued that competitive aggressiveness implies beating competitors to the punch. Based on past studies, competitive aggressiveness has a significant impact on performance. For instance, Fatima and Bilal (2019) argued that competitive aggressiveness has a positive relationship with SME performance in Pakistan. Likewise, Le Roux et al. (2014) affirmed that competitive aggressiveness has a positive and significant relationship with firm performance. Thus, the following hypothesis has been proposed:
H3. 
Competitive aggressiveness has a positive and significant effect on firm performance.
In the EO literature, autonomy is referred to as the person’s willingness and ability to take self-directed actions in the pursuit of market opportunities It allows the organization to take self-reliant and quick decisions to generate new market opportunities with novel products and services (Li et al. 2009). The empirical research of Alvarez-Torres et al. (2019) affirmed that autonomy has a positive and significant relationship with firm performance. In the same vein, Fatima and Bilal (2019) argued that autonomy is an important driver of EO to achieve SME performance in Pakistan. Finally, Li et al. (2009) affirmed that autonomy as an EO dimension played an important role in achieving a firm long- and short-term performance. Thus, the following hypothesis has been proposed:
H4. 
Autonomy has a positive and significant effect on firm performance.

3.2. Open Innovation and Firm Performance

Following Schumpeter’s initial introduction of the notion, it was long assumed that innovation exclusively applied to internal companies or R&D department activities, making creativity and innovation valuable strategic resources guarded by rigorous management and statutory protections. A firm’s open innovation is shown to affect its performance through the contingency theory. Previous research has shown that there is a strong association between open innovation and the performance of firms (Fu et al. 2019; Hung and Chou 2013). The past literature shows evidence that open innovation has a significant association with firm performance, but the results are inconclusive (Abiodun 2017). Some studies provide a positive effect of open innovation on firm performance, whereas others have presented opposite results. For instance, Oltra et al. (2018) found a positive relationship between open innovation and firm performance. Hung and Chou (2013) found a positive relationship between open innovation and firm performance.
On the other hand, Fu et al. (2019) argued that open innovation (inbound) has a negative relationship with short-term firm performance, and open innovation (outbound) has a U-shaped curvilinear relationship with long-term firm performance. In addition to negative and positive relationships of open innovation on firm performance, some researchers found U-shaped relationships. Zhang et al. (2018) examined open innovation and firm performance linkages. The study found that there has been a U-shaped relationship between them. Therefore, there are mixed findings regarding the effect of open innovation on firm performance. This study proposed the following hypothesis based on the above inconclusive results and a clearer picture of the relationship between open innovation and firm performance:
H5. 
There is a positive and significant relationship that exists between open innovation and firm performance.

3.3. Cost Leadership as a Mediator

When a business positions itself as the lowest-cost manufacturer or supplier of a specific good or service in a market, this practice is known as cost leadership. The approach is challenging to implement, since management must continuously strive to lower costs at every level to maintain competitiveness. Cost leadership strategy is taken as a competitive advantage for a firm. According to Mahmood and Hanafi (2013), competitive advantage can partially mediate the relationship between performance and entrepreneurial orientation. They clarify that the significance of sources of competitive advantage might channel the relationship between entrepreneurial orientation and SME performance (Faulks et al. 2021). Based on contingency theory, cost leadership strategy is considered a mediator. The empirical work of Haseeb et al. (2019) examined the mediating role of cost leadership strategy between management control systems and firm sustainability. Alkasim et al. (2018) examined the mediating effect of cost leadership strategy between market strategy and firm performance. Celikyay and Adiguzel (2019) examined the mediating role of cost leadership between technology orientation and product innovation. Although studies have generally found a positive correlation between entrepreneurial approach and company performance, there is significant variance in this effect, suggesting that competitive advantage neither mediates nor modifies this association. Competitive advantage is one of the success criteria for women’s business performance. This demonstrates that the company’s internal resources, which are distinct from those possessed by other businesses, are the basis of the competitive advantage. Therefore, having a competitive edge can magnify the favorable influence that an entrepreneurial attitude has on SMEs’ performance. In the prior literature, cost leadership strategy is well grounded as a mediator. But there has been a lack of research in the EO and SME context. Thus, the following hypothesis has been proposed: Finally, Figure 1 shows the theoretical framework.
H6. 
The relationship between EO and firm performance is mediated by cost leadership.

4. Research Methodology

This study examines the role of EO and cost leadership strategy in achieving SMEs’ performance. Based on the study objectives, the target population is Malaysian service SMEs. According to SME Corporation Malaysia (2014), a small enterprise having a regular number of employees between 5 to less than 30 is categorized as small, and a firm having employees between 30 ≤ 75 is categorized as a medium enterprise. The selection of service SMEs is based on factors such as higher establishment and the largest workforce attached to the services sector. Moreover, this sector is a more productive and growth-oriented economic segment. The sampling frame is based on FMM (Federation Malaysian Manufacturers) and CCM (Company Commission Malaysia). The prior literature highlighted that FMM and CCM are considered the sampling frame (Ali and Johl 2022d). The data are collected from service SMEs in Malaysia’s three states: Selangor, Kula Lumpur, and Johor. According to Department of Statistics Malaysia (2020), the economic contributions of these states are more than 50% compared with the rest of the states.
Furthermore, a higher number of SMEs are established in these states. To reach the study population, a simple random sampling technique is adopted. Moreover, the sample size is calculated based on Krejcie and Morgan (1970); based on the table, the final sample size is 383. Additionally, the unit of analysis is SME enterprises. Fan et al. (2021) argued that the EO concept hovers around the organization rather than individuals. The targeted respondent for this research is SME owner/managers. In the EO–performance literature, researchers argued that SME owners/managers are well informed about the firm internal and external environment and performance. Moreover, they make decisions regarding the adoption of strategy and new technology.
To collect the data from the respondent, a survey technique is adopted. In the survey technique, an online questionnaire was used to collect data. The online questionnaire link was sent to 600 SMEs, and 316 questionnaires were received. The response rate of data collection was 52.6%. After data screening and preliminary data analysis, 283 responses were found valid for further analysis (Ali and Johl 2022c; Mazhar et al. 2021). The quantitative method with a cross-sectional design guides the research work. A 5-point Likert scale is adopted to measure the questionnaires, where 1 represents “strongly disagree” and 5 represents “strongly agree”. Before actual data collection, the pretesting and pilot testing steps are performed. The pilot testing results indicate that all the variables achieved the threshold value of reliability—additionally, the PLS-SEM technique was used to analyze the collected data through SmartPLS.

Measures

The structure of the scales was determined by referring to previously used measures. However, to apply to the present study, we made a few minor modifications. To measure the variables, constructs items are adapted from the past literature. Proactiveness was measured through five items adapted from Le Roux et al. (2014) and Li et al. (2009), which measure the concept of the capability of the firm to foresee shifts in market conditions; in particular, shifts in consumer trends; it consequently refers to a proactive attitude to capitalize on market opportunities. A firm’s propensity to engage in risky endeavors that have unpredictable repercussions, such as exposure to debts and risky investments, is what is meant by the term “risk-taking”. The risk-taking construct was measured through five items adapted from Le Roux et al. (2014) and Li et al. (2009). The competitive aggressiveness of a company refers to its demeanor when interacting with other businesses in the industry. It consists of continuously monitoring and combating competitors’ techniques (even if it means imitating other companies) to gain a competitive edge and perform more effectively. Competitive aggressiveness was measured through five items adapted from Le Roux et al. (2014) and Li et al. (2009). The concept of autonomy refers to a tendency toward favorable situations for the creation and, later, the implementation of new ideas. One definition of autonomy in the workplace is a culture that encourages new ventures without stifling creative expression at the individual level. Autonomy was measured through five items adapted from Alvarez-Torres et al. (2019) and Li et al. (2009). Open innovation refers to a dispersed invention process built on the purposefully managed flow of information across organizational borders. This type of innovation uses monetary and non-monetary incentives, and it is aligned with the firm’s business model. Open innovation was measured through five items adapted from Fu et al. (2019). Cost leadership is known to produce services at lower costs than possible competitors to achieve competitiveness. In this research, cost leadership is a mediating variable measured through five items adapted from Bayraktar et al. (2017). Finally, firm performance is the dependent variable measured through five items adapted from Fang et al. (2021).

5. Data Analysis and Findings

5.1. Demographic Analysis

Table 1 shows the demographic analysis. From the table, regarding the number of employees, it can be seen that 52% of the respondents fall within the category of 5–74 full-time employees, whereas 48% of respondents related to medium-size firms, which have more than 74 full employees, but fewer than or equal to 200. Likewise, for the estimated sales turnover, 54% of respondents chose USD 65,218–USD 652,173; however, 46% of firms have an estimated sale of USD 652,173–USD 4,347,826. For the firm/company ownership, Chinese were the highest (149 or 52.7%), followed by Bumiputera (101 or 37.5%). Indians represent only 33 or 11.7%, whereas no foreign-owned company participated in this survey. Lastly, the industry of the respondents indicated that 65 or 23% were from the wholesale and retail trade and the repair of motor vehicles and motorcycles; 12 or 4.2% were from food and beverages services; 44 or 15.5% were from transportation and storage; 50 or 17.7% were from professional services; 2 or 0.7% were from real estate; 50 or 17 were from education, arts, entertainment, and recreation; 5 or 2.5% were from accommodation; and 41 or 14.5% were from information and technology. Electricity, gas, steam, and air conditioning supply contributed 4.2% or 12 responses. Lastly, administrative and support services, water supply and waste management, and others had zero participation in this study.

5.2. Descriptive Analysis

Table 2 shows the mean and standard deviation values for all the variables. It is clearly shown that the mean values of all variables are close to 4.0, meaning each variable is perceived as important by the respondents, as they tend to agree with all the statements. Firm performance has the highest mean (4.169), indicating that respondents tend to agree with all the statements related to this variable. Similarly, proactiveness is rated as the second variable achieving the highest level of agreement from the respondents, indicating that they are satisfied with and consider these aspects important during their business life. However, open innovation is rated as the least important (mean 3.319). Lastly, the standard deviation scores indicate that the data are clustered closely around the mean and, therefore, are more reliable. Additionally, skewness and kurtosis statistics are shown in Table 2. The past literature indicated that distribution shape and sample size are used to measure normality (Hair et al. 2019). The threshold value of skewness and kurtosis are ±2 (Hair et al. 2019). Table 2 indicates that normality is not an issue for further analysis.

5.3. PLS-SEM Analysis

5.3.1. Assessment of Measurement Model

The measurement model evaluates the input of each item in representing its related constructs, and measures how well the combined set of items symbolizes the construct (Hair et al. 2019). Researchers often evaluate measurement models by determining measurement reliability and validity, i.e., individual item reliability, internal consistency reliability, convergent validity, and discriminant validity (Hair et al. 2019; Henseler et al. 2009).
Constructs’ internal consistency reliability can be assessed by composite reliability (CR) or Cronbach’s alpha (CA) (Peterson and Kim 2013). However, CA was criticized for undermining true reliability (Hair et al. 2019). Hence, in this study, CR is presented. Bagozzi and Yi (1988) and Hair et al. (2019) suggest that CR values should be at least 0.70. Table 3 shows that the CR values of the constructs surpassed the acceptable minimum level of 0.70, indicating satisfactory internal consistency reliability of the measurement used. Additionally, item loading results are also reported in Table 3. The threshold value of reliability is 0.708 (Hair et al. 2017). Thus, 33 items were retained in the whole model as loadings above 0.70.
The average variance extracted (AVE) of the constructs Is used to assess the convergent validity of the constructs of the current study. AVE values describe the average variance shared between a construct and its associated indicator (Fornell and Larcker 1981). Typically, if AVE values are 0.5 or more, it indicates adequate convergent validity (Ali et al. 2022). Table 3 shows that the AVE values ranged from 0.506 to 0.713, indicating that all the constructs displayed satisfactory levels of convergent validity. Figure 2 shows the measurement model.

Discriminant Validity

Discriminant validity is another criterion that evaluates the extent to which a construct is not the same as other constructs (Hair et al. 2010). Discriminant validity can also be seen as the degree to which a variable differs from other variables (Duarte and Raposo 2010). In this study, therefore, discriminant validity was ascertained using the square root of a variable’s AVE (Fornell and Larcker 1981), loadings and cross-loadings (Chin 1998), and heterotrait–monotrait ratio (HTMT) (Henseler et al. 2015). As shown in Table 4, the square root of the AVE (bolded values) was greater than the correlations of the constructs, signifying sufficient discriminant validity.
In addition, a more reliable criterion (HTMT) ratio for assessing discriminant validity was examined, as suggested by previous studies (Ali et al. 2022; Hair et al. 2019; Henseler et al. 2015). In this study, as shown in Table 5, the highest correlation is within the conventional yardstick of 0.85 or 0.90 (Henseler et al. 2015); hence, the HTMT criterion displays satisfactory discriminant validity.
The results of the measurement model in this study show that all the constructs’ reliability and validity were sufficiently achieved. Therefore, it reinforces further analysis of the structural (inner) model to examine the associations among the variables under study (Henseler et al. 2016).

5.3.2. Structural Model Assessment

After assessing and fulfilling the measurement model requirements (reliability and validity), the succeeding phase was to appraise the structural model (inner model). The key standards in PLS-SEM for evaluating the inner model are the assessment of the significance of the path coefficients, the effect size (f2), the coefficient of determination (R2), and predictive relevance (Q2). The inner model of the current study encompassed the main effects model, where the direct link between variables was tested, as well as the mediating influence, where open innovation was incorporated into the relationship. Figure 3 shows the full inner model (main and mediating effect). In the current study, all the relationships are presented by beta values. In addition, the significance level was set at p < 0.01 and p < 0.05 (1-tailed) in testing both the direct relationships and the mediating effect. Table 6 shows the hypothesis analysis. Based on the results, H2, H3, and H4 are accepted, and H1 and H5 are rejected.

5.3.3. Mediation Analysis

After evaluating the main effect between exogenous and endogenous latent variables, the study evaluated the relationships when the mediator (indirect effect) is included. In testing the mediation effect, various statistical techniques are available to choose from. These approaches have merit/demerits regarding availability, computational ease, software, and empirical performance (Falk and Biesanz 2016). However, “reliance on traditional methods (e.g., Sobel’s test) likely results in many indirect effects that go undetected due to statistical power that is too low” Falk and Biesanz (2016, p. 11). Consequently, in this study, a bootstrapping approach (Hair et al. 2019; Hayes 2009; Preacher and Hayes 2008) was employed to assess the mediation effect. This method is favored for mediation analysis when using Smart-PLS software. Accordingly, if the lower and upper limits of the confidence interval do not straddle a zero in between, then it can be concluded that there is significant mediation.
Therefore, from the result in Table 7, using a bootstrapping procedure with 5000 subsamples, Open Innovation → Cost Leadership → Firm Performance (β = 0.210, t = 4.727, p = 0.000), Risk-taking → Cost Leadership → Firm Performance (β = −0.153, t = 4.137, p = 0.020), and Competitive Aggressiveness → Cost Leadership → Firm Performance (β = 0.241, t = 3.790, p = 0.000) were significant where lower and upper limits of confidence intervals for all stated relationships do not contain zero in between. However, Proactiveness → Cost Leadership → Firm Performance (β = −0.031, t = 0.700, p = 0.484) and Autonomy → Cost Leadership → Firm Performance (β = −0.041, t = 0.735, p = 0.000) and their lower and upper limits of confidence intervals do contain zero in between; hence, they were not significant and, therefore, not supported. In a nutshell, cost leadership has a full mediation between risk-taking, open innovation, and firm performance, and partial mediation between competitive aggressiveness and performance.
Moreover, the coefficient of determination (R2) and predictive relevance (Q2) analysis have been performed. As recommended by Cohen (1988), they were categorized, and the value of R2 of 0.02 is weak, 0.13 is moderate, and 0.26 is substantial. Table 8 shows the R2 values and indicates that cost leadership (0.401) and firm performance (0.505) have a substantial value of R2. Additionally, the blindfolding technique was adopted to calculate the model’s predictive relevance (Q2). If a Q2 value of endogenous constructs for a certain dependent (s) latent variable is greater than zero, its explanatory latent variable displays predictive relevance. Table 8 shows the Q2 values of latent variables.

6. Discussion and Conclusions

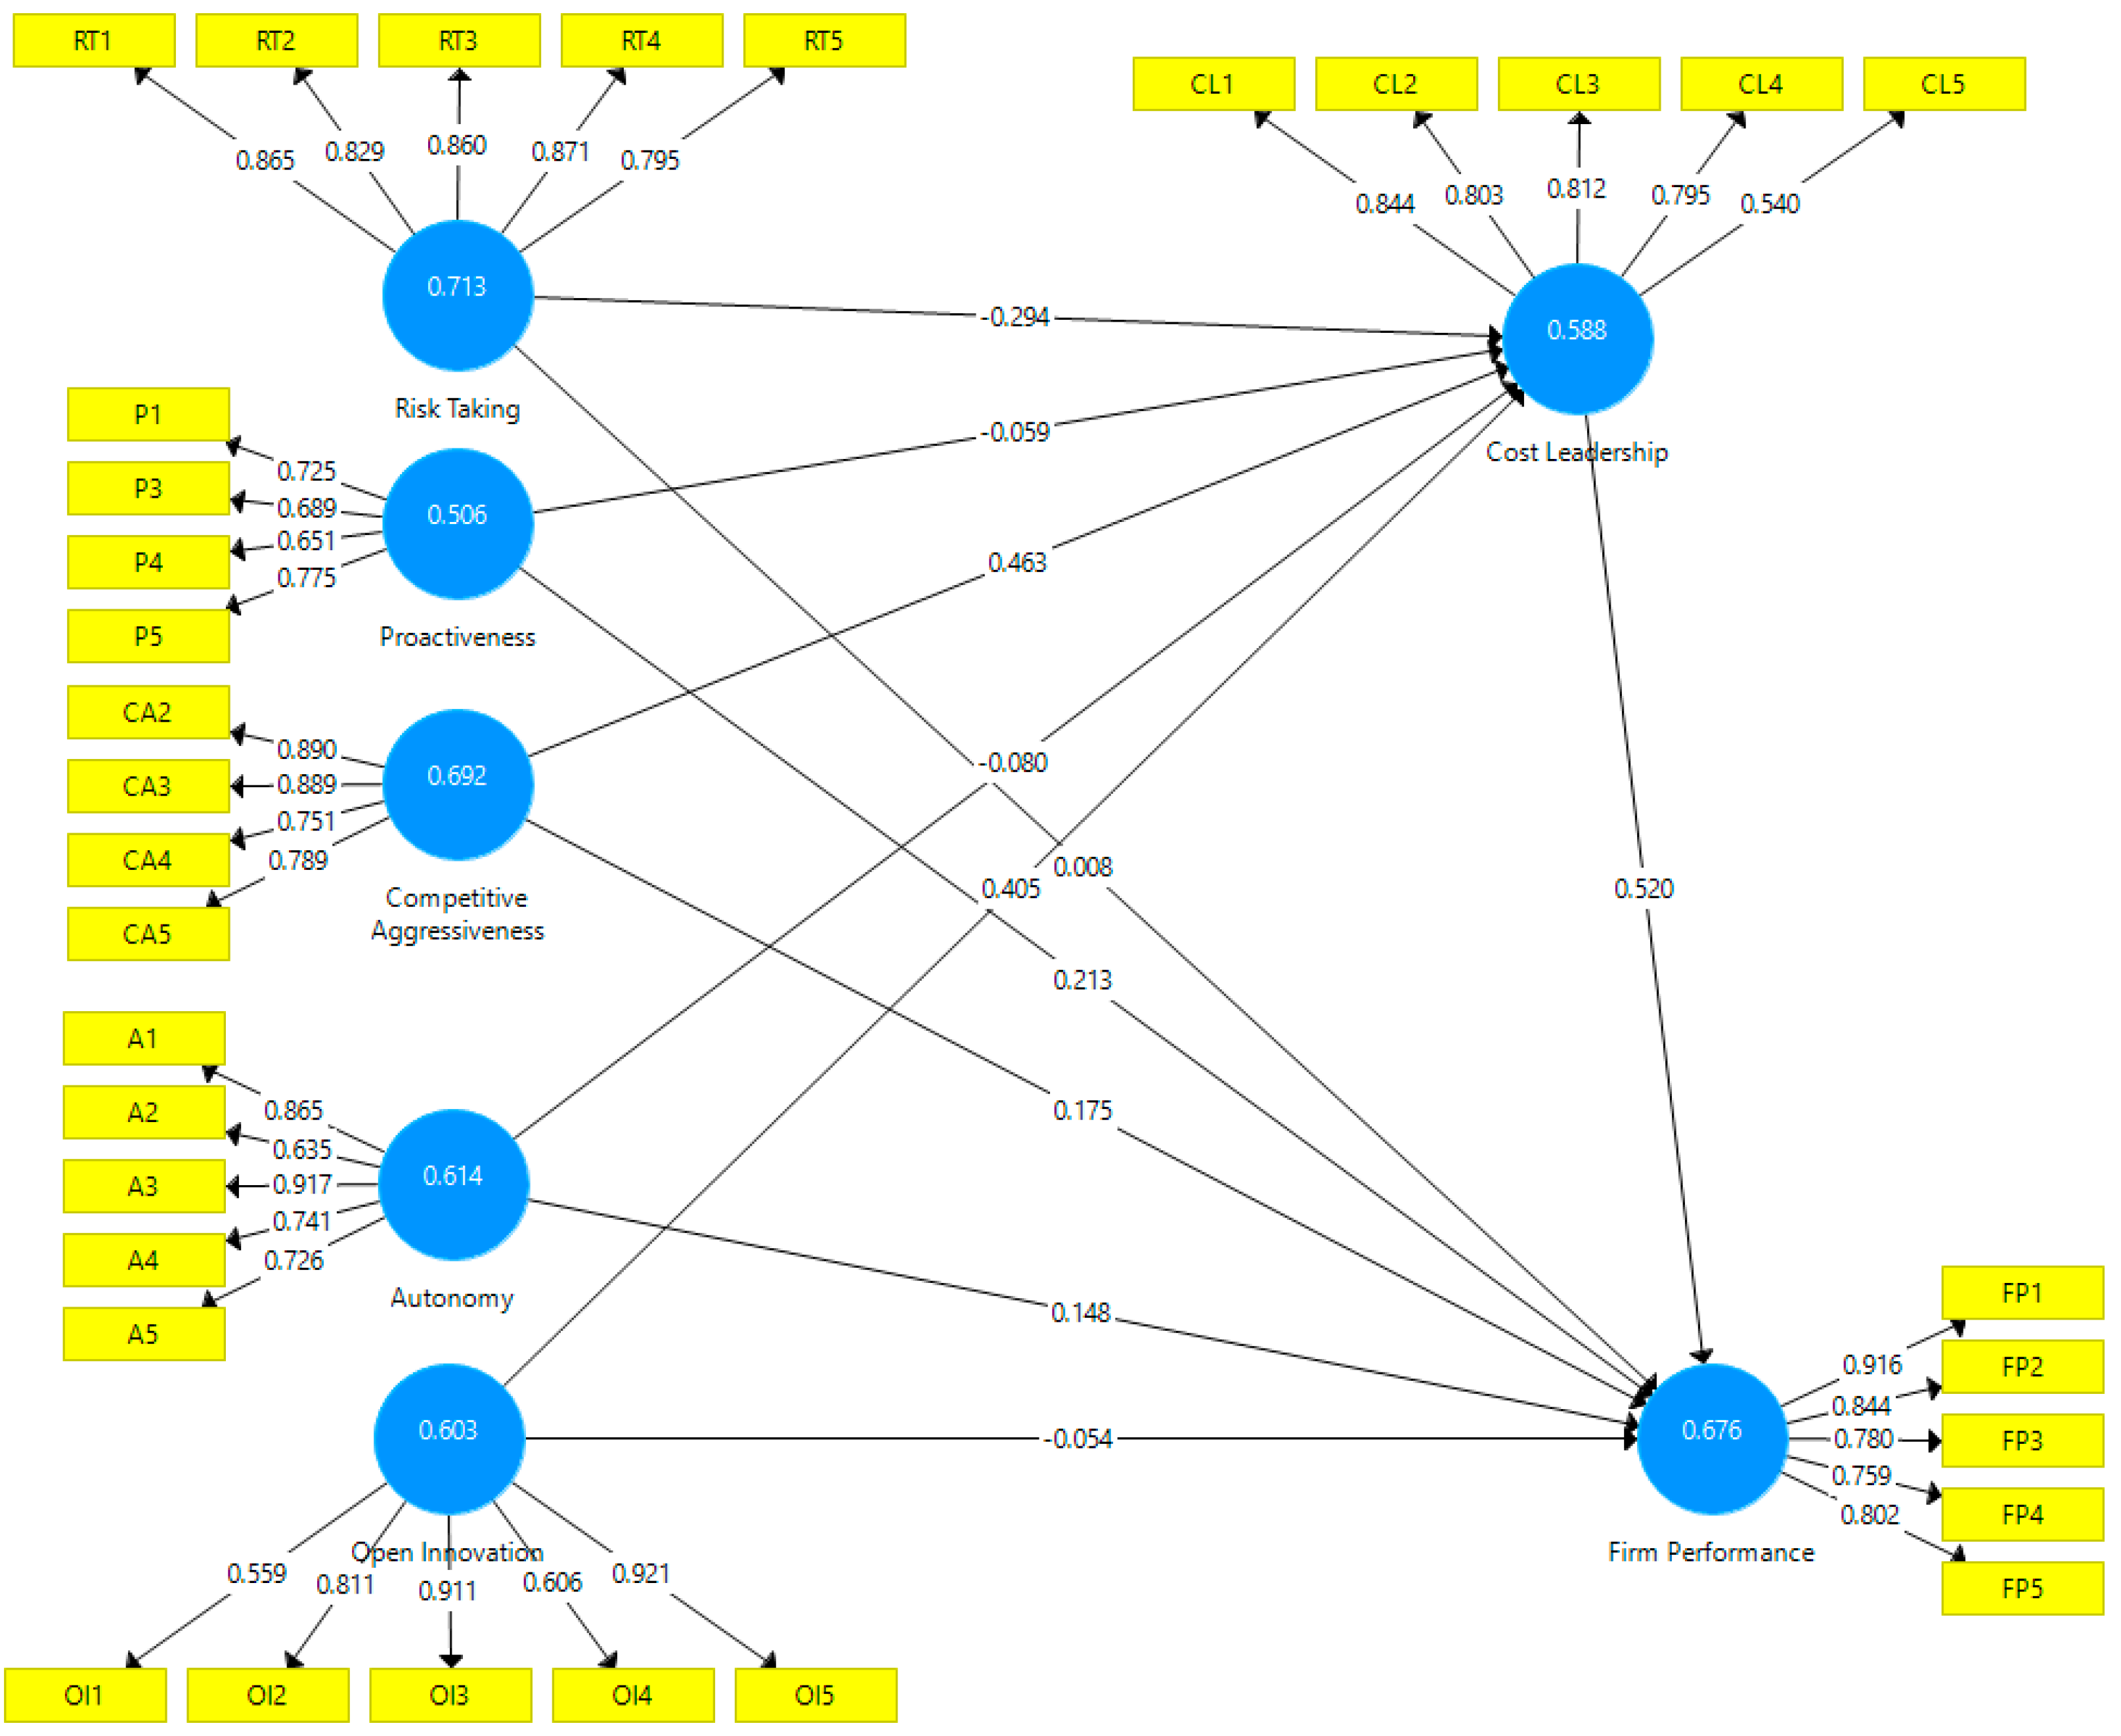
This section presents a discussion of the statistical findings of the current study, the major objective of which is to examine the relationship between the exogenous variables (autonomy, proactiveness, competitive aggressiveness, open innovation, risk-taking) and the dependent variable (firm performance) through the mediating role of cost leadership.
The empirical findings highlight that risk-taking has no direct relationship with Malaysian SMEs’ performance. Thus, H1 has been rejected. Risk-taking and the capacity to have the lowest costs are typically the outcomes of innovativeness, whether incremental or radical, which is one of the reasons for the unfavorable results in this research. To undercut rivals, a cost leadership strategy offers an internal orientation in which the organization focuses on efficiency and cost management. Marketing standardized goods is a common way to save costs (generally of low added value).
As a consequence, investing resources in activities such as experimentation, risk-taking, or innovation may jeopardize the successful execution of a cost leadership strategy (Dhliwayo 2014). Furthermore, the findings highlight that proactiveness is significantly related to SMEs’ performance. Fan et al. (2021) and Alvarez-Torres et al. (2019) support this study’s findings. Therefore, H2 has been accepted. Likewise, competitive aggressiveness and autonomy have a positive and significant relationship with SMEs’ performance; thus, H3 and H4 are accepted. These results are supported by the past literature. For instance, Alvarez-Torres et al. (2019) found a positive and significant relationship between SMEs’ performance in the Mexican context. The empirical work of Susanto et al. (2021) found that EO has a positive relationship with SME performance in developing economies. The empirical findings surprisingly highlight that open innovation and firm performance have no direct association. Hence, H5 has been rejected. The findings are supported by the past literature. Zhang et al. (2018) argued that there is a lack of technical work in SMEs. They further argued that education is essential to promote innovation in organizations.
Finally, the study hypothesized that cost leadership strategy has a mediating role between EO and SME performance. The empirical findings highlight that cost leadership has a full mediation between risk-taking, open innovation, and firm performance, and partial mediation between competitive aggressiveness and performance. On the other hand, cost leadership is often based on price competitiveness, in which the business is already aware of market demand and, hence, offers a comparable product at a lower price (Linton and Kask 2017). However, the research is unclear on how risk-taking and cost leadership interact. As a result, hypothesis 7 proposed that risk-taking is linked to cost leadership. Cost leadership aims to achieve the lowest cost structure for a similar service while also increasing efficiency. A cost-cutting plan requires a framework that prioritizes controls and accountability for outcomes via work standards (Brock 2014). Small businesses are often characterized by a lack of formalization and simple control systems (Birley and Norburn 1985; Lechner and Leyronas 2009), resulting in increased autonomy. A top-down strategy is often related to cost leadership, but bottom-up initiatives are frequently bolstered by autonomy. Autonomy should be limited to adopting a cost leadership approach (Lechner and Gudmundsson 2014).

6.1. Contributions and Implications

This study addresses the essential need for greater research on the intersection between EO postures, open innovation, and competitive strategy by revealing how these factors interact and affect company performance when they work together. The uniqueness of the current study is using cost leadership as a mediating variable between EO, open innovation, and firm performance. To the best of the researcher’s ability, the limited study adopted cost leadership as a mediating variable between EO, open innovation, and firm performance.
The SMEs sector is often regarded as the most important global economic growth and development driver. It also contributes to poverty alleviation by giving jobs. This study aids and stimulates SMEs to embrace creative concepts and fresh techniques to improve society’s tendencies. Poor and under-supported cultures in developing countries, for example, are often unable to launch large-scale businesses. As a result, EO, open innovation, and strategies may provide new ways to improve performance.
Furthermore, the research has contributed to the area of entrepreneur development strategies. Despite SMEs’ low risk-taking proclivity, government agencies’ efforts to promote healthy growth and development will need to be re-strategized. New methods and techniques must include not just the low risk-taking proclivity of SME entrepreneurs, but also the long-term plan of instilling a higher-risk-taking culture among them. According to a previous study, culture significantly impacts an entrepreneur’s risk-taking behavior; hence, the acculturation of entrepreneurial risk-taking behavior must begin early in the family and community. Efforts to convert Malaysian society toward entrepreneurship must be stepped up, and it would be more successful if the government developed a long-term entrepreneurship strategy to assure a steady supply of dynamic and resilient entrepreneurs and those who are more risk-averse. Once SME entrepreneurs’ risk-taking propensity is greater, it may be easier for the currently existing SMEs to grow into stronger and larger entrepreneurial entities that will help the country’s economic development. In summary, organizations engaged in developing entrepreneurs, ministries, financial institutions, and government economic planners in the nation must build and enhance the risk-taking propensities of entrepreneurs via innovative techniques and tactics (Salleh and Ibrahim 2013).

6.1.1. Theoretical Contributions

From a theoretical standpoint, it has been shown that combining the various sub-components of EO may result in improved performance. Linton and Kask have proposed this theory (2017). The major sub-components in this research include risk-taking autonomy, competitive aggressiveness, and proactiveness, which vary from the significant sub-components discovered by Linton and Kask (2017). This demonstrates that the statistical significance of the EO sub-component varies depending on the data sample. The research on the sub-components of EO reveals that the mix of these components and how they interact together is critical for achieving the best firm performance (Zhang et al. 2018). The organization must create a supporting framework to guarantee that its staff should have the necessary resources and competencies to support the EO sub-component capability’s drive. Through the sub-components of innovativeness and risk-taking, it is obvious in this research that organizations will profit from not being extremely entrepreneurial. Instead, they should concentrate on the other three sub-components, which are glamorous and positively impact corporate performance.

6.1.2. Practical Implications

This research makes several practical contributions that will be advantageous to SMEs’ owners, managers, and policymakers. From a practical standpoint, the most important management consequence of the research is that SME enterprises must build distinctive cost leadership within their divisions to improve performance and compete in changing marketplaces. Similarly, to improve performance, businesses must foster an entrepreneurial atmosphere. Both variables assist organizations in making balanced investments in various product development activities and avoid large investments in riskier ventures to secure long-term success. For companies operating in developing markets, it is worth noting that EO and cost leadership help them achieve outstanding performance and improve it. Similarly, responsible managers of firms operating in established markets may pay close attention to cost leadership to improve performance. To be more specific, Malaysian businesses must prioritize cost leadership, followed by EO, to grow and survive. The results assist the government and the Small and Medium Enterprises Development Authority in formulating policies and initiating programs for SMEs’ development and sustainability. The importance of SMEs in the country’s economic progress should not be overlooked. Because Malaysia has characteristics of both developing and established markets, the conclusions of this research may assist other nations in altering their policies to enhance SME development and ensure the industrial sector’s survival. For example, the global business sector has a high failure rate, and many businesses fail to survive for lengthy periods. As a result, the researchers believe that a company’s internal skills should be reinforced to adapt to unforeseen shocks and market pressures. This research indicates that EO is more important for performance enhancement. Many enterprises fail in the early stages of development in both developed and emerging economies due to resource constraints. This study allows freshly created businesses to use less costly strategies to improve performance. Furthermore, owing to a lack of assistance and harsh market circumstances, EO and cost leadership are critical for SMEs’ performance.

6.2. Limitations and Future Research Avenues

As with previous studies, this one has recognized several limitations that indicate promising areas for future research and may need to be considered in the future, such as the data and target demographic, as we only looked at one developing market. The current study looked for a direct effect of EO and cost leadership dimensions on performance, although earlier research has shown that various variables may influence the link between EO and SMEs’ performance. Kantur (2016), for example, claimed that strategic entrepreneurship has a complete mediating function between EO performance in developing markets or that strategic entrepreneurship mediates between cost leadership and SMEs’ success. Similarly, other researchers have shown that awareness creation (Li et al. 2009), strategic partnerships (Brouthers et al. 2015), and other moderators and mediators may exaggerate the association between EO and performance. Furthermore, Chryssochoidis et al. (2016) discovered that although competitive strategy does not directly boost performance, it does mediate the connection via internal capacities. As a result, an additional study may be performed to examine the link between EO and cost leadership, as well as other potential moderators, such as financial capacities and executive and owner characteristics, because a company that wants to pursue entrepreneurial activities and differentiated product development methodologies may need financial assistance. Furthermore, since the research is being undertaken in an emerging market, a comparison study may be conducted to acquire useful data from other countries concerning the relevance of EO and cost leadership in financial and non-financial performance. The current study has discovered that different dimensions of EO have different effects on firm functions and performance; it will be interesting to see if these findings hold for a larger population of firms and if there are other dimensions of EO and other functions within the firm that can be distinguished. The approach is now being evaluated for SMEs in Malaysia. Future research might broaden the scope of the study to include bigger enterprises and firms from different nations.
Furthermore, like other EO investigations, the present study used cross-sectional data, which precludes the unequivocal proof of underlying causation between the dimensions of interest. According to Miller (2011), the EO literature mostly depends on self-reported and perceptual measurements, which might lead to respondent bias in the sample. The difficulties of retrieving data on SMEs, particularly in cultures such as Malaysia, where most economic activity is done off the books, are well recognized. Still, future studies will benefit from establishing alternative EO metrics that employ archival data. The study is also aware that in countries such as Malaysia, significant differences exist between different parts of the country and the extent to which support for the predictions tested here varies between samples drawn from different regions of the country, which is something that needs to be investigated further in the future.
Similarly, more research is needed to see whether the conclusions of this study can be applied to other growing economies such as Thailand, Indonesia, and India. Furthermore, several contextual elements, such as leadership traits, organizational culture, and internal reward and reinforcement processes, have an impact on a company. These variables will have an impact on the relationship between EO and performance, and they should be investigated further. Evaluating the impact on EO of these many aspects, whether from the environment or inside the organization, might be a suitable starting point for future study.

Author Contributions

Conceptualization, M.K.C. and K.L.A.; Data curation, M.K.C.; Formal analysis, M.K.C.; Investigation, S.M.; Methodology, M.K.C. and K.L.A.; Project administration, S.M.; Resources, S.M.; Supervision, K.L.A. and S.M.; Validation, K.L.A.; Writing—original draft, M.K.C. and K.L.A.; Writing—review & editing, S.M. All authors have read and agreed to the published version of the manuscript.

Funding

This research received no external funding.

Institutional Review Board Statement

Not applicable.

Informed Consent Statement

Not applicable.

Data Availability Statement

Availability on request.

Conflicts of Interest

The authors declare no conflict of interest.

References

  1. Abiodun, Tope Samson. 2017. An examination of the relationships between different types of innovation and firm performance and the mediating effect of radical and incremental Innovations on these relationships. International Journal of Innovation and Economic Development 3: 38–58. [Google Scholar] [CrossRef] [Green Version]
  2. Ali, Kashif, and Satirenjit Kaur Johl. 2022a. Critical success factors of Total Quality Management practices using Pareto analysis. International Journal of Productivity and Quality Management 36: 353–81. [Google Scholar] [CrossRef]
  3. Ali, Kashif, and Satirenjit Kaur Johl. 2022b. Impact of total quality management on industry 4.0 readiness and practices: Does firm size matter? International Journal of Computer Integrated Manufacturing, 1–23. [Google Scholar] [CrossRef]
  4. Ali, Kashif, and Satirenjit Kaur Johl. 2022c. Impact of Total Quality Management on SMEs Sustainable Performance in the Context of Industry 4.0. In Proceedings of International Conference on Emerging Technologies and Intelligent Systems (ICETIS 2021). Lecture Notes in Networks and Systems. Edited by Mostafa Al-Emran, Mohammed A. Al-Sharafi, Mohammed N. Al-Kabi and Khaled Shaalan. Cham: Springer, vol. 299. [Google Scholar] [CrossRef]
  5. Ali, Kashif, and Satirenjit Kaur Johl. 2022d. Soft and hard TQM practices: Future research agenda for industry 4.0. Total Quality Management & Business Excellence 33: 1625–55. [Google Scholar] [CrossRef]
  6. Ali, Kashif, Satirenjit Kaur Johl, Amgad Muneer, Ayed Alwadain, and Rao Faizan Ali. 2022. Soft and Hard Total Quality Management Practices Promote Industry 4.0 Readiness: A SEM-Neural Network Approach. Sustainability 14: 11917. [Google Scholar] [CrossRef]
  7. Alkasim, Sidi Bello, Haim Hilman, Abdul Manaf bin Bohari, Shahmir Sivaraj Abdullah, and Mohd Rashdan Sallehddin. 2018. The mediating effect of cost leadership on the relationship between market penetration, market development, and firm performance. Journal of Business and Retail Management Research 12: 190–200. [Google Scholar] [CrossRef] [Green Version]
  8. Alsharif, Hussain Zaid H., Tong Shu, Bojan Obrenovic, Danijela Godinic, Ashraf Alhujailli, and Alisher Makhmudovich Abdullaev. 2021. Impact of Entrepreneurial Leadership and Bricolage on Job Security and Sustainable Economic Performance: An Empirical Study of Croatian Companies during COVID-19 Pandemic. Sustainability 13: 11958. [Google Scholar] [CrossRef]
  9. Alvarez-Torres, Francisco Javier, Gabriela Citlalli Lopez-Torres, and Giovanni Schiuma. 2019. Linking entrepreneurial orientation to SMEs’ performance: Implications for entrepreneurship universities. Management Decision 57: 3364–86. [Google Scholar] [CrossRef]
  10. Bagozzi, Richard P., and Youjae Yi. 1988. On the evaluation of structural equation models. Journal of the Academy of Marketing Science 16: 74–94. [Google Scholar] [CrossRef]
  11. Bayraktar, Cahit Ali, Gulsah Hancerliogullari, Basak Cetinguc, and Fethi Calisir. 2017. Competitive strategies, innovation, and firm performance: An empirical study in a developing economy environment. Technology Analysis & Strategic Management 29: 38–52. [Google Scholar]
  12. Bin Yusoff, Mohd Nor Hakimin, Fakhrul Anwar Zainol, Mohamad Ismail, Jati Kasuma, and Dio Caisar Darma. 2021. Usage of Public Financial Support Services, Entrepreneurial Orientation and Sme Performance: The Case of Malaysia. Financial Internet Quarterly ‘e-Finan’ 17: 12–26. [Google Scholar] [CrossRef]
  13. Birley, Sue, and David Norburn. 1985. Small vs. large companies: The entrepreneurial conundrum. Journal of Business Strategy 6: 81–87. [Google Scholar] [CrossRef]
  14. Brock, Avril. 2014. Practitioners, professionalism and reflection on role. In The Early Years Reflective Practice Handbook. London: Routledge, pp. 51–64. [Google Scholar]
  15. Brouthers, Keith D., George Nakos, and Pavlos Dimitratos. 2015. SME entrepreneurial orientation, international performance, and the moderating role of strategic alliances. Entrepreneurship Theory and Practice 39: 1161–87. [Google Scholar] [CrossRef]
  16. Butkouskaya, Vera, Joan Llonch-Andreu, and María-del-Carmen Alarcón-del-Amo. 2020. Entrepreneurial orientation (EO), integrated marketing communications (IMC), and performance in small and medium-sized enterprises (SMEs): Gender gap and inter-country context. Sustainability 12: 7159. [Google Scholar] [CrossRef]
  17. Celikyay, Mehmet, and Zafer Adiguzel. 2019. Analysis of product innovation performances in terms of competitive strategies of companies in production sector under the influence of technology orientation. International Journal of Organizational Leadership 8: 43–59. [Google Scholar] [CrossRef]
  18. Chin, Wynne W. 1998. Commentary: Issues and Opinion on Structural Equation Modeling. JSTOR 2: vii–xvi. [Google Scholar]
  19. Chryssochoidis, George, Dimitrios Dousios, and Nikolaos Tzokas. 2016. Small firm adaptive capability, competitive strategy, and performance outcomes: Competing mediation vs. moderation perspectives. Strategic Change 25: 441–66. [Google Scholar] [CrossRef] [Green Version]
  20. Cohen, Jacob. 1988. Statistical Power Analysis for the Behavioural Sciences. Hillsdale: Lawrence Erlbaum Associates. [Google Scholar]
  21. Dhliwayo, Shepherd. 2014. Entrepreneurship and competitive strategy: An integrative approach. The Journal of Entrepreneurship 23: 115–35. [Google Scholar] [CrossRef]
  22. Department of Statistics Malaysia. 2020. Small and Medium (SMES) Performance 2020; Kuala Lumpur: DOSM. Available online: https://www.dosm.gov.my/v1/index.php?r=column/cthemeByCat&cat=159&bul_id=KzdrS25pRTZ1VGFkcTlNY0FEc-zBYUT09&menu_id=TE5CRUZCblh4ZTZMODZIbmk2aWRRQT09 (accessed on 1 June 2022).
  23. Duarte, Paulo Alexandre O., and Mário Lino B. Raposo. 2010. A PLS model to study brand preference: An application to the mobile phone market. In Handbook of Partial Least Squares. Berlin and Heidelberg: Springer, pp. 449–85. [Google Scholar]
  24. Falk, Carl F., and Jeremy C. Biesanz. 2016. Two cross-platform programs for inferences and interval estimation about indirect effects in mediational models. Sage Open 6: 2158244015625445. [Google Scholar] [CrossRef] [Green Version]
  25. Fan, Mingyue, Sikandar Ali Qalati, Muhammad Aamir Shafique Khan, Syed Mir Muhammad Shah, Muhammad Ramzan, and Raza Saleem Khan. 2021. Effects of entrepreneurial orientation on social media adoption and SME performance: The moderating role of innovation capabilities. PLoS ONE 16: e0247320. [Google Scholar] [CrossRef]
  26. Fang, Gu Gui, Sikandar Ali Qalati, Dragana Ostic, Syed Mir Muhammad Shah, and Manzoor Ali Mirani. 2021. Effects of entrepreneurial orientation, social media, and innovation capabilities on SME performance in emerging countries: A mediated–moderated model. Technology Analysis & Strategic Management 34: 1326–38. [Google Scholar] [CrossRef]
  27. Fatima, Tehreem, and Ahmad Raza Bilal. 2019. Achieving SME performance through individual entrepreneurial orientation: An active social networking perspective. Journal of Entrepreneurship in Emerging Economies 12: 399–411. [Google Scholar] [CrossRef]
  28. Faulks, Baira, Yinghua Song, Moses Waiganjo, Bojan Obrenovic, and Danijela Godinic. 2021. Impact of Empowering Leadership, Innovative Work, and Organizational Learning Readiness on Sustainable Economic Performance: An Empirical Study of Companies in Russia during the COVID-19 Pandemic. Sustainability 13: 12465. [Google Scholar] [CrossRef]
  29. Fornell, Claes, and David F. Larcker. 1981. Structural equation models with unobservable variables and measurement error: Algebra and statistics. Journal of Marketing Research 18: 382–88. [Google Scholar] [CrossRef]
  30. Fu, Lihua, Zhiying Liu, and Zhangqing Zhou. 2019. Can open innovation improve firm performance? An investigation of financial information in the biopharmaceutical industry. Technology Analysis & Strategic Management 31: 776–90. [Google Scholar]
  31. Galbreath, Jeremy, Lorenzo Lucianetti, Ben Thomas, and Daniel Tisch. 2020. Entrepreneurial orientation and firm performance in Italian firms: The moderating role of competitive strategy. International Journal of Entrepreneurial Behavior & Research 26: 629–46. [Google Scholar]
  32. Hair, Joe, Carole L. Hollingsworth, Adriane B. Randolph, and Alain Yee Loong Chong. 2017. An Updated and Expanded Assessment of Pls-Sem in Information Systems Research. Industrial Management & Data Systems 117: 442–58. [Google Scholar]
  33. Hair, Joseph F., Marko Sarstedt, and Christian M. Ringle. 2019. Rethinking some of the rethinking of partial least squares. European Journal of Marketing 53: 566–84. [Google Scholar] [CrossRef]
  34. Hair, Joseph F., William C. Black, Barry J. Babin, and Rolph E. Anderson. 2010. Multivariate Data Analysis, 7th ed. Upper Saddle River: Prentice Hall. [Google Scholar]
  35. Haseeb, Muhammad, Marcin Lis, Ilham Haouas, and Leonardus W. W. Mihardjo. 2019. The mediating role of business strategies between management control systems package and firms stability: Evidence from SMEs in Malaysia. Sustainability 11: 4705. [Google Scholar] [CrossRef] [Green Version]
  36. Hayes, Andrew F. 2009. Beyond Baron and Kenny: Statistical mediation analysis in the new millennium. Communication Monographs 76: 408–20. [Google Scholar] [CrossRef]
  37. Henseler, Jörg, Christian M. Ringle, and Marko Sarstedt. 2015. A New Criterion for Assessing Discriminant Validity in Variance-Based Structural Equation Modeling. Journal of the Academy of Marketing Science 43: 115–35. [Google Scholar] [CrossRef] [Green Version]
  38. Henseler, Jörg, Christian M. Ringle, and Marko Sarstedt. 2016. Testing measurement invariance of composites using partial least squares. International Marketing Review 33: 405–31. [Google Scholar] [CrossRef]
  39. Henseler, Jörg, Christian M. Ringle, and Rudolf R. Sinkovics. 2009. The use of partial least squares path modeling in international marketing. In New Challenges to International Marketing. Bingley: Emerald Group Publishing Limited. [Google Scholar]
  40. Hernández-Linares, Remedios, Franz W. Kellermanns, María Concepción López-Fernández, and Soumodip Sarkar. 2019. The effect of socioemotional wealth on the relationship between entrepreneurial orientation and family business performance. BRQ Business Research Quarterly. [Google Scholar] [CrossRef]
  41. Hernández-Perlines, Felipe, and Manuel Alejandro Ibarra Cisneros. 2017. Analysis of the moderating effect of entrepreneurial orientation on the influence of social responsibility on the performance of Mexican family companies. Cogent Business & Management 4: 1408209. [Google Scholar]
  42. Hung, Kuang-Peng, and Christine Chou. 2013. The impact of open innovation on firm performance: The moderating effects of internal R&D and environmental turbulence. Technovation 33: 368–80. [Google Scholar]
  43. Hussain, Ali, Ding Hooi Ting, and Muhammad Mazhar. 2022. Driving consumer value co-creation and purchase intention by social media advertising value. Frontiers in Psychology 13: 1–13. [Google Scholar] [CrossRef] [PubMed]
  44. Irwin, Kristin C., Karen M. Landay, Joshua R. Aaron, William C. McDowell, Louis D. Marino, and Patrick R. Geho. 2018. Entrepreneurial orientation (EO) and human resources outsourcing (HRO): A “HERO” combination for SME performance. Journal of Business Research 90: 134–40. [Google Scholar] [CrossRef]
  45. Isichei, Ejikeme Emmanuel, Kalu Emmanuel Agbaeze, and Maria Onyejeche Odiba. 2020. Entrepreneurial orientation and performance in SMEs: The mediating role of structural infrastructure capability. International Journal of Emerging Markets 15: 1219–41. [Google Scholar] [CrossRef]
  46. Kantur, Deniz. 2016. Strategic entrepreneurship: Mediating the entrepreneurial orientation-performance link. Management Decision 54: 24–43. [Google Scholar] [CrossRef]
  47. Kessler, Eric H., ed. 2013. Encyclopedia of Management Theory. London: Sage Publications. [Google Scholar]
  48. Krejcie, Robert V., and Daryle W. Morgan. 1970. Determining sample size for research activities. Educational and Psychological Measurement 30: 607–10. [Google Scholar] [CrossRef]
  49. Le Roux, Ingrid, and Kenneth M. K. Bengesi. 2014. Dimensions of entrepreneurial orientation and small and medium enterprise performance in emerging economies. Development Southern Africa 31: 606–24. [Google Scholar] [CrossRef] [Green Version]
  50. Lechner, Christian, and Christophe Leyronas. 2009. Small–business group formation as an entrepreneurial development model. Entrepreneurship Theory and Practice 33: 645–67. [Google Scholar] [CrossRef]
  51. Lechner, Christian, and Sveinn Vidar Gudmundsson. 2014. Entrepreneurial orientation, firm strategy and small firm performance. International Small Business Journal 32: 36–60. [Google Scholar] [CrossRef]
  52. Li, Yong-Hui, Jing-Wen Huang, and Ming-Tien Tsai. 2009. Entrepreneurial orientation and firm performance: The role of knowledge creation process. Industrial Marketing Management 38: 440–49. [Google Scholar] [CrossRef]
  53. Linton, Gabriel, and Johan Kask. 2017. Configurations of entrepreneurial orientation and competitive strategy for high performance. Journal of Business Research 70: 168–76. [Google Scholar] [CrossRef]
  54. Lumpkin, G. Tomas, and Gregory G. Dess. 1996. Clarifying the entrepreneurial orientation construct and linking it to performance. Academy of Management Review 21: 135–72. [Google Scholar] [CrossRef]
  55. Lumpkin, G. Thomas, and Gregory G. Dess. 2001. Linking two dimensions of entrepreneurial orientation to firm performance: The moderating role of environment and industry life cycle. Journal of Business Venturing 16: 429–51. [Google Scholar] [CrossRef]
  56. Mahmood, Rosli, and Norshafizah Hanafi. 2013. Entrepreneurial orientation and business performance of women-owned small and medium enterprises in Malaysia: Competitive advantage as a mediator. International Journal of Business and Social Science (IJBSS) 4: 82–90. [Google Scholar]
  57. Mazhar, Muhammad, Ding Hooi Ting, Ali Hussain, Muhammad Aamir Nadeem, Muhammad Asghar Ali, and Umaima Tariq. 2021. The Role of Service Recovery in Post-purchase Consumer Behavior During COVID-19: A Malaysian Perspective. Frontiers in Psychology 12: 786603. [Google Scholar] [CrossRef]
  58. Mazhar, Muhammad, Ding Hooi Ting, Amir Zaib Abbasi, Muhammad Aamir Nadeem, and Haider Ali Abbasi. 2022a. Gauging customers’ negative disconfirmation in online post-purchase behaviour: The moderating role of service recovery. Cogent Business & Management 9: 2072186. [Google Scholar]
  59. Mazhar, Muhammad, Muhammad Amir Nadeem, Haider Ali Abbasi, Umaima Tariq, Amin Jan, and Rao Abdul Hannan Jaffar. 2022b. Reparation for Service Failure Through Service Recovery: An Assessment of Consumer Behaviour in an Online Shopping Context. Business Management and Strategy 13: 64–87. [Google Scholar] [CrossRef]
  60. Meekaewkunchorn, Nusanee, Katarzyna Szczepańska-Woszczyna, Chaiyawit Muangmee, Nuttapon Kassakorn, and Bilal Khalid. 2021. Entrepreneurial orientation and SME performance: The mediating role of learning orientation. Economics and Sociology 14: 294–312. [Google Scholar] [CrossRef]
  61. Miller, Danny. 1983. The correlates of entrepreneurship in three types of firms. Management Science 29: 770–791. [Google Scholar] [CrossRef]
  62. Miller, Danny. 2011. Miller (1983) revisited: A reflection on EO research and some suggestions for the future. Entrepreneurship Theory and Practice 35: 873–94. [Google Scholar] [CrossRef]
  63. Miller, Ralph R., and Louis D. Matzel. 1988. The comparator hypothesis: A response rule for the expression of associations. In Psychology of Learning and Motivation. Cambridge: Academic Press, vol. 22, pp. 51–92. [Google Scholar]
  64. Naidu, Samantha, Gurmeet Singh, and Jashwini Narayan. 2021. Revisiting the contingency theory: Dissection of entrepreneurial orientation elements in retail franchisee performance. International Journal of Emerging Markets. [Google Scholar] [CrossRef]
  65. Nguyen, Phuong V., Hien Thi Ngoc Huynh, Long Nguyen Hai Lam, Toan Bao Le, and Nghi Hong Xuan Nguyen. 2021. The impact of entrepreneurial leadership on SMEs’ performance: The mediating effects of organizational factors. Heliyon 7: e07326. [Google Scholar] [CrossRef]
  66. Oltra, María J., M. Luisa Flor, and José A. Alfaro. 2018. Open innovation and firm performance: The role of organizational mechanisms. Business Process Management Journal 24: 814–36. [Google Scholar] [CrossRef]
  67. Peterson, Robert A., and Yeolib Kim. 2013. On the relationship between coefficient alpha and composite reliability. Journal of Applied Psychology 98: 194. [Google Scholar] [CrossRef]
  68. Preacher, Kristopher J., and Andrew F. Hayes. 2008. Asymptotic and resampling strategies for assessing and comparing indirect effects in multiple mediator models. Behavior Research Methods 40: 879–91. [Google Scholar] [CrossRef]
  69. Rezaei, Jafar, and Roland Ortt. 2018. Entrepreneurial orientation and firm performance: The mediating role of functional performances. Management Research Review 41: 878–900. [Google Scholar] [CrossRef] [Green Version]
  70. Salleh, Fauzilah, and Mohamed Dahlan Ibrahim. 2013. The relationship between risk-taking propensity and demographic characteristics among MSEs in Malaysia. Journal for Global Business Advancement 6: 38–49. [Google Scholar] [CrossRef]
  71. Shirokova, Galina, Karina Bogatyreva, Tatiana Beliaeva, and Sheila Puffer. 2016. Entrepreneurial orientation and firm performance in different environmental settings: Contingency and configurational approaches. Journal of Small Business and Enterprise Development 23: 703–27. [Google Scholar] [CrossRef]
  72. SME Corporation Malaysia. 2014. Guideline for New Sme Definition. Kuala Lumpur: National SME Development Council. [Google Scholar]
  73. Susanto, Perengki, Mohammad Enamul Hoque, Najeeb Ullah Shah, Andel Hopi Candra, Nik Mohd Hazrul Nik Hashim, and Nor Liza Abdullah. 2021. Entrepreneurial orientation and performance of SMEs: The roles of marketing capabilities and social media usage. Journal of Entrepreneurship in Emerging Economies. [Google Scholar] [CrossRef]
  74. Wang, Catherine L. 2008. Entrepreneurial orientation, learning orientation, and firm performance. Entrepreneurship Theory and Practice 32: 635–57. [Google Scholar] [CrossRef]
  75. Williams, Paul, Nicholas Ashill, and Earl Naumann. 2017. Toward a contingency theory of CRM adoption. Journal of Strategic Marketing 25: 454–74. [Google Scholar] [CrossRef]
  76. Zarrouk, Hajer, Mohamed Sherif, Laura Galloway, and Teheni El Ghak. 2020. Entrepreneurial orientation, access to financial resources and SME’ business performance: The case of the United Arab Emirates. The Journal of Asian Finance, Economics and Business 7: 465–74. [Google Scholar] [CrossRef]
  77. Zhang, Si, Delin Yang, Shumin Qiu, Xiang Bao, and Jizhen Li. 2018. Open innovation and firm performance: Evidence from the Chinese mechanical manufacturing industry. Journal of Engineering and Technology Management 48: 76–86. [Google Scholar] [CrossRef]
Figure 1. Theoretical framework.
Admsci 13 00001 g001
Figure 2. Measurement Model.
Admsci 13 00001 g002
Figure 3. Structural Model (Direct Effect).
Admsci 13 00001 g003
Table 1. Demographic Statistics.
VariableLabelFrequencyPercentage
Firm size (employees)5–2914752%
30–7513648%
Estimated sales turnoverLess than USD 65,21700%
USD 65,218–USD 652,17315354%
USD 652,173–USD 4,347,82613046%
Firm/Company ownershipBumiputera10137.5%
Chinese14952.7%
Indian3311.7%
Foreign Owned00%
IndustryWholesale and retail trade and repair of motor vehicles and motorcycles6523.0%
Food and beverages services124.2%
Transportation and storage4415.5%
Professional services5017.7%
Administrative and support service00%
Real estate activities20.7%
Education, arts, entertainment, and recreation5017.7%
Accommodation72.5%
Information and technology4114.5%
Water supply and waste management00%
Electricity, gas, steam, and air conditioning supply124.2%
Others00%
Table 2. Descriptive analysis.
ConstructsNMeanS.D.SkewnessKurtosis
Risk-taking2833.7140.833−0.40−0.77
Proactiveness2834.0600.4880.36−0.70
Competitive aggressiveness2833.4470.744−0.46−0.73
Autonomy2833.9230.602−0.26−0.62
Cost leadership2833.9970.566−0.36−0.68
Open innovation2833.3180.811−0.33−0.53
Firm performance2834.1680.537−0.34−0.60
Table 3. Assessment of measurement model.
ConstructsItemsLoadingsCRAVE
AutonomyA10.8650.8870.614
A20.635
A30.917
A40.741
A50.726
Competitive AggressivenessCA20.8900.8990.692
CA30.889
CA40.751
CA50.789
Cost LeadershipCL10.8440.8750.588
CL20.803
CL30.812
CL40.795
CL50.540
Firm PerformanceFP10.9160.9120.676
FP20.844
FP30.780
FP40.759
FP50.802
Open InnovationOI10.5590.8800.603
OI20.811
OI30.911
OI40.606
OI50.921
ProactivenessP10.7250.8030.506
P30.689
P40.651
P50.775
Risk-takingRT10.8650.9250.713
RT20.829
RT30.860
RT40.871
RT50.795
Table 4. Discriminant Validity (Fornell–Larcker).
Constructs1234567
1Autonomy0.784
2Competitive Aggressiveness0.0930.832
3Cost Leadership−0.0160.4840.767
4Firm Performance0.2050.5170.6110.822
5Open Innovation0.2820.5040.4880.4080.777
6Proactiveness0.2890.4630.1590.4040.3490.711
7Risk-taking0.2600.5040.0430.2210.3640.3890.844
Note: Diagonals (in bold) represent the square root of the average variance extracted (AVE), whereas the off-diagonals are correlations among constructs. Diagonal elements should be larger than off-diagonal elements to establish discriminant validity.
Table 5. Discriminant Validity (HTMT).
Constructs1234567
1Autonomy
2Competitive Aggressiveness0.308
3Cost Leadership0.1830.581
4Firm Performance0.2500.5810.719
5Open Innovation0.3830.5550.5570.418
6Proactiveness0.4210.6090.2030.4990.468
7Risk-taking0.3030.5590.1420.2430.3860.513
Table 6. Hypothesis analysis.
Relationshipsβt-Valuesf2p-ValuesLLCIULCIDecision
H1: Risk-taking → Firm Performance0.0080.1400.0010.888−0.1220.122Not Supported
H2: Proactiveness → Firm Performance0.2133.1850.0640.0020.0850.340Supported
H3: Competitive Aggressiveness → Firm Performance0.1752.7100.0290.0070.0470.304Supported
H4: Autonomy → Firm Performance0.1482.2850.0370.0230.0030.260Supported
H5: Open Innovation → Firm Performance−0.0540.6060.0030.545−0.2390.118Not Supported
Table 7. Mediation analysis.
Relationshipsβt-Valuesf2p-ValuesLLCIULCIDecision
Open Innovation → Cost Leadership → Firm Performance0.2104.7270.1860.0010.1250.298Supported
Risk-taking → Cost Leadership → Firm Performance−0.1534.1370.0980.001−0.239−0.088Supported
Proactiveness → Cost Leadership → Firm Performance−0.0310.7000.0040.484−0.130.044Not Supported
Competitive Aggressiveness → Cost Leadership → Firm Performance0.2413.7900.2000.0010.1120.353Supported
Autonomy → Cost Leadership → Firm Performance−0.0410.7350.0090.462−0.1330.075No Supported
Table 8. R2 and Q2 values.
Latent VariablesR2Q2
Firm Performance0.5050.329
Cost Leadership0.4010.234
Disclaimer/Publisher’s Note: The statements, opinions and data contained in all publications are solely those of the individual author(s) and contributor(s) and not of MDPI and/or the editor(s). MDPI and/or the editor(s) disclaim responsibility for any injury to people or property resulting from any ideas, methods, instructions or products referred to in the content.

