
Seeing as Feeling? The Impact of Tactile Compensation Videos on Consumer Purchase Intention

Abstract
:1. Introduction
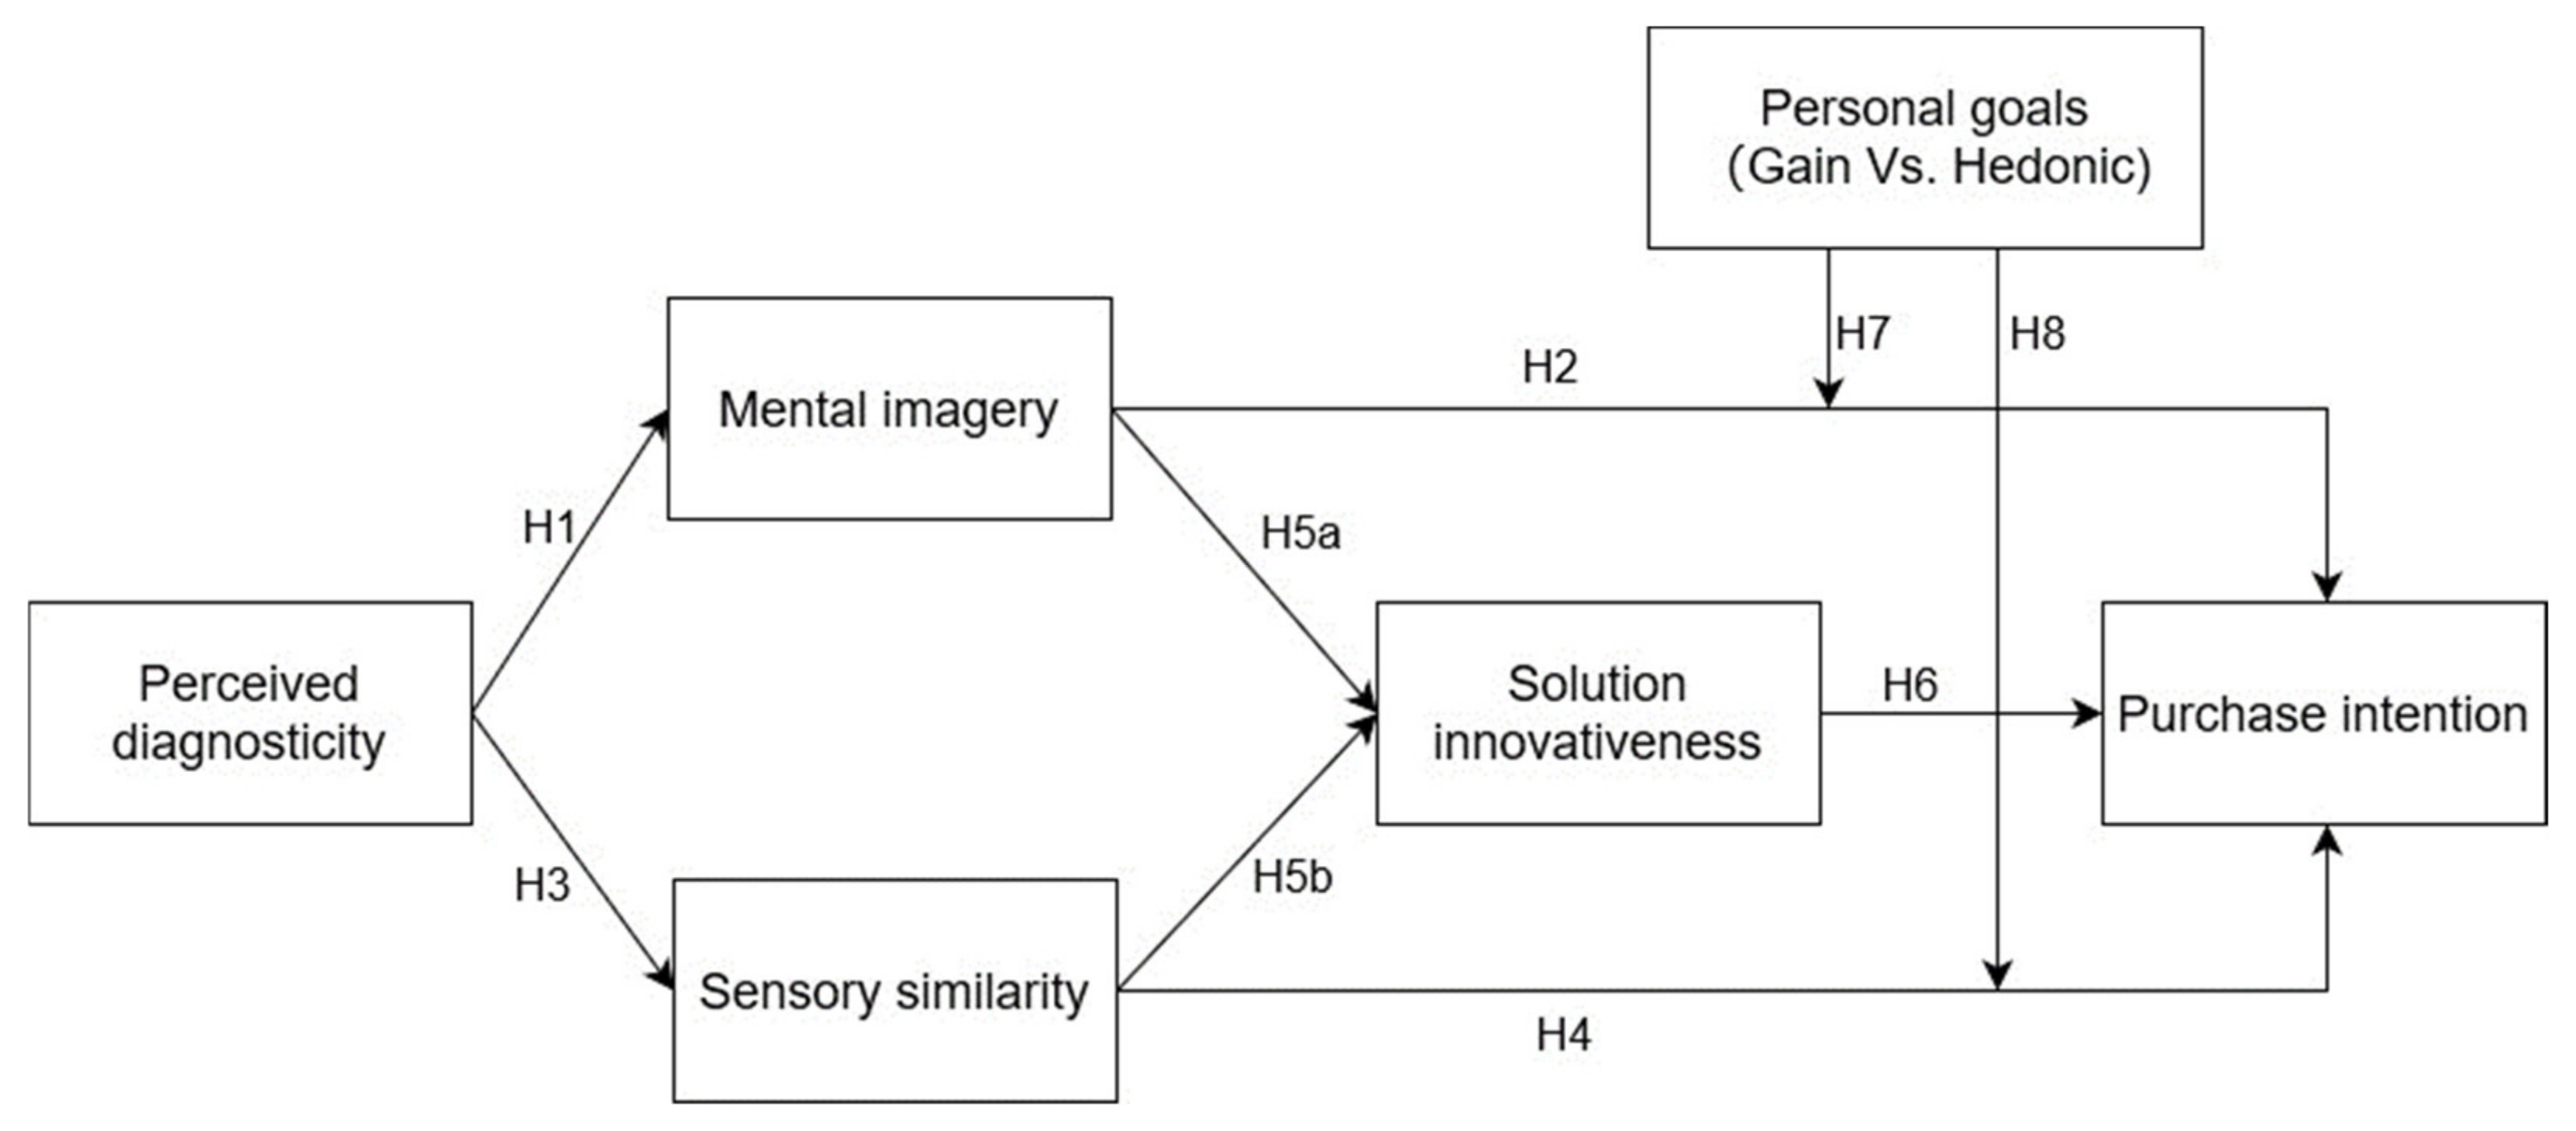
2. Literature Review and Hypotheses Development
2.1. Visual–Tactile Compensation and Perceived Diagnosticity
2.2. Mental Imagery
2.3. Sensory Similarity
2.4. Solution Innovativeness
2.5. The Moderating Role of Personal Goals
3. Methodology
3.1. Measurement
3.2. Pretest
3.3. Materials and Data Collection
4. Data Analysis and Results
4.1. Reliability and Validity Tests
4.2. Model Hypothesis Testing
4.3. Moderating Effects
5. Discussion and Implications
5.1. Discussion
5.2. Theoretical Implications
5.3. Management Implications
6. Research Limitations and Recommendations
Author Contributions
Funding
Institutional Review Board Statement
Informed Consent Statement
Data Availability Statement
Conflicts of Interest
References
- Van Kerrebroeck, H.; Willems, K.; Brengman, M. Touching the void: Exploring consumer perspectives on touch-enabling technologies in online retailing. Int. J. Retail. Distrib. Manag. 2017, 45, 892–909. [Google Scholar] [CrossRef]
- Pantoja, F.; Borges, A.; Rossi, P.; Yamim, A.P. If I touch it, I will like it! The role of tactile inputs on gustatory perceptions of food items. J. Retail. Consum. Serv. 2020, 53, 101958. [Google Scholar] [CrossRef]
- Streicher, M.C.; Estes, Z. Multisensory interaction in product choice: Grasping a product affects choice of other seen products. J. Consum. Psychol. 2016, 26, 558–565. [Google Scholar] [CrossRef]
- Grohmann, B.; Spangenberg, E.R.; Sprott, D.E. The influence of tactile input on the evaluation of retail product offerings. J. Retail. 2007, 83, 237–245. [Google Scholar] [CrossRef]
- Krishna, A. An integrative review of sensory marketing: Engaging the senses to affect perception, judgment and behavior. J. Consum. Psychol. 2012, 22, 332–351. [Google Scholar] [CrossRef]
- Peck, J.; Childers, T.L. To Have and To Hold: The Influence of Haptic Information on Product Judgments. J. Mark. 2003, 67, 35–48. [Google Scholar] [CrossRef]
- Rathee, R.; Rajain, P. Online shopping environments and consumer’s Need for Touch. J. Adv. Manag. Res. 2019, 16, 814–826. [Google Scholar] [CrossRef]
- Alzayat, A.; Lee, S.H.M. Virtual products as an extension of my body: Exploring hedonic and utilitarian shopping value in a virtual reality retail environment. J. Bus. Res. 2021, 130, 348–363. [Google Scholar] [CrossRef]
- Sun, C.; Fang, Y.; Kong, M.; Chen, X.; Liu, Y. Influence of augmented reality product display on consumers’ product attitudes: A product uncertainty reduction perspective. J. Retail. Consum. Serv. 2022, 64, 102828. [Google Scholar] [CrossRef]
- Brengman, M.; Willems, K.; Van Kerrebroeck, H. Can’t touch this: The impact of augmented reality versus touch and non-touch interfaces on perceived ownership. Virtual Real. 2019, 23, 269–280. [Google Scholar] [CrossRef]
- Uhm, J.; Kim, S.; Do, C.; Lee, H. How augmented reality (AR) experience affects purchase intention in sport E-commerce: Roles of perceived diagnosticity, psychological distance, and perceived risks. J. Retail. Consum. Serv. 2022, 67, 103027. [Google Scholar] [CrossRef]
- Felip, F.; Galán, J.; Contero, M.; García-García, C. Touch Matters: The Impact of Physical Contact on Haptic Product Perception in Virtual Reality. Appl. Sci. 2023, 13, 2649. [Google Scholar] [CrossRef]
- Pino, G.; Amatulli, C.; Nataraajan, R.; De Angelis, M.; Peluso, A.M.; Guido, G. Product touch in the real and digital world: How do consumers react? J. Bus. Res. 2020, 112, 492–501. [Google Scholar] [CrossRef]
- Luangrath, A.W.; Peck, J.; Hedgcock, W.; Xu, Y. Observing Product Touch: The Vicarious Haptic Effect in Digital Marketing and Virtual Reality. J. Mark. Res. 2022, 59, 306–326. [Google Scholar] [CrossRef]
- Silva, S.C.; Rocha, T.V.; De Cicco, R.; Galhanone, R.F.; Manzini Ferreira Mattos, L.T. Need for touch and haptic imagery: An investigation in online fashion shopping. J. Retail. Consum. Serv. 2021, 59, 102378. [Google Scholar] [CrossRef]
- Herz, M.; Diamantopoulos, A. I Use it but Will Tell You that I Don’t: Consumers’ Country-of-Origin Cue Usage Denial. J. Int. Mark. 2017, 25, 52–71. [Google Scholar] [CrossRef]
- Yoo, J.; Kim, M. The effects of online product presentation on consumer responses: A mental imagery perspective. J. Bus. Res. 2014, 67, 2464–2472. [Google Scholar] [CrossRef]
- Blazquez Cano, M.; Perry, P.; Ashman, R.; Waite, K. The influence of image interactivity upon user engagement when using mobile touch screens. Comput. Hum. Behav. 2017, 77, 406–412. [Google Scholar] [CrossRef]
- Helmefalk, M.; Hultén, B. Multi-sensory congruent cues in designing retail store atmosphere: Effects on shoppers’ emotions and purchase behavior. J. Retail. Consum. Serv. 2017, 38, 1–11. [Google Scholar] [CrossRef]
- Orús, C.; Gurrea, R.; Flavián, C. Facilitating imaginations through online product presentation videos: Effects on imagery fluency, product attitude and purchase intention. Electron. Commer. Res. 2017, 17, 661–700. [Google Scholar] [CrossRef]
- Kempf, D.; Smith, R. Consumer processing of product trial and the influence of prior advertising: A structural modeling approach. J. Mark. Res. 1998, 35, 325–338. [Google Scholar] [CrossRef]
- Løkke Andersen, C.B.; Wang, Q.J.; Giacalone, D. User experience design approaches for accommodating high “need for touch” consumers in ecommerce. J. Sens. Stud. 2022, 37, e12727. [Google Scholar] [CrossRef]
- Yim, M.Y.; Baek, T.H.; Sauer, P.L. I See Myself in Service and Product Consumptions: Measuring Self-transformative Consumption Vision (SCV) Evoked by Static and Rich Media. J. Interact. Mark. 2018, 44, 122–139. [Google Scholar] [CrossRef]
- Kosslyn, S.M.; Ganis, G.; Thompson, W.L. Neural foundations of imagery. Nat. Rev. Neurosci. 2001, 2, 635–642. [Google Scholar] [CrossRef]
- Lee, W.; Gretzel, U. Designing persuasive destination websites: A mental imagery processing perspective. Tour. Manag. 2012, 33, 1270–1280. [Google Scholar] [CrossRef]
- Eklund, A.A.; Helmefalk, M. Seeing through touch: A conceptual framework of visual-tactile interplay. J. Prod. Brand Manag. 2018, 27, 498–513. [Google Scholar] [CrossRef]
- Racat, M.; Capelli, S.; Lichy, J. New insights into ‘technologies of touch’: Information processing in product evaluation and purchase intention. Technol. Forecast. Soc. Change 2021, 170, 120900. [Google Scholar] [CrossRef]
- Jha, S.; Balaji, M.S.; Peck, J.; Oakley, J.; Deitz, G.D. The Effects of Environmental Haptic Cues on Consumer Perceptions of Retailer Warmth and Competence. J. Retail. 2020, 96, 590–605. [Google Scholar] [CrossRef]
- Kim, Y.; Lee, M.; Park, S. Shopping value orientation: Conceptualization and measurement. J. Bus. Res. 2014, 67, 2884–2890. [Google Scholar] [CrossRef]
- Grewal, D.; Roggeveen, A.L.; Nordfält, J. The Future of Retailing. J. Retail. 2017, 93, 1–6. [Google Scholar] [CrossRef]
- Cheng, Z.; Shao, B.; Zhang, Y. Effect of Product Presentation Videos on Consumers’ Purchase Intention: The Role of Perceived Diagnosticity, Mental Imagery, and Product Rating. Front. Psychol. 2022, 13, 812579. [Google Scholar] [CrossRef]
- Elder, R.S.; Krishna, A. The “Visual Depiction Effect” in Advertising: Facilitating Embodied Mental Simulation through Product Orientation. J. Consum. Res. 2012, 38, 988–1003. [Google Scholar] [CrossRef]
- Lv, X.; Li, H.; Xia, L. Effects of haptic cues on consumers’ online hotel booking decisions: The mediating role of mental imagery. Tour. Manag. 2020, 77, 104025. [Google Scholar] [CrossRef]
- Bolos, L.A.; Lagerkvist, C.; Edenbrant, A.K.; Nayga, R.M. Consumer preferences for visually sub-optimal food: Role of information framing and personal goals. Resour. Conserv. Recycl. 2022, 184, 106426. [Google Scholar] [CrossRef]
- Lindenberg, S.; Steg, L. Normative, Gain and Hedonic Goal Frames Guiding Environmental Behavior. J. Soc. Issues 2007, 63, 117–137. [Google Scholar] [CrossRef]
- Peck, J.; Childers, T.L.; David, G.M.S.A. Individual Differences in Haptic Information Processing: The “Need for Touch” Scale. J. Consum. Res. 2003, 30, 430–442. [Google Scholar] [CrossRef]
- Peck, J.; Barger, V.A.; Webb, A. In search of a surrogate for touch: The effect of haptic imagery on perceived ownership. J. Consum. Psychol. 2013, 23, 189–196. [Google Scholar] [CrossRef]
- Overmars, S.; Poels, K. Online product experiences: The effect of simulating stroking gestures on product understanding and the critical role of user control. Comput. Hum. Behav. 2015, 51, 272–284. [Google Scholar] [CrossRef]
- Jiang, Z.H.; Benbasat, I. Virtual product experience: Effects of visual and functional control of products on perceived diagnosticity and flow in electronic shopping. J. Manag. Inf. Syst. 2004, 21, 111–147. [Google Scholar] [CrossRef]
- Klatzky, R.L.; Lederman, S.J.; Matula, D.E. Imagined haptic exploration in judgments of object properties. J. Exp. Psychol. Learn. Mem. Cogn. 1991, 17, 314–322. [Google Scholar] [CrossRef]
- Marks, D.F. Consciousness, mental imagery and action. Br. J. Psychol. 1999, 90, 567–585. [Google Scholar] [CrossRef]
- MacInnis, D.J.; Price, L.L. The Role of Imagery in Information Processing: Review and Extensions. J. Consum. Res. 1987, 13, 473. [Google Scholar] [CrossRef]
- Lee, K.; Li, H.; Edwards, S.M. The effect of 3-D product visualisation on the strength of brand attitude. Int. J. Advert. 2012, 31, 377–396. [Google Scholar] [CrossRef]
- Anema, H.A.; de Haan, A.M.; Gebuis, T.; Dijkerman, H.C. Thinking about touch facilitates tactile but not auditory processing. Exp. Brain Res. 2012, 218, 373–380. [Google Scholar] [CrossRef] [PubMed]
- Liu, Y.A.; Jiang, Z.J.; Chan, H.C. Touching Products Virtually: Facilitating Consumer Mental Imagery with Gesture Control and Visual Presentation. J. Manag. Inf. Syst. 2019, 36, 823–854. [Google Scholar] [CrossRef]
- Heller, J.; Chylinski, M.; de Ruyter, K.; Mahr, D.; Keeling, D.I. Let Me Imagine That for You: Transforming the Retail Frontline Through Augmenting Customer Mental Imagery Ability. J. Retail. 2019, 95, 94–114. [Google Scholar] [CrossRef]
- Cheng, P.; Zhang, C. Show me insides: Investigating the influences of product exploded view on consumers’ mental imagery, comprehension, attitude, and purchase intention. J. Retail. Consum. Serv. 2023, 70, 103168. [Google Scholar] [CrossRef]
- Maier, E.; Dost, F. Fluent contextual image backgrounds enhance mental imagery and evaluations of experience products. J. Retail. Consum. Serv. 2018, 45, 207–220. [Google Scholar] [CrossRef]
- Ruusunen, N.; Hallikainen, H.; Laukkanen, T. Does imagination compensate for the need for touch in 360-virtual shopping? Int. J. Inf. Manag. 2023, 70, 102622. [Google Scholar] [CrossRef]
- Desmichel, P.; Kocher, B. Luxury Single- versus Multi-Brand Stores: The Effect of Consumers’ Hedonic Goals on Brand Comparisons. J. Retail. 2020, 96, 203–219. [Google Scholar] [CrossRef]
- Larkey, L.B.; Markman, A.B. Processes of Similarity Judgment. Cogn. Sci. 2005, 29, 1061–1076. [Google Scholar] [CrossRef] [PubMed]
- Klatzky, R.L.; Lederman, S.J.; Matula, D.E. Haptic exploration in the presence of vision. J. Exp. Psychol. Hum. Percept. Perform. 1993, 19, 726–743. [Google Scholar] [CrossRef] [PubMed]
- Yoon, S.; Bang, H.; Choi, D.; Kim, K. Slow versus fast: How speed-induced construal affects perceptions of advertising messages. Int. J. Advert. 2021, 40, 225–245. [Google Scholar] [CrossRef]
- Lu, B.; Chen, Z. Live streaming commerce and consumers’ purchase intention: An uncertainty reduction perspective. Inf. Manag. 2021, 58, 103509. [Google Scholar] [CrossRef]
- Kunz, W.; Schmitt, B.; Meyer, A. How does perceived firm innovativeness affect the consumer? J. Bus. Res. 2011, 64, 816–822. [Google Scholar] [CrossRef]
- Pappu, R.; Quester, P.G. How does brand innovativeness affect brand loyalty? Eur. J. Mark. 2016, 50, 2–28. [Google Scholar] [CrossRef]
- Kim, J.; Kim, K.H.; Garrett, T.C.; Jung, H. The Contributions of Firm Innovativeness to Customer Value in Purchasing Behavior. J. Prod. Innov. Manag. 2015, 32, 201–213. [Google Scholar] [CrossRef]
- Lin, C. Conceptualizing and measuring consumer perceptions of retailer innovativeness in Taiwan. J. Retail. Consum. Serv. 2015, 24, 33–41. [Google Scholar] [CrossRef]
- Jiang, K.; Qin, M.; Li, S. Chatbots in retail: How do they affect the continued use and purchase intentions of Chinese consumers? J. Consum. Behav. 2022, 21, 756–772. [Google Scholar] [CrossRef]
- Stock, M.R. How does product program innovativeness affect customer satisfaction? A comparison of goods and services. J. Acad. Mark. Sci. 2011, 39, 813–827. [Google Scholar] [CrossRef]
- Stock, R.M.; Oliveira, P.; von Hippel, E. Impacts of Hedonic and Utilitarian User Motives on the Innovativeness of User-Developed Solutions. J. Prod. Innov. Manag. 2015, 32, 389–403. [Google Scholar] [CrossRef]
- De Vries, R.; Jager, G.; Tijssen, I.; Zandstra, E.H. Shopping for products in a virtual world: Why haptics and visuals are equally important in shaping consumer perceptions and attitudes. Food Qual. Prefer. 2018, 66, 64–75. [Google Scholar] [CrossRef]
- Brasel, S.A.; Gips, J. Tablets, touchscreens, and touchpads: How varying touch interfaces trigger psychological ownership and endowment. J. Consum. Psychol. 2014, 24, 226–233. [Google Scholar] [CrossRef]
- Arghashi, V.; Yuksel, C.A. Interactivity, Inspiration, and Perceived Usefulness! How retailers’ AR-apps improve consumer engagement through flow. J. Retail. Consum. Serv. 2022, 64, 102756. [Google Scholar] [CrossRef]
- Lin, C. Perceived convenience retailer innovativeness: How does it affect consumers? Manag. Decis. 2016, 54, 946–964. [Google Scholar] [CrossRef]
- Lin, C.Y. How does perceived retail service innovativeness affect retail patronage intentions? Creat. Innov. Manag. 2019, 28, 519–532. [Google Scholar] [CrossRef]
- Kim, E.; Tang, L.R.; Bosselman, R. Customer Perceptions of Innovativeness: An Accelerator for Value Co-Creation. J. Hosp. Tour. Res. 2019, 43, 807–838. [Google Scholar] [CrossRef]
- Joerß, T.; Hoffmann, S.; Mai, R.; Akbar, P. Digitalization as solution to environmental problems? When users rely on augmented reality-recommendation agents. J. Bus. Res. 2021, 128, 510–523. [Google Scholar] [CrossRef]
- Barbopoulos, I.; Johansson, L. A multi-dimensional approach to consumer motivation: Exploring economic, hedonic, and normative consumption goals. J. Consum. Mark. 2016, 33, 75–84. [Google Scholar] [CrossRef]
- Songa, G.; Russo, V. IAT, consumer behaviour and the moderating role of decision-making style: An empirical study on food products. Food Qual. Prefer. 2018, 64, 205–220. [Google Scholar] [CrossRef]
- Kim, J.; Kang, S.; Bae, J. The effects of customer consumption goals on artificial intelligence driven recommendation agents: Evidence from Stitch Fix. Int. J. Advert. 2022, 41, 997–1016. [Google Scholar] [CrossRef]
- Liu, Y. How and why a touchscreen interface impacts psychological ownership and its downstream consequences. J. Retail. Consum. Serv. 2023, 70, 103182. [Google Scholar] [CrossRef]
- Aghekyan-Simonian, M.; Forsythe, S.; Suk Kwon, W.; Chattaraman, V. The role of product brand image and online store image on perceived risks and online purchase intentions for apparel. J. Retail. Consum. Serv. 2012, 19, 325–331. [Google Scholar] [CrossRef]
- Fang, Y. Does online interactivity matter? Exploring the role of interactivity strategies in consumer decision making. Comput. Hum. Behav. 2012, 28, 1790–1804. [Google Scholar] [CrossRef]
- Laroche, M.; Li, R.; Richard, M.; Zhou, M. An investigation into online atmospherics: The effect of animated images on emotions, cognition, and purchase intentions. J. Retail. Consum. Serv. 2022, 64, 102845. [Google Scholar] [CrossRef]
- Kim, E.; Tang, L.R.; Bosselman, R. Measuring customer perceptions of restaurant innovativeness: Developing and validating a scale. Int. J. Hosp. Manag. 2018, 74, 85–98. [Google Scholar] [CrossRef]
- Ajzen, I. From Intentions to Actions: A Theory of Planned Behavior. In Action Control: From Cognition to Behavior; Springer: Berlin/Heidelberg, Germany, 1985; pp. 11–39. [Google Scholar]
- Hansen, T.; Møller Jensen, J.; Stubbe Solgaard, H. Predicting online grocery buying intention: A comparison of the theory of reasoned action and the theory of planned behavior. Int. J. Inf. Manag. 2004, 24, 539–550. [Google Scholar] [CrossRef]
- Garbarini, F.; Adenzato, M. At the root of embodied cognition: Cognitive science meets neurophysiology. Brain Cogn. 2004, 56, 100–106. [Google Scholar] [CrossRef]
- Sirgy, M.J.; Grewal, D.; Mangleburg, T. Retail Environment, Self-Congruity, and Retail Patronage: An Integrative Model and a Research Agenda. J. Bus. Res. 2000, 49, 127–138. [Google Scholar] [CrossRef]
- Keehner, M.; Fischer, M.H. Unusual Bodies, Uncommon Behaviors: Individual and Group Differences in Embodied Cognition in Spatial Tasks. Spat. Cogn. Comput. 2012, 12, 71–82. [Google Scholar] [CrossRef]
- Dong, Y.; Huang, Y.; Hu, P.; Zhang, P.; Wang, Y. The effect of picture attributes of online ordering pages on visual attention and user experience. Int. J. Ind. Ergon. 2023, 96, 103477. [Google Scholar] [CrossRef]
- Saren, M.; Harwood, T.; Ward, J.; Venkatesh, A. Marketing beyond the frontier? Researching the new marketing landscape of virtual worlds. J. Mark. Manag. 2013, 29, 1435–1442. [Google Scholar] [CrossRef]


| Constructs | Items | |
|---|---|---|
| Perceived diagnosticity [74] | PD1 | The video demonstrating the feel or texture of the clothing helped me evaluate the tactile attributes of the product. |
| PD2 | The video demonstrating the feel or texture of the clothing helped familiarize me with the product. | |
| PD3 | The video demonstrating the feel or texture of the clothing is helpful for me to understand the product’s tactile attributes. | |
| Mental imagery [72] | MI1 | During the video-viewing task, I imagined what it would be like to wear these clothes. |
| MI2 | During the video-viewing task, I fantasized about wearing the clothes. | |
| MI3 | During the video-viewing task, I thought about what the feeling would be like when wearing the clothes. | |
| MI4 | During the video-viewing task, I can easily imagine that I wear the clothes. | |
| Sensory similar [27] | SS1 | If I buy this product, I know I will have the same feeling as if I were inspecting the product directly. |
| SS2 | I feel that the product inspection in the video is similar to the direct product inspection. | |
| SS3 | The video product shows the same feel as a direct product inspection. | |
| Solutions innovativeness [61] | SI1 | I find using product display videos to be advantageous in performing my shopping. |
| SI2 | The retailer offers a very convenient and useful way to display the products. | |
| SI3 | The solutions offered by the retailer are novel. | |
| SI4 | The retailer provides an unconventional way of solving problems. | |
| Purchase intention [75] | PI1 | After viewing this video, I became interested in making a purchase. |
| PI2 | After viewing this video, I am willing to purchase the product being presented. | |
| PI3 | After viewing this video, I would consider purchasing the presented product. | |
| PI4 | After viewing this video, I will likely buy this product. | |
| Goals | Sub-Goal | Potential Motives |
|---|---|---|
| Gain | Value for money | To receive value for money, pay a reasonable price, and avoid wasting money. |
| Quality | To receive a high-quality and reliable product that meets personal expectations. | |
| Function | To receive a valuable and practical product that serves some purpose. | |
| Hedonic | Pleasure | To receive something that satisfies an immediate need and makes one feel good and happy. |
| Stimulating | To receive something exciting, stimulating, or unique, avoiding being boring. | |
| Comfortable | To receive something pleasant and comfortable, avoiding hassle and discomfort. |
| Characteristics | Items | Frequency | Percentage (%) |
|---|---|---|---|
| Gender | Female | 211 | 51.97 |
| Male | 195 | 48.03 | |
| Age | <20 | 5 | 1.23 |
| 21–30 | 183 | 45.07 | |
| 31–40 | 135 | 33.25 | |
| 41–50 | 73 | 17.99 | |
| >50 | 10 | 2.46 | |
| Education | High school and below | 21 | 5.17 |
| College students | 27 | 6.65 | |
| Undergraduate | 319 | 78.57 | |
| Postgraduate | 39 | 9.61 | |
| Number of online purchases per month | Less than five times | 132 | 32.5 |
| 5–10 times | 161 | 39.7 | |
| More than ten times | 113 | 27.8 |
| Constructs | Items | Factor Loading | Cronbach’α | CR | AVE |
|---|---|---|---|---|---|
| Perceived diagnosticity | PD1 | 0.714 | 0.752 | 0.754 | 0.507 |
| PD2 | 0.756 | ||||
| PD3 | 0.662 | ||||
| Mental imagery | MI1 | 0.753 | 0.835 | 0.835 | 0.558 |
| MI2 | 0.759 | ||||
| MI3 | 0.72 | ||||
| MI4 | 0.756 | ||||
| Sensory similarity | SS1 | 0.703 | 0.761 | 0.761 | 0.515 |
| SS2 | 0.72 | ||||
| SS3 | 0.729 | ||||
| Solution innovativeness | SI1 | 0.704 | 0.807 | 0.807 | 0.512 |
| SI2 | 0.762 | ||||
| SI3 | 0.719 | ||||
| SI4 | 0.674 | ||||
| Purchase intention | PI1 | 0.776 | 0.868 | 0.869 | 0.624 |
| PI2 | 0.766 | ||||
| PI3 | 0.793 | ||||
| PI4 | 0.823 |
| PD | MI | SS | SI | PI | |
|---|---|---|---|---|---|
| PD | 0.712 | ||||
| MI | 0.427 *** | 0.747 | |||
| SS | 0.372 *** | 0.385 *** | 0.717 | ||
| SI | 0.192 ** | 0.32 *** | 0.366 *** | 0.715 | |
| PI | 0.178 ** | 0.348 *** | 0.326 *** | 0.427 *** | 0.79 |
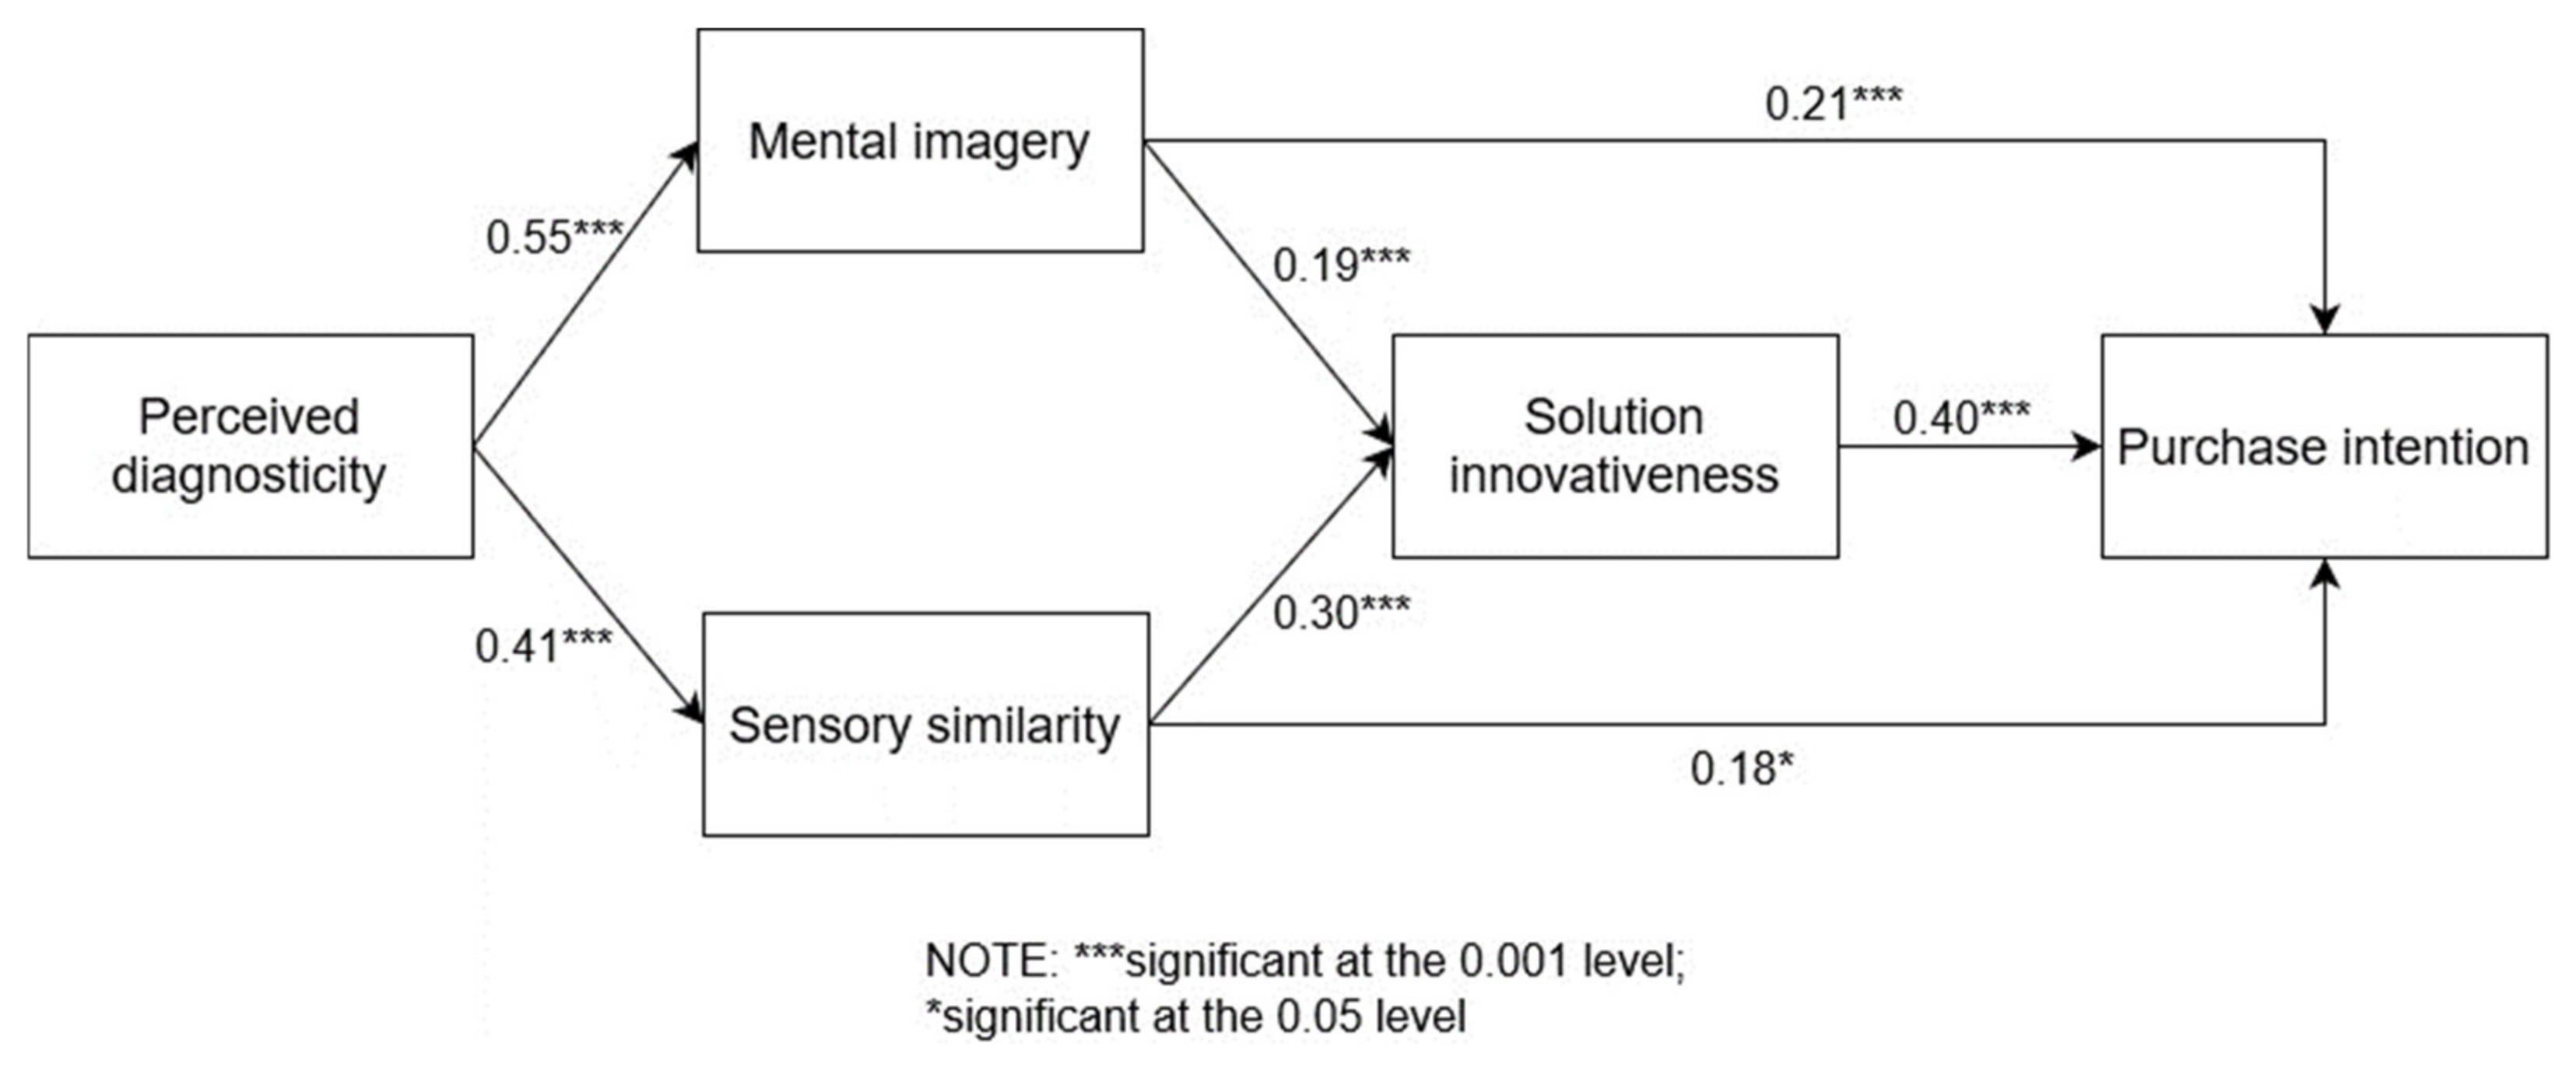
| Hypothetical Path | Estimate | S.E. | C.R. | P | Results | |
|---|---|---|---|---|---|---|
| PD → MI | H1 | 0.554 | 0.083 | 6.645 | *** | Support |
| MI → PI | H2 | 0.214 | 0.061 | 3.492 | *** | Support |
| PD → SS | H3 | 0.406 | 0.071 | 5.737 | *** | Support |
| SS → PI | H4 | 0.182 | 0.079 | 2.287 | 0.022 | Support |
| MI → SI | H5a | 0.19 | 0.051 | 3.71 | *** | Support |
| SS → SI | H5b | 0.299 | 0.067 | 4.452 | *** | Support |
| SI → PI | H6 | 0.397 | 0.081 | 4.901 | *** | Support |
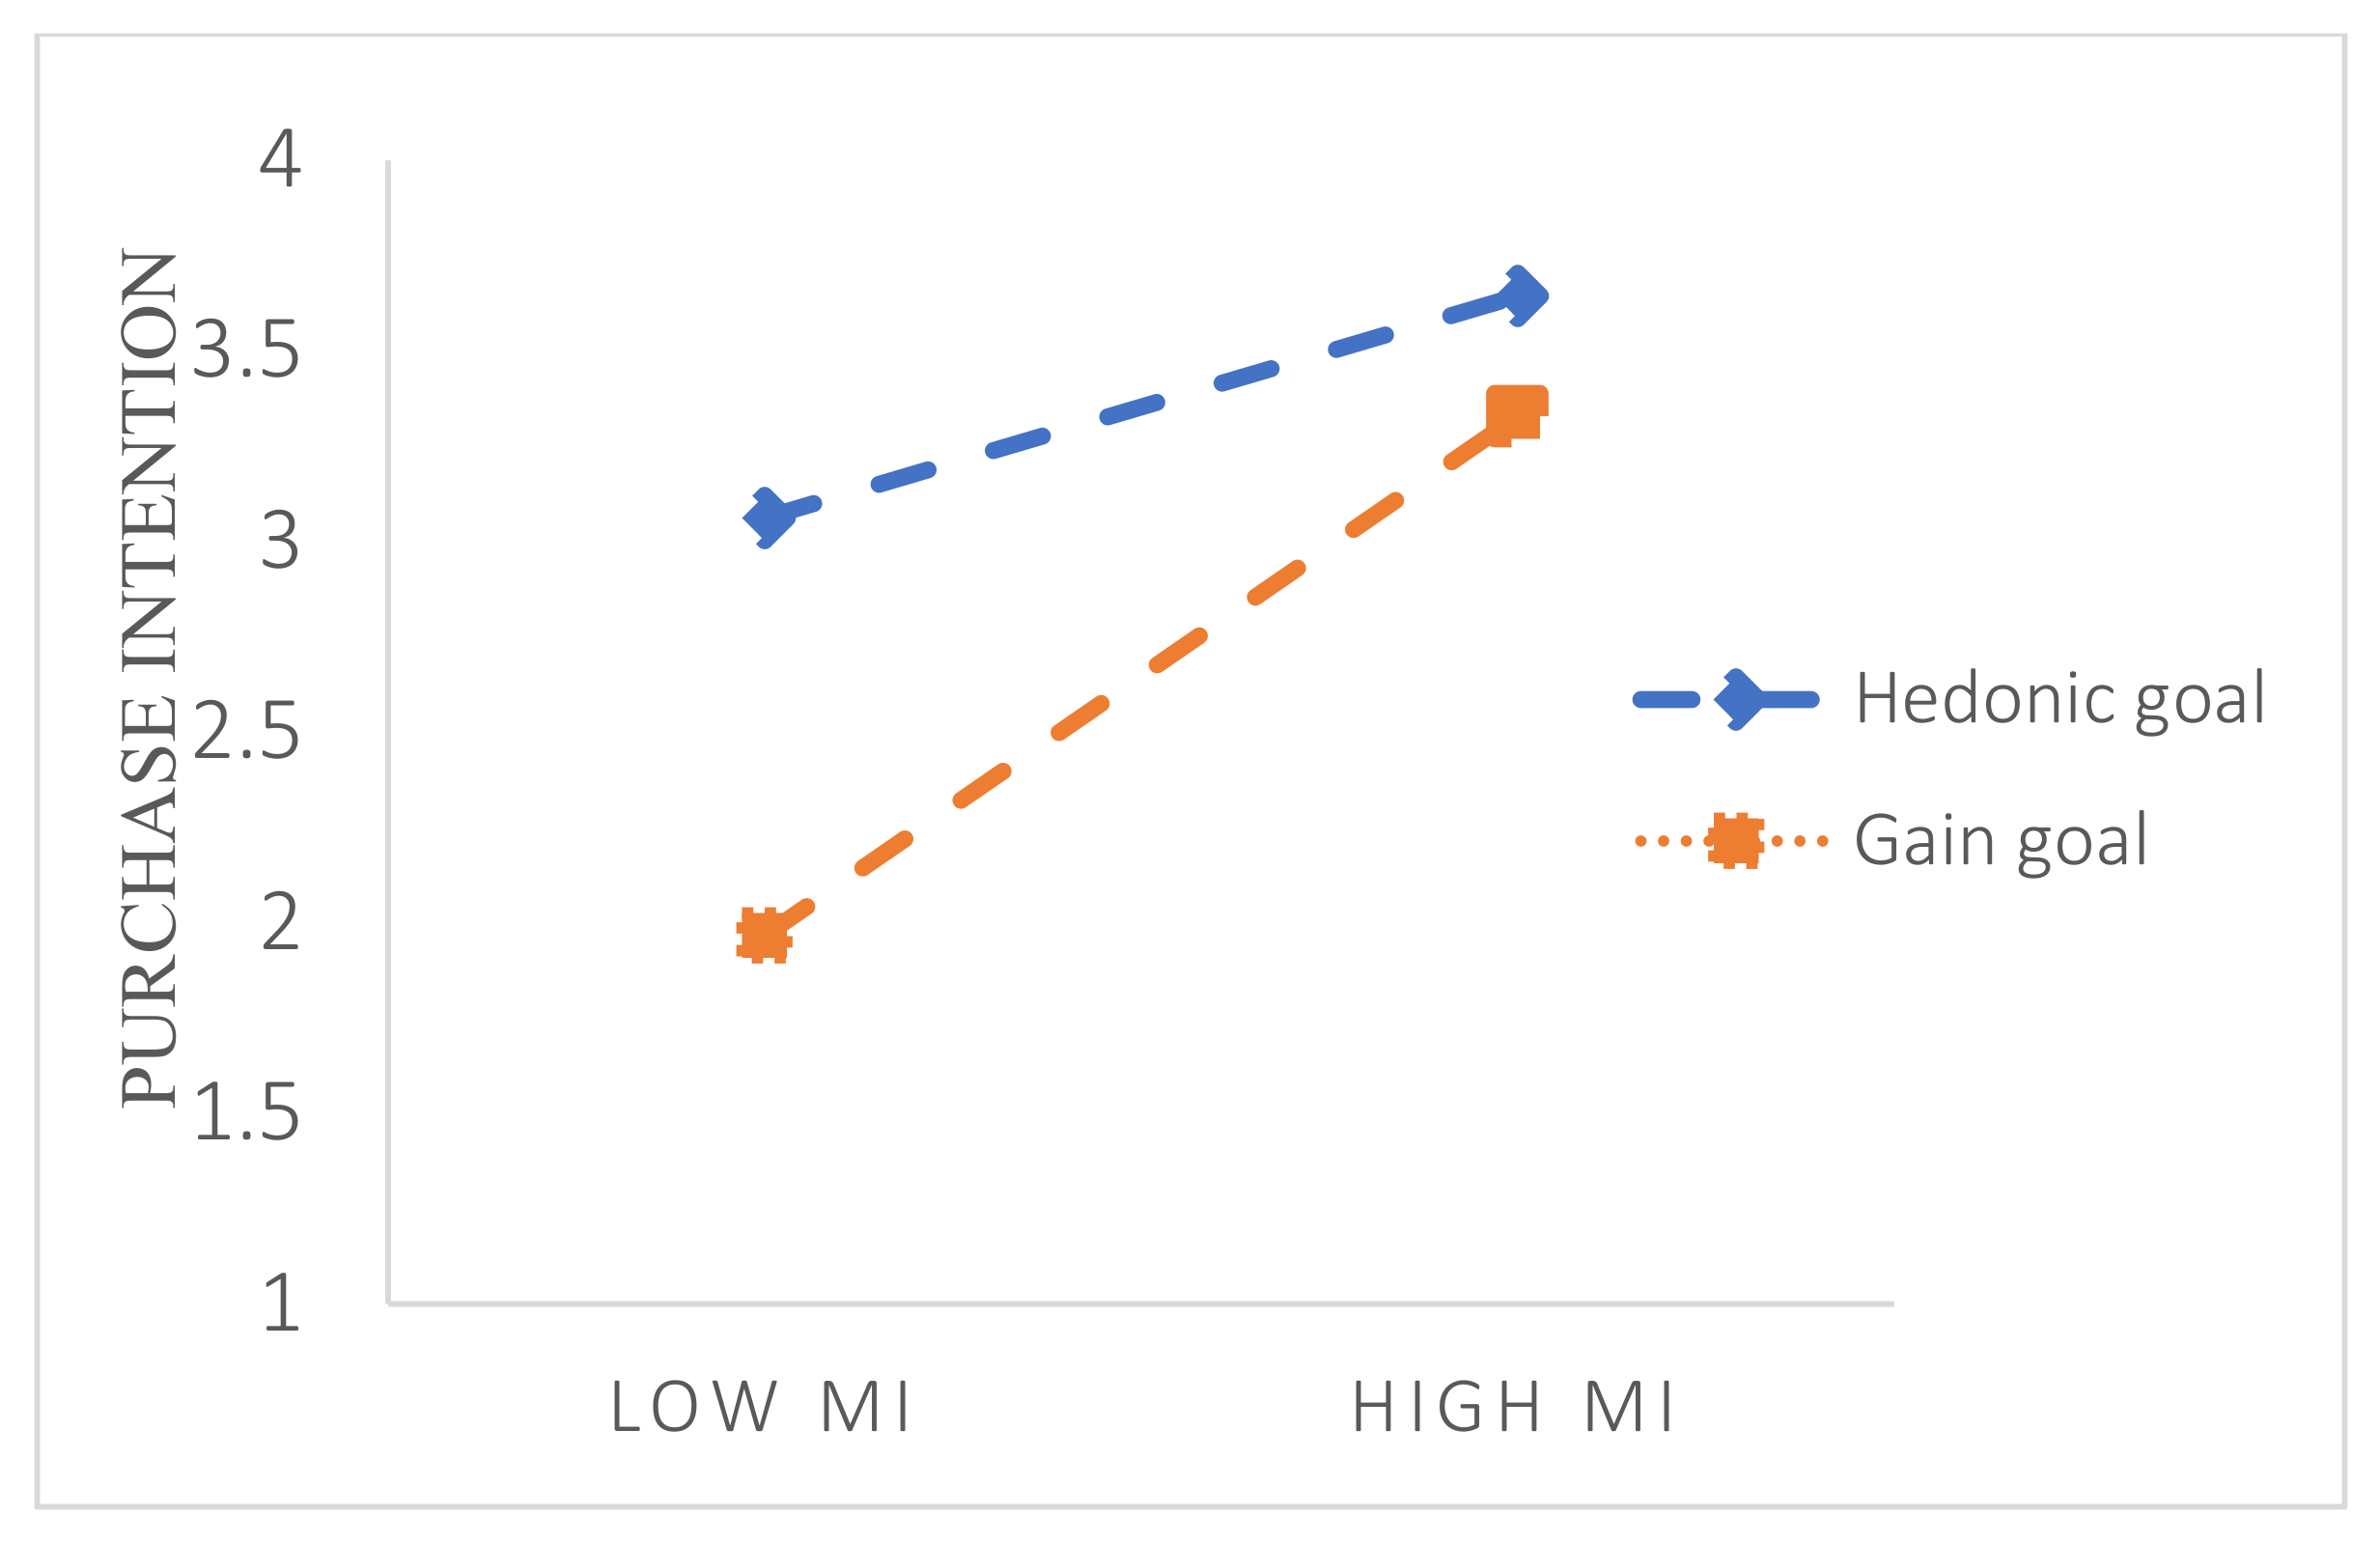
| Model 1 | ||||
|---|---|---|---|---|
| Coefficient | Standard Error | t | p | |
| const | 3.214 | 0.573 | 5.609 | 0.000 *** |
| Mental imagery | 0.049 | 0.157 | 0.31 | 0.757 |
| personal goals | −0.352 | 0.353 | −0.998 | 0.319 |
| int | 0.195 | 0.096 | 2.026 | 0.043 ** |
| R2 | 0.184 | |||
| R2 adjusted | 0.178 | |||
| F | F(3, 402) = 30.267, p = 0.000 *** | |||
| Model 2 | ||||
|---|---|---|---|---|
| Coefficient | Standard Error | t | p | |
| const | 3 | 0.537 | 5.587 | 0.000 *** |
| Sensory similarity | 0.201 | 0.147 | 1.367 | 0.172 |
| Personal goals | −0.041 | 0.331 | −0.124 | 0.901 |
| Int | 0.041 | 0.09 | 0.455 | 0.65 |
| R2 | 0.089 | |||
| R2 adjusted | 0.082 | |||
| F | F(3, 402) = 13.091, p = 0.000 *** | |||
Disclaimer/Publisher’s Note: The statements, opinions and data contained in all publications are solely those of the individual author(s) and contributor(s) and not of MDPI and/or the editor(s). MDPI and/or the editor(s) disclaim responsibility for any injury to people or property resulting from any ideas, methods, instructions or products referred to in the content. |
© 2024 by the authors. Licensee MDPI, Basel, Switzerland. This article is an open access article distributed under the terms and conditions of the Creative Commons Attribution (CC BY) license (https://creativecommons.org/licenses/by/4.0/).
Share and Cite
Jiang, K.; Luo, S.; Zheng, J. Seeing as Feeling? The Impact of Tactile Compensation Videos on Consumer Purchase Intention. Behav. Sci. 2024, 14, 50. https://doi.org/10.3390/bs14010050
Jiang K, Luo S, Zheng J. Seeing as Feeling? The Impact of Tactile Compensation Videos on Consumer Purchase Intention. Behavioral Sciences. 2024; 14(1):50. https://doi.org/10.3390/bs14010050
Chicago/Turabian StyleJiang, Kan, Shaohua Luo, and Junyuan Zheng. 2024. "Seeing as Feeling? The Impact of Tactile Compensation Videos on Consumer Purchase Intention" Behavioral Sciences 14, no. 1: 50. https://doi.org/10.3390/bs14010050