

Influence of Healthy Brand and Diagnosticity of Brand Name on Subjective Ratings of High- and Low-Calorie Food

Abstract
:1. Introduction
1.1. The Effect of Health Labels and Brand Information on High- and Low-Calorie Foods
1.2. The Moderating Effect of the Diagnosticity of Brand Name
2. Study 1
2.1. Method
2.1.1. Participants
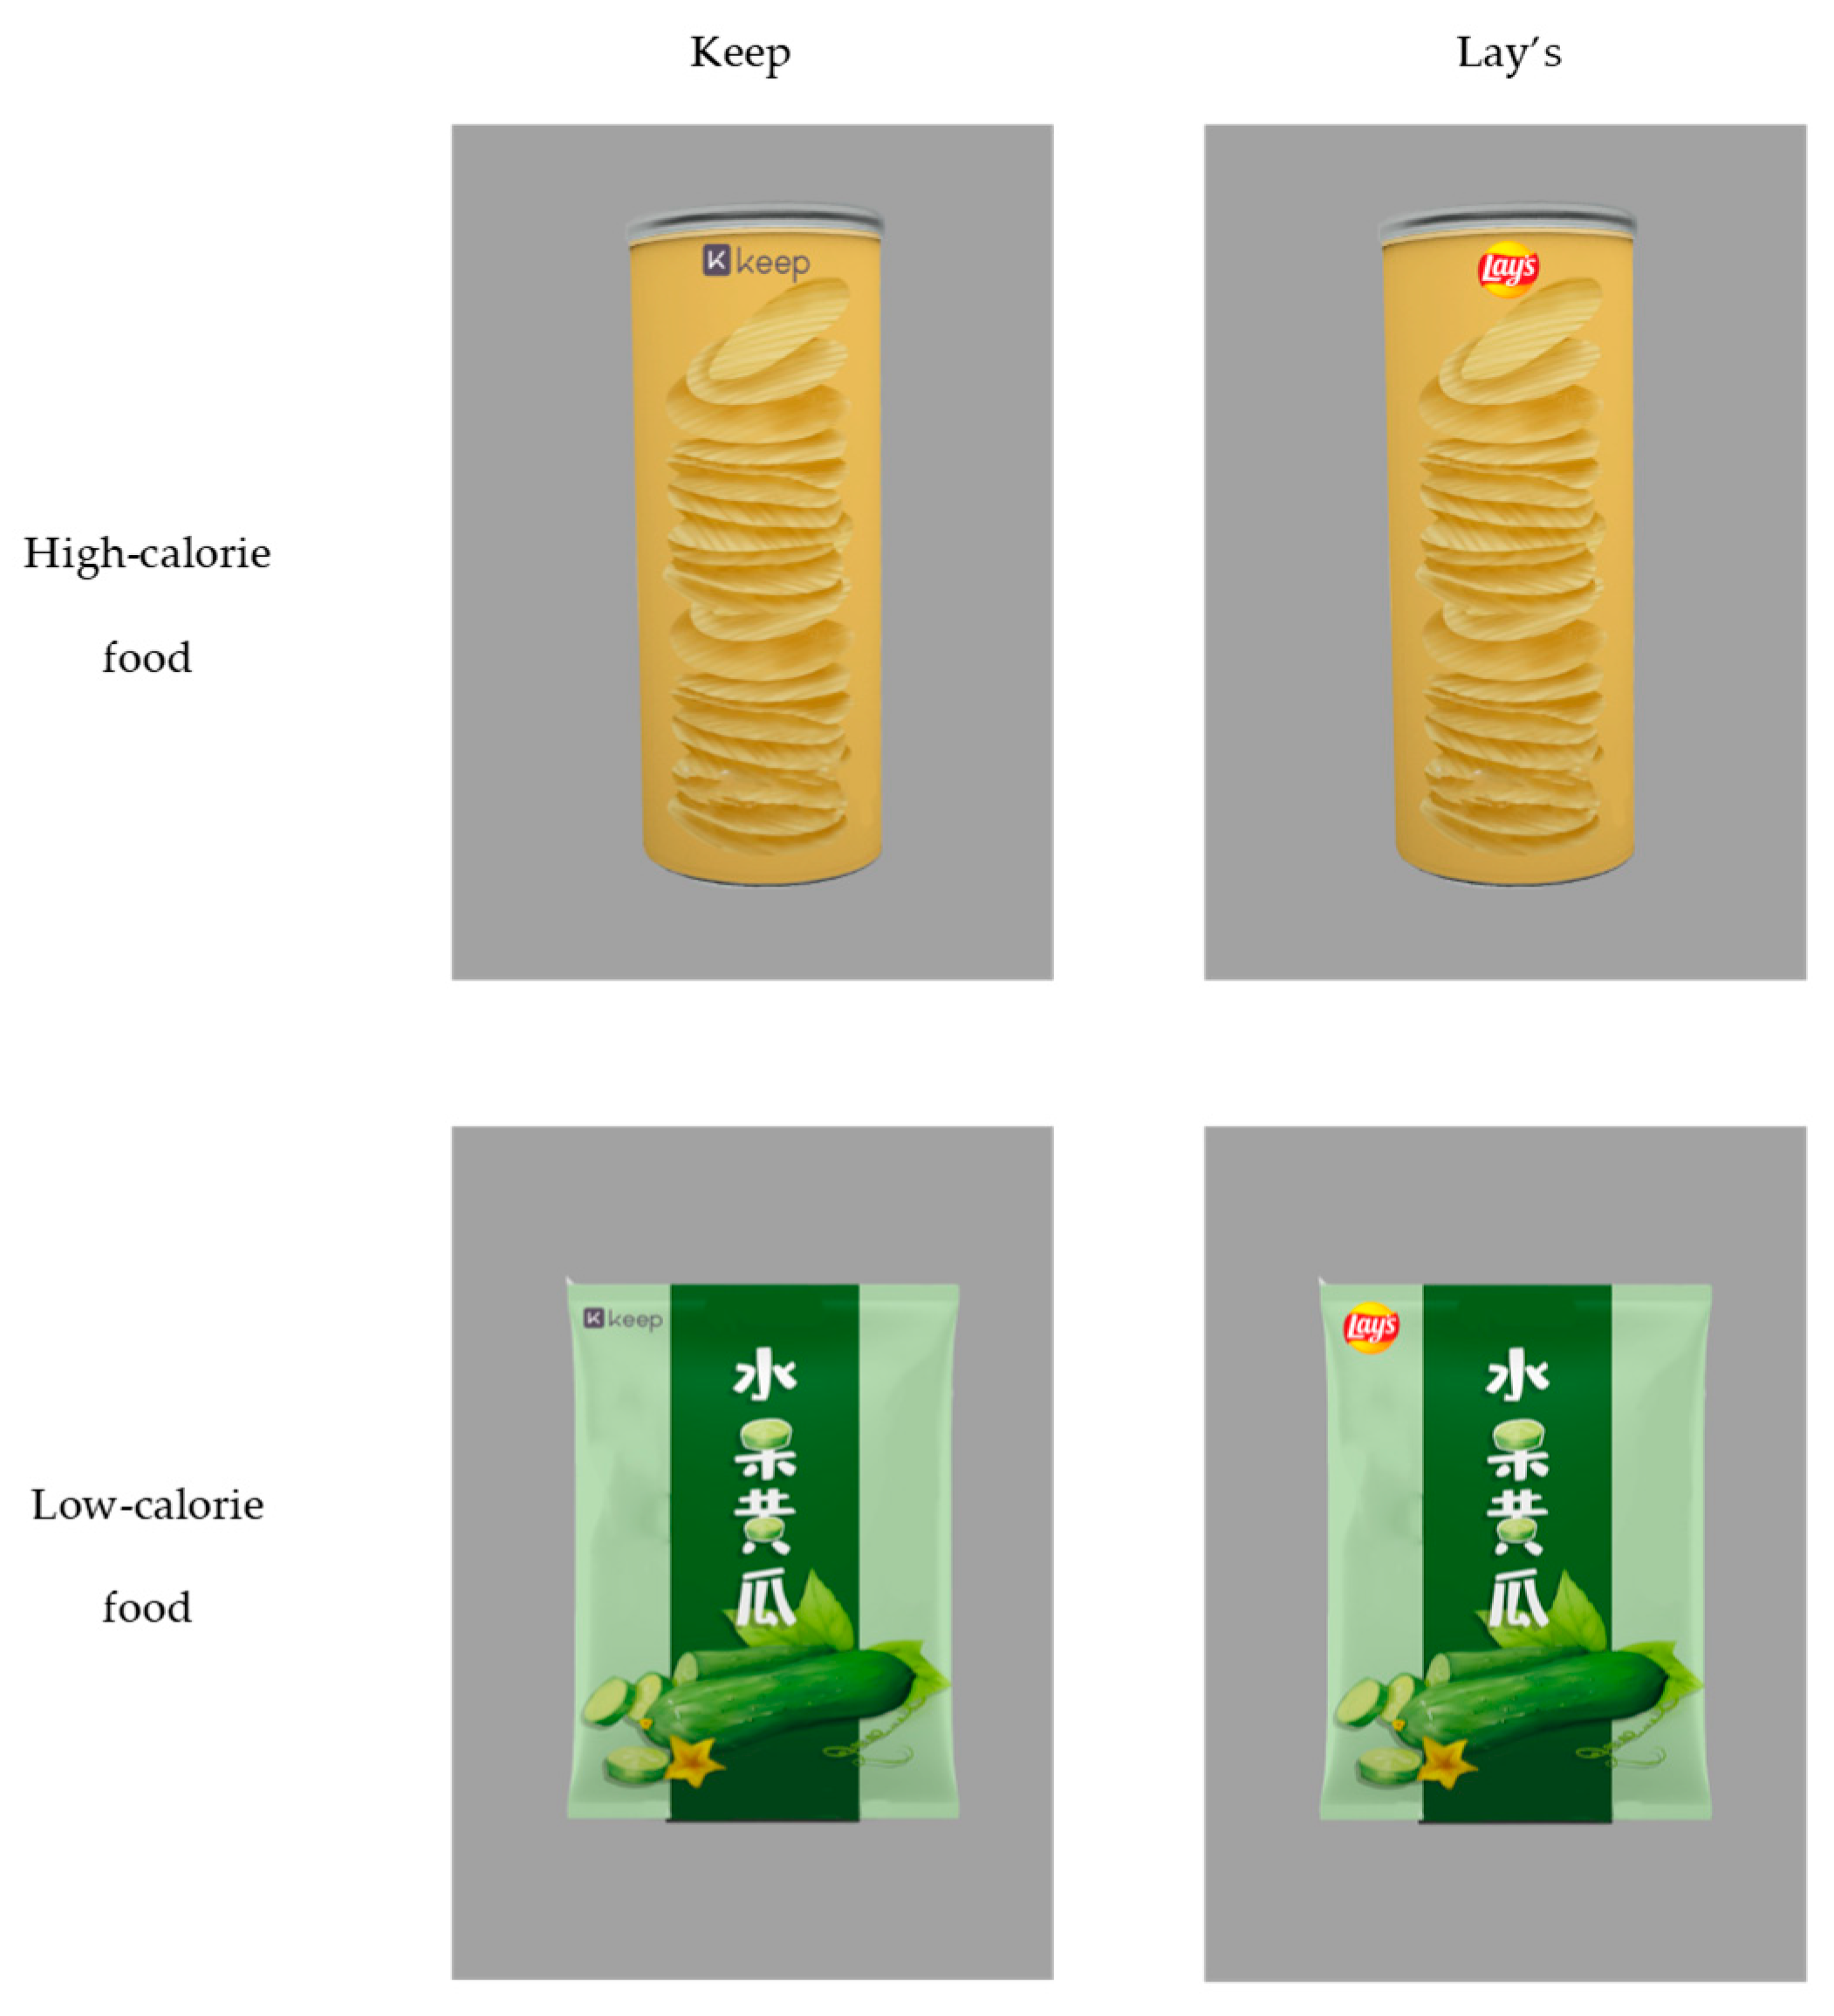
2.1.2. Materials
2.1.3. Design and Procedure
2.2. Results and Discussion
2.2.1. Brand Ratings
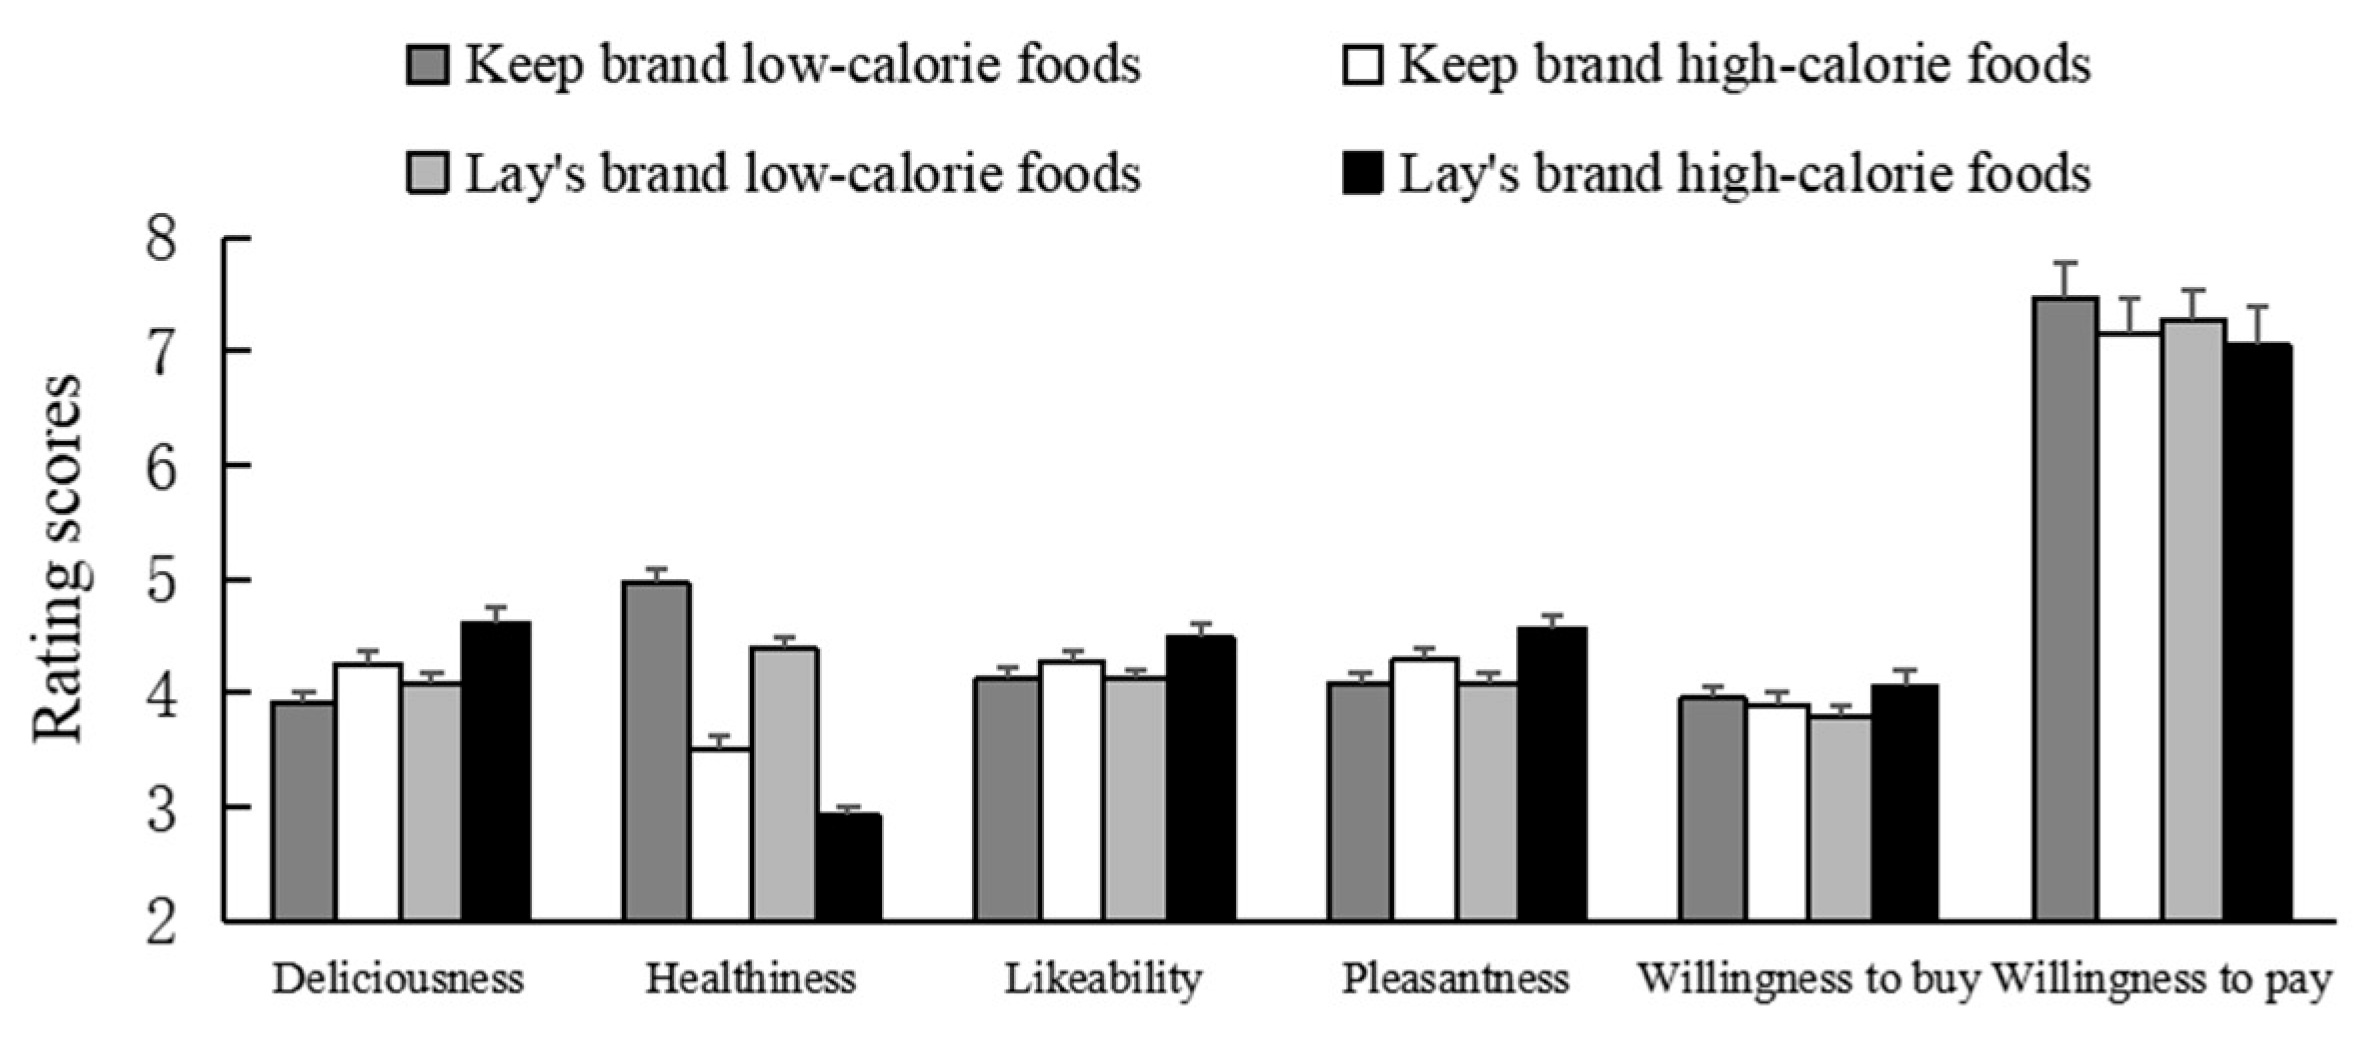
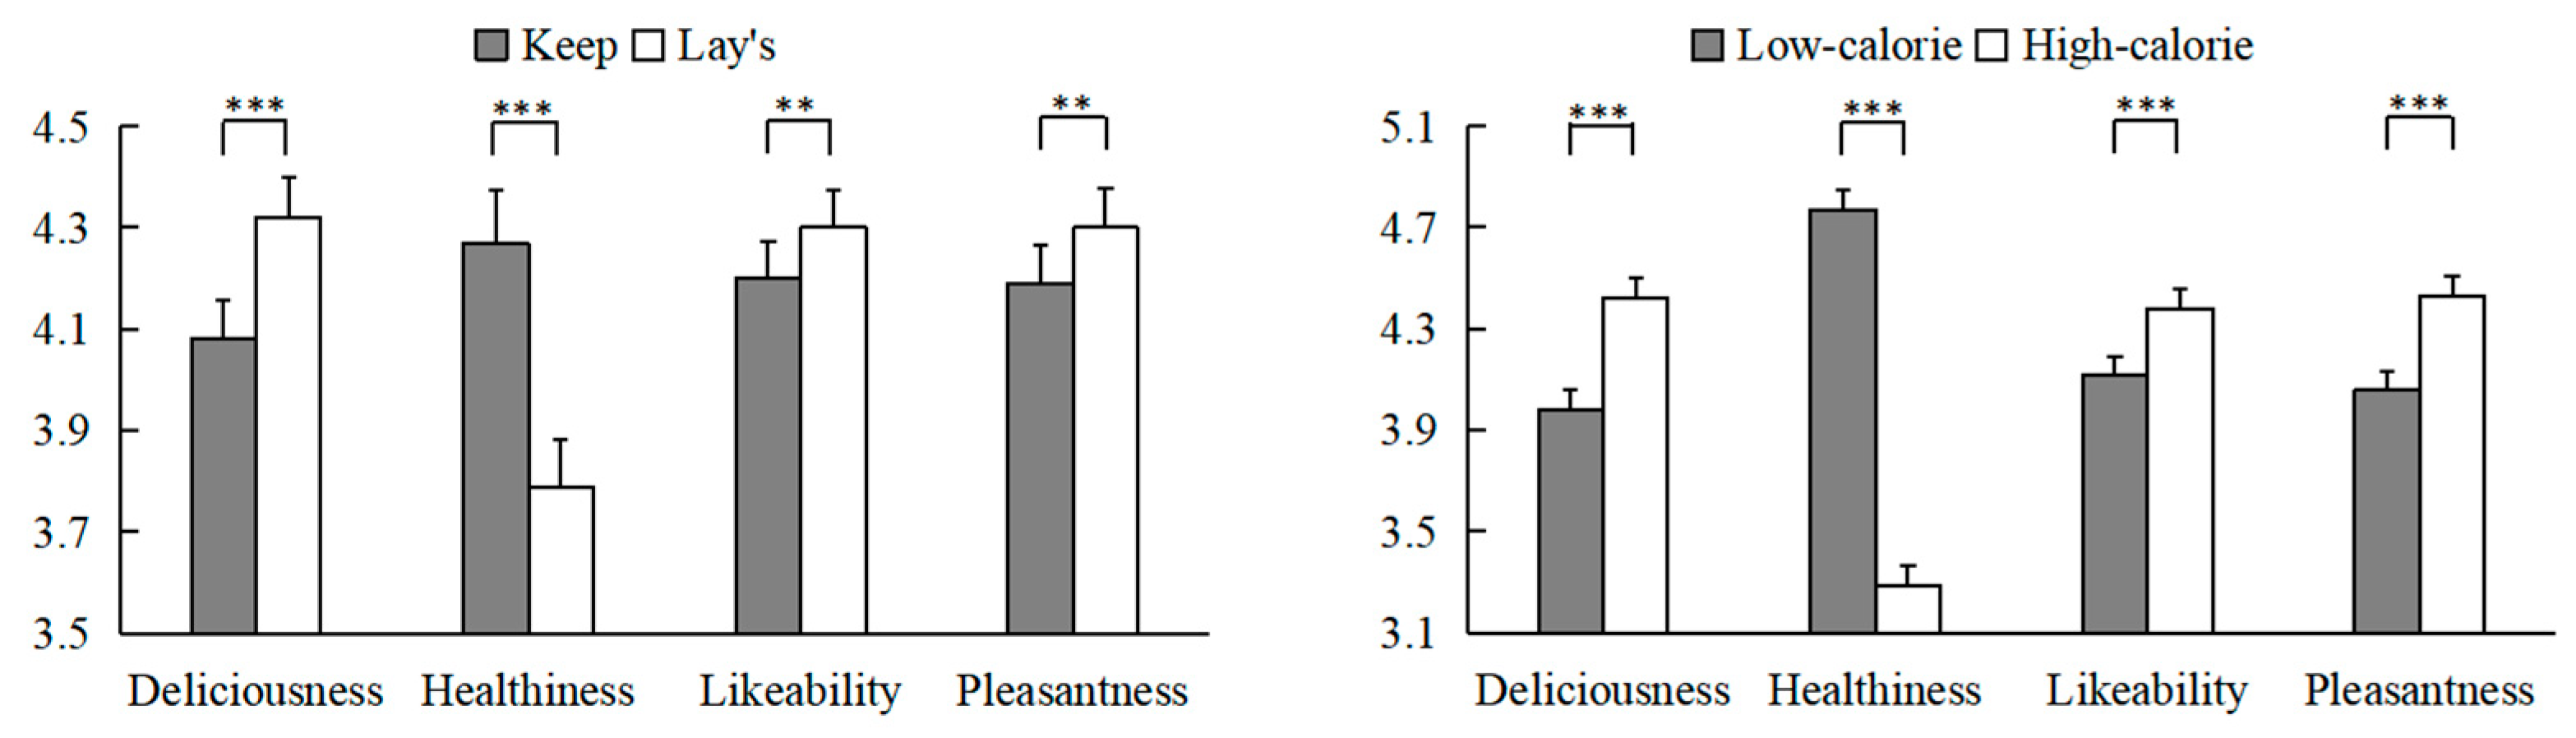
2.2.2. Subjective Ratings
2.2.3. Purchase Intention
3. Study 2
3.1. Method
3.1.1. Participants
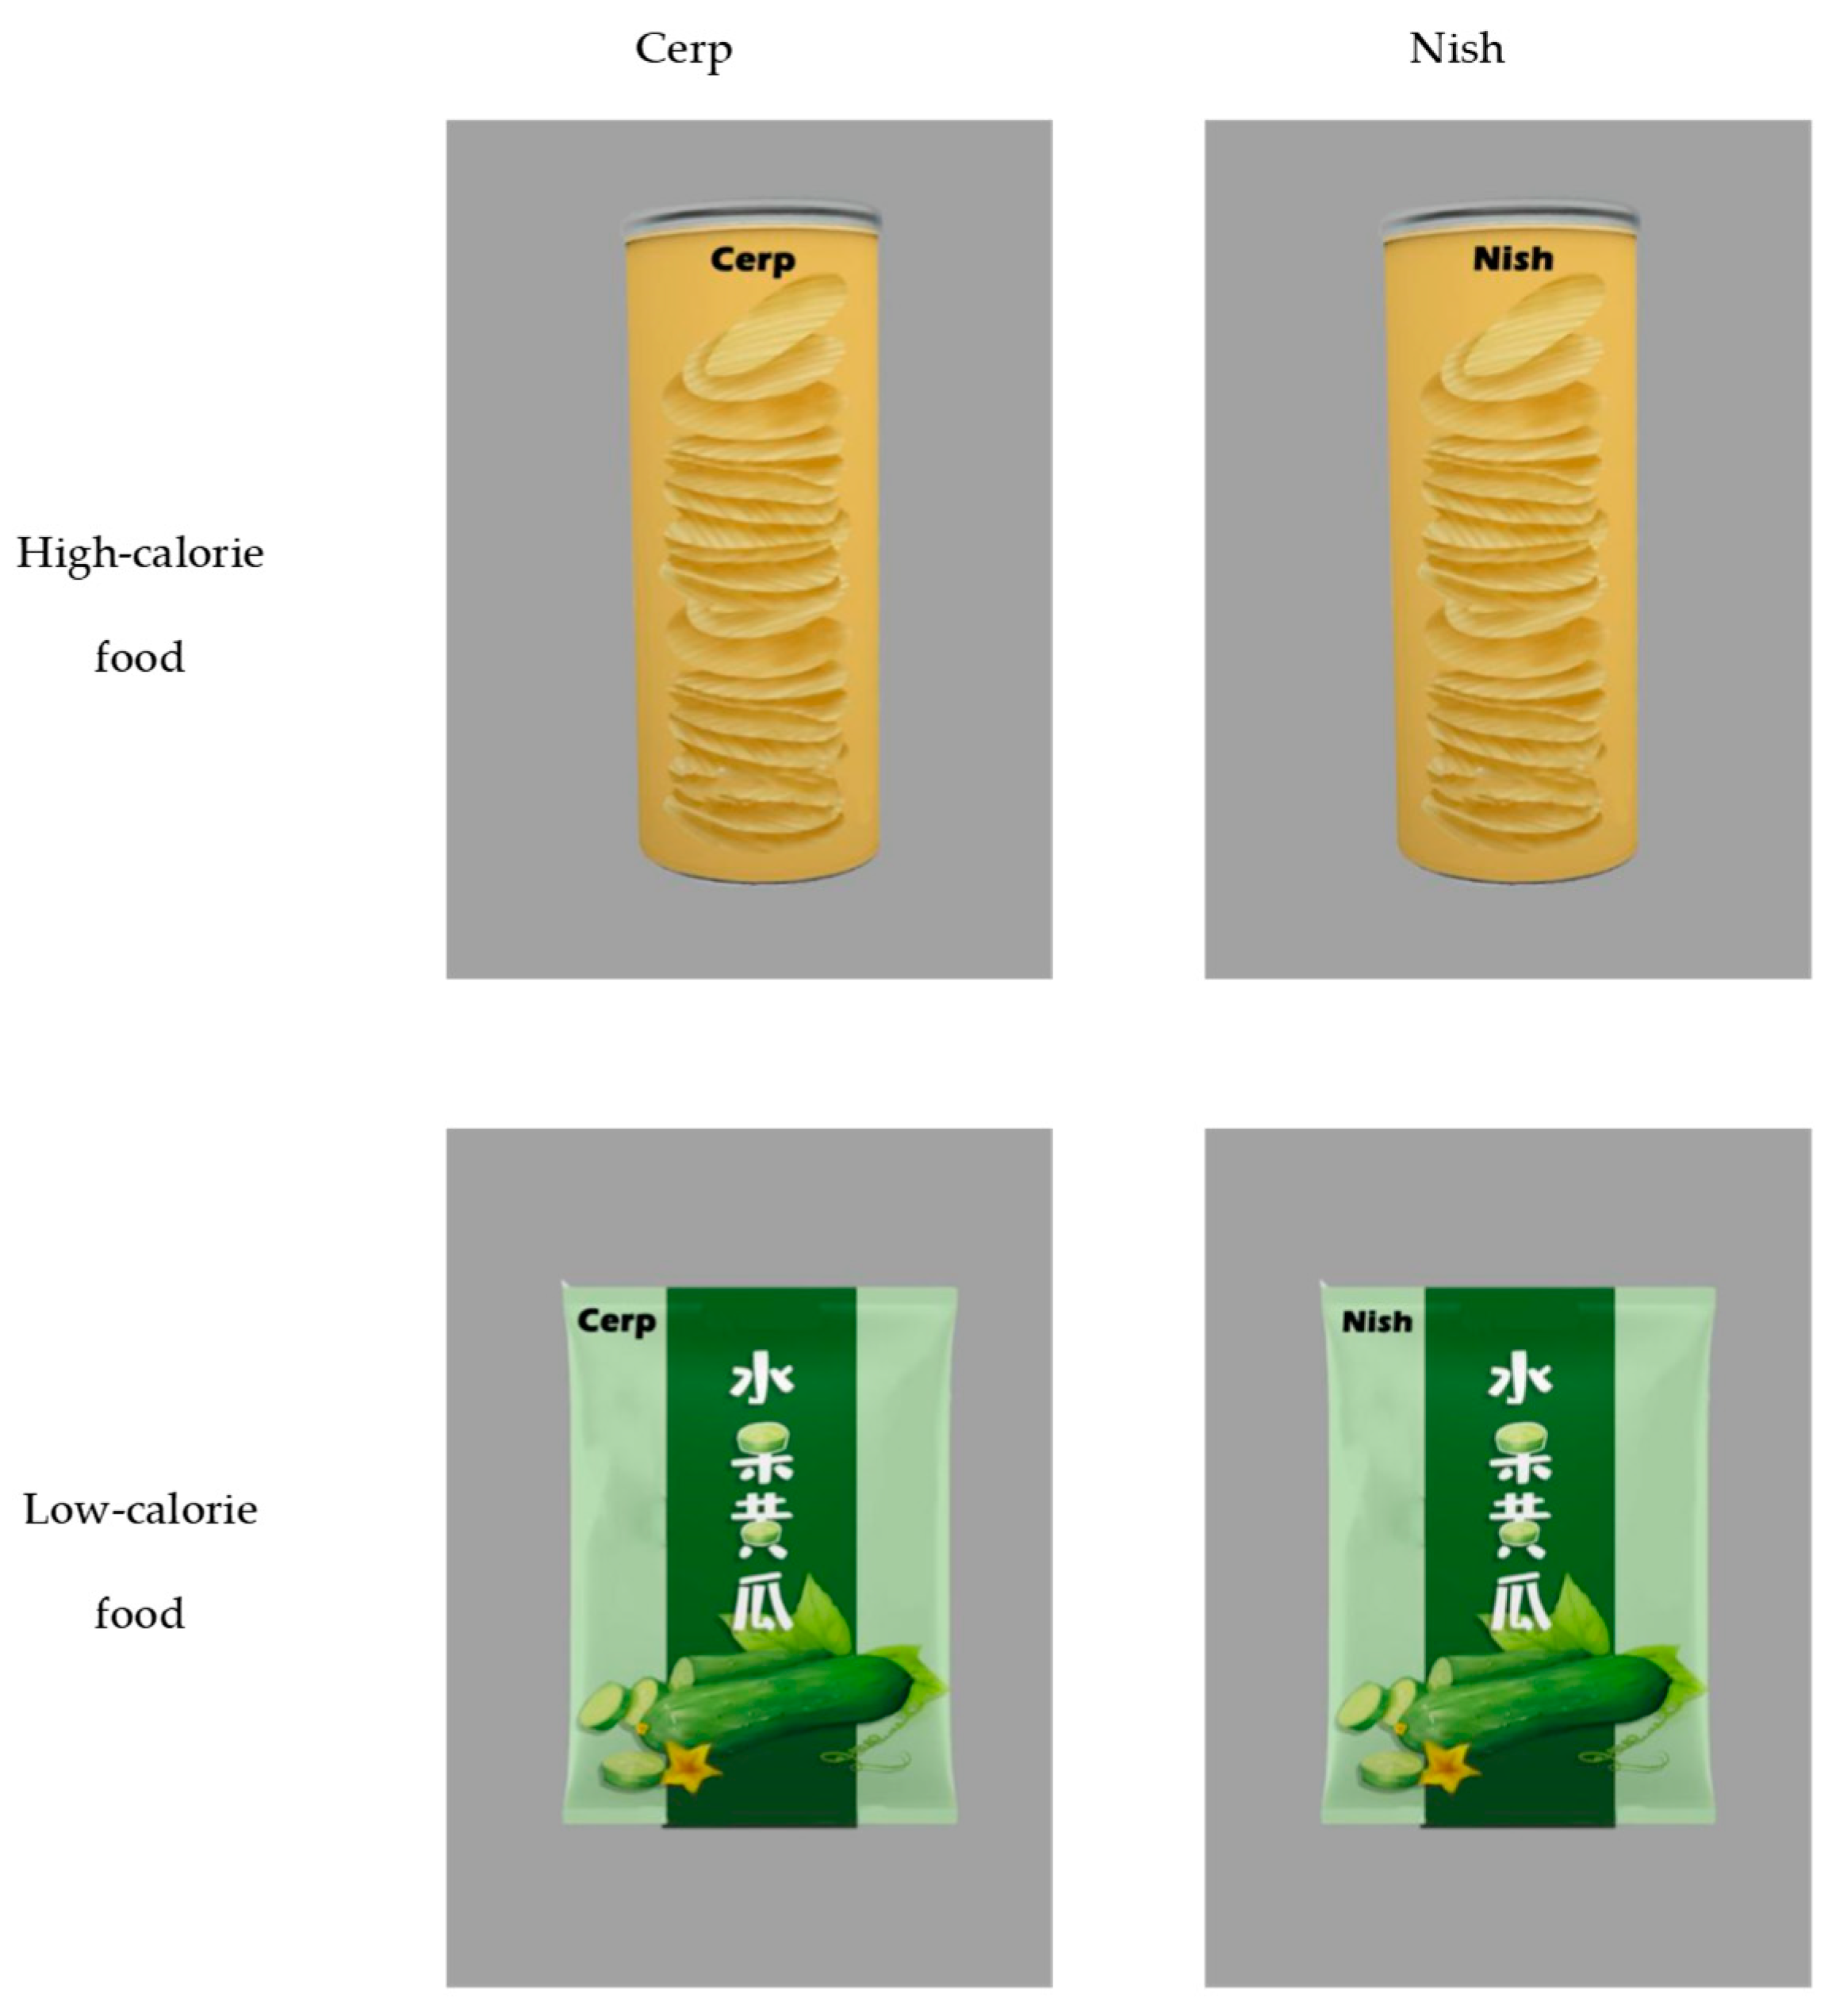
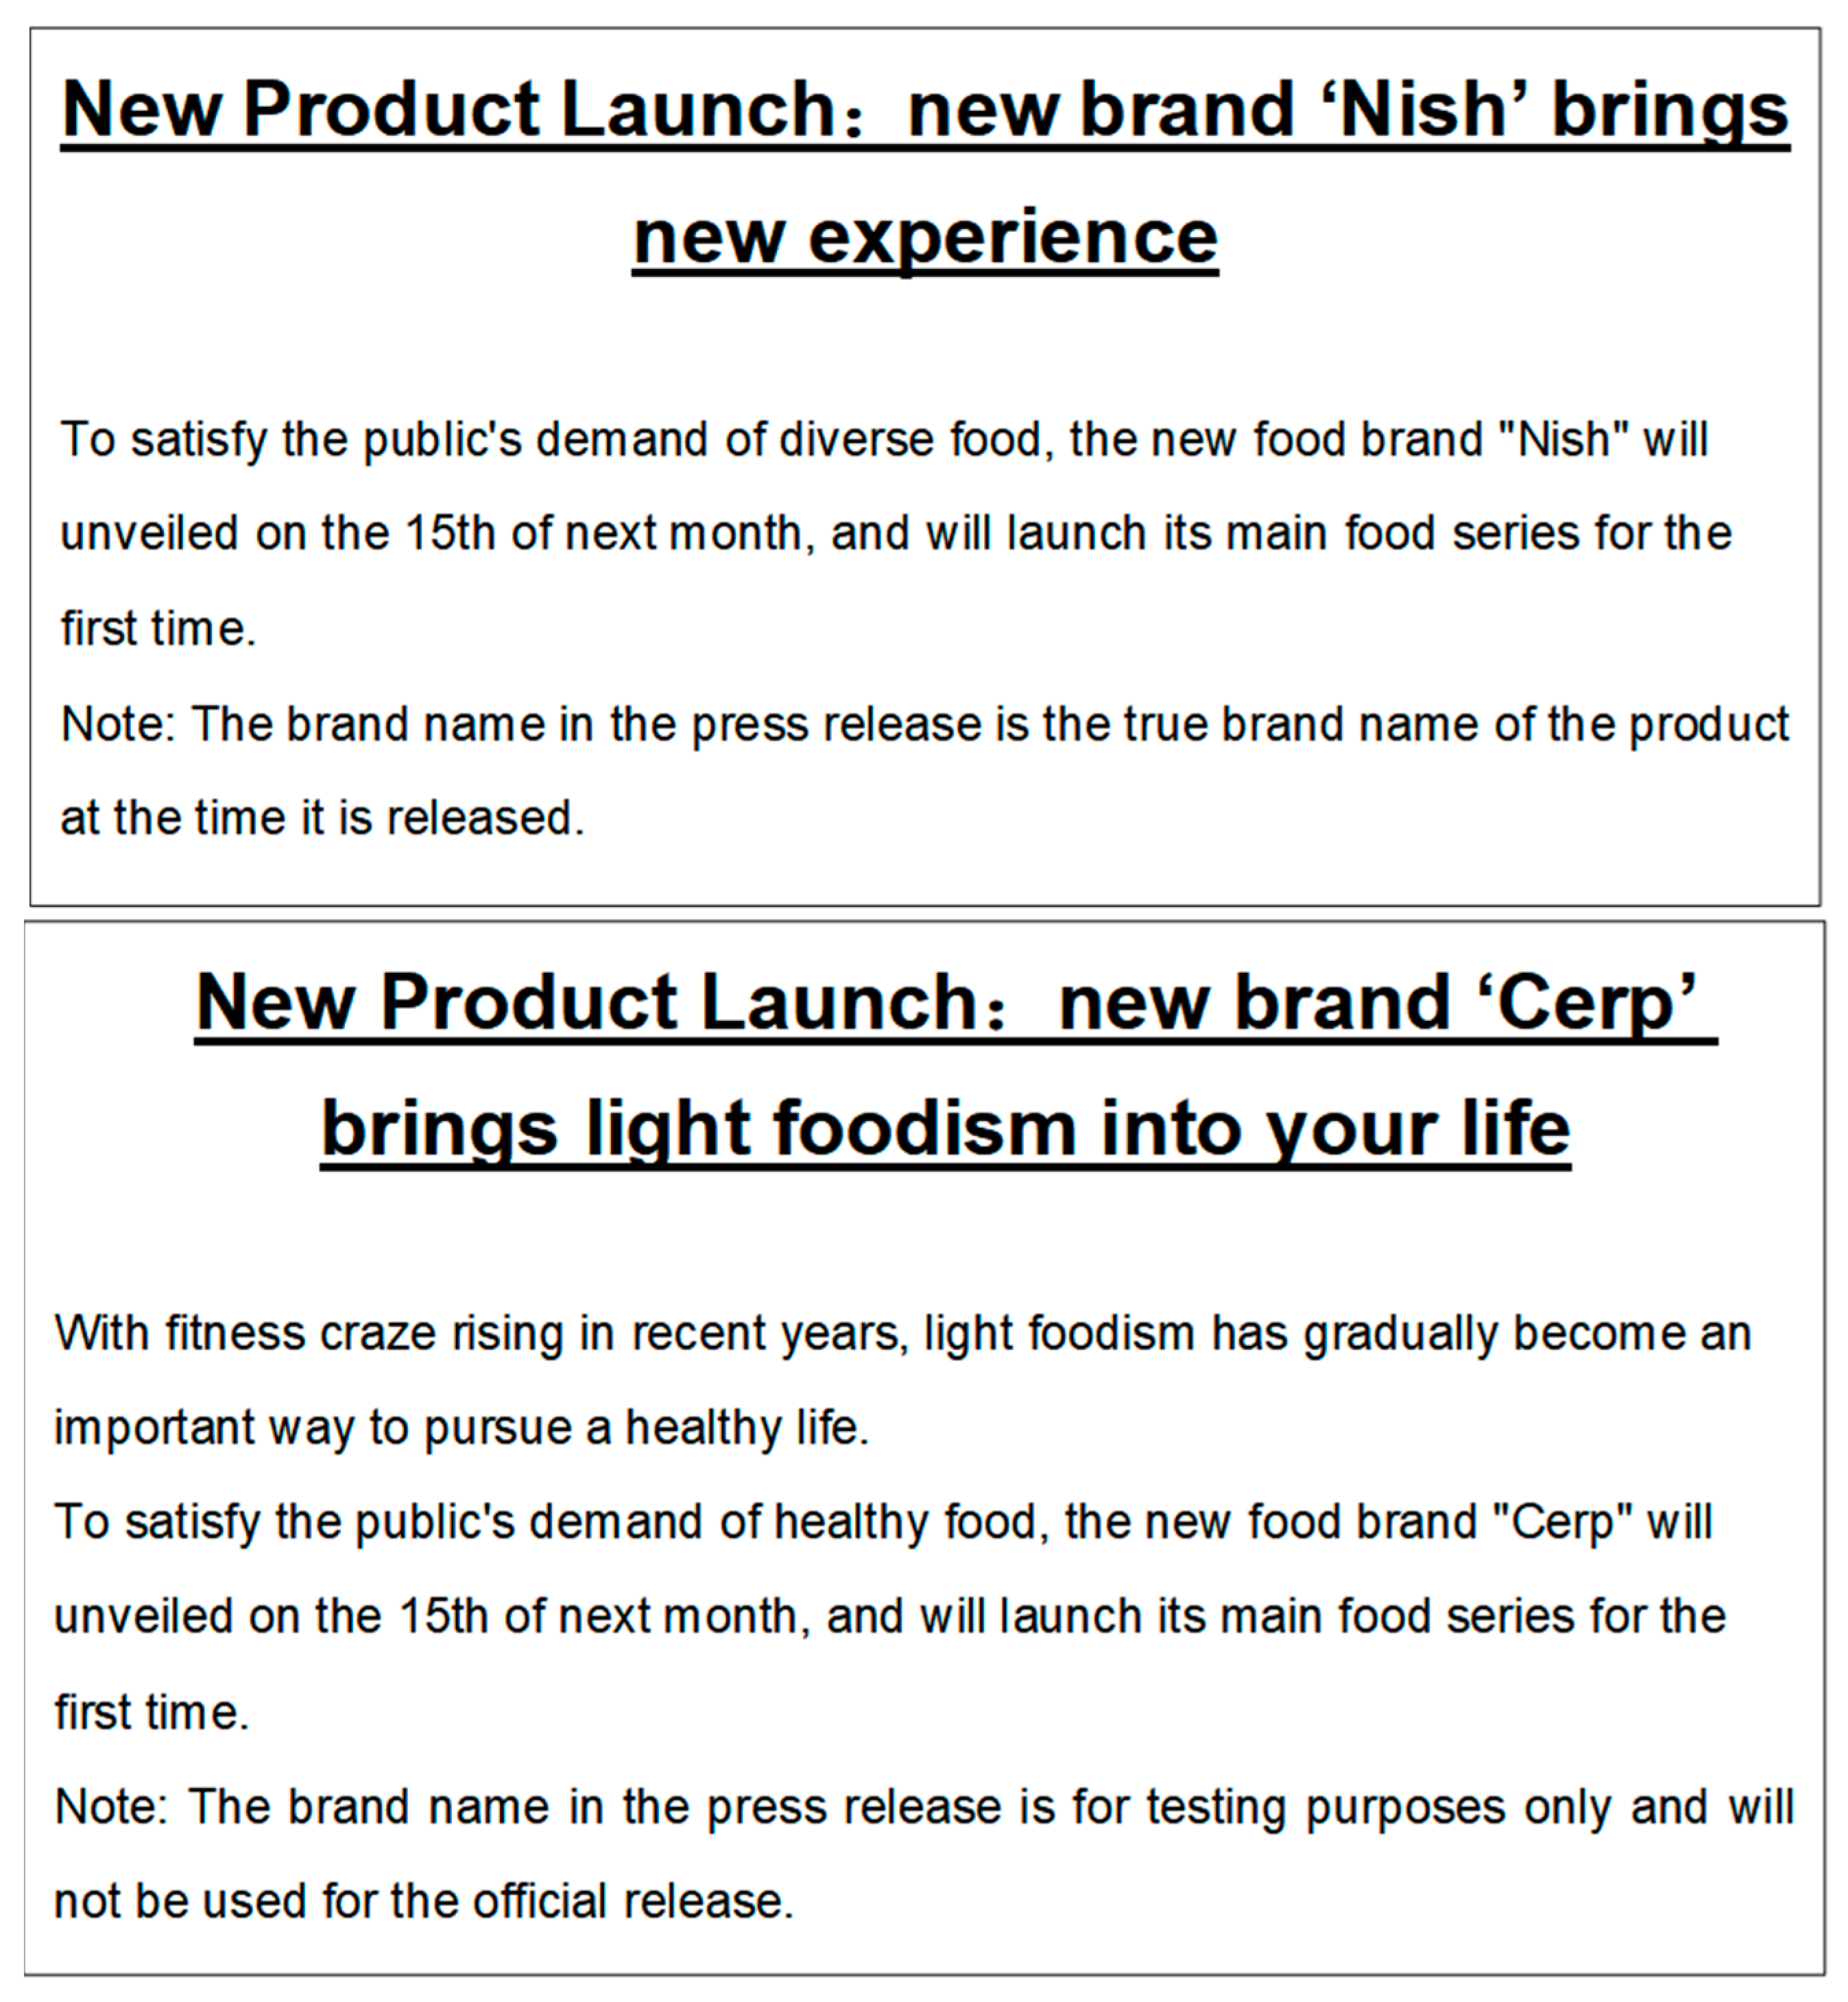
3.1.2. Materials, Design and Procedure
3.2. Results and Discussion
3.2.1. Brand Ratings
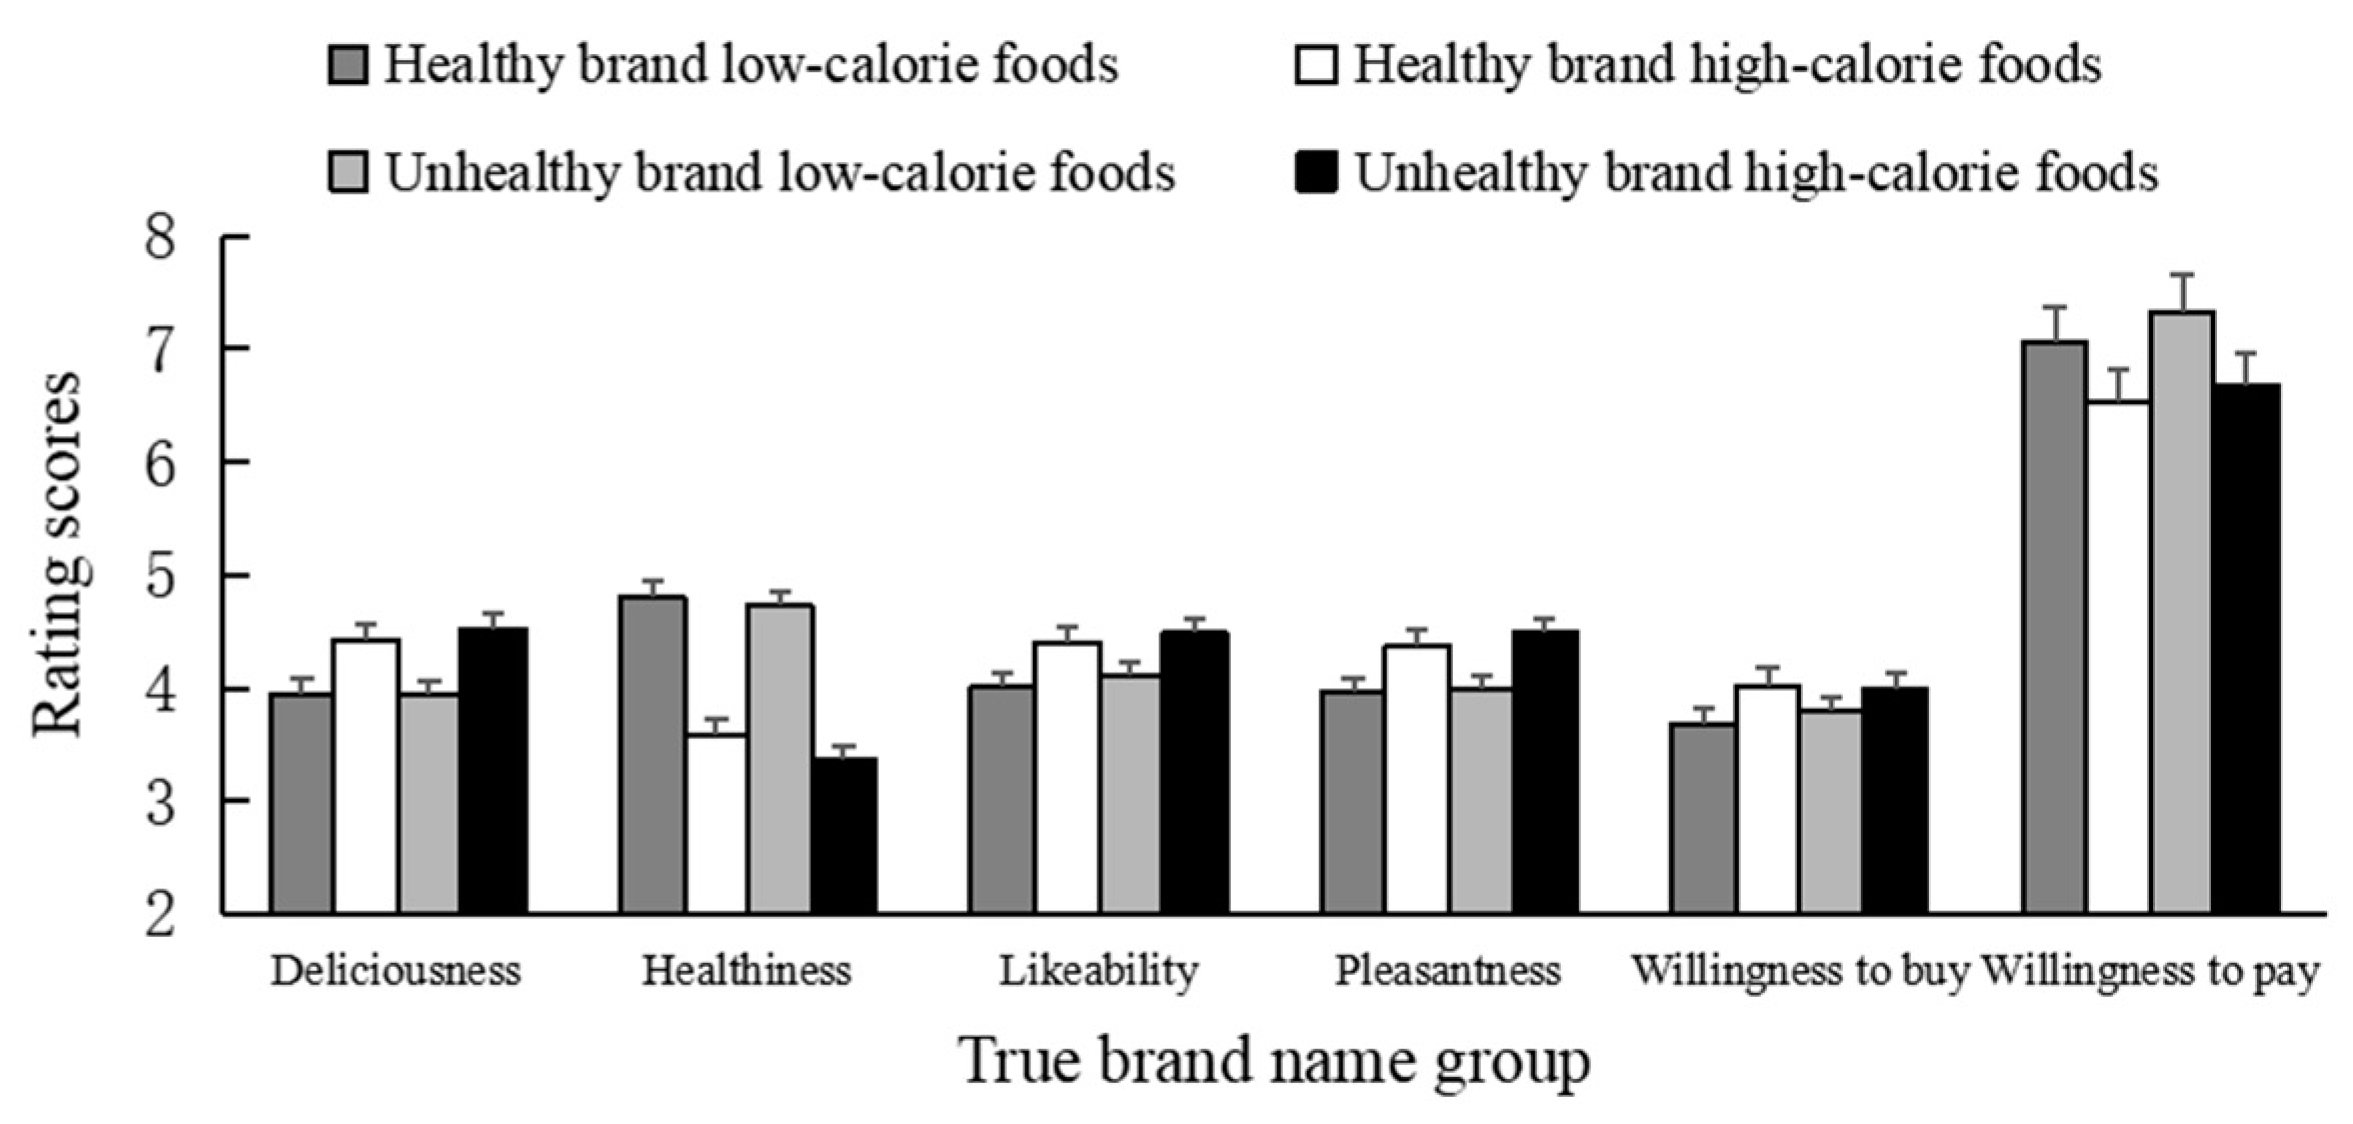
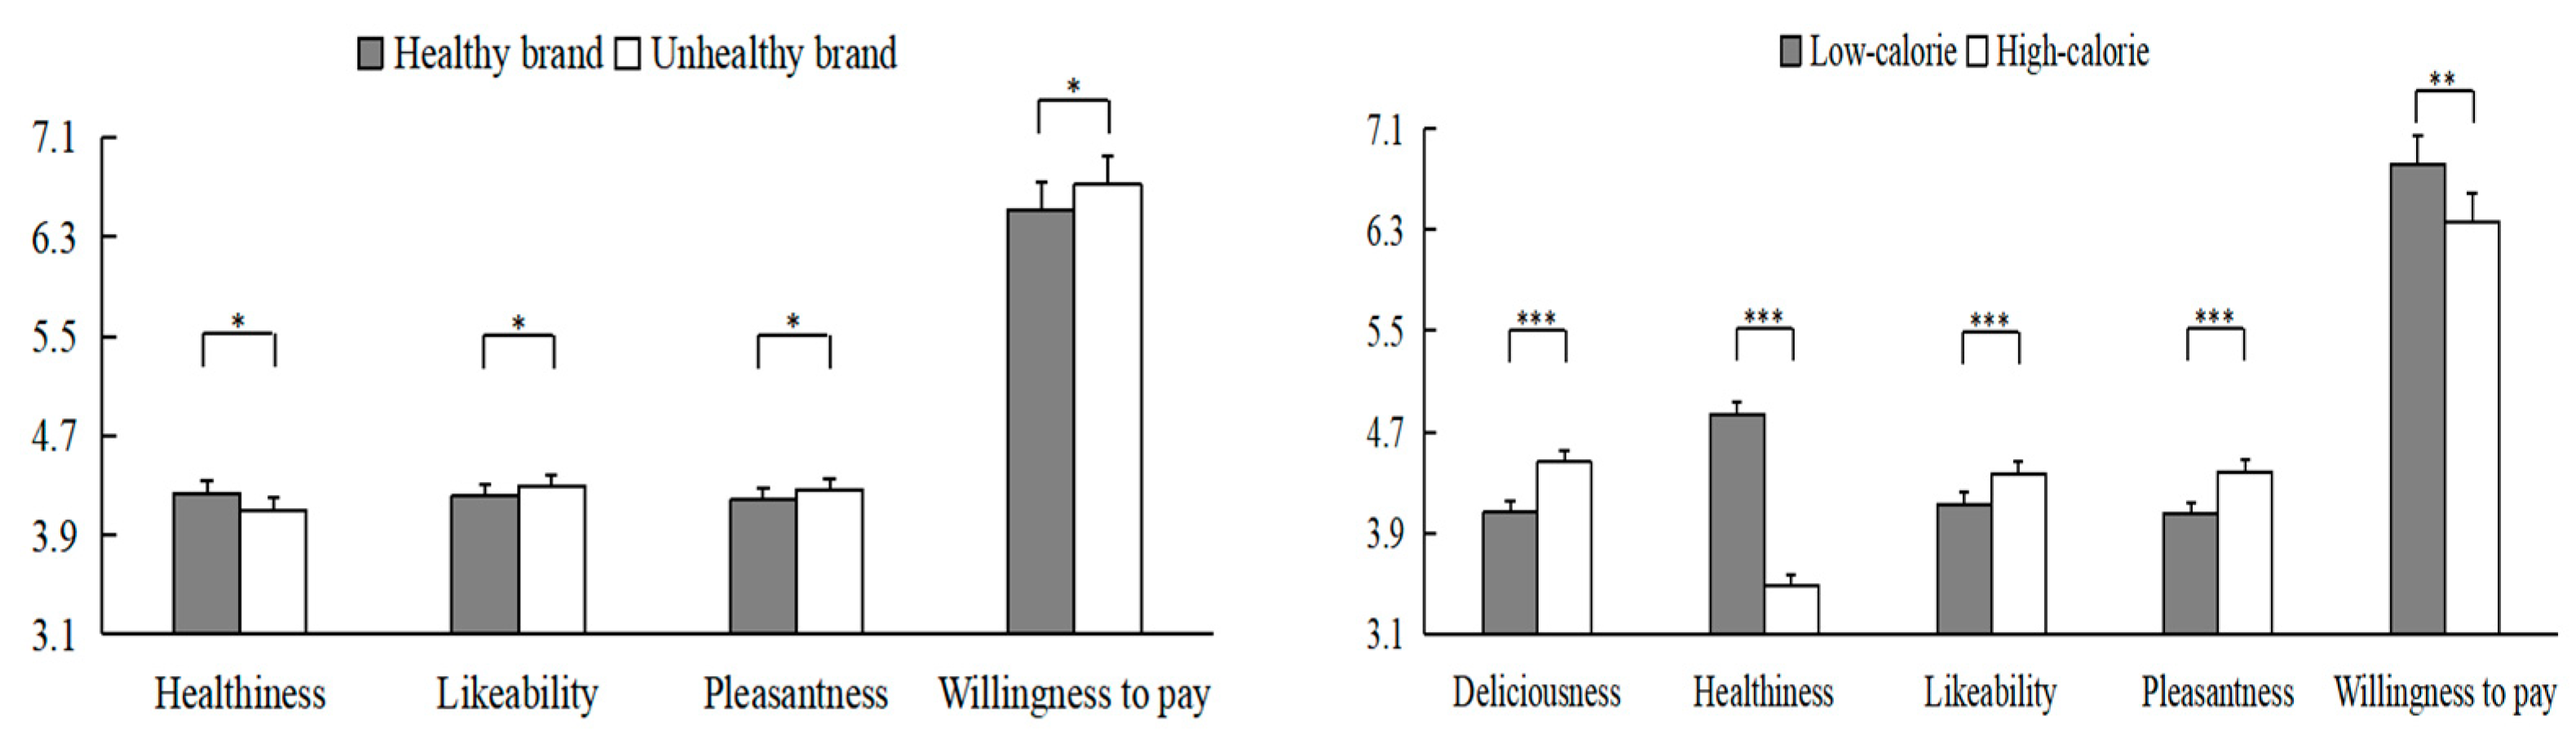
3.2.2. Subjective Ratings
3.2.3. Purchase Intention
4. General Discussion
4.1. Theoretical and Practical Implications
4.2. Limitations and Future Research
Author Contributions
Funding
Institutional Review Board Statement
Informed Consent Statement
Data Availability Statement
Acknowledgments
Conflicts of Interest
Appendix A

Appendix B

Appendix C

References
- Briers, B.; Huh, Y.E.; Chan, E.; Mukhopadhyay, A. The unhealthy = tasty belief is associated with BMI through reduced consumption of vegetables: A cross-national and mediational analysis. Appetite 2020, 150, 104639. [Google Scholar] [CrossRef]
- Ye, N.; Morrin, M.; Kampfer, K. From Glossy to Greasy: The Impact of Learned Associations on Perceptions of Food Healthfulness. J. Consum. Psychol. 2019, 30, 96–124. [Google Scholar] [CrossRef]
- Bonsmann, S.S.G.; Celemín, L.F.; Grunert, K.G.; on behalf of the FLABEL consortium. Food Labelling to Advance Better Education for Life. Eur. J. Clin. Nutr. 2010, 64, S14–S19. [Google Scholar] [CrossRef] [PubMed] [Green Version]
- Finkelstein, S.R.; Fishbach, A. When Healthy Food Makes You Hungry. J. Consum. Res. 2010, 37, 357–367. [Google Scholar] [CrossRef] [Green Version]
- Chernev, A.; Gal, D. Categorization Effects in Value Judgments: Averaging Bias in Evaluating Combinations of Vices and Virtues. J. Mark. Res. 2010, 47, 738–747. [Google Scholar] [CrossRef] [Green Version]
- Kozup, J.C.; Creyer, E.H.; Burton, S. Making Healthful Food Choices: The Influence of Health Claims and Nutrition Information on Consumers’ Evaluations of Packaged Food Products and Restaurant Menu Items. J. Mark. 2003, 67, 19–34. [Google Scholar] [CrossRef] [Green Version]
- Roberto, C.A.; Larsen, P.D.; Agnew, H.; Baik, J.; Brownell, K.D. Evaluating the Impact of Menu Labeling on Food Choices and Intake. Am. J. Public Health 2010, 100, 312–318. [Google Scholar] [CrossRef]
- Temple, J.L.; Johnson, K.; Recupero, K.; Suders, H. Nutrition Labels Decrease Energy Intake in Adults Consuming Lunch in the Laboratory. J. Am. Diet. Assoc. 2010, 110, 1094–1097. [Google Scholar] [CrossRef]
- McCann, M.T.; Wallace, J.M.; Robson, P.J.; Rennie, K.L.; McCaffrey, T.A.; Welch, R.W.; Livingstone, M.B.E. Influence of nutrition labelling on food portion size consumption. Appetite 2013, 65, 153–158. [Google Scholar] [CrossRef]
- Bui, M.; Tangari, A.H.; Haws, K.L. Can health “halos” extend to food packaging? An investigation into food healthfulness perceptions and serving sizes on consumption decisions. J. Bus. Res. 2017, 75, 221–228. [Google Scholar] [CrossRef]
- Liem, D.; Aydin, N.T.; Zandstra, E. Effects of health labels on expected and actual taste perception of soup. Food Qual. Preference 2012, 25, 192–197. [Google Scholar] [CrossRef]
- Hoegg, J.; Alba, J.W. Taste Perception: More than Meets the Tongue. J. Consum. Res. 2007, 33, 490–498. [Google Scholar] [CrossRef]
- Babicz-Zielińska, E.; Pronobis, A. Influence of brand awareness on sensory perception of fruit juices. Handel Wewnętrzny 2018, 1, 162–172. Available online: https://www.proquest.com/openview/2373e8352b825a8b1150190ca81ede27/1?pq-origsite=gscholar&cbl=2050139 (accessed on 2 January 2023).
- Ushiama, S.; Vingerhoeds, M.H.; Kanemura, M.; Kaneko, D.; De Wijk, R.A. Some insights into the development of food and brand familiarity: The case of soy sauce in the Netherlands. Food Res. Int. 2021, 142, 110200. [Google Scholar] [CrossRef] [PubMed]
- Masterson, T.D.; Florissi, C.; Clark, K.R.; Gilbert-Diamond, D. “Healthy”/“Unhealthy” Food Brands Influence Health, Calorie, and Price Ratings of Food. J. Nutr. Educ. Behav. 2020, 52, 874–881. [Google Scholar] [CrossRef]
- Bassett, M.T.; Dumanovsky, T.; Huang, C.; Silver, L.D.; Young, C.; Nonas, C.; Matte, T.D.; Chideya, S.; Frieden, T.R. Purchasing Behavior and Calorie Information at Fast-Food Chains in New York City, 2007. Am. J. Public Health 2008, 98, 1457–1459. [Google Scholar] [CrossRef] [PubMed]
- Chandon, P.; Wansink, B. Is Obesity Caused by Calorie Underestimation? A Psychophysical Model of Meal Size Estimation. J. Mark. Res. 2007, 44, 84–99. [Google Scholar] [CrossRef] [Green Version]
- Feldman, J.M.; Lynch, J.G. Self-generated validity and other effects of measurement on belief, attitude, intention, and behavior. J. Appl. Psychol. 1988, 73, 421–435. [Google Scholar] [CrossRef]
- Hoch, S.J. Availability and interference in predictive judgment. J. Exp. Psychol. Learn. Mem. Cogn. 1984, 10, 649–662. [Google Scholar] [CrossRef]
- Herr, P.M.; Kardes, F.R.; Kim, J. Effects of Word-of-Mouth and Product-Attribute Information on Persuasion: An Accessibility-Diagnosticity Perspective. J. Consum. Res. 1991, 17, 454–462. [Google Scholar] [CrossRef]
- Lee, L.; Frederick, S.; Ariely, D. Try It, You’ll Like It. Psychol. Sci. 2006, 17, 1054–1058. [Google Scholar] [CrossRef] [PubMed]
- Shankar, M.U.; Levitan, C.; Prescott, J.; Spence, C. The Influence of Color and Label Information on Flavor Perception. Chemosens. Percept. 2009, 2, 53–58. [Google Scholar] [CrossRef]
- Ariely, D.; Levav, J. Sequential Choice in Group Settings: Taking the Road Less Traveled and Less Enjoyed. J. Consum. Res. 2000, 27, 279–290. [Google Scholar] [CrossRef]
- Vasiljevic, M.; Pechey, R.; Marteau, T.M. Making food labels social: The impact of colour of nutritional labels and injunctive norms on perceptions and choice of snack foods. Appetite 2015, 91, 56–63. [Google Scholar] [CrossRef] [PubMed] [Green Version]
- Yorkston, E.; Menon, G. A Sound Idea: Phonetic Effects of Brand Names on Consumer Judgments. J. Consum. Res. 2004, 31, 43–51. [Google Scholar] [CrossRef]
- Sweeney, J.C.; Soutar, G.N. Consumer perceived value: The development of a multiple item scale. J. Retail. 2001, 77, 203–220. [Google Scholar] [CrossRef]
- Dodds, W.B.; Monroe, K.B. The Effect of Brand and Price Information on Subjective Product Evaluations. ACR North Am. Adv. 1985, 12, 85–90. [Google Scholar]
- Hanemann, W.M. Willingness to Pay and Willingness to Accept: How Much Can They Differ? Am. Econ. Rev. 1991, 81, 635–647. [Google Scholar] [CrossRef]
- Bialkova, S.; Sasse, L.; Fenko, A. The role of nutrition labels and advertising claims in altering consumers’ evaluation and choice. Appetite 2016, 96, 38–46. [Google Scholar] [CrossRef]
- Bédard, A.; Lamarche, P.-O.; Grégoire, L.-M.; Trudel-Guy, C.; Provencher, V.; Desroches, S.; Lemieux, S. Can eating pleasure be a lever for healthy eating? A systematic scoping review of eating pleasure and its links with dietary behaviors and health. PLoS ONE 2020, 15, e0244292. [Google Scholar] [CrossRef]
- Davidenko, O.; Delarue, J.; Marsset-Baglieri, A.; Fromentin, G.; Tomé, D.; Nadkarni, N.; Darcel, N. Assimilation and Contrast are on the same scale of food anticipated-experienced pleasure divergence. Appetite 2015, 90, 160–167. [Google Scholar] [CrossRef] [PubMed]
- Wen, J.; Lin, Z.; Liu, X.; Xiao, S.H.; Li, Y. The Interaction Effects of Online Reviews, Brand, and Price on Consumer Hotel Booking Decision Making. J. Travel Res. 2020, 60, 846–859. [Google Scholar] [CrossRef]
- Werner, C.P.; Birkhaeuer, J.; Locher, C.; Gerger, H.; Heimgartner, N.; Colagiuri, B.; Gaab, J. Price information influences the subjective experience of wine: A framed field experiment. Food Qual. Prefer. 2021, 92, 104223. [Google Scholar] [CrossRef]
- Yu, A.; Yu, S.; Liu, H. How a “China-made” label influences Chinese Youth’s product evaluation: The priming effect of patriotic and nationalistic news. J. Retail. Consum. Serv. 2022, 66, 102899. [Google Scholar] [CrossRef]
- Cho, C.H.; Mattila, A.; Bordi, P.; Kwon, E. It tastes better when Bach meets red: The role of music and plate color on food evaluation. Br. Food J. 2019, 122, 14–25. [Google Scholar] [CrossRef]
- Roberto, C.A.; Ng, S.W.; Ganderats-Fuentes, M.; Hammond, D.; Barquera, S.; Jauregui, A.; Taillie, L.S. The Influence of Front-of-Package Nutrition Labeling on Consumer Behavior and Product Reformulation. Annu. Rev. Nutr. 2021, 41, 529–550. [Google Scholar] [CrossRef]
- Ikonen, I.; Sotgiu, F.; Aydinli, A.; Verlegh, P.W.J. Consumer effects of front-of-package nutrition labeling: An interdisciplinary meta-analysis. J. Acad. Mark. Sci. 2019, 48, 360–383. [Google Scholar] [CrossRef] [Green Version]
- Ansorena, D.; Cama, S.; Alejandre, M.; Astiasarán, I. Health-related messages in the labeling of processed meat products: A market evaluation. Food Nutr. Res. 2019, 63, 3358. [Google Scholar] [CrossRef] [Green Version]
- De Chernatony, L. Creating Powerful Brands; Routledge: London, UK, 2010. [Google Scholar] [CrossRef]


| Effect | Measure | F (1, 155) | ηp2 | Measure | F (1, 155) | ηp2 |
|---|---|---|---|---|---|---|
| Brand type | Deliciousness | 28.19 *** | 0.15 | Willingness to buy | 0.09 | - |
| Healthiness | 60.71 *** | 0.28 | Willingness to pay | 0.95 | - | |
| Likeability | 8.41 ** | 0.05 | ||||
| Pleasantness | 8.19 ** | 0.05 | ||||
| Food calories | Deliciousness | 52.83 *** | 0.25 | Willingness to buy | 2.62 | - |
| Healthiness | 377.78 *** | 0.71 | Willingness to pay | 3.49 | - | |
| Likeability | 20.02 *** | 0.11 | ||||
| Pleasantness | 35.35 *** | 0.19 | ||||
| Brand type | Deliciousness | 9.63 ** | 0.06 | Willingness to buy | 13.55 *** | 0.08 |
| × | Healthiness | 0.33 | - | Willingness to pay | 0.44 | - |
| Food calories | Likeability | 10.13 ** | 0.06 | |||
| Pleasantness | 15.70 *** | 0.09 |
| Effect | Measure | F (1, 144) | ηp2 | Measure | F (1, 144) | ηp2 |
|---|---|---|---|---|---|---|
| Brand type | Deliciousness | 0.78 | - | Willingness to buy | 0.59 | - |
| Healthiness | 5.95 * | 0.04 | Willingness to pay | 6.03 * | 0.04 | |
| Likeability | 4.75 * | 0.03 | ||||
| Pleasantness | 4.03 * | 0.03 | ||||
| Food calories | Deliciousness | 33.44 *** | 0.19 | Willingness to buy | 2.43 | - |
| Healthiness | 177.70 *** | 0.55 | Willingness to pay | 11.15 ** | 0.07 | |
| Likeability | 15.16 *** | 0.10 | ||||
| Pleasantness | 28.37 *** | 0.17 | ||||
| Diagnosticity | Deliciousness | 0.36 | - | Willingness to buy | 0.85 | - |
| Healthiness | 0.40 | - | Willingness to pay | 1.64 | - | |
| Likeability | 0.00 | - | ||||
| Pleasantness | 0.02 | - | ||||
| Brand type | Deliciousness | 6.30 * | 0.04 | Willingness to buy | 0.14 | - |
| × | Healthiness | 5.00 * | 0.03 | Willingness to pay | 0.85 | - |
| Food calories | Likeability | 0.00 | - | |||
| Pleasantness | 2.75 | - | ||||
| Brand type | Deliciousness | 0.03 | - | Willingness to buy | 0.10 | - |
| × | Healthiness | 0.12 | - | Willingness to pay | 0.00 | - |
| Diagnosticity | Likeability | 0.00 | - | |||
| Pleasantness | 0.05 | - | ||||
| Food calories | Deliciousness | 3.68 | - | Willingness to buy | 3.79 | - |
| × | Healthiness | 0.42 | - | Willingness to pay | 2.04 | - |
| Diagnosticity | Likeability | 4.86 * | 0.03 | |||
| Pleasantness | 3.47 | - | ||||
| Brand type | Deliciousness | 0.68 | - | Willingness to buy | 2.66 | - |
| × | Healthiness | 0.25 | - | Willingness to pay | 3.91 * | 0.03 |
| Food calories | Likeability | 0.10 | - | |||
| × | Pleasantness | 0.16 | - | |||
| Diagnosticity |
Disclaimer/Publisher’s Note: The statements, opinions and data contained in all publications are solely those of the individual author(s) and contributor(s) and not of MDPI and/or the editor(s). MDPI and/or the editor(s) disclaim responsibility for any injury to people or property resulting from any ideas, methods, instructions or products referred to in the content. |
© 2023 by the authors. Licensee MDPI, Basel, Switzerland. This article is an open access article distributed under the terms and conditions of the Creative Commons Attribution (CC BY) license (https://creativecommons.org/licenses/by/4.0/).
Share and Cite
Zhang, C.; Han, J.; Guo, X.; Huang, J. Influence of Healthy Brand and Diagnosticity of Brand Name on Subjective Ratings of High- and Low-Calorie Food. Behav. Sci. 2023, 13, 70. https://doi.org/10.3390/bs13010070
Zhang C, Han J, Guo X, Huang J. Influence of Healthy Brand and Diagnosticity of Brand Name on Subjective Ratings of High- and Low-Calorie Food. Behavioral Sciences. 2023; 13(1):70. https://doi.org/10.3390/bs13010070
Chicago/Turabian StyleZhang, Chengchen, Jiayi Han, Xiyu Guo, and Jianping Huang. 2023. "Influence of Healthy Brand and Diagnosticity of Brand Name on Subjective Ratings of High- and Low-Calorie Food" Behavioral Sciences 13, no. 1: 70. https://doi.org/10.3390/bs13010070