
Statistical Nonparametric fMRI Maps in the Analysis of Response Inhibition in Abstinent Individuals with History of Alcohol Use Disorder

 ,
,  , ,
, ,
Abstract
:1. Introduction
2. Materials and Methods
2.1. Participants
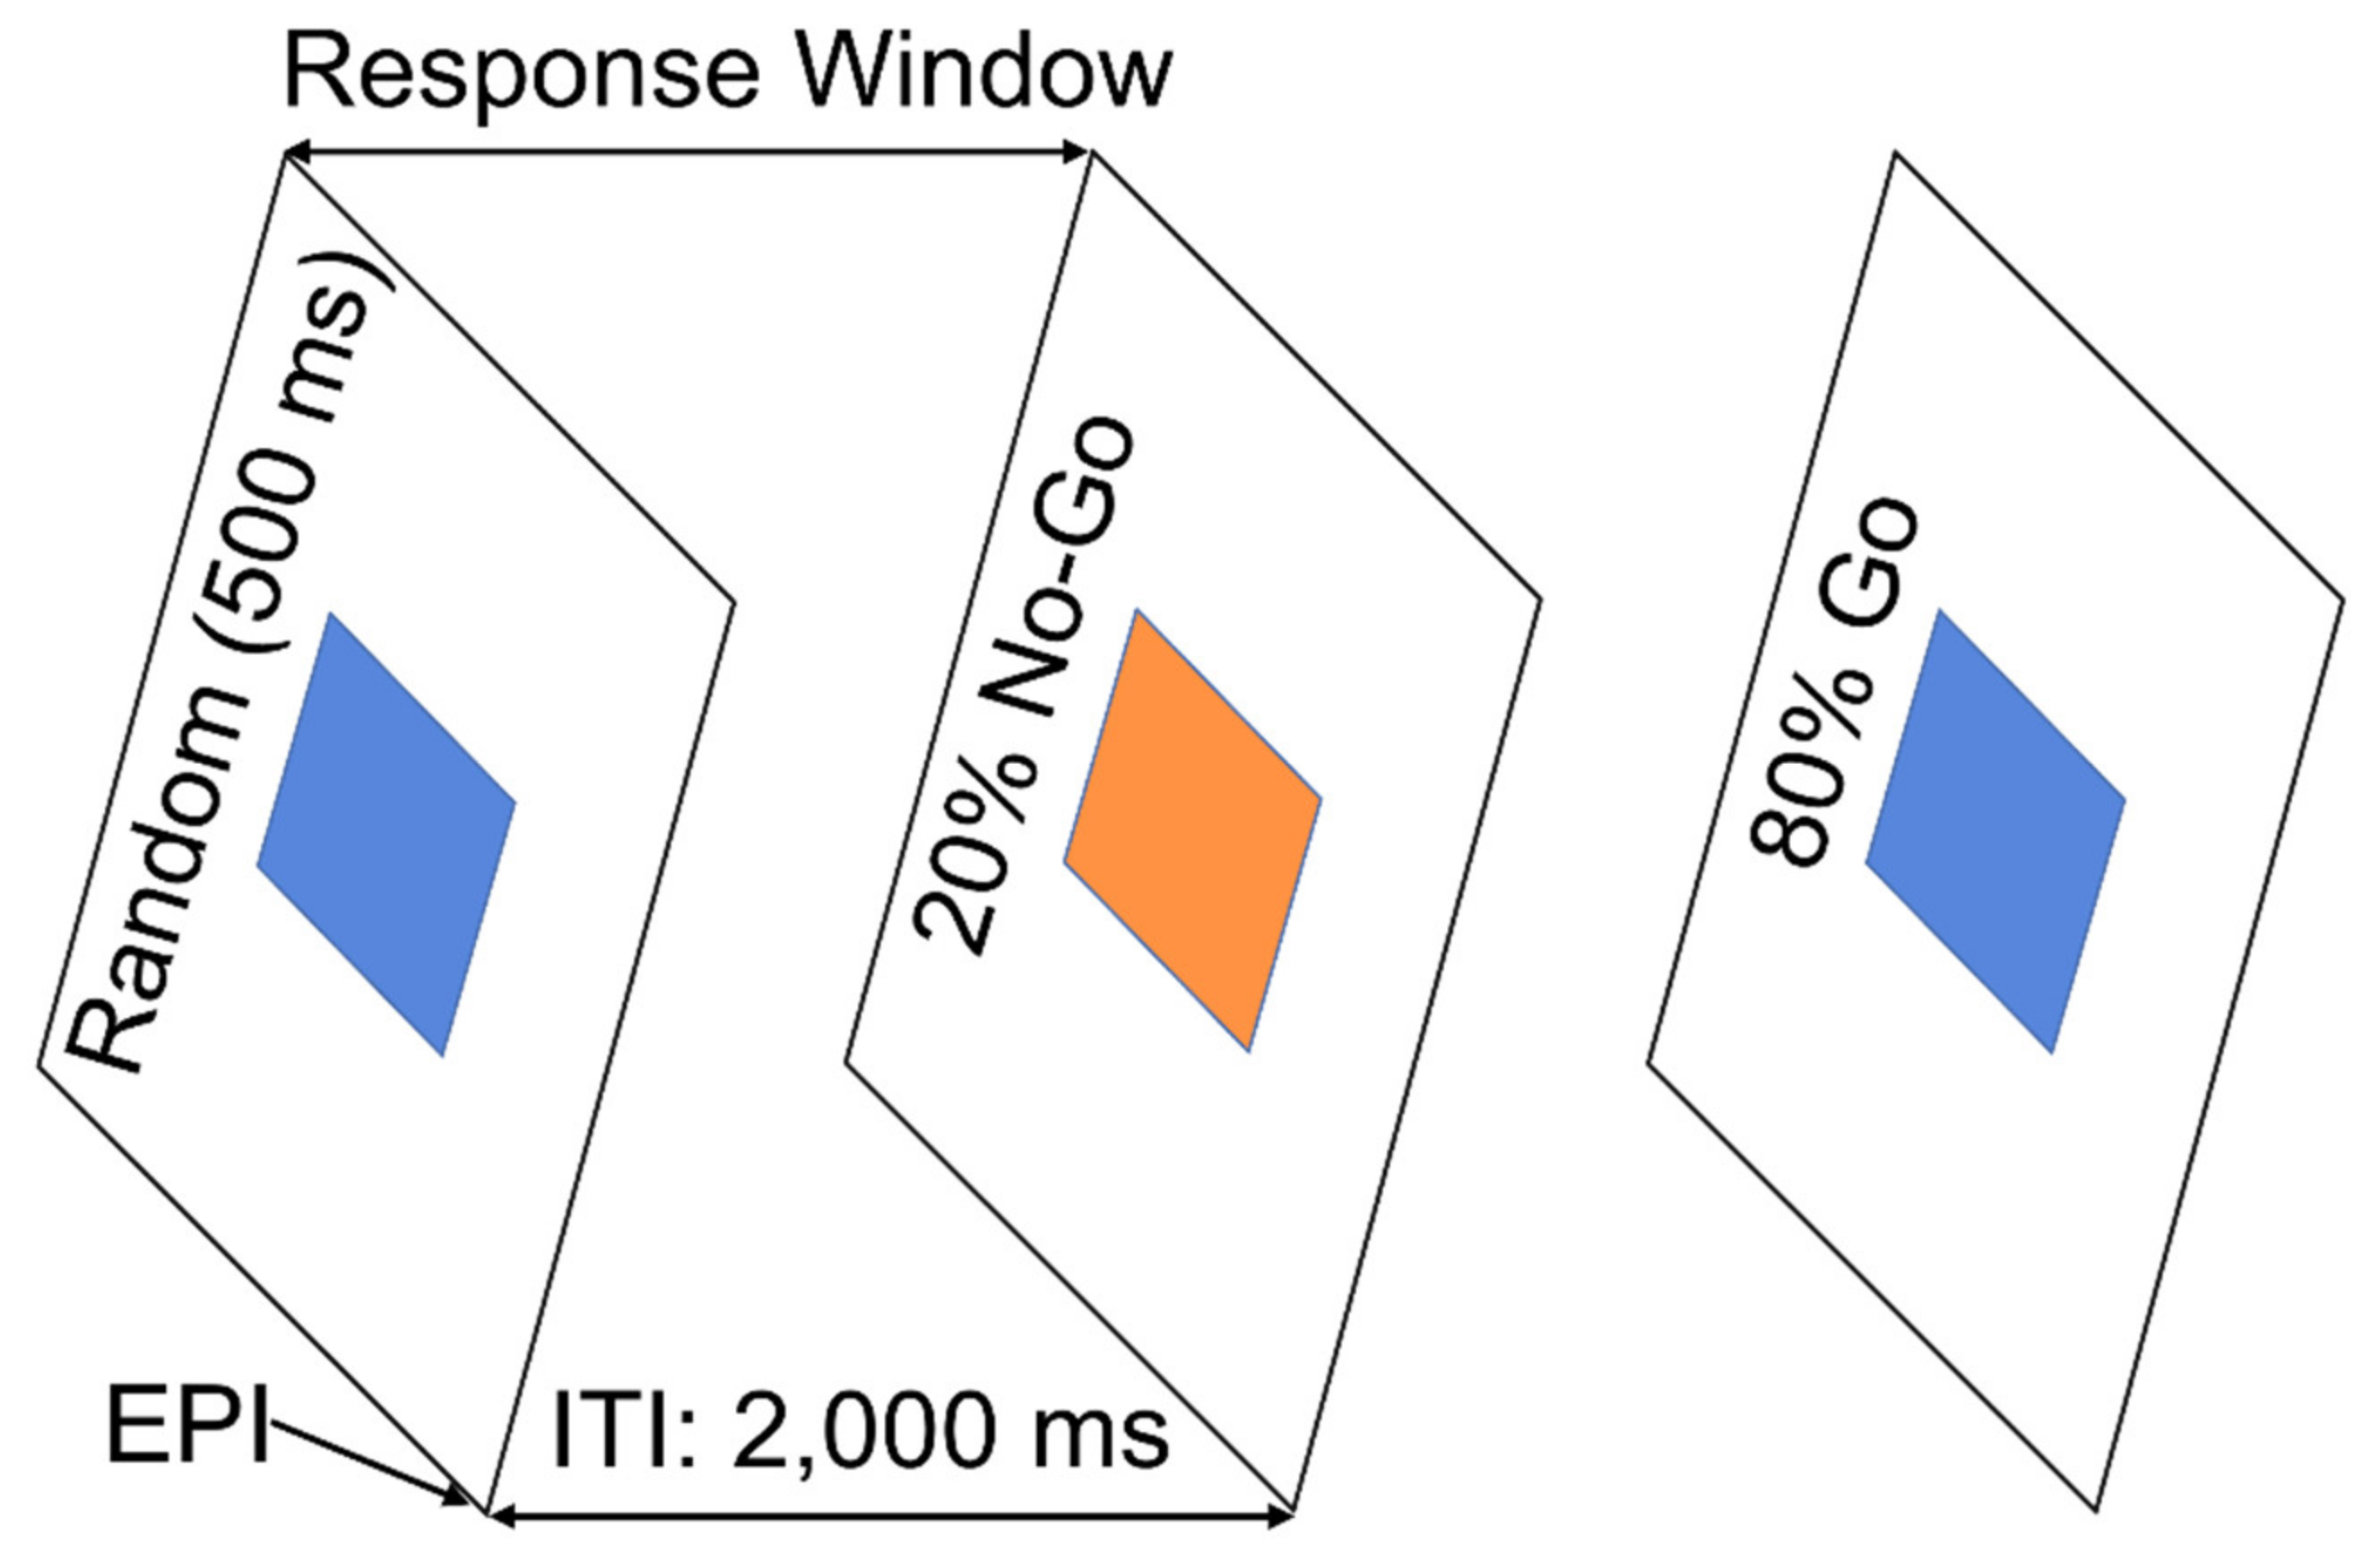
2.2. Go/NoGo Task
2.3. Image Acquisition
2.4. fMRI Pre-Processing
2.5. Subject-Level BOLD Response: NoGo vs. Go
2.6. Intersubject Registration
2.7. Group-Level BOLD Response
2.8. Differential BOLD Response: NoGo vs. Go
2.9. Differential BOLD Response: AUD vs. Controls
2.10. Analyses of Demographic, Clinical, and Performance Data
3. Results
3.1. Demographic, Clinical, and Performance Data
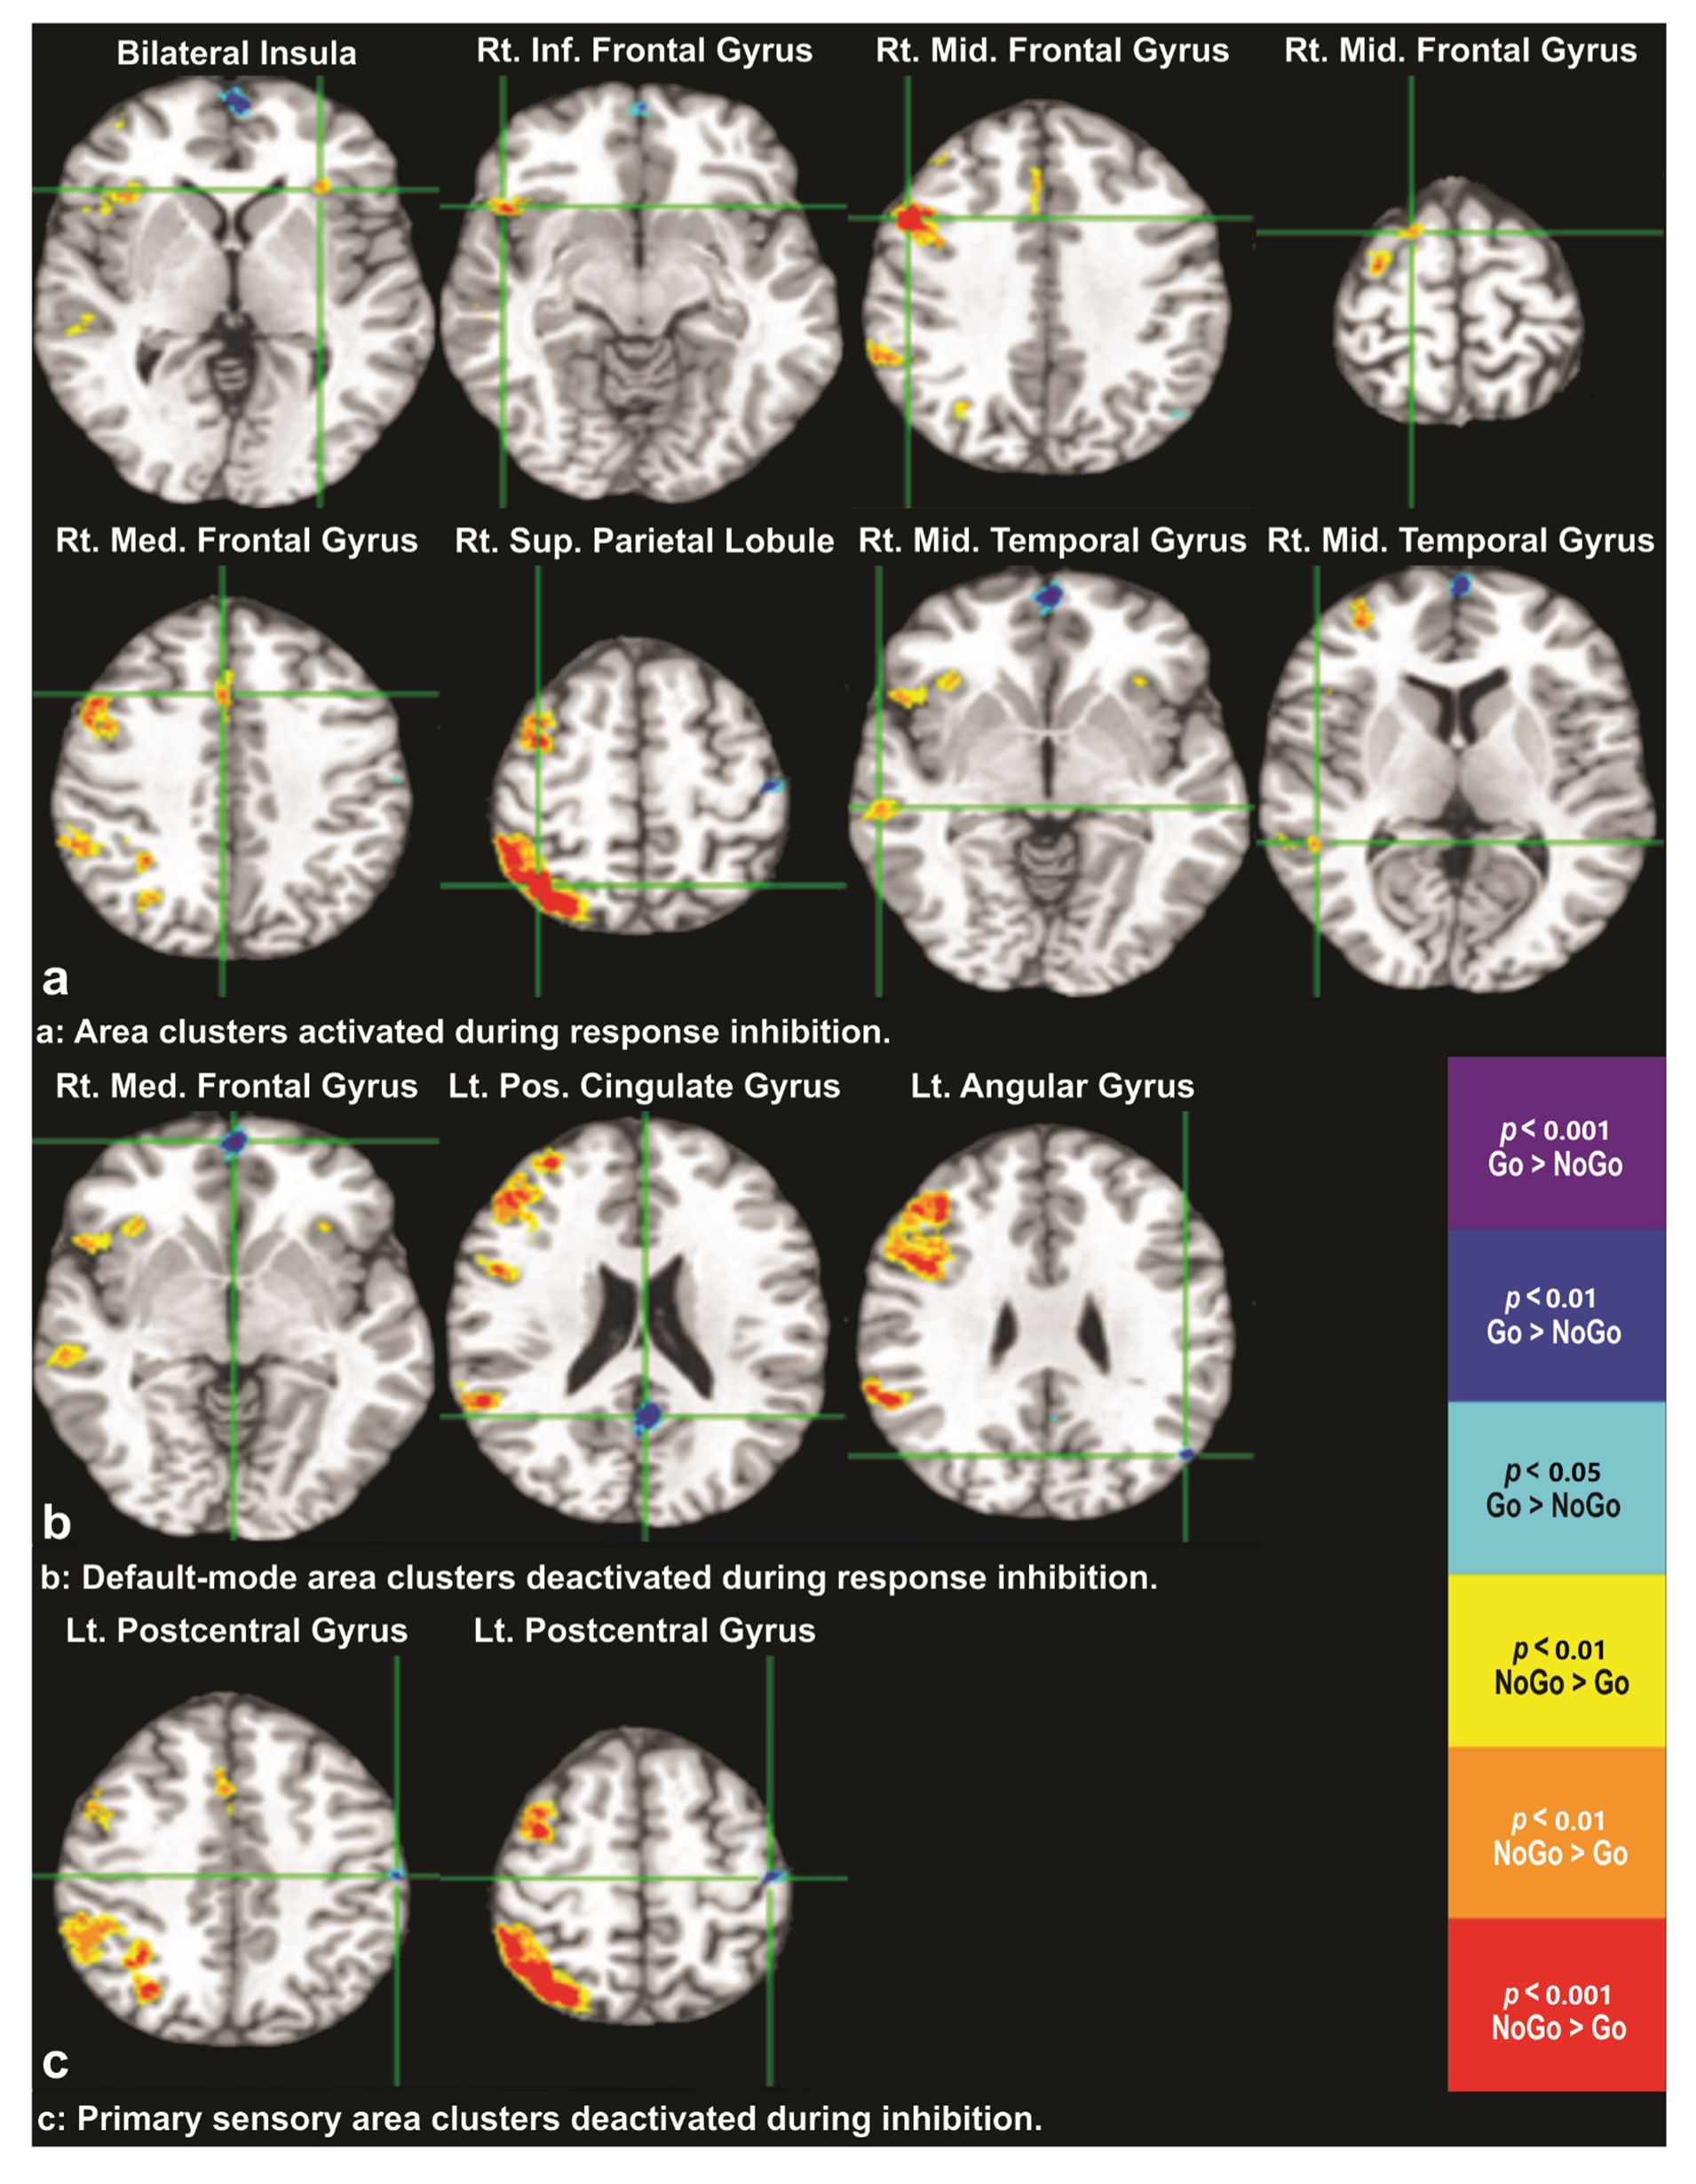
3.2. Differential BOLD Response: NoGo vs. Go
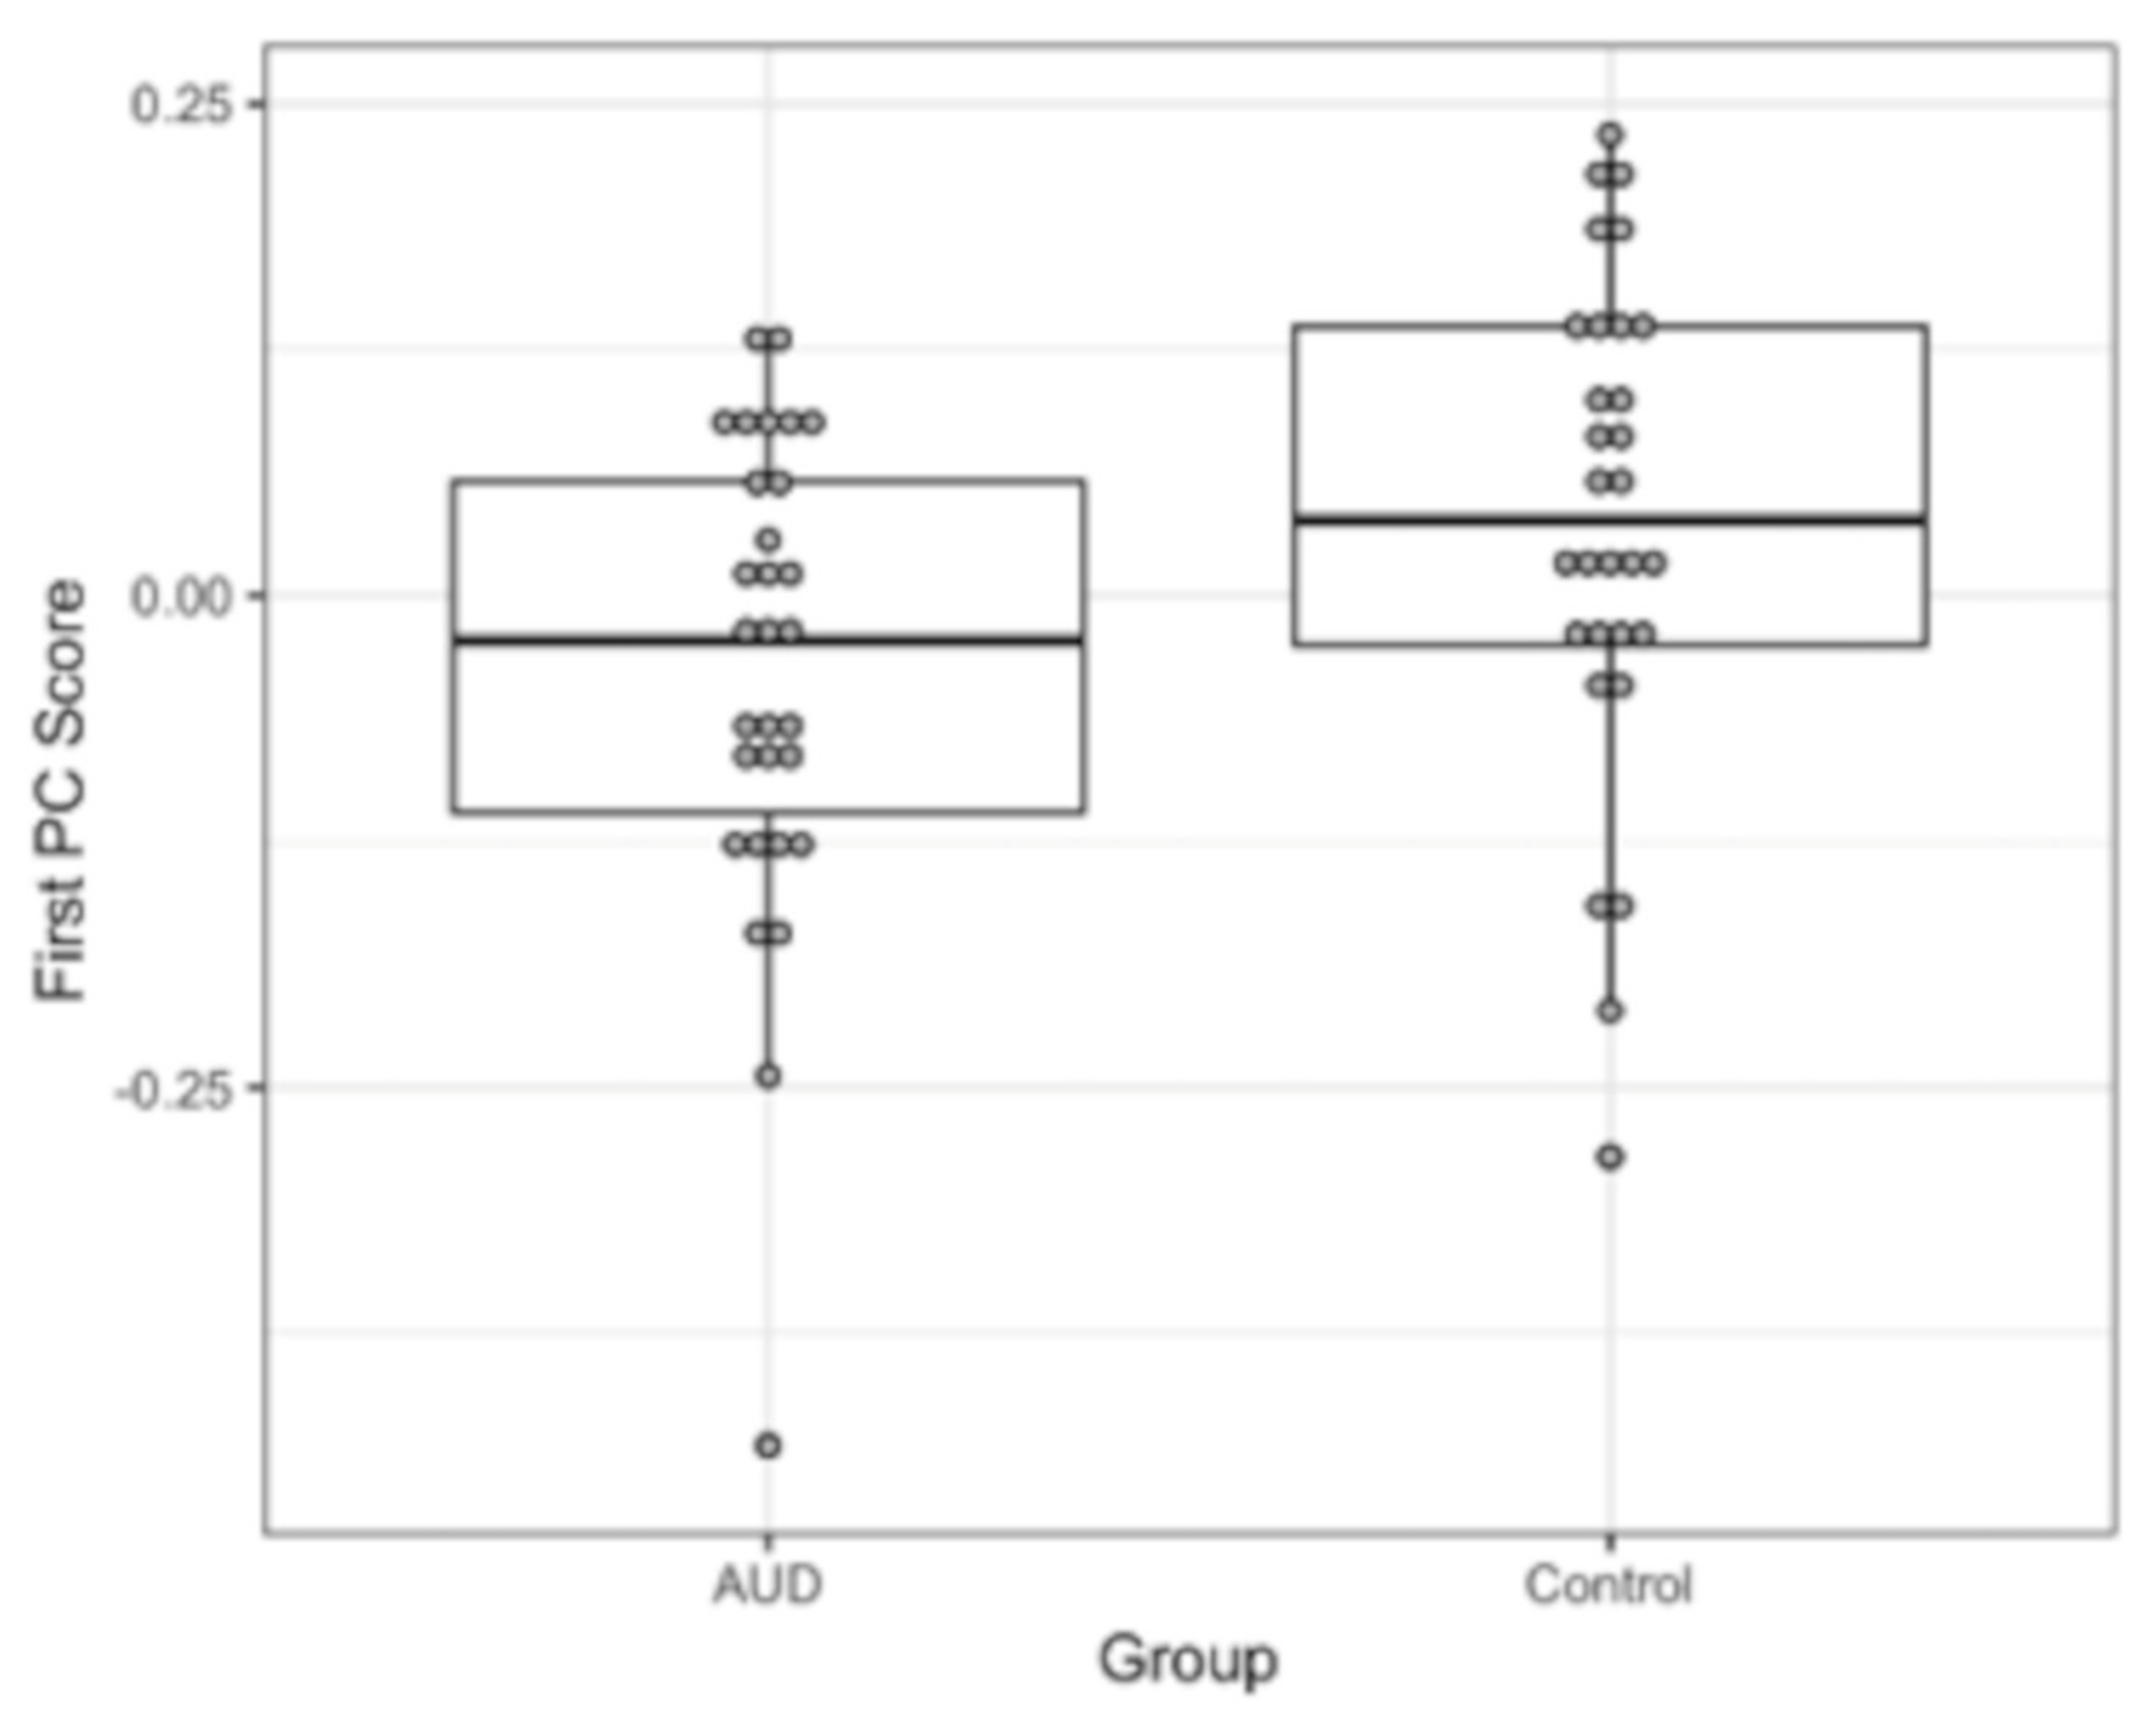
3.3. Differential BOLD Response: AUD vs. Controls
4. Discussion
4.1. Inhibitory Functions and Its Brain Substrates
4.2. Impairments of Response Inhibition in Abstinent AUD
4.3. Implications
4.4. Limitations and Future Directions
5. Conclusions
Supplementary Materials
Author Contributions
Funding
Institutional Review Board Statement
Informed Consent Statement
Data Availability Statement
Acknowledgments
Conflicts of Interest
References
- Diamond, A. Executive functions. Annu. Rev. Psychol. 2013, 64, 135–168. [Google Scholar] [CrossRef] [PubMed] [Green Version]
- Miyake, A.; Friedman, N.P.; Emerson, M.J.; Witzki, A.H.; Howerter, A.; Wager, T.D. The unity and diversity of executive functions and their contributions to complex “Frontal Lobe” tasks: A latent variable analysis. Cogn. Psychol. 2000, 41, 49–100. [Google Scholar] [CrossRef] [PubMed] [Green Version]
- Lehto, J.E.; Juujarvi, P.; Kooistra, L.; Pulkkinen, L. Dimensions of executive functioning: Evidence from children. Br. J. Dev. Psychol. 2003, 21, 59–80. [Google Scholar] [CrossRef]
- Lunt, L.; Bramham, J.; Morris, R.G.; Bullock, P.R.; Selway, R.P.; Xenitidis, K.; David, A.S. Prefrontal cortex dysfunction and ‘Jumping to Conclusions’: Bias or deficit? J. Neuropsychol. 2012, 6, 65–78. [Google Scholar] [CrossRef]
- Collins, A.; Koechlin, E. Reasoning, learning, and creativity: Frontal lobe function and human decision-making. PLoS Biol. 2012, 10, e1001293. [Google Scholar] [CrossRef]
- Liston, C.; McEwen, B.S.; Casey, B.J. Psychosocial stress reversibly disrupts prefrontal processing and attentional control. Proc. Natl. Acad. Sci. USA 2009, 106, 912–917. [Google Scholar] [CrossRef] [Green Version]
- Oaten, M.; Cheng, K. Academic examination stress impairs self-control. J. Soc. Clin. Psychol. 2005, 24, 254–279. [Google Scholar] [CrossRef]
- Hirt, E.R.; Devers, E.E.; McCrea, S.M. I want to be creative: Exploring the role of hedonic contingency theory in the positive mood-cognitive flexibility link. J. Pers. Soc. Psychol. 2008, 94, 214–230. [Google Scholar] [CrossRef] [Green Version]
- Tun, P.A.; Miller-Martinez, D.; Lachman, M.E.; Seeman, T. Social strain and executive function across the lifespan: The dark (and light) sides of social engagement. Neuropsychol. Dev. Cogn. B Aging Neuropsychol. Cogn. 2013, 20, 320–338. [Google Scholar] [CrossRef] [Green Version]
- Barnes, M.E.; Gozal, D.; Molfese, D.L. Attention in children with obstructive sleep apnoea: An event-related potentials study. Sleep Med. 2012, 13, 368–377. [Google Scholar] [CrossRef]
- Chaddock, L.; Hillman, C.H.; Buck, S.M.; Cohen, N.J. Aerobic Fitness and Executive Control of Relational Memory in Preadolescent Children. Med. Sci. Sports Exerc. 2011, 43, 344–349. [Google Scholar] [CrossRef] [Green Version]
- Zahr, N.M.; Pfefferbaum, A. Alcohol’s Effects on the Brain: Neuroimaging Results in Humans and Animal Models. Alcohol Res. 2017, 38, 183–206. [Google Scholar]
- Zahr, N.M.; Pfefferbaum, A.; Sullivan, E.V. Perspectives on fronto-fugal circuitry from human imaging of alcohol use disorders. Neuropharmacology 2017, 122, 189–200. [Google Scholar] [CrossRef]
- Sullivan, E.V. Contributions to Understanding the Neuropsychology of Alcoholism: An INS Legacy. J. Int. Neuropsychol. Soc. 2017, 23, 843–859. [Google Scholar] [CrossRef] [Green Version]
- Sullivan, E.V.; Harris, R.A.; Pfefferbaum, A. Alcohol’s Effects on Brain and Behavior. Alcohol Res. Health J. Natl. Inst. Alcohol Abus. Alcohol. 2010, 33, 127–143. [Google Scholar]
- Le Berre, A.P.; Fama, R.; Sullivan, E.V. Executive Functions, Memory, and Social Cognitive Deficits and Recovery in Chronic Alcoholism: A Critical Review to Inform Future Research. Alcohol. Clin. Exp. Res. 2017, 41, 1432–1443. [Google Scholar] [CrossRef]
- Stavro, K.; Pelletier, J.; Potvin, S. Widespread and sustained cognitive deficits in alcoholism: A meta-analysis. Addict. Biol. 2013, 18, 203–213. [Google Scholar] [CrossRef]
- Fein, G.; Torres, J.; Price, L.J.; Di Sclafani, V. Cognitive performance in long-term abstinent alcoholic individuals. Alcohol. Clin. Exp. Res. 2006, 30, 1538–1544. [Google Scholar] [CrossRef] [Green Version]
- Rourke, S.B.; Grant, I. The interactive effects of age and length of abstinence on the recovery of neuropsychological functioning in chronic male alcoholics: A 2-year follow-up study. J. Int. Neuropsychol. Soc. 1999, 5, 234–246. [Google Scholar] [CrossRef]
- Munro, C.A.; Saxton, J.; Butters, M.A. The neuropsychological consequences of abstinence among older alcoholics: A cross-sectional study. Alcohol. Clin. Exp. Res. 2000, 24, 1510–1516. [Google Scholar] [CrossRef]
- Nowakowska-Domagala, K.; Jablkowska-Gorecka, K.; Mokros, L.; Koprowicz, J.; Pietras, T. Differences in the verbal fluency, working memory and executive functions in alcoholics: Short-term vs. long-term abstainers. Psychiatry Res. 2017, 249, 1–8. [Google Scholar] [CrossRef] [PubMed]
- Ando, B.; Must, A.; Kurgyis, E.; Szkaliczki, A.; Drotos, G.; Rozsa, S.; Szikszay, P.; Horvath, S.; Janka, Z.; Almos, P.Z. Personality traits and coping compensate for disadvantageous decision-making in long-term alcohol abstinence. Alcohol Alcohol. 2012, 47, 18–24. [Google Scholar] [CrossRef] [PubMed] [Green Version]
- Fein, G.; Klein, L.; Finn, P. Impairment on a simulated gambling task in long-term abstinent alcoholics. Alcohol. Clin. Exp. Res. 2004, 28, 1487–1491. [Google Scholar] [CrossRef] [PubMed] [Green Version]
- Pandey, A.K.; Ardekani, B.A.; Kamarajan, C.; Zhang, J.; Chorlian, D.B.; Byrne, K.N.; Pandey, G.; Meyers, J.L.; Kinreich, S.; Stimus, A.; et al. Lower Prefrontal and Hippocampal Volume and Diffusion Tensor Imaging Differences Reflect Structural and Functional Abnormalities in Abstinent Individuals with Alcohol Use Disorder. Alcohol. Clin. Exp. Res. 2018, 42, 1883–1896. [Google Scholar] [CrossRef]
- Kendler, K.S.; Prescott, C.A.; Myers, J.; Neale, M.C. The structure of genetic and environmental risk factors for common psychiatric and substance use disorders in men and women. Arch. Gen. Psychiatry 2003, 60, 929–937. [Google Scholar] [CrossRef] [Green Version]
- Aron, A.R. From reactive to proactive and selective control: Developing a richer model for stopping inappropriate responses. Biol. Psychiatry 2011, 69, e55–e68. [Google Scholar] [CrossRef] [PubMed] [Green Version]
- Chambers, C.D.; Garavan, H.; Bellgrove, M.A. Insights into the neural basis of response inhibition from cognitive and clinical neuroscience. Neurosci. Biobehav. Rev. 2009, 33, 631–646. [Google Scholar] [CrossRef] [PubMed]
- Aron, A.R.; Robbins, T.W.; Poldrack, R.A. Inhibition and the right inferior frontal cortex: One decade on. Trends Cogn. Sci. 2014, 18, 177–185. [Google Scholar] [CrossRef]
- Zhang, R.; Geng, X.; Lee, T.M.C. Large-scale functional neural network correlates of response inhibition: An fMRI meta-analysis. Brain Struct. Funct. 2017, 222, 3973–3990. [Google Scholar] [CrossRef] [Green Version]
- Hampshire, A. Putting the brakes on inhibitory models of frontal lobe function. Neuroimage 2015, 113, 340–355. [Google Scholar] [CrossRef] [Green Version]
- Hampshire, A.; Chamberlain, S.R.; Monti, M.M.; Duncan, J.; Owen, A.M. The role of the right inferior frontal gyrus: Inhibition and attentional control. Neuroimage 2010, 50, 1313–1319. [Google Scholar] [CrossRef] [Green Version]
- Hampshire, A.; Sharp, D.J. Contrasting network and modular perspectives on inhibitory control. Trends Cogn. Sci. 2015, 19, 445–452. [Google Scholar] [CrossRef]
- Erika-Florence, M.; Leech, R.; Hampshire, A. A functional network perspective on response inhibition and attentional control. Nat. Commun. 2014, 5, 4073. [Google Scholar] [CrossRef] [Green Version]
- Watanabe, J.; Sugiura, M.; Sato, K.; Sato, Y.; Maeda, Y.; Matsue, Y.; Fukuda, H.; Kawashima, R. The human prefrontal and parietal association cortices are involved in NO-GO performances: An event-related fMRI study. Neuroimage 2002, 17, 1207–1216. [Google Scholar] [CrossRef] [Green Version]
- Zilverstand, A.; Huang, A.S.; Alia-Klein, N.; Goldstein, R.Z. Neuroimaging Impaired Response Inhibition and Salience Attribution in Human Drug Addiction: A Systematic Review. Neuron 2018, 98, 886–903. [Google Scholar] [CrossRef] [Green Version]
- Czapla, M.; Baeuchl, C.; Simon, J.J.; Richter, B.; Kluge, M.; Friederich, H.C.; Mann, K.; Herpertz, S.C.; Loeber, S. Do alcohol-dependent patients show different neural activation during response inhibition than healthy controls in an alcohol-related fMRI go/no-go-task? Psychopharmacology 2017, 234, 1001–1015. [Google Scholar] [CrossRef]
- Stein, M.; Steiner, L.; Fey, W.; Conring, F.; Rieger, K.; Federspiel, A.; Moggi, F. Alcohol-related context modulates neural correlates of inhibitory control in alcohol dependent patients: Preliminary data from an fMRI study using an alcohol-related Go/NoGo-task. Behav. Brain Res. 2021, 398, 112973. [Google Scholar] [CrossRef]
- Dresler, T.; Schecklmann, M.; Ernst, L.H.; Pohla, C.; Warrings, B.; Fischer, M.; Polak, T.; Fallgatter, A.J. Recovery of cortical functioning in abstinent alcohol-dependent patients: Prefrontal brain oxygenation during verbal fluency at different phases during withdrawal. World J. Biol. Psychiatry Off. J. World Fed. Soc. Biol. Psychiatry 2012, 13, 135–145. [Google Scholar] [CrossRef]
- Li, C.S.; Luo, X.; Yan, P.; Bergquist, K.; Sinha, R. Altered impulse control in alcohol dependence: Neural measures of stop signal performance. Alcohol. Clin. Exp. Res. 2009, 33, 740–750. [Google Scholar] [CrossRef] [Green Version]
- Akine, Y.; Kato, M.; Muramatsu, T.; Umeda, S.; Mimura, M.; Asai, Y.; Tanada, S.; Obata, T.; Ikehira, H.; Kashima, H.; et al. Altered brain activation by a false recognition task in young abstinent patients with alcohol dependence. Alcohol. Clin. Exp. Res. 2007, 31, 1589–1597. [Google Scholar] [CrossRef]
- Fein, G.; Cardenas, V.A. Neuroplasticity in Human Alcoholism: Studies of Extended Abstinence with Potential Treatment Implications. Alcohol Res. 2015, 37, 125–141. [Google Scholar] [PubMed]
- Camchong, J.; Stenger, A.; Fein, G. Resting-state synchrony in long-term abstinent alcoholics. Alcohol. Clin. Exp. Res. 2013, 37, 75–85. [Google Scholar] [CrossRef] [PubMed]
- Eklund, A.; Nichols, T.E.; Knutsson, H. Cluster failure: Why fMRI inferences for spatial extent have inflated false-positive rates. Proc. Natl. Acad. Sci. USA 2016, 113, 7900–7905. [Google Scholar] [CrossRef] [PubMed] [Green Version]
- Eklund, A.; Andersson, M.; Josephson, C.; Johannesson, M.; Knutsson, H. Does parametric fMRI analysis with SPM yield valid results? An empirical study of 1484 rest datasets. Neuroimage 2012, 61, 565–578. [Google Scholar] [CrossRef] [Green Version]
- Nichols, T.E.; Holmes, A.P. Nonparametric permutation tests for functional neuroimaging: A primer with examples. Hum. Brain Mapp. 2002, 15, 1–25. [Google Scholar] [CrossRef] [Green Version]
- Kamarajan, C.; Ardekani, B.A.; Pandey, A.K.; Kinreich, S.; Pandey, G.; Chorlian, D.B.; Meyers, J.L.; Zhang, J.; Bermudez, E.; Stimus, A.T.; et al. Random Forest Classification of Alcohol Use Disorder Using fMRI Functional Connectivity, Neuropsychological Functioning, and Impulsivity Measures. Brain Sci. 2020, 10, 115. [Google Scholar] [CrossRef] [Green Version]
- Kamarajan, C.; Ardekani, B.A.; Pandey, A.K.; Chorlian, D.B.; Kinreich, S.; Pandey, G.; Meyers, J.L.; Zhang, J.; Kuang, W.; Stimus, A.T.; et al. Random Forest Classification of Alcohol Use Disorder Using EEG Source Functional Connectivity, Neuropsychological Functioning, and Impulsivity Measures. Behav. Sci. 2020, 10, 62. [Google Scholar] [CrossRef] [Green Version]
- Folstein, M.F.; Folstein, S.E.; McHugh, P.R. “Mini-mental state”. A practical method for grading the cognitive state of patients for the clinician. J. Psychiatr. Res. 1975, 12, 189–198. [Google Scholar] [CrossRef]
- Bucholz, K.K.; Cadoret, R.; Cloninger, C.R.; Dinwiddie, S.H.; Hesselbrock, V.M.; Nurnberger, J.I., Jr.; Reich, T.; Schmidt, I.; Schuckit, M.A. A new, semi-structured psychiatric interview for use in genetic linkage studies: A report on the reliability of the SSAGA. J. Stud. Alcohol 1994, 55, 149–158. [Google Scholar] [CrossRef]
- Patton, J.H.; Stanford, M.S.; Barratt, E.S. Factor structure of the Barratt impulsiveness scale. J. Clin. Psychol. 1995, 51, 768–774. [Google Scholar] [CrossRef]
- Cox, R.W. AFNI: Software for analysis and visualization of functional magnetic resonance neuroimages. Comput. Biomed. Res. 1996, 29, 162–173. [Google Scholar] [CrossRef]
- Ardekani, B.A.; Bachman, A.H.; Helpern, J.A. A quantitative comparison of motion detection algorithms in fMRI. Magn. Reson. Imaging 2001, 19, 959–963. [Google Scholar] [CrossRef]
- Ardekani, B.A.; Choi, S.J.; Hossein-Zadeh, G.A.; Porjesz, B.; Tanabe, J.L.; Lim, K.O.; Bilder, R.; Helpern, J.A.; Begleiter, H. Functional magnetic resonance imaging of brain activity in the visual oddball task. Brain Res. Cogn. Brain Res. 2002, 14, 347–356. [Google Scholar] [CrossRef]
- Rangaswamy, M.; Porjesz, B.; Ardekani, B.A.; Choi, S.J.; Tanabe, J.L.; Lim, K.O.; Begleiter, H. A functional MRI study of visual oddball: Evidence for frontoparietal dysfunction in subjects at risk for alcoholism. Neuroimage 2004, 21, 329–339. [Google Scholar] [CrossRef] [PubMed]
- Holmes, C.J.; Hoge, R.; Collins, L.; Woods, R.; Toga, A.W.; Evans, A.C. Enhancement of MR images using registration for signal averaging. J. Comput. Assist. Tomogr. 1998, 22, 324–333. [Google Scholar] [CrossRef]
- Ardekani, B.A.; Guckemus, S.; Bachman, A.; Hoptman, M.J.; Wojtaszek, M.; Nierenberg, J. Quantitative comparison of algorithms for inter-subject registration of 3D volumetric brain MRI scans. J. Neurosci. Methods 2005, 142, 67–76. [Google Scholar] [CrossRef]
- Ardekani, B.A.; Braun, M.; Hutton, B.F.; Kanno, I.; Iida, H. A fully automatic multimodality image registration algorithm. J. Comput. Assist. Tomogr. 1995, 19, 615–623. [Google Scholar] [CrossRef]
- Witten, D.M.; Tibshirani, R.; Hastie, T. A penalized matrix decomposition, with applications to sparse principal components and canonical correlation analysis. Biostatistics 2009, 10, 515–534. [Google Scholar] [CrossRef]
- Jasinska, A.J. Automatic inhibition and habitual control: Alternative views in neuroscience research on response inhibition and inhibitory control. Front. Behav. Neurosci. 2013, 7, 25. [Google Scholar] [CrossRef] [PubMed] [Green Version]
- Sebastian, A.; Pohl, M.F.; Kloppel, S.; Feige, B.; Lange, T.; Stahl, C.; Voss, A.; Klauer, K.C.; Lieb, K.; Tuscher, O. Disentangling common and specific neural subprocesses of response inhibition. Neuroimage 2013, 64, 601–615. [Google Scholar] [CrossRef]
- Omata, K.; Ito, S.; Takata, Y.; Ouchi, Y. Similar Neural Correlates of Planning and Execution to Inhibit Continuing Actions. Front. Neurosci. 2018, 12, 951. [Google Scholar] [CrossRef] [PubMed]
- Sebastian, A.; Baldermann, C.; Feige, B.; Katzev, M.; Scheller, E.; Hellwig, B.; Lieb, K.; Weiller, C.; Tuscher, O.; Kloppel, S. Differential effects of age on subcomponents of response inhibition. Neurobiol. Aging 2013, 34, 2183–2193. [Google Scholar] [CrossRef] [PubMed]
- Van Velzen, L.S.; Vriend, C.; de Wit, S.J.; van den Heuvel, O.A. Response inhibition and interference control in obsessive-compulsive spectrum disorders. Front. Hum. Neurosci. 2014, 8, 419. [Google Scholar] [CrossRef] [PubMed] [Green Version]
- Chevrier, A.D.; Noseworthy, M.D.; Schachar, R. Dissociation of response inhibition and performance monitoring in the stop signal task using event-related fMRI. Hum. Brain Mapp. 2007, 28, 1347–1358. [Google Scholar] [CrossRef]
- Rubia, K.; Russell, T.; Overmeyer, S.; Brammer, M.J.; Bullmore, E.T.; Sharma, T.; Simmons, A.; Williams, S.C.; Giampietro, V.; Andrew, C.M.; et al. Mapping motor inhibition: Conjunctive brain activations across different versions of go/no-go and stop tasks. Neuroimage 2001, 13, 250–261. [Google Scholar] [CrossRef] [Green Version]
- Sjoerds, Z.; van den Brink, W.; Beekman, A.T.; Penninx, B.W.; Veltman, D.J. Response inhibition in alcohol-dependent patients and patients with depression/anxiety: A functional magnetic resonance imaging study. Psychol. Med. 2014, 44, 1713–1725. [Google Scholar] [CrossRef]
- Luijten, M.; Machielsen, M.W.; Veltman, D.J.; Hester, R.; de Haan, L.; Franken, I.H. Systematic review of ERP and fMRI studies investigating inhibitory control and error processing in people with substance dependence and behavioural addictions. J. Psychiatry Neurosci. 2014, 39, 149–169. [Google Scholar] [CrossRef] [Green Version]
- Courtney, K.E.; Ghahremani, D.G.; Ray, L.A. Fronto-striatal functional connectivity during response inhibition in alcohol dependence. Addict. Biol. 2013, 18, 593–604. [Google Scholar] [CrossRef] [Green Version]
- Hu, S.; Ide, J.S.; Zhang, S.; Sinha, R.; Li, C.S. Conflict anticipation in alcohol dependence-A model-based fMRI study of stop signal task. Neuroimage Clin. 2015, 8, 39–50. [Google Scholar] [CrossRef] [Green Version]
- Claus, E.D.; Feldstein Ewing, S.W.; Filbey, F.M.; Hutchison, K.E. Behavioral control in alcohol use disorders: Relationships with severity. J. Stud. Alcohol Drugs 2013, 74, 141–151. [Google Scholar] [CrossRef] [Green Version]
- Bednarski, S.R.; Erdman, E.; Luo, X.; Zhang, S.; Hu, S.; Li, C.S. Neural processes of an indirect analog of risk taking in young nondependent adult alcohol drinkers-an FMRI study of the stop signal task. Alcohol. Clin. Exp. Res. 2012, 36, 768–779. [Google Scholar] [CrossRef] [Green Version]
- Schweinsburg, A.D.; Paulus, M.P.; Barlett, V.C.; Killeen, L.A.; Caldwell, L.C.; Pulido, C.; Brown, S.A.; Tapert, S.F. An FMRI study of response inhibition in youths with a family history of alcoholism. Ann. N.Y. Acad. Sci. 2004, 1021, 391–394. [Google Scholar] [CrossRef]
- Hatchard, T.; Mioduszewski, O.; Fall, C.; Byron-Alhassan, A.; Fried, P.; Smith, A.M. Neural impact of low-level alcohol use on response inhibition: An fMRI investigation in young adults. Behav. Brain Res. 2017, 329, 12–19. [Google Scholar] [CrossRef]
- Ware, A.L.; Infante, M.A.; O’Brien, J.W.; Tapert, S.F.; Jones, K.L.; Riley, E.P.; Mattson, S.N. An fMRI study of behavioral response inhibition in adolescents with and without histories of heavy prenatal alcohol exposure. Behav. Brain Res. 2015, 278, 137–146. [Google Scholar] [CrossRef] [Green Version]
- Harle, K.M.; Shenoy, P.; Stewart, J.L.; Tapert, S.F.; Yu, A.J.; Paulus, M.P. Altered neural processing of the need to stop in young adults at risk for stimulant dependence. J. Neurosci. 2014, 34, 4567–4580. [Google Scholar] [CrossRef] [Green Version]
- Albein-Urios, N.; Verdejo-Roman, J.; Asensio, S.; Soriano-Mas, C.; Martinez-Gonzalez, J.M.; Verdejo-Garcia, A. Re-appraisal of negative emotions in cocaine dependence: Dysfunctional corticolimbic activation and connectivity. Addict. Biol. 2014, 19, 415–426. [Google Scholar] [CrossRef]
- Luijten, M.; O’Connor, D.A.; Rossiter, S.; Franken, I.H.; Hester, R. Effects of reward and punishment on brain activations associated with inhibitory control in cigarette smokers. Addiction 2013, 108, 1969–1978. [Google Scholar] [CrossRef]
- Fryer, S.L.; Jorgensen, K.W.; Yetter, E.J.; Daurignac, E.C.; Watson, T.D.; Shanbhag, H.; Krystal, J.H.; Mathalon, D.H. Differential brain response to alcohol cue distractors across stages of alcohol dependence. Biol. Psychol. 2013, 92, 282–291. [Google Scholar] [CrossRef] [Green Version]
- Jan, R.K.; Lin, J.C.; McLaren, D.G.; Kirk, I.J.; Kydd, R.R.; Russell, B.R. The effects of methylphenidate on cognitive control in active methamphetamine dependence using functional magnetic resonance imaging. Front. Psychiatry 2014, 5, 20. [Google Scholar] [CrossRef] [Green Version]
- Kober, H.; DeVito, E.E.; DeLeone, C.M.; Carroll, K.M.; Potenza, M.N. Cannabis abstinence during treatment and one-year follow-up: Relationship to neural activity in men. Neuropsychopharmacology 2014, 39, 2288–2298. [Google Scholar] [CrossRef] [Green Version]
- Moeller, S.J.; Frobose, M.I.; Konova, A.B.; Misyrlis, M.; Parvaz, M.A.; Goldstein, R.Z.; Alia-Klein, N. Common and distinct neural correlates of inhibitory dysregulation: Stroop fMRI study of cocaine addiction and intermittent explosive disorder. J. Psychiatr. Res. 2014, 58, 55–62. [Google Scholar] [CrossRef] [PubMed] [Green Version]
- Roberts, G.M.; Garavan, H. Evidence of increased activation underlying cognitive control in ecstasy and cannabis users. Neuroimage 2010, 52, 429–435. [Google Scholar] [CrossRef] [PubMed]
- Czapla, M.; Simon, J.J.; Richter, B.; Kluge, M.; Friederich, H.C.; Herpertz, S.; Mann, K.; Herpertz, S.C.; Loeber, S. The impact of cognitive impairment and impulsivity on relapse of alcohol-dependent patients: Implications for psychotherapeutic treatment. Addict. Biol. 2016, 21, 873–884. [Google Scholar] [CrossRef] [PubMed]
- Goldstein, R.Z.; Volkow, N.D. Dysfunction of the prefrontal cortex in addiction: Neuroimaging findings and clinical implications. Nat. Rev. Neurosci. 2011, 12, 652–669. [Google Scholar] [CrossRef]
- Dalley, J.W.; Everitt, B.J.; Robbins, T.W. Impulsivity, compulsivity, and top-down cognitive control. Neuron 2011, 69, 680–694. [Google Scholar] [CrossRef] [Green Version]
- Ersche, K.D.; Jones, P.S.; Williams, G.B.; Turton, A.J.; Robbins, T.W.; Bullmore, E.T. Abnormal brain structure implicated in stimulant drug addiction. Science 2012, 335, 601–604. [Google Scholar] [CrossRef] [Green Version]
- Pandey, A.K.; Kamarajan, C.; Tang, Y.; Chorlian, D.B.; Roopesh, B.N.; Manz, N.; Stimus, A.; Rangaswamy, M.; Porjesz, B. Neurocognitive deficits in male alcoholics: An ERP/sLORETA analysis of the N2 component in an equal probability Go/NoGo task. Biol. Psychol. 2012, 89, 170–182. [Google Scholar] [CrossRef] [Green Version]
- Pandey, A.K.; Kamarajan, C.; Manz, N.; Chorlian, D.B.; Stimus, A.; Porjesz, B. Delta, theta, and alpha event-related oscillations in alcoholics during Go/NoGo task: Neurocognitive deficits in execution, inhibition, and attention processing. Prog. Neuropsychopharmacol. Biol. Psychiatry 2016, 65, 158–171. [Google Scholar] [CrossRef] [Green Version]
- Smith, J.L.; Jamadar, S.; Provost, A.L.; Michie, P.T. Motor and non-motor inhibition in the Go/NoGo task: An ERP and fMRI study. Int. J. Psychophysiol. 2013, 87, 244–253. [Google Scholar] [CrossRef]
- Lawrence, A.J.; Luty, J.; Bogdan, N.A.; Sahakian, B.J.; Clark, L. Impulsivity and response inhibition in alcohol dependence and problem gambling. Psychopharmacology (Berlin) 2009, 207, 163–172. [Google Scholar] [CrossRef] [Green Version]
- Seo, D.; Lacadie, C.M.; Tuit, K.; Hong, K.I.; Constable, R.T.; Sinha, R. Disrupted ventromedial prefrontal function, alcohol craving, and subsequent relapse risk. JAMA Psychiatry 2013, 70, 727–739. [Google Scholar] [CrossRef] [Green Version]
- Worhunsky, P.D.; Stevens, M.C.; Carroll, K.M.; Rounsaville, B.J.; Calhoun, V.D.; Pearlson, G.D.; Potenza, M.N. Functional brain networks associated with cognitive control, cocaine dependence, and treatment outcome. Psychol. Addict. Behav. 2013, 27, 477–488. [Google Scholar] [CrossRef] [Green Version]
- Luo, X.; Zhang, S.; Hu, S.; Bednarski, S.R.; Erdman, E.; Farr, O.M.; Hong, K.I.; Sinha, R.; Mazure, C.M.; Li, C.S. Error processing and gender-shared and -specific neural predictors of relapse in cocaine dependence. Brain 2013, 136, 1231–1244. [Google Scholar] [CrossRef] [Green Version]
- Courtney, K.E.; Schacht, J.P.; Hutchison, K.; Roche, D.J.; Ray, L.A. Neural substrates of cue reactivity: Association with treatment outcomes and relapse. Addict. Biol. 2016, 21, 3–22. [Google Scholar] [CrossRef] [Green Version]
- Moeller, S.J.; Bederson, L.; Alia-Klein, N.; Goldstein, R.Z. Neuroscience of inhibition for addiction medicine: From prediction of initiation to prediction of relapse. Prog. Brain Res. 2016, 223, 165–188. [Google Scholar] [CrossRef] [Green Version]
- Verbruggen, F.; Logan, G.D. Automaticity of cognitive control: Goal priming in response-inhibition paradigms. J. Exp. Psychol. Learn. Mem. Cogn. 2009, 35, 1381–1388. [Google Scholar] [CrossRef] [Green Version]
- Verbruggen, F.; Logan, G.D. Automatic and controlled response inhibition: Associative learning in the go/no-go and stop-signal paradigms. J. Exp. Psychol. Gen. 2008, 137, 649–672. [Google Scholar] [CrossRef] [Green Version]
- Verbruggen, F.; Logan, G.D. Models of response inhibition in the stop-signal and stop-change paradigms. Neurosci. Biobehav. Rev. 2009, 33, 647–661. [Google Scholar] [CrossRef] [Green Version]
- Littman, R.; Takacs, A. Do all inhibitions act alike? A study of go/no-go and stop-signal paradigms. PLoS ONE 2017, 12, e0186774. [Google Scholar] [CrossRef] [Green Version]
- Houben, K.; Nederkoorn, C.; Wiers, R.W.; Jansen, A. Resisting temptation: Decreasing alcohol-related affect and drinking behavior by training response inhibition. Drug Alcohol Depend. 2011, 116, 132–136. [Google Scholar] [CrossRef]
- Van Koningsbruggen, G.M.; Veling, H.; Stroebe, W.; Aarts, H. Comparing two psychological interventions in reducing impulsive processes of eating behaviour: Effects on self-selected portion size. Br. J. Health Psychol. 2014, 19, 767–782. [Google Scholar] [CrossRef] [PubMed]
- Stice, E.; Lawrence, N.S.; Kemps, E.; Veling, H. Training motor responses to food: A novel treatment for obesity targeting implicit processes. Clin. Psychol. Rev. 2016, 49, 16–27. [Google Scholar] [CrossRef] [PubMed] [Green Version]
- Allom, V.; Mullan, B.; Hagger, M. Does inhibitory control training improve health behaviour? A meta-analysis. Health Psychol. Rev. 2016, 10, 168–186. [Google Scholar] [CrossRef] [PubMed] [Green Version]
- Wiers, R.W.; Eberl, C.; Rinck, M.; Becker, E.S.; Lindenmeyer, J. Retraining automatic action tendencies changes alcoholic patients’ approach bias for alcohol and improves treatment outcome. Psychol. Sci. 2011, 22, 490–497. [Google Scholar] [CrossRef] [Green Version]
- Cox, S.R.; Dickie, D.A.; Ritchie, S.J.; Karama, S.; Pattie, A.; Royle, N.A.; Corley, J.; Aribisala, B.S.; Valdes Hernandez, M.; Munoz Maniega, S.; et al. Associations between education and brain structure at age 73 years, adjusted for age 11 IQ. Neurology 2016, 87, 1820–1826. [Google Scholar] [CrossRef] [Green Version]


| AUD | Control | ||||||||
|---|---|---|---|---|---|---|---|---|---|
| Na | Mean | σ | Na | Mean | σ | t | df | p | |
| Age (in years) | 30 | 41.42 | 7.32 | 30 | 27.44 | 4.74 | 8.78 | 49.71 | <0.0001 |
| Education (in years) | 30 | 11.93 | 2.35 | 30 | 15.77 | 1.87 | −7.00 | 58 | <0.0001 |
| Alcohol: Age of onset (regular use b) | 30 | 15.77 | 2.58 | 12 | 20.50 | 3.80 | −4.67 | 40 | <0.0001 |
| Alcohol: Quan/day (heavy use period) c | 30 | 11 | 7.66 | 12 | 3 | 1.60 | 5.58 | 34.57 | <0.0001 |
| Alcohol: Freq/month (heavy use period) c | 30 | 20 | 9.01 | 12 | 4 | 4.09 | 7.97 | 39.18 | <0.0001 |
| Alcohol: Quan/day (last 6 months) c | 30 | 3 | 6.61 | 18 | 3 | 1.98 | 0.045 | 46 | NS |
| Alcohol: Freq/month (last 6 months) c | 30 | 4 | 8.02 | 18 | 3 | 3.62 | 0.60 | 43.49 | NS |
| Length of Abstinence (in days) d | 30 | 672.93 | 844.94 | 18 | 57 | 149.76 | 3.89 | 31.97 | <0.0005 |
| Tobacco: Quan/day (last 6 months) c | 20 | 10 | 5.80 | 6 | 2 | 1.63 | 5.19 | 24 | <0.0001 |
| Tobacco: Freq/month (last 6 months) c | 20 | 28 | 4.83 | 6 | 14 | 13.82 | 2.47 | 5.37 | NS |
| Marijuana: Freq (last 6 months) c | 10 | 99 | 91.38 | 4 | 19 | 27.61 | 2.58 | 11.74 | <0.03 |
| NoGo Performance accuracy (in %) | 30 | 85.21 | 15.84 | 30 | 94.42 | 11.85 | 1.07 | 58 | NS |
| Go Performance accuracy (in %) | 30 | 91.25 | 9.44 | 30 | 88.83 | 8.03 | −2.55 | 53.72 | <0.014 |
| Reaction Time (in milliseconds) | 30 | 349.85 | 31.15 | 30 | 324.47 | 32.27 | 3.10 | 58 | <0.003 |
| BIS-11: Nonplanning | 28 | 24.57 | 5.25 | 30 | 19.80 | 4.61 | 3.69 | 56 | <0.001 |
| BIS-11: Motor Impulsiveness | 27 | 25.15 | 5.24 | 30 | 19.30 | 3.28 | 4.99 | 42.82 | <0.0001 |
| BIS-11: Attentional Impulsiveness | 28 | 15.79 | 4.13 | 30 | 12.57 | 3.19 | 3.33 | 56 | <0.002 |
| BIS-11: Total Impulsiveness | 27 | 65.44 | 11.51 | 30 | 51.67 | 8.60 | 5.15 | 55 | <0.0001 |
| Cluster No. | MNI Coordinates (R, A, S) mm | Size mm3 | Peak/Trough Location | Activation Direction |
|---|---|---|---|---|
| 1 | (−30, 26, 0) | 221 | Bilateral Insula | NoGo > Go |
| 2 | (51, 19, −10) | 1754 | Right Inferior Frontal Gyrus | NoGo > Go |
| 3 | (52, 14, 37) | 13,317 | Right Middle Frontal Gyrus | NoGo > Go |
| 4 | (18, 8, 67) | 174 | Right Middle Frontal Gyrus | NoGo > Go |
| 5 | (5, 20, 41) | 800 | Right Medial Frontal Gyrus | NoGo > Go |
| 6 | (38, −61, 58) | 15,599 | Right Superior Parietal Lobule | NoGo > Go |
| 7 | (62, −28, −5) | 656 | Right Middle Temporal Gyrus | NoGo > Go |
| 8 | (52, −43, 7) | 144 | Right Middle Temporal Gyrus | NoGo > Go |
| 9 | (1, 61, −5) | 1483 | Right Medial Frontal Gyrus | Go > NoGo |
| 10 | (−1, −55, 21) | 1140 | Left Posterior Cingulate Gyrus | Go > NoGo |
| 11 | (−49, −71, 28) | 313 | Left Angular Gyrus | Go > NoGo |
| 12 | (−45, −20, 58) | 289 | Left Postcentral Gyrus | Go > NoGo |
| 13 | (−57, −19, 44) | 102 | Left Postcentral Gyrus | Go > NoGo |
Publisher’s Note: MDPI stays neutral with regard to jurisdictional claims in published maps and institutional affiliations. |
© 2022 by the authors. Licensee MDPI, Basel, Switzerland. This article is an open access article distributed under the terms and conditions of the Creative Commons Attribution (CC BY) license (https://creativecommons.org/licenses/by/4.0/).
Share and Cite
Pandey, A.K.; Ardekani, B.A.; Byrne, K.N.-H.; Kamarajan, C.; Zhang, J.; Pandey, G.; Meyers, J.L.; Kinreich, S.; Chorlian, D.B.; Kuang, W.; et al. Statistical Nonparametric fMRI Maps in the Analysis of Response Inhibition in Abstinent Individuals with History of Alcohol Use Disorder. Behav. Sci. 2022, 12, 121. https://doi.org/10.3390/bs12050121
Pandey AK, Ardekani BA, Byrne KN-H, Kamarajan C, Zhang J, Pandey G, Meyers JL, Kinreich S, Chorlian DB, Kuang W, et al. Statistical Nonparametric fMRI Maps in the Analysis of Response Inhibition in Abstinent Individuals with History of Alcohol Use Disorder. Behavioral Sciences. 2022; 12(5):121. https://doi.org/10.3390/bs12050121
Chicago/Turabian StylePandey, Ashwini Kumar, Babak Assai Ardekani, Kelly Nicole-Helen Byrne, Chella Kamarajan, Jian Zhang, Gayathri Pandey, Jacquelyn Leigh Meyers, Sivan Kinreich, David Balin Chorlian, Weipeng Kuang, and et al. 2022. "Statistical Nonparametric fMRI Maps in the Analysis of Response Inhibition in Abstinent Individuals with History of Alcohol Use Disorder" Behavioral Sciences 12, no. 5: 121. https://doi.org/10.3390/bs12050121