Article

Origin of the Vanadiferous Serpentine–Magnetite Rocks of the Mt. Sorcerer Area, Lac Doré Layered Intrusion, Chibougamau, Québec

Centre D’études sur les Ressources Minérales (CERM), Département des Sciences Appliquées, Université du Québec à Chicoutimi (UQAC), 555 blvd. de l’université, Chicoutimi, QC G7H 2B1, Canada
Geosciences 2019, 9(3), 110; https://doi.org/10.3390/geosciences9030110
Submission received: 25 January 2019 / Revised: 19 February 2019 / Accepted: 25 February 2019 / Published: 28 February 2019
(This article belongs to the Section Geochemistry)

Abstract

:
Magmatic processes dominate Fe–Ti–V mineralization and revealing these processes is essential for providing a scientific foundation for exploration models. This study focuses on the metamorphosed Neoarchean (ca. 2728 Ma) tholeiitic layered Lac Doré Complex (LDC) that is currently being explored for V. Contamination may play an important role in the evolution of the Fe–Ti–V-enriched layered zone (magnetitite, anorthosite, and gabbro mostly, and ultramafic rocks locally) of the LDC. This hypothesis is tested by performing a detailed chemical and petrological investigation of serpentine-magnetite-dominated rocks located in the Mt. Sorcerer area. The studied rocks have evolved (apatite-bearing, Fe-rich, Cr-Ni-Ti-poor) and primitive (Mg-rich, Si-poor) characteristics. Pre-metamorphism rocks contained olivine Fo82–90 (now serpentine) and magnetite. These rocks formed from a Si-depleted magma under high fO2 conditions (+1.8 to +3.0 relative to the fayalite-magnetite-quartz buffer; FMQ). The V-content of the magnetite varies due to reversals related to multiple injections of an evolved basaltic magma in the upper part of the LDC. The magma interacted with Fe-Mg-rich and Si-Ca-poor carbonate-facies iron formation and crystallized in the presence of oxidizing CO2-bearing fluids. Compositional layering is poorly defined due to a fast cooling rate. Consequently, the distribution of V is relatively homogeneous in the Fe–Mg-rich units of the Mt. Sorcerer area.

1. Introduction

The Lac Doré Complex (LDC) is a metamorphosed Neoarchean layered intrusion located in the NE corner of the Abitibi Subprovince. Having an estimated thickness of 7–8 km and a preserved length of >50 km [1], it is 1 of the 10 largest layered intrusions in the world (cf. Namur and collaborators [2]). The exposed portion of the LDC comprises a thick anorthosite and gabbro dominated unit, a Fe-enriched layered zone, and a tonalitic unit designated sodagranophyre zone. As many similar Fe-enriched rocks observed in layered intrusions around the world, the layered zone of the LDC is potentially economic for V, Ti, and Fe. The layered zone is the focus of most studies carried on the LDC [3,4,5] but many questions remain on its origin and magmatic evolution. Addressing these issues may have consequences for our general comprehension of Fe- and V-enriched magmas.
In the NW and S portions of the LDC (NW and S limbs), the layered zone displays a centimeter- to meter-scale layering consisting of alternating laterally continuous (at least at outcrop scale) units of magnetitite, gabbro, and anorthosite. In the NE limb of the LDC, however, compositional layering is poorly developed, and the layered zone is made of magnetite- and serpentine-dominated rocks. This portion of the LDC has been interpreted: (1) as an evolved basaltic magma contaminated by a carbonaceous iron formation [1,5]; and (2) as a unit modified by hydrothermal alteration [4]. The origin of these Fe-Mg-rich and Si–Ca–Na–Al-poor rocks remains debated and the consequences of magma contamination and other processes on V mineralization is undocumented. This study aims at unrevealing the magmatic processes that formed the V-bearing rocks of the NE limb of the LDC to provide a scientific foundation for exploration models. This study focuses on the Mt. Sorcerer area, where the layered zone of the NE limb is best documented. Using exploration drill cores from 2013 that intersected the upper part of the layered zone, this study uses detailed petrological and chemical data to reconstruct pre-metamorphism magmatic assemblages. This contribution proposes a model for the formation of the NE limb layered zone and discusses the consequences of this model for the distribution of V in the Mt. Sorcerer area.

2. Geological Context

In the Chibougamau area, rocks are metamorphosed to a greenschist–amphibolite facies. The prefix ‘meta’ is implied but omitted from the rock names and descriptions.

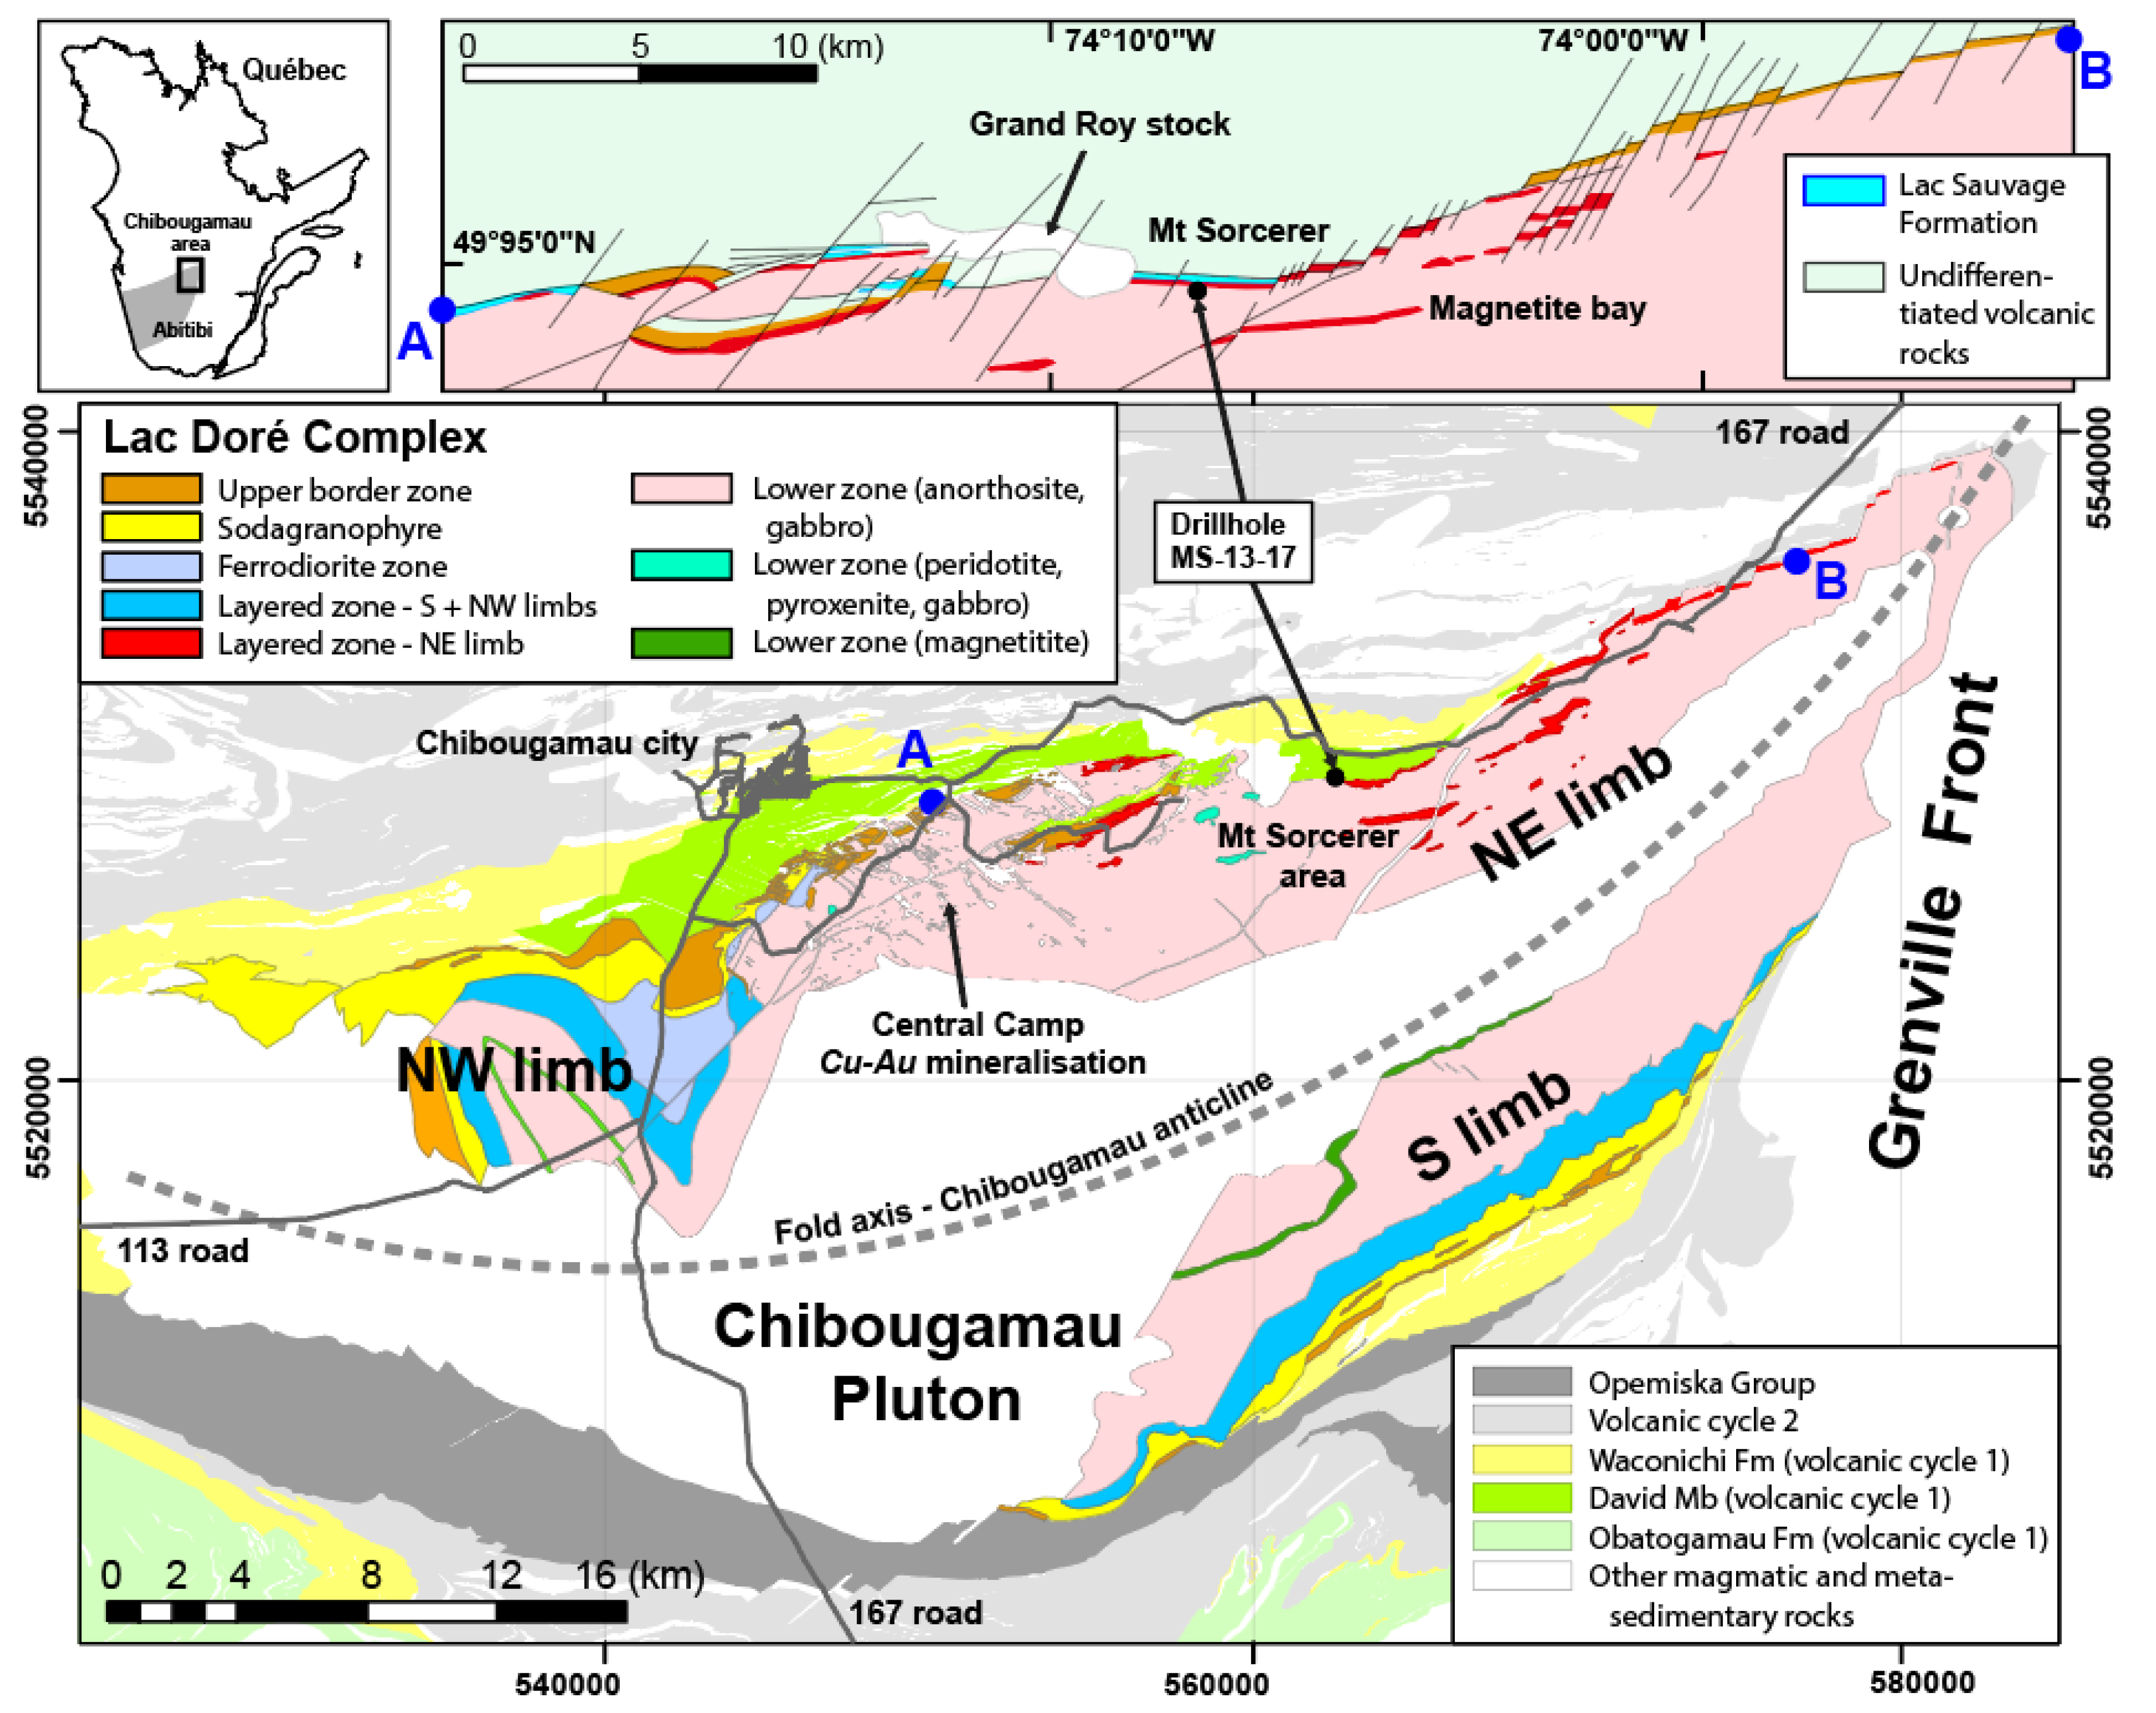
2.1. Chibougamau Area

The LDC is located in the Chibougamau area, Québec, in the NE corner of the Abitibi Subprovince; a large Archean greenstone belt that is renowned for its gold endowment and that is located in the southern portion of the Superior Province. Chibougamau is known for its historical mining camp: the Central Camp, a cluster of Cu-Au porphyry deposits related to the Chibougamau pluton [6,7]. The Chibougamau area has been mapped by generations of geologists, and the following description is based on several syntheses [8,9,10].
The Chibougamau area contains some of the oldest volcanic rocks of the Abitibi Subprovince, i.e., the ~2799–2791 Ma Chrissie Formation [10]. These rocks are overlain by two volcanic cycles (Roy Group), with each cycle comprising a thick accumulation of mafic to intermediate lava flows topped by felsic eruptive centers. The Roy Group is overlain by the ~2700 Ma basin-restricted sedimentary rocks of the Opémisca Group [9,10].
The LDC is situated in the central part of the Chibougamau area, immediately south of the eponym city (Figure 1). The LDC is elongated in the WSW–ENE direction. It has an exposed thickness of 4–5 km [8] and a modelled total thickness of 7–8 km [1] (Figure 2). It was emplaced into the rocks of the first volcanic cycle (cycle 1) that correspond to the Obatogamau and Waconichi formations. The undated Obatogamau Formation has a tholeiitic affinity and contains characteristic plagioclase macrocryst-bearing mafic volcanic rocks. The Obatogamau Formation is mostly composed of basaltic to andesite lava flows intercalated with evolved volcanic centers, and may be genetically related to the LDC [9]. The ~2730–2726 Ma Waconichi Formation [10] is made of intermediate to felsic volcanic rocks with tholeiitic to calc-alkaline affinities.
The Waconichi Formation contains several exhalative units (chert and iron formations) and sulfide accumulations related to volcanogenic massive sulfides (VMS) systems (e.g., Lemoine mine) [11]. Based on their extent in the field, these VMS likely formed around small eruptive centers [1]. Whether the VMS predate the emplacement of the LDC or are coeval with this intrusive event remains poorly constrained, but the mapped contact suggests that the LDC (at least its upper units) postdates the Waconichi Formation and the VMS systems into which it injected.
The NW and SE portions of the LDC are in contact with the Waconichi Formation, whereas its SW portion is in discordant contact with the Opémisca Group. Its NE portion is in contact with the David Member; an accumulation of andesitic basalt lava flows that form the upper part of the Obatogamau Formation [10]. U-Pb dating of zircon provided ages of 2727.0 ± 1.3 Ma and 2728.3 + 1.2/−1.1 Ma for rocks located in the upper part of the LDC [12]. The LDC thus formed during volcanic cycle 1, and it is locally brecciated and intruded by cycle 2 tonalite and diorite of the Chibougamau pluton.

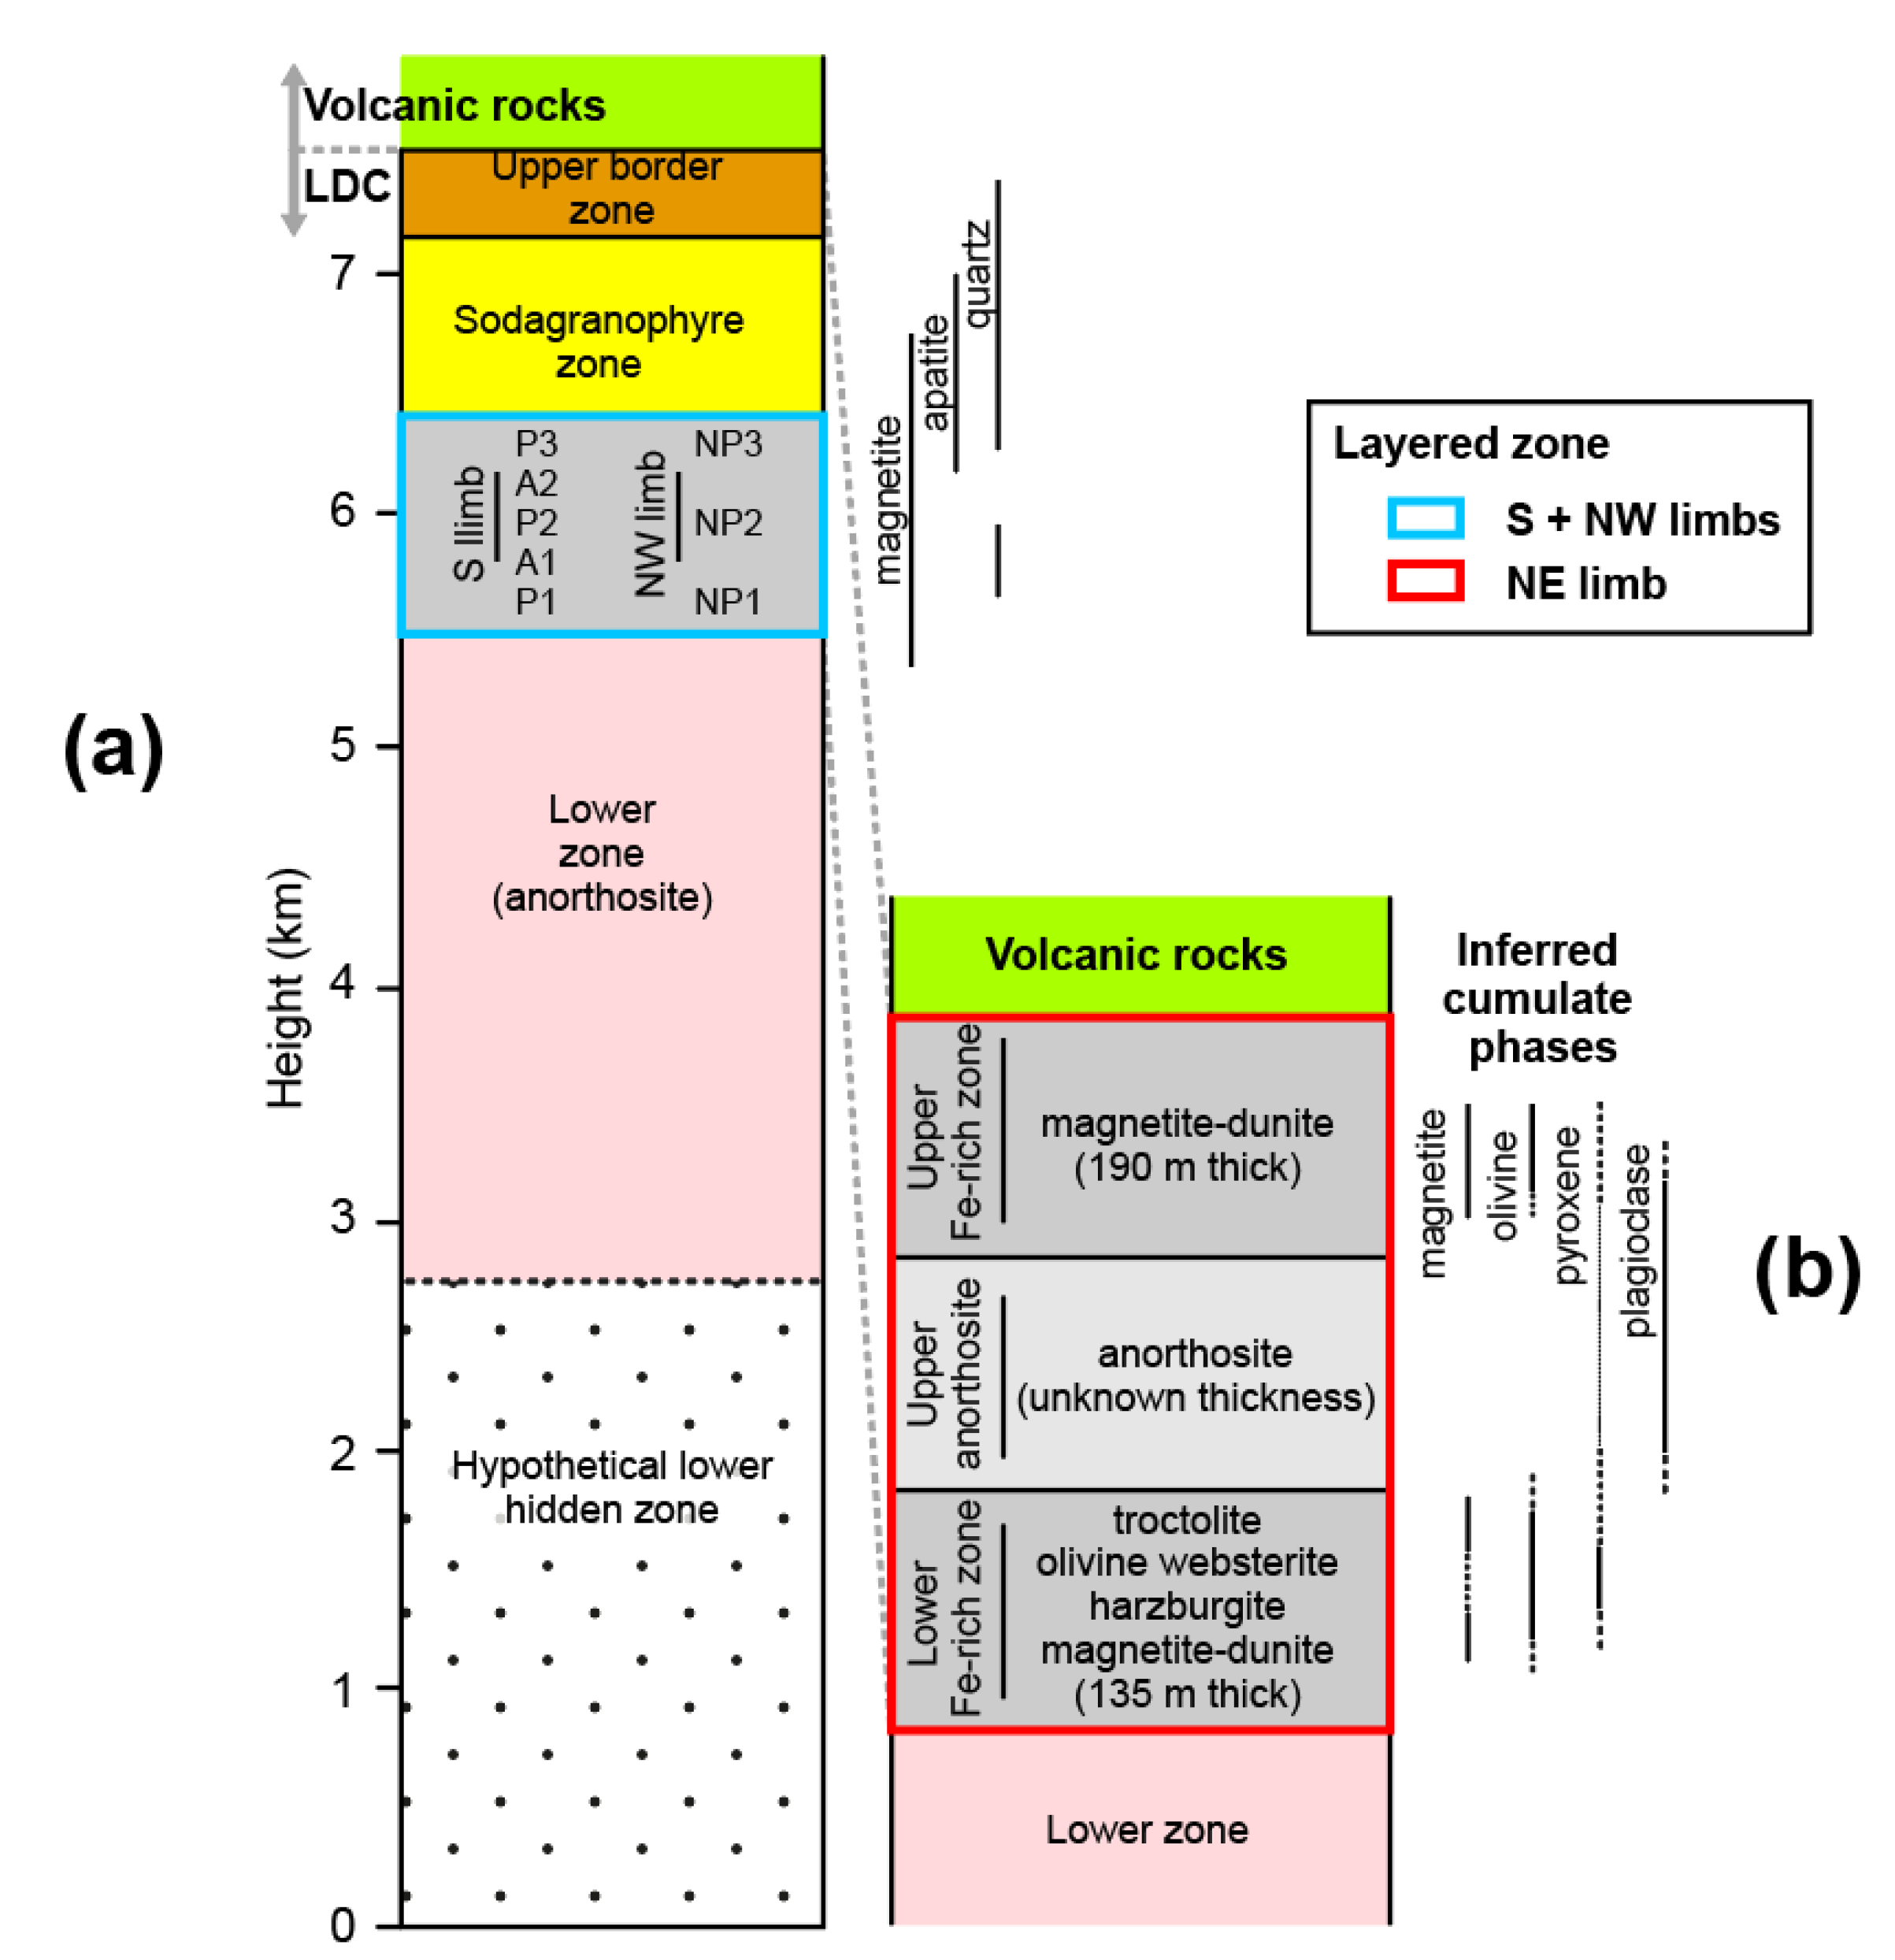
2.2. Geology of the LDC

The LDC is a mineralized, metamorphosed, and deformed intrusion. It contains magmatic Fe–i–V mineralization currently being explored by the companies Vanadium Energy One, BlackRock Metals, and VanadiumCorp Resource. The LDC also hosts the Cu–Au deposits of the Central Camp that mostly occur in hydrothermally altered anorthosites located in the central-northern portion of the complex (Figure 1). The main alteration-types are sulphidation, carbonatization, silicification, chloritization, and sericitization [1,13].
Regional greenschist facies metamorphism is ubiquitous in the Abitibi Subprovince. In the Chibougamau area, primary magmatic textures are generally recognizable, low-grade metamorphism is mostly isochemical [1] and isovolumetric, and higher grade assemblages (amphibolite facies) are observed in contact aureoles and near the front of the Grenville Proterozoic orogeny [14] (Figure 1).
Deformation produced the E–W- to NE–SW-oriented Chibougamau anticline that divides the LDC (and its volcanic host rocks) into a northern and a southern limb (Figure 1). The stratigraphy is also complicated by smaller-amplitude folds and numerous reverse and strike-slip faults [8]. The geology of the LDC is known mostly from mapping by G.O. Allard and co-workers [1,15]. This work has been summarized in several volumes [1,8,10].
From the base to the top, the LDC is composed of the following units: (1) lower hidden zone; (2) lower zone; (3) layered zone; (4) ferrodiorite zone; (5) sodagranophyre zone; and (6) upper border zone (Figure 1 and Figure 2). The lower hidden zone may underlie the Chibougamau pluton and has been inferred by comparing the LDC to other layered complexes [1]. The 2.4–3.6 km thick lower zone, which represents most of the exposed surface of the LDC (Figure 1), is dominated by anorthosite ±gabbro. The greenschist facies minerals observed in these rocks replaced magmatic plagioclase (now epidote and albite), pyroxene (now chlorite and actinolite), and possibly ilmenite (now titanite). Vanadiferous titanomagnetite is present in the upper portion of the lower zone.
The ~1.5–3.3 km thick layered zone is characterized by a centimeter- to meter-thick modal layering [1] described as a rhythmical succession of magnetitite magnetite-bearing anorthosite and gabbro [3]. In the S limb, the layered zone is divided into the magnetite-, chlorite-, and amphibole-dominated P1, P2, and P3 members and the albite-, epidote-, actinolite-, and chlorite-dominated A1 and A2 members (Figure 2). In the S limb layered zone, V, Cr and Ni decrease upward, and Ti increases upward [1,3,16,17]. In the NW limb, the anorthosite members are missing and the magnetite-, chlorite-, amphibole-, albite-, and epidote-bearing units are divided into the NP1, NP2, and NP3 members [18]. In the NE limb, the possible equivalent of the layered zone [1] is discontinuous (Figure 1) and consists of one anorthosite unit and of two Fe-rich units dominated by serpentine, magnetite, and chlorite [5] (Figure 2). The Fe–Ti–V exploration projects target rocks of the layered zone present in the S and NE limbs.
The ferrodiorite zone is laterally discontinuous and is exposed in the NW limb [18]. The sodagranophyre zone is a tonalite with a distinctive granophyric texture. This felsic unit is thicker where the LDC is in contact with the Waconichi Formation (Figure 1). The up to 200 m thick upper border zone is a discontinuous unit composed of gabbro, pyroxenite and anorthosite. It is interpreted as a relic of the chilled margin of the intrusion [1] but could correspond to an early injection phase analogue to the marginal zone of the Bushveld Complex.
The LDC is also cut by a number of ultramafic to felsic dykes. Some of these intrusions are tonalite dykes related to the Chibougamau pluton, while most of the mafic dykes observed in the layered zone potentially represent feeders of the volcanic cycle 2 [9].

2.3. Mt. Sorcerer Area

The Mt. Sorcerer area (Figure 1) is claimed and explored for V by Vanadium Energy One. At this locality, the LDC is in contact with mafic lava flows of the David Member (Obatogamau Formation) and with the Lac Sauvage volcanogenic iron formation (Waconichi Formation) [10] (Figure 1). This Algoma-type iron formation has an exhalative origin and consists of discontinuous lenses of base metal-enriched carbonate rocks [19].
In the study area, stratabound pyrite-dominated horizons (VMS) known as ‘sulfur converting’ are observed within the lava flow pile. A part of sulfur converting, explored by SOQUEM (société québécoise d’exploration minière), was described as an accumulation of pyrrhotite, pyrite, ±sphalerite, and discordant chalcopyrite veins hosted by chloritized volcanic rocks [20].
The V mineralization in the area was studied in the 1960s [4,21] and mapped in detail in the 1980s [5]. In the Mt. Sorcerer area, the Fe-enriched ultramafic units are designated as the upper and lower Fe-rich zones and contain the Mt. Sorcerer (northern zone) and Magnetite Bay (southern zone) mineralization, respectively [1,4,5] (Figure 1 and Figure 2).
According to Lapallo [5], the upper and lower Fe-rich zones occupy distinct stratigraphic levels (Figure 2), whereas Dorr [4] argued that these rocks belong to a folded Fe-rich unit. The LDC may, however, be too rigid to ‘wrinkle’ [1], although fault-related repetition is not excluded. Whether the NE limb contains two Fe-rich units separated by an anorthosite unit [5] or a deformed unit made of pyroxenite and ferrodunite [4] has not yet been resolved. Ferrodunite is the dominant lithology of the Mt. Sorcerer area and is described as an olivine cumulate (now serpentine) with about 20–40 vol % of intercumulate magnetite [4,5].

2.4. Evolution of the LDC Magma Chamber

The LDC magma was potentially emplaced in a volcanically active area; i.e., the temperature of the host rocks may have been elevated [22]. The parental magma is generally viewed as tholeiitic [1,18,23] and, according to trace element modelling, may have coexisted with a calc-alkaline magma [24]. The rare earth elements (REE) and multi-element profiles of the LDC rocks are flat, can be more or less enriched in the most incompatible elements, and have abundances close to a N-MORB composition [9].
The fractional crystallization trend is characterized by a decrease in Ca and Mg and an increase in Fe, followed by an increase in Si and Na [1,5]. This corresponds to a typical tholeiitic differentiation trend [25,26,27]. The main cumulus phases are plagioclase, pyroxene, magnetite, ilmenite, and apatite [18,23]. The fO2 of the magma promoted the early crystallization of silicates [22]. The delayed crystallization of large amounts of titanomagnetite implied an increase in fO2 that, according to observations made on other intrusions, could be the result of fractional crystallization, magma replenishment, and/or contamination [28,29,30].
In the NW and S limbs, the sodagranophyre zone is in contact with the intermediate to felsic, locally mafic, volcanic rocks of the Waconichi Formation [22] (Figure 1). A study concluded that the base of the sodagranophyre zone crystallized from differentiated LDC magma [31], whereas the upper part of the sodagranophyre zone originated either from a magma contaminated by the Waconichi Formation or from melted Waconichi rocks whose low density prevented mixing with the underlying high-density and Fe-enriched layered zone [8,31,32]. Assimilation of Waconichi rocks would have modified the fO2 and promoted the crystallization of titanomagnetite in the layered zone [8]. An alternative hypothesis is that the well-developed rhythmic layering of the layered zone of the NW and S limbs resulted from multiple injections of magma [23]. A recent study focused on the S limb of the LDC also minimizes the importance of contamination. This study concluded that the crystallization and distribution of titanomagnetite was controlled by successive injections and mixing of magmas, crystal settling and sorting, and expulsion of interstitial melt during compaction [3].
In the NE limb, the LDC is in contact with mafic volcanic rocks and with the Lac Sauvage iron formation (i.e., basalts, chlorite schists and Fe–Mg-carbonate-enriched rocks) [1,5]. Dolomite–talc–serpentine-bearing enclaves are observed in the layered zone of the NE limb. Chemical modelling carried on the magma that hosts theses enclaves points to a fractional crystallization sequence (olivine, magnetite, orthopyroxene, clinopyroxene, plagioclase) that differs from sequences postulated for the layered zones of the NW and S limbs (orthopyroxene, clinopyroxene, plagioclase, magnetite) [5].
Lapallo [5] proposed that the carbonate-enriched iron formation and other mafic rocks melted at the contact with the LDC magma to produce a high-density melt that mixed vigorously with the LDC magma and induced its desilicification. The contaminated magma then crystallized to form magnetite–olivine-rich rocks. Alternative models proposed that alkalis were removed and that the rocks were oxidized by hydrothermal fluids [4]. The origin of the Fe-enriched units of the NE limb of the LDC remains controversial and will be addressed in this contribution.

3. Samples

The Mt. Sorcerer area is poorly exposed, and this study relies on drill core samples. The studied core MS-13-17 was drilled in 2013 by Forage Chibougamau Ltd. on behalf of Chibougamau Independent Mines Ltd., as part of an exploration targeting V. Results (drill core log and chemical analyses) were given in the GM-68458 document [20].
The drill hole had an azimuth of 360° and a dip of −42°, with a total depth of 603 m. Its collar is located at the following coordinates: 562,542 E, 552,9313 N (UTM NAD83) (Figure 1). The contact between the LDC and the volcanic rocks dips at 75–85° toward the north [4] and was intersected at a depth of 335 m. Using the dip of the drill hole and a mean dip of 80° for the outer surface of the LDC, the thickness of the drilled LDC unit is estimated to be ~250 m.
Drill hole MS-13-17 is located in the upper Fe-rich zone of the Mt. Sorcerer area (Figure 1 and Figure 2). This drill hole passes through the following units: (1) Fe-rich ultramafic rocks of the upper Fe-rich zone (0 to 320 m downhole); (2) magnetitite of the upper Fe-rich zone (320 to 335 m downhole); and (3) mafic volcanic rocks (335 to 600 m downhole) (Figure 3). The LDC rocks (upper Fe-rich zone) display a variety of textures, the most notable being the presence of irregular ‘patches’ of chlorite ±actinolite or serpentine observed in some intervals of the drill core (Figure 4a,b).
Other textures include: (1) medium- to fine-grained rocks enriched in chlorite that display a pseudo-breccia texture with a magnetite-enriched matrix (Figure 4d); (2) chlorite-rich rock in which magnetite defines a net texture (Figure 4e); and (3) magnetite–bearing and chlorite-dominated fine-grained rocks (Figure 4f). Also, in <10% of the drill hole, core sections display a strong foliation (local shear zones) that obliterates the magmatic texture (Figure 4c). At the contact with the volcanic host rocks (320 to 335 m downhole), the LDC is composed of sulfide-enriched, fine-grained magnetitite in contact with chlorite-enriched rocks (Figure 4g).
Sulfides are observed along the whole length of the drill core and generally consist of disseminated pyrrhotite ±chalcopyrite. The sulfides generally represent about 1 vol % of the rock and can be spatially associated with carbonate veins. A part of the disseminated sulfides and sulfide-bearing veins have alteration halos made of carbonate, chlorite, and/or amphibole. Sulfides are more abundant in the magnetitite horizon, where they form foliation-parallel bands of pyrrhotite and foliation-oblique veins of pyrrhotite and chalcopyrite (Figure 4g).
The volcanic rocks are fine-grained and chlorite-enriched. Foliation-parallel sulfide veinlets are abundant from 335–350 m, and semi-massive sulfides containing clasts made of chlorite and quartz are observed from 350–375 m (Figure 4h).
Drill core MS-13-17 provides a unique opportunity to investigate the marginal units of the LDC. The LDC rocks were sampled to document the textural and modal variations observed in core sections. The volcanic rocks were also sampled to document the lava flow chemistry and the intensity of hydrothermal alteration in the host rocks of the LDC (Figure 3).
In addition to the sampling performed for this study, 159 whole rock chemical analyses of LDC rocks (from 0–330 m downhole) from drill core MS-13-17 were considered. These analyses were performed on behalf of Chibougamau Independent Mines Ltd. and were reported [20] in an online document (http://sigeom.mines.gouv.qc.ca). The 159 half-core samples were 1.5 to 3 m in length and analyzed by XRF for major and minor elements, as well as for Cr and V, by Labo-Expert (Rouyn Noranda, Quebec). The magnetite content was determined by SATMAGAN (SATuration MAGnetization ANalyser) at Actlabs (Val d’Or, Québec). In this contribution, these data are referred to as the ‘company dataset’.

4. Methodology

Petrographic observations were performed using a conventional polarized light microscope on 12 samples. Standard polished thin sections were prepared by IOS Service Géoscientifiques (Chicoutimi, Québec). Backscattered electron imagery was obtained for a portion of the samples using the scanning electron microscope (SEM) at Laval University (JEOL JSM-840A).
Six samples were analyzed for major and trace elements at ALS Chemex Laboratory (Val d’Or). Bulk rock analyses were performed by ICP-AES (major) and ICP-MS (trace elements), using the ME-MS18d package (i.e., lithium borate fusion prior to acid dissolution). Detection limits were 0.01 wt % for majors and 0.03–10 ppm for trace elements (Table 1).
In situ LA-ICP-MS analyses were carried out on polished thin sections at LabMaTer (UQAC) using a RESOlution ArF-193nm excimer laser ablation system (Australian Scientific Instrument) equipped with a double-volume cell S-155 (Laurin Technics), coupled to an Agilent 7900 ICP-MS. The parameters used for these analyses were: beam size of 73 µm, laser frequency of 20 Hz and power of 0.83 J/pulse. Oxides and silicates were analyzed using spots (20 s acquisition time), lines (10 µm/s stage speed) and maps, after measuring the gas blank for 20 s. Representative analyses for magnetite and silicates are given in Table 2 and Table 3, and the full LA-ICP-MS dataset (including calibration) is provided in the electronic Supplemental Materials S2–8. Calibration was performed using the USGS-certified reference material GSE-1g, which is a synthetic glass containing 10% Fe and doped with ~500 ppm of each trace element [35]. An in-house natural magnetite from the Bushveld (BC-28) [36] and the USGS-certified Gprob6 artificial basalt glass (http://www.geoanalyst.org) were used to monitor data quality. Data quality was also monitored using the UQAC-FeS-1 reference material, which is an artificial sulphide produced at UQAC [37] based on a modified technique developed by Garbe-Schönberg and Müller [38]. The results are in good agreement to working values (see Supplemental Materials S2–5).
The data were reduced using the Iolite software [39]. For magnetite, the internal standard 57Fe and the stoichiometric value of 72.36 wt % was used. The analyzed magnetite contains numerous silicates, Ti-oxides, and spinel inclusions that were included in the integrations. The sum of minor elements in the 114 analyzed magnetites is mostly <5 wt % (median = 3.4, Q1 = 2.2, Q3 = 5.3 wt %). The internal standard for silicates was 28Si and the stoichiometric values used were 43.36 wt %, 30 wt %, and 55 wt % for serpentine, chlorite, and actinolite, respectively. As the silicates observed in thin sections (see below) are mostly thin assemblages of several phases, the nature of the dominant phase was confirmed by recalculating the analyses to 100% and performing normative calculations using the CONSONORM_LG method [33], with the 350 °C and 2.5 kbar model and with all iron as FeO.

5. Results

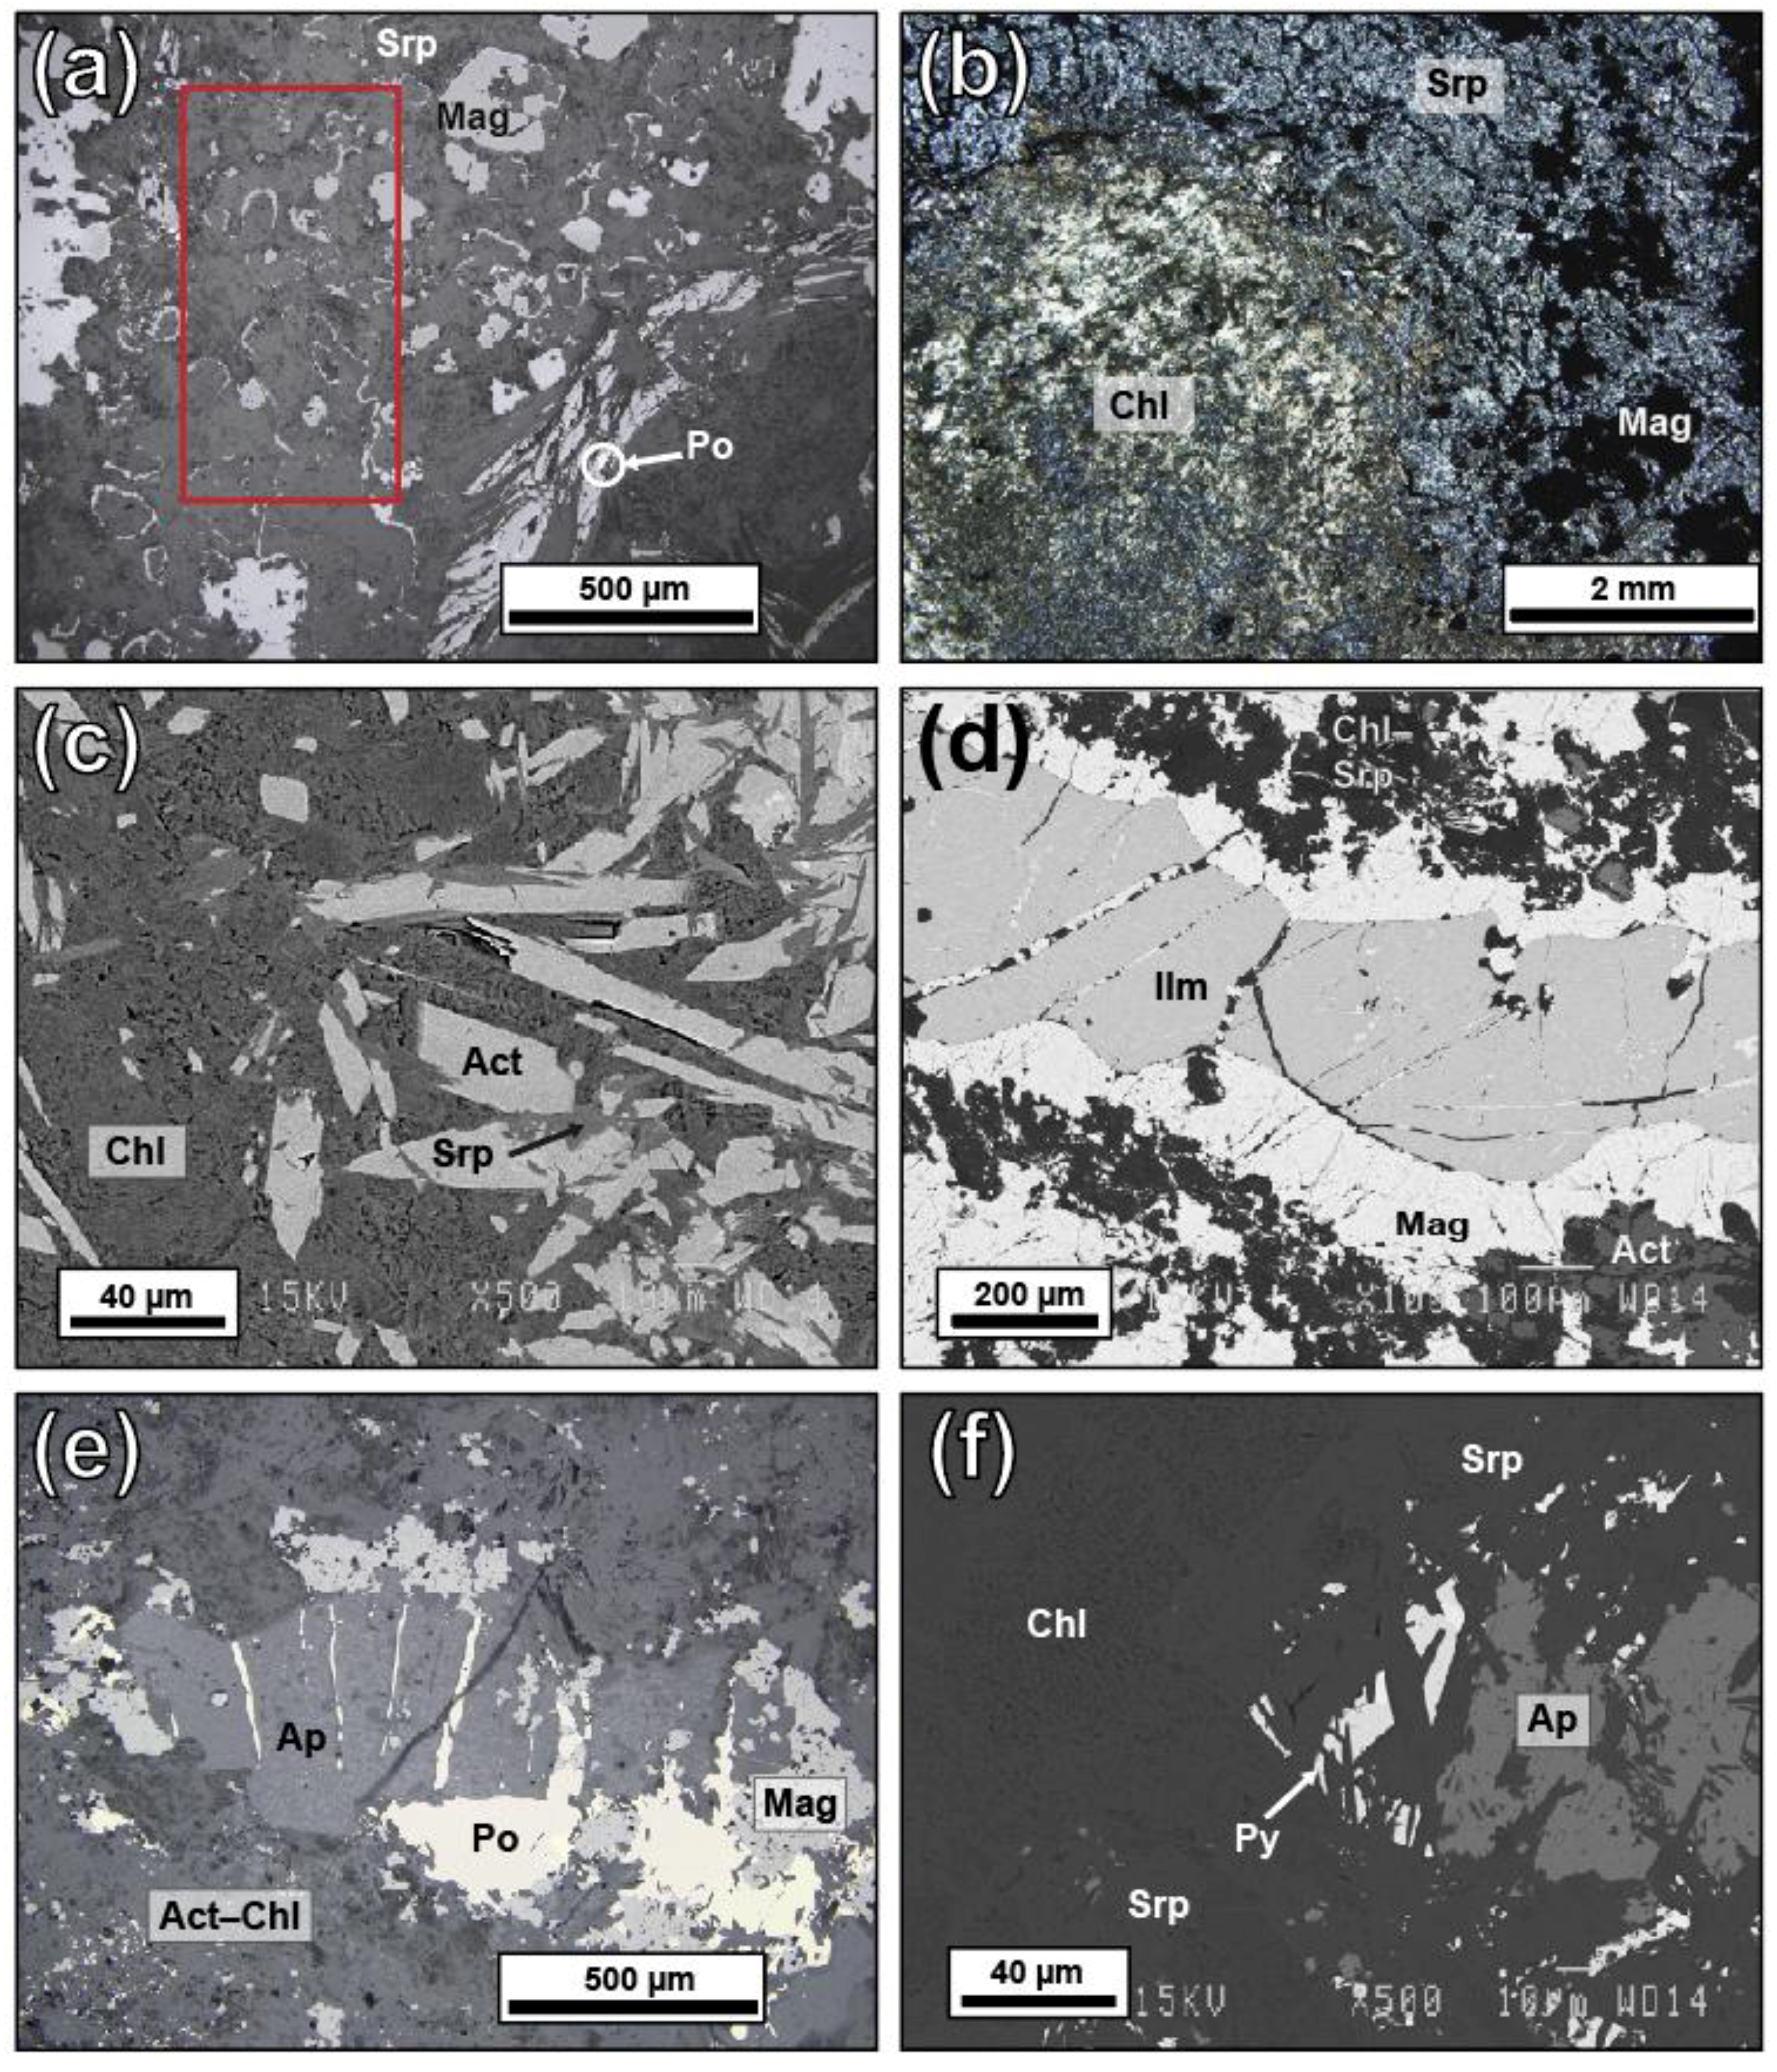
5.1. Petrographic Descriptions

The studied LDC rocks are assemblages of magnetite and fine-grained aggregates of serpentine, talc and chlorite (Table 4). In the serpentine-enriched samples, serpentine and talc aggregates pseudomorph 0.1–0.5 mm rounded to hexagonal olivine. The serpentine aggregates are rimmed by elongated grains of inclusion-free magnetite that correspond to Fe expelled from the structure of the olivine during metamorphism (Figure 5a,b). In such samples, chlorite is always in contact with magnetite (Figure 6c). In other samples, the silicates are intergrowths of chlorite, serpentine and locally actinolite (Figure 5c,d,f).
Actinolite is generally acicular, except in sample MS17-04 where it forms large (1 mm long) and poikilitic tabular crystals (Figure 7e). The green ‘patches’ observed in hand specimens (Figure 4a) are composed of fine-grained serpentine and/or chlorite (Figure 5b) locally rimmed by acicular actinolite (Figure 5c).
The dominant Fe-Ti-oxide is a granular magnetite, 0.1–1 mm in diameter, that contains variable amounts of ilmenite exsolutions. The dominant Al-bearing inclusion observed in magnetite is chlorite (Figure 7), while pleonaste is rare. Titanomagnetite was the dominant oxide that crystallized in LDC rocks. Large (>1 mm long) ilmenite grains rimmed by magnetite are only observed in sample MS17-28 (Figure 5d). Apatite is generally too small to be easily observed except in samples MS17-31 and MS17-02 where it forms >500 µm long grains spatially associated with sulfides (Figure 5e,f).
The volcanic rocks are assemblages of chlorite, albite, epidote, and actinolite (Table 4). Quartz–chlorite aggregates are observed next to semi-massive sulfides (samples MS17-07, -08). The dominant oxides are sub-idiomorphic magnetite with ~40% ilmenite exsolutions and abundant chlorite inclusions (Figure 7f,g), ilmenite, or fine-grained (<50 µm) titanite with irregular outlines.
The alteration minerals spatially associated with disseminated sulfides and carbonate veins correspond to chlorite and amphibole, as well as quartz in volcanic rocks. Carbonate-bearing veins and disseminated sulfides are observed in the bulk of the samples. The sulfides are irregular grains of pyrrhotite spatially associated with minor amounts of chalcopyrite (Figure 7d) and cubic pyrite is locally present. In sample MS17-04, pyrrhotite- and magnetite-dominated layers alternate and are cut by pyrrhotite + chalcopyrite + amphibole ± chlorite veins. The semi-massive to disseminated pyrrhotite observed in this sample replaces magnetite (Figure 7e).

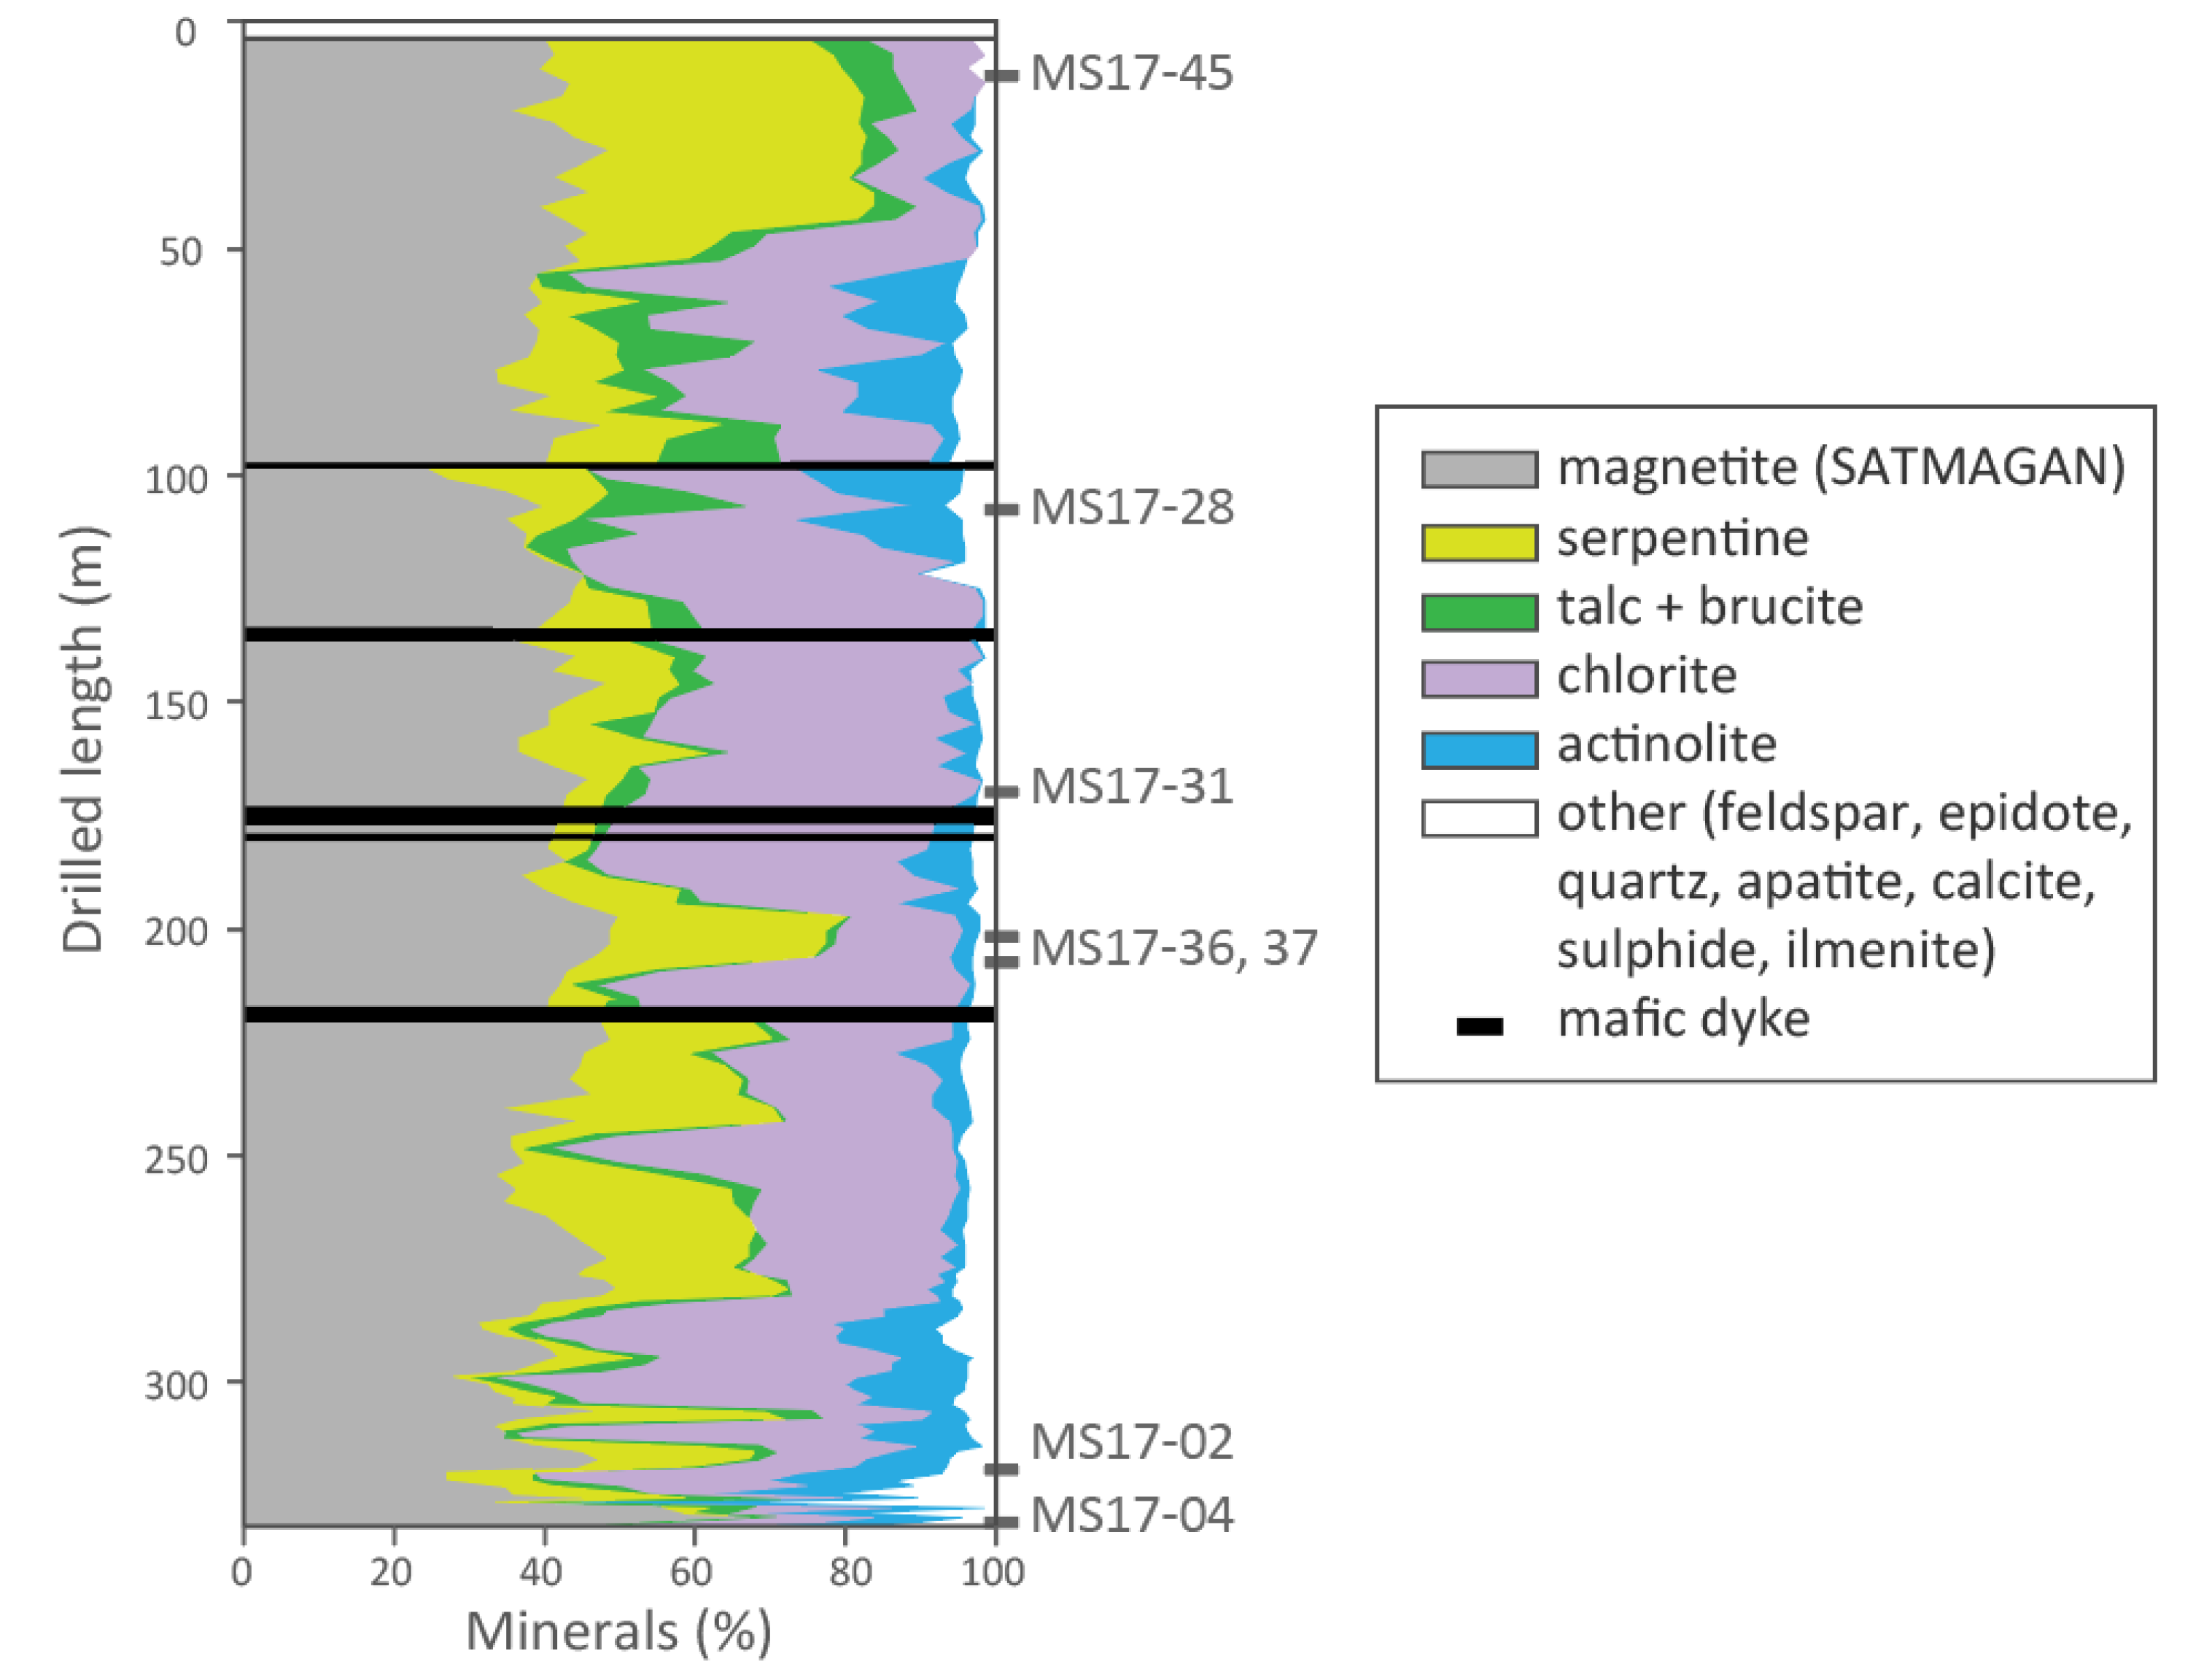
5.2. Mineral Proportions

The LDC rocks are dominated by magnetite (30–50%) and chlorite (30%), as well as serpentine ±talc ±brucite (15–30%) or actinolite (20%) (Table 4). SATMAGAN measurements confirm that the upper Fe-rich unit contains about 40 ± 5% of magnetite (Figure 3).
Normative silicates were calculated for the 159 samples of the company dataset using the CONSONORM_LG method [33]. This method calculates normative metamorphic minerals for specified P–T conditions. The calculation was performed with the 2SV350 model (representing 2.5 kbar and 350 °C conditions), which is suitable for rocks metamorphosed to the conditions of the greenschist facies, and with a normative estimate of CO2. The calculation was performed with all iron as FeO and using an iron value that corresponds to analyzed Fe2O3T minus the iron accommodated by the magnetite measured by SATMAGAN (Figure 3).
The normative silicates match the minerals observed in thin sections (Figure 3). The calculation confirms that the main silicates are serpentine ±brucite ±talc, chlorite and actinolite. The proportion of the main silicates, i.e., serpentine and chlorite, varies from 20:80 to 80:20. Localized intervals contain up to 20% actinolite (e.g., between 50 m and 120 m down hole; Figure 3).

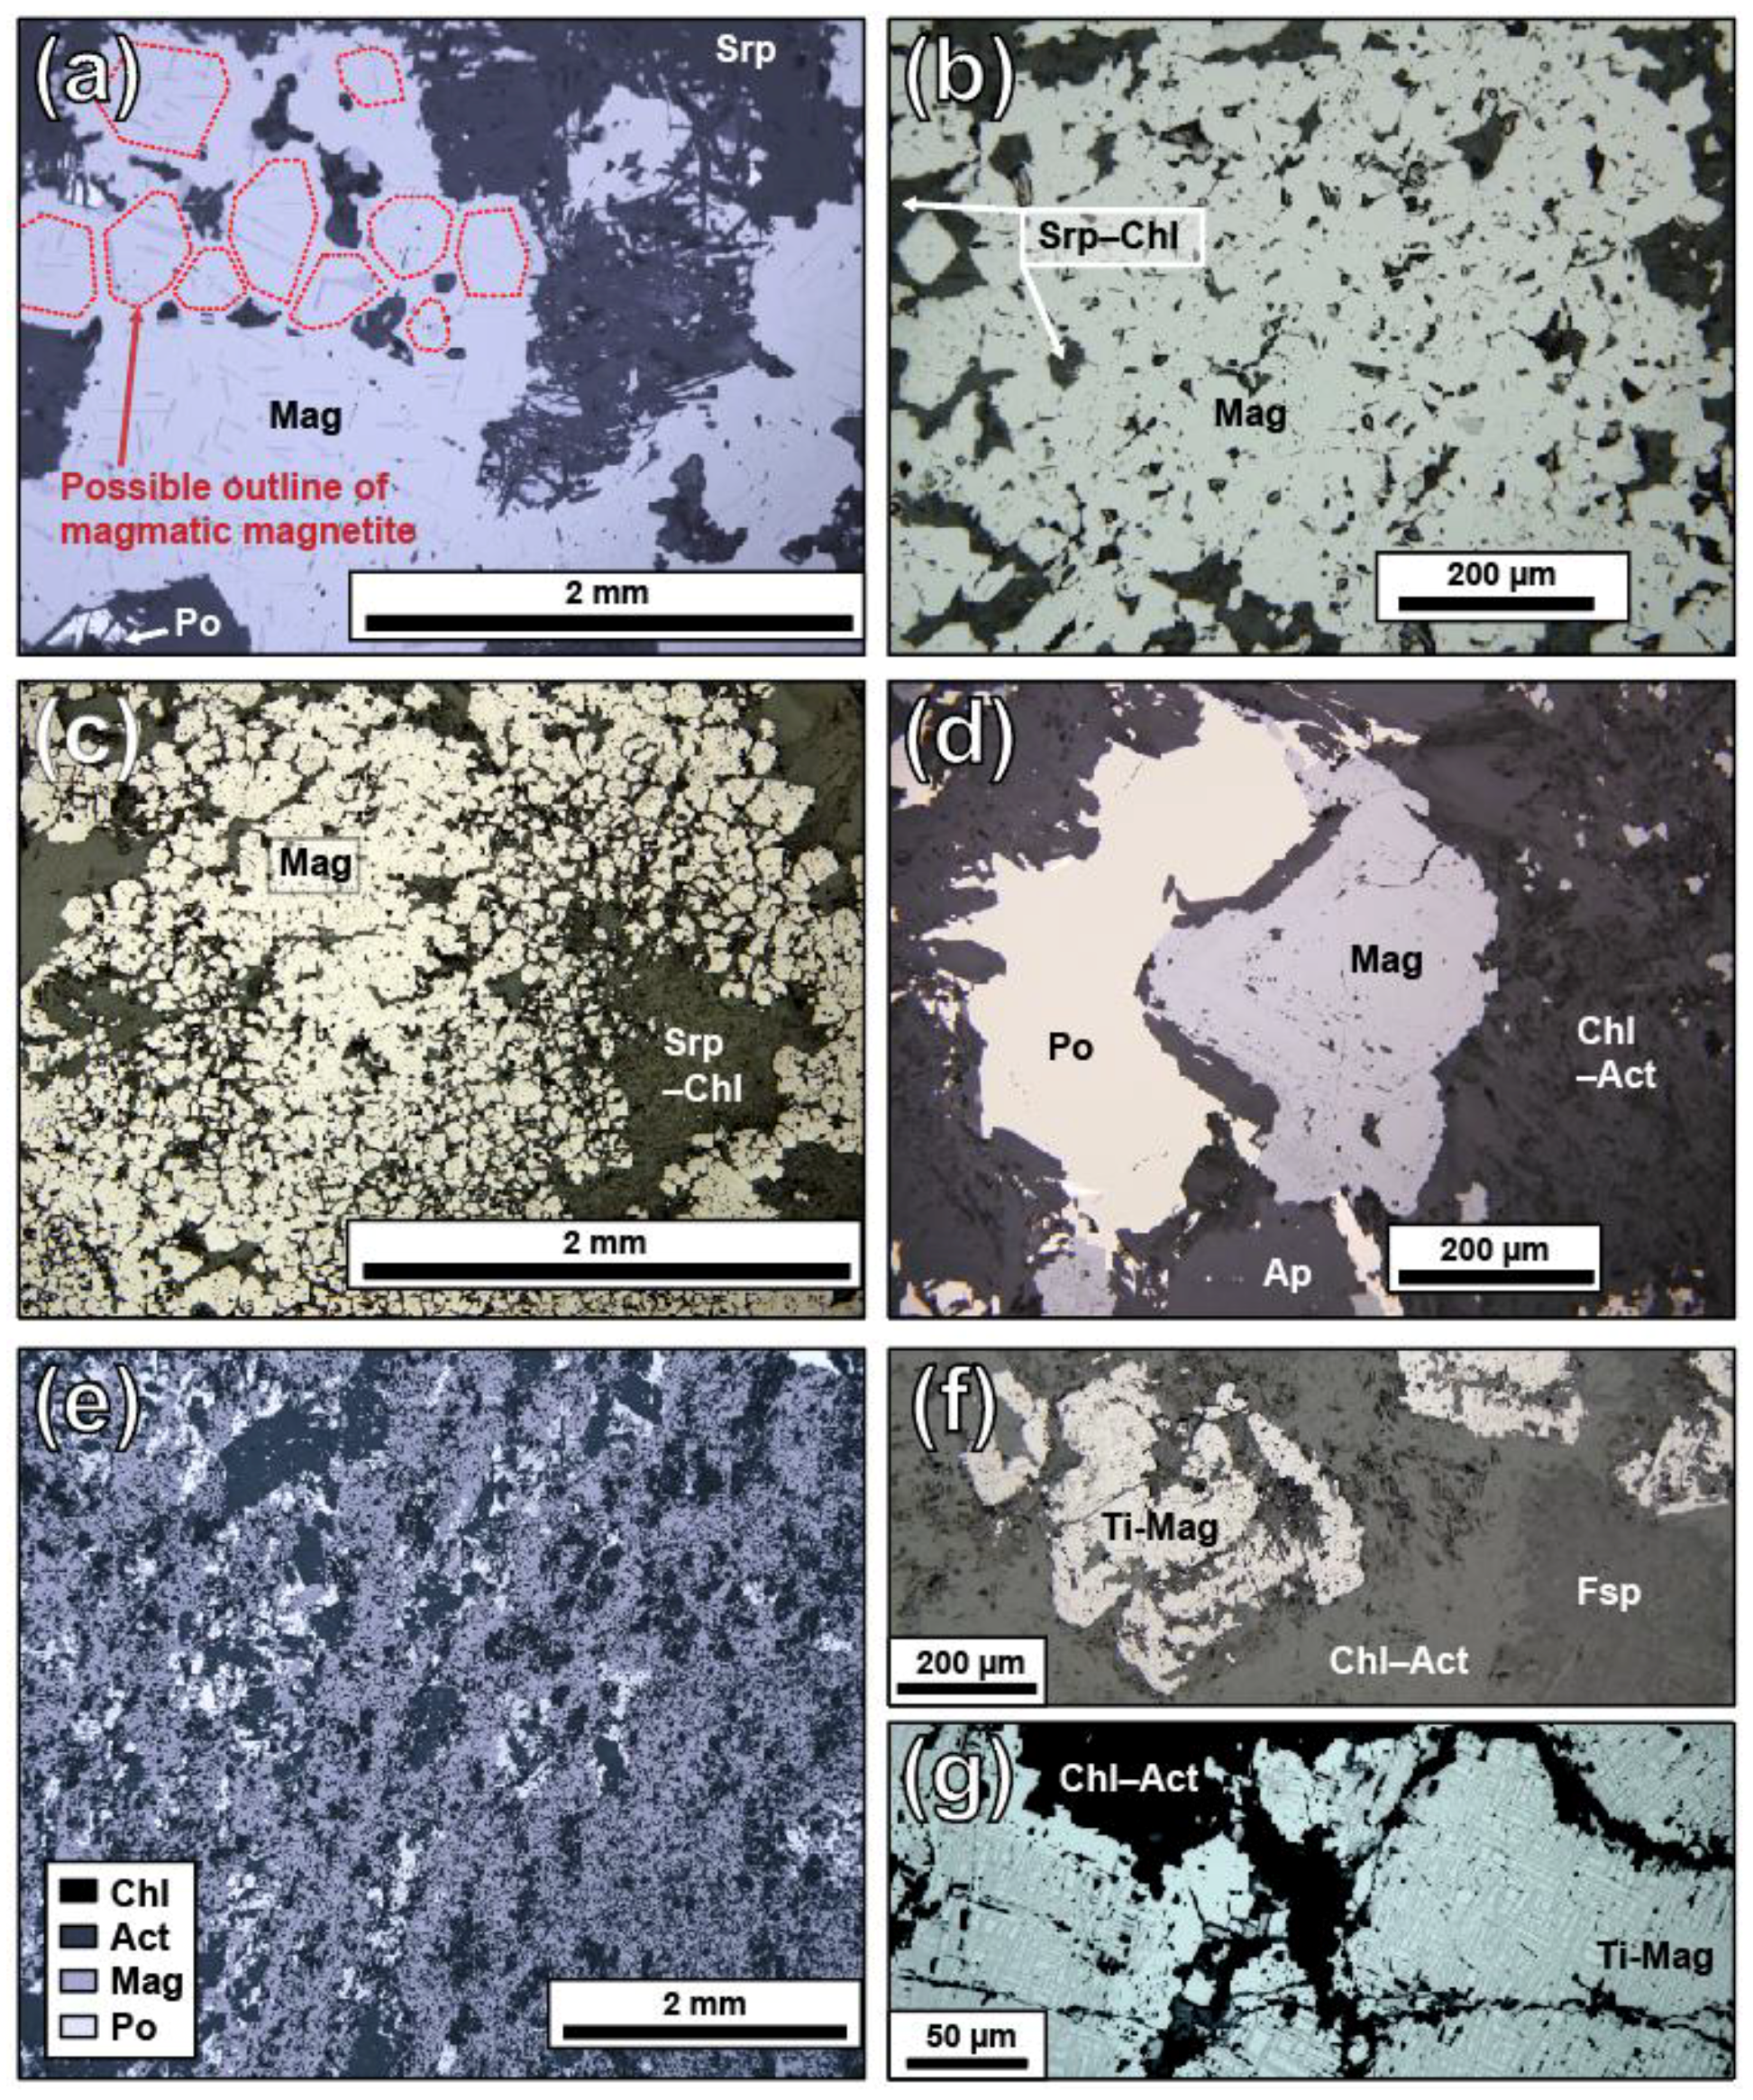
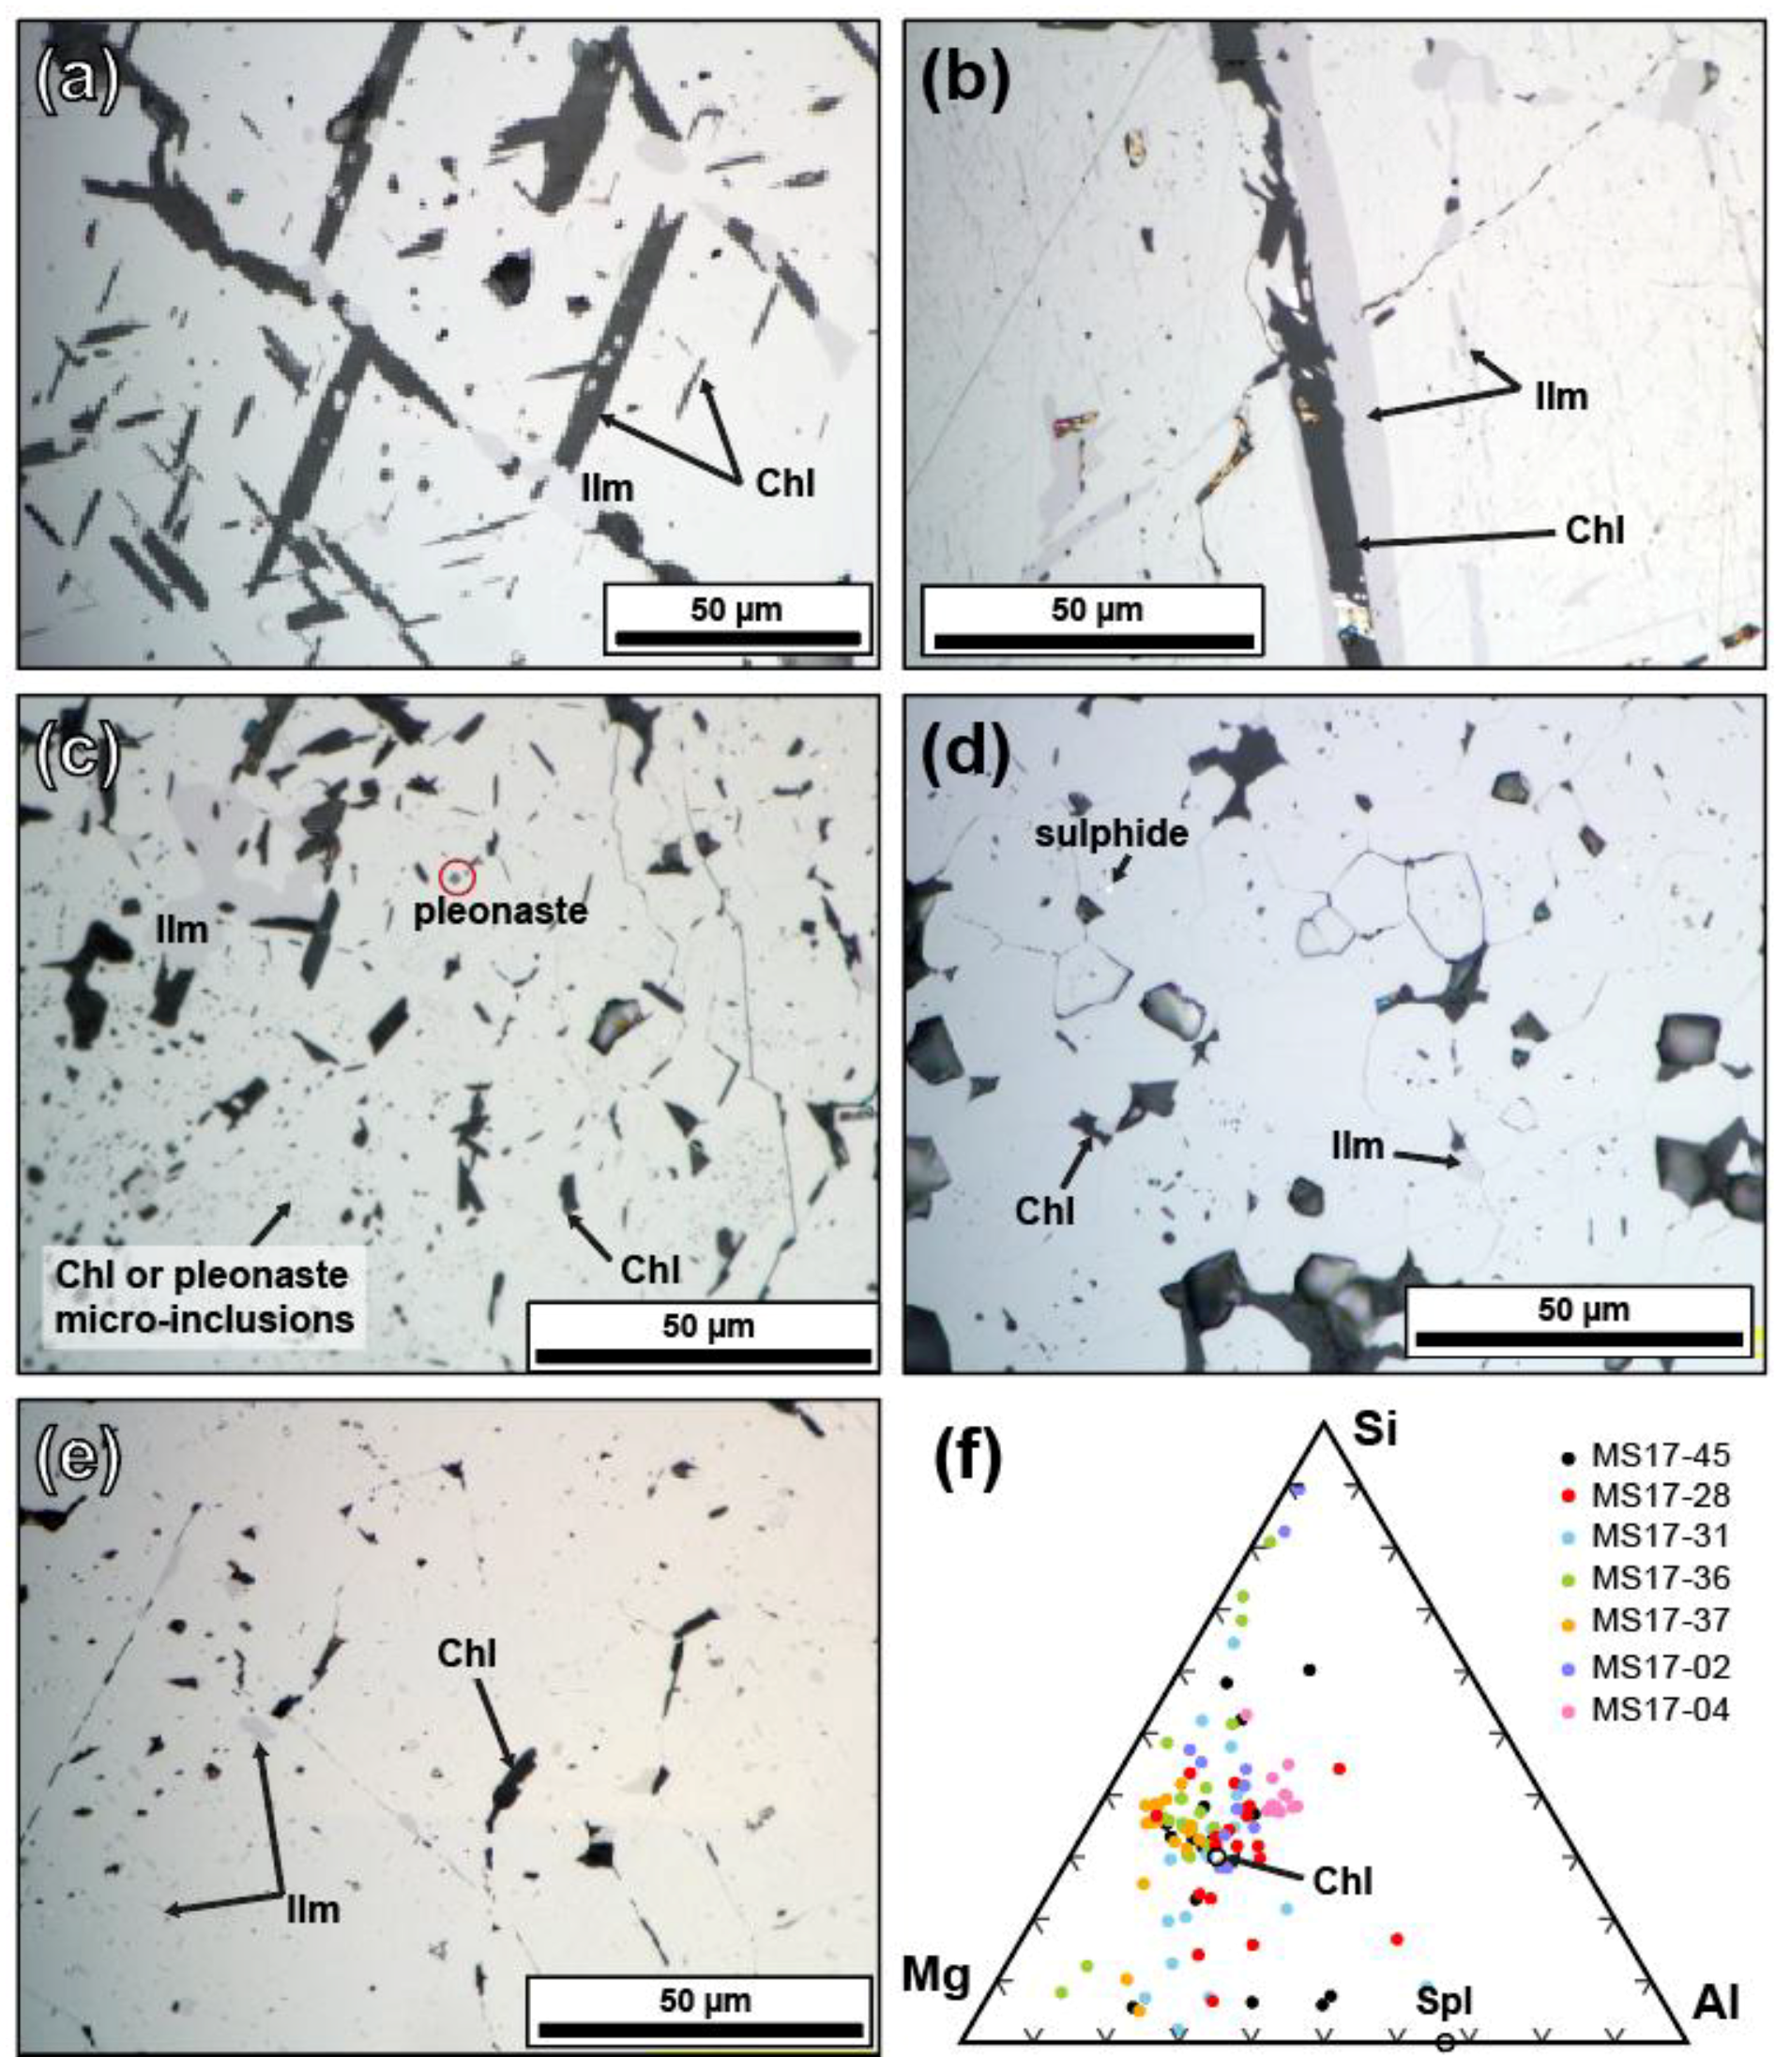
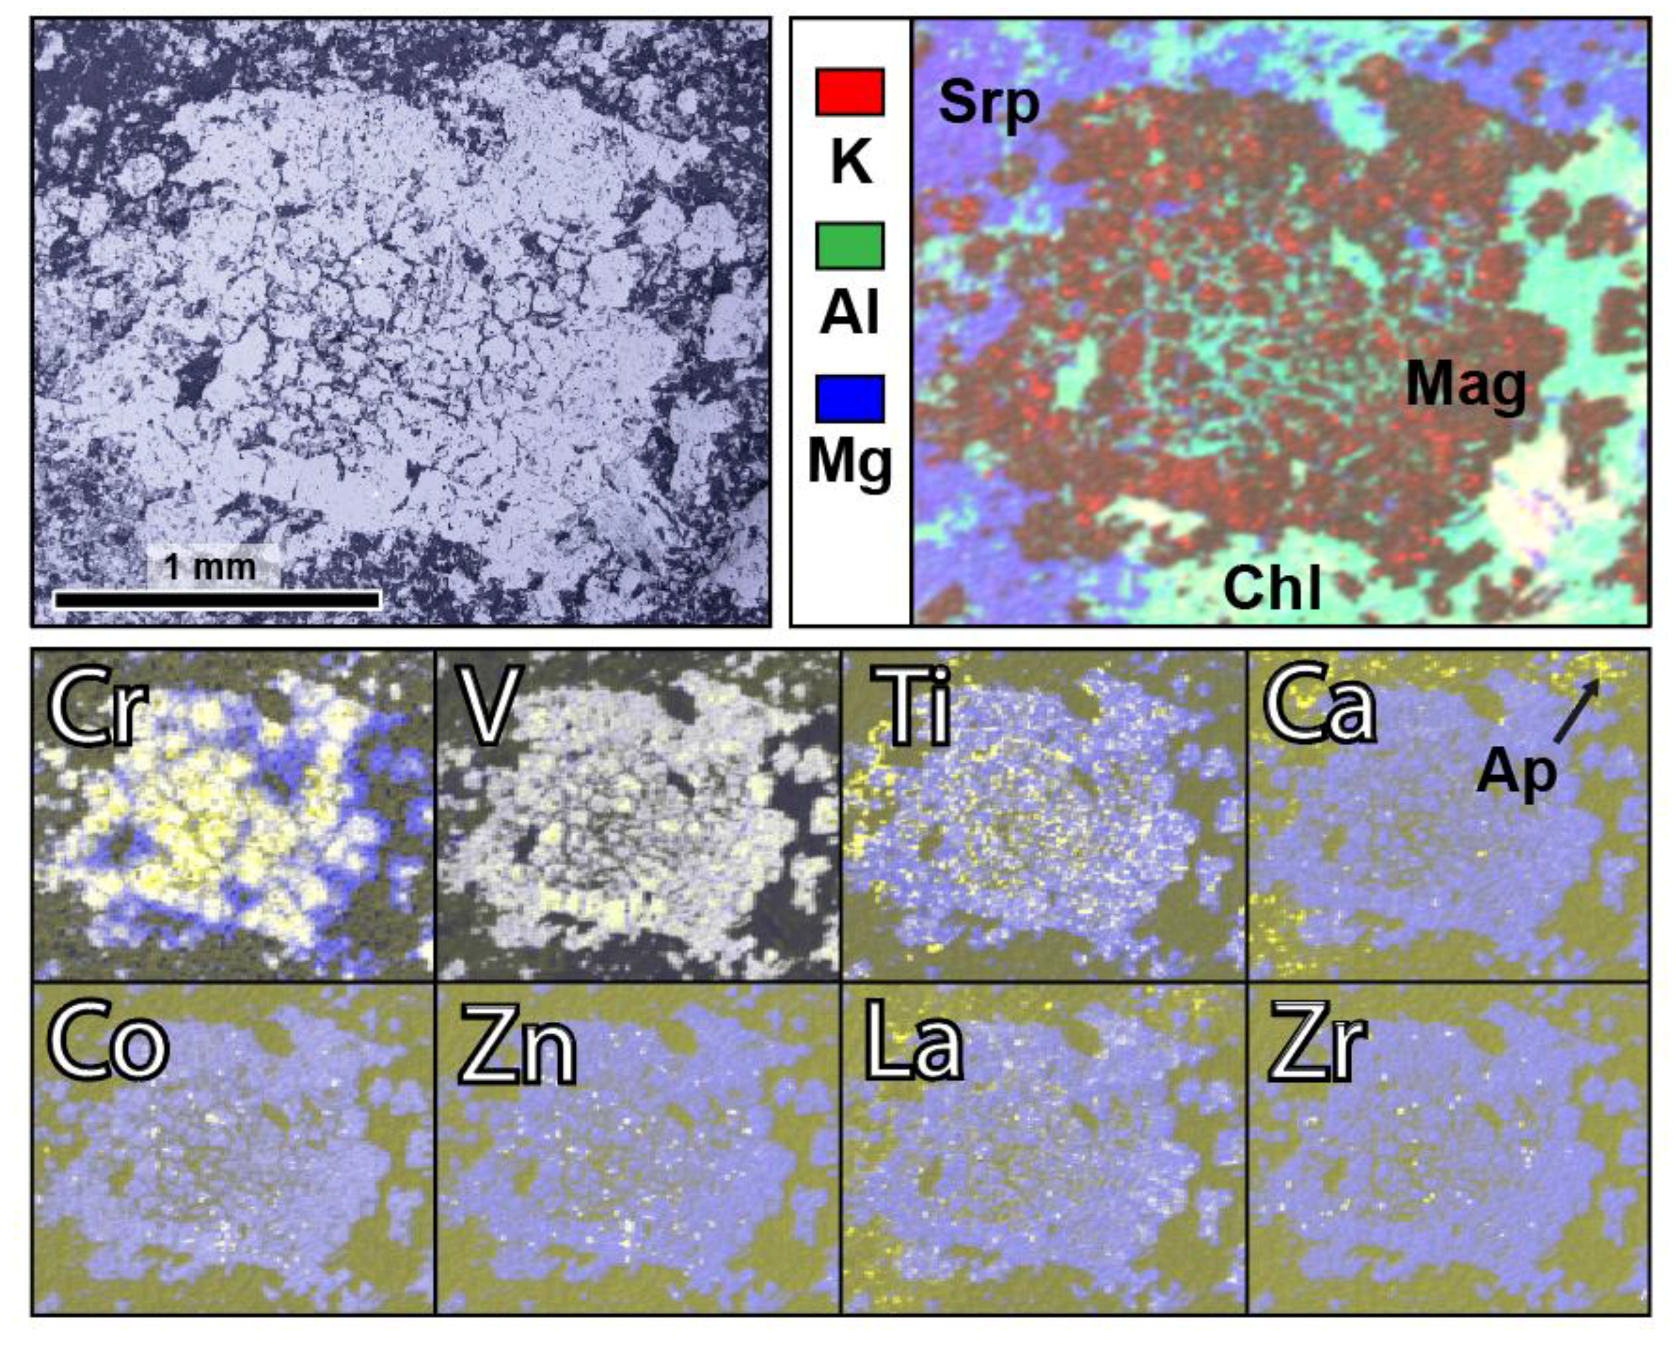
5.3. Magnetite Texture

This section focuses on the magnetite observed in LDC rocks (i.e., samples MS17-02, -04, -28, -31, -36, -37, and -45). In these rocks, magnetite is either abundant and encloses chlorite inclusions and ilmenite exsolutions, or is less abundant and inclusion-free. The inclusion-free magnetite rims the inclusion-bearing magnetite (Figure 6a,b), forms linear structures that separate oxide-rich from silicate-rich areas (Figure 6c), or forms slender elongated magnetite that rims serpentine clusters (Figure 5a).
The proportion of inclusion-free magnetite that surrounds the inclusion-bearing ones ranges from negligible to <10 vol % and up to 30 vol % in sample MS17-31 (Figure 6a,b and Supplemental Material S9). The inclusion-free magnetite represents up to 10 vol % of the serpentine-rich area (Figure 5a and Supplemental Material S9). The overall proportion of inclusion-free magnetite represents about <10–20% of the total observed magnetite.
Most inclusion- and exsolution-rich magnetites are 0.1–0.5 mm polygonal grains with irregular outlines and ilmenite exsolution lamellae (Figure 7a and Figure 8b) as well as granular ilmenite exsolutions (Figure 8a–c). Recrystallization is more pronounced in samples MS17-36 and -37, in which magnetite grains have well-developed triple junctions and ilmenites are granular exsolutions (Figure 7b,c and Figure 8e). These minerals have been dynamically recrystallized in a local shear zone. The magnetite texture in sample MS17-04 is different and corresponds to small (~10 µm), size-reduced, contiguous grains with interstitial chlorite (Figure 7e and Figure 8d).
Ilmenite exsolutions have been described in details by Buddington and Lindsley [40]. These authors suggested that increasing degrees of diffusion during an oxy-exsolution process form the following progression of textures: (1) trellis-type texture (thin ilmenite lamellae in all sets of {111} planes); (2) sandwich-type texture (thick ilmenite lamellae in one set of {111} planes); (3) granular ilmenite inside magnetite; and (4) external granular ilmenite. In the studied rocks, trellis-type texture is only observed in the Fe-Ti-oxides of volcanic rocks (Figure 7f,g). Sandwich-type and internal granular ilmenite are observed in some samples (Figure 5d, Figure 7a, Figure 8b). Internal (Figure 6a, Figure 7b, and Figure 8a–c,e) and external (Figure 7b and Figure 8d) granular ilmenite are the dominant texture in most samples. The ilmenite content of magnetite varies from 2–5% in most LDC samples and up to 10% in sample MS17-28.
The dominant Al-bearing mineral observed in magnetite is chlorite. Chlorite inclusions are granules with irregular shapes (Figure 7a–c) or their morphologies are controlled by the crystallography of magnetite (Figure 5d, Figure 6a, and Figure 8a,b). The alignment of small chlorite inclusions defines a zoning in sample MS17-02 only (Figure 7d). Pleonastes are small granular micro-exsolutions that represent <<1% of the surface area of titanomagnetites (Figure 8c). In situ (LA-ICP-MS) analyses confirm that chlorite is the dominant Al-bearing inclusion (Figure 8f).

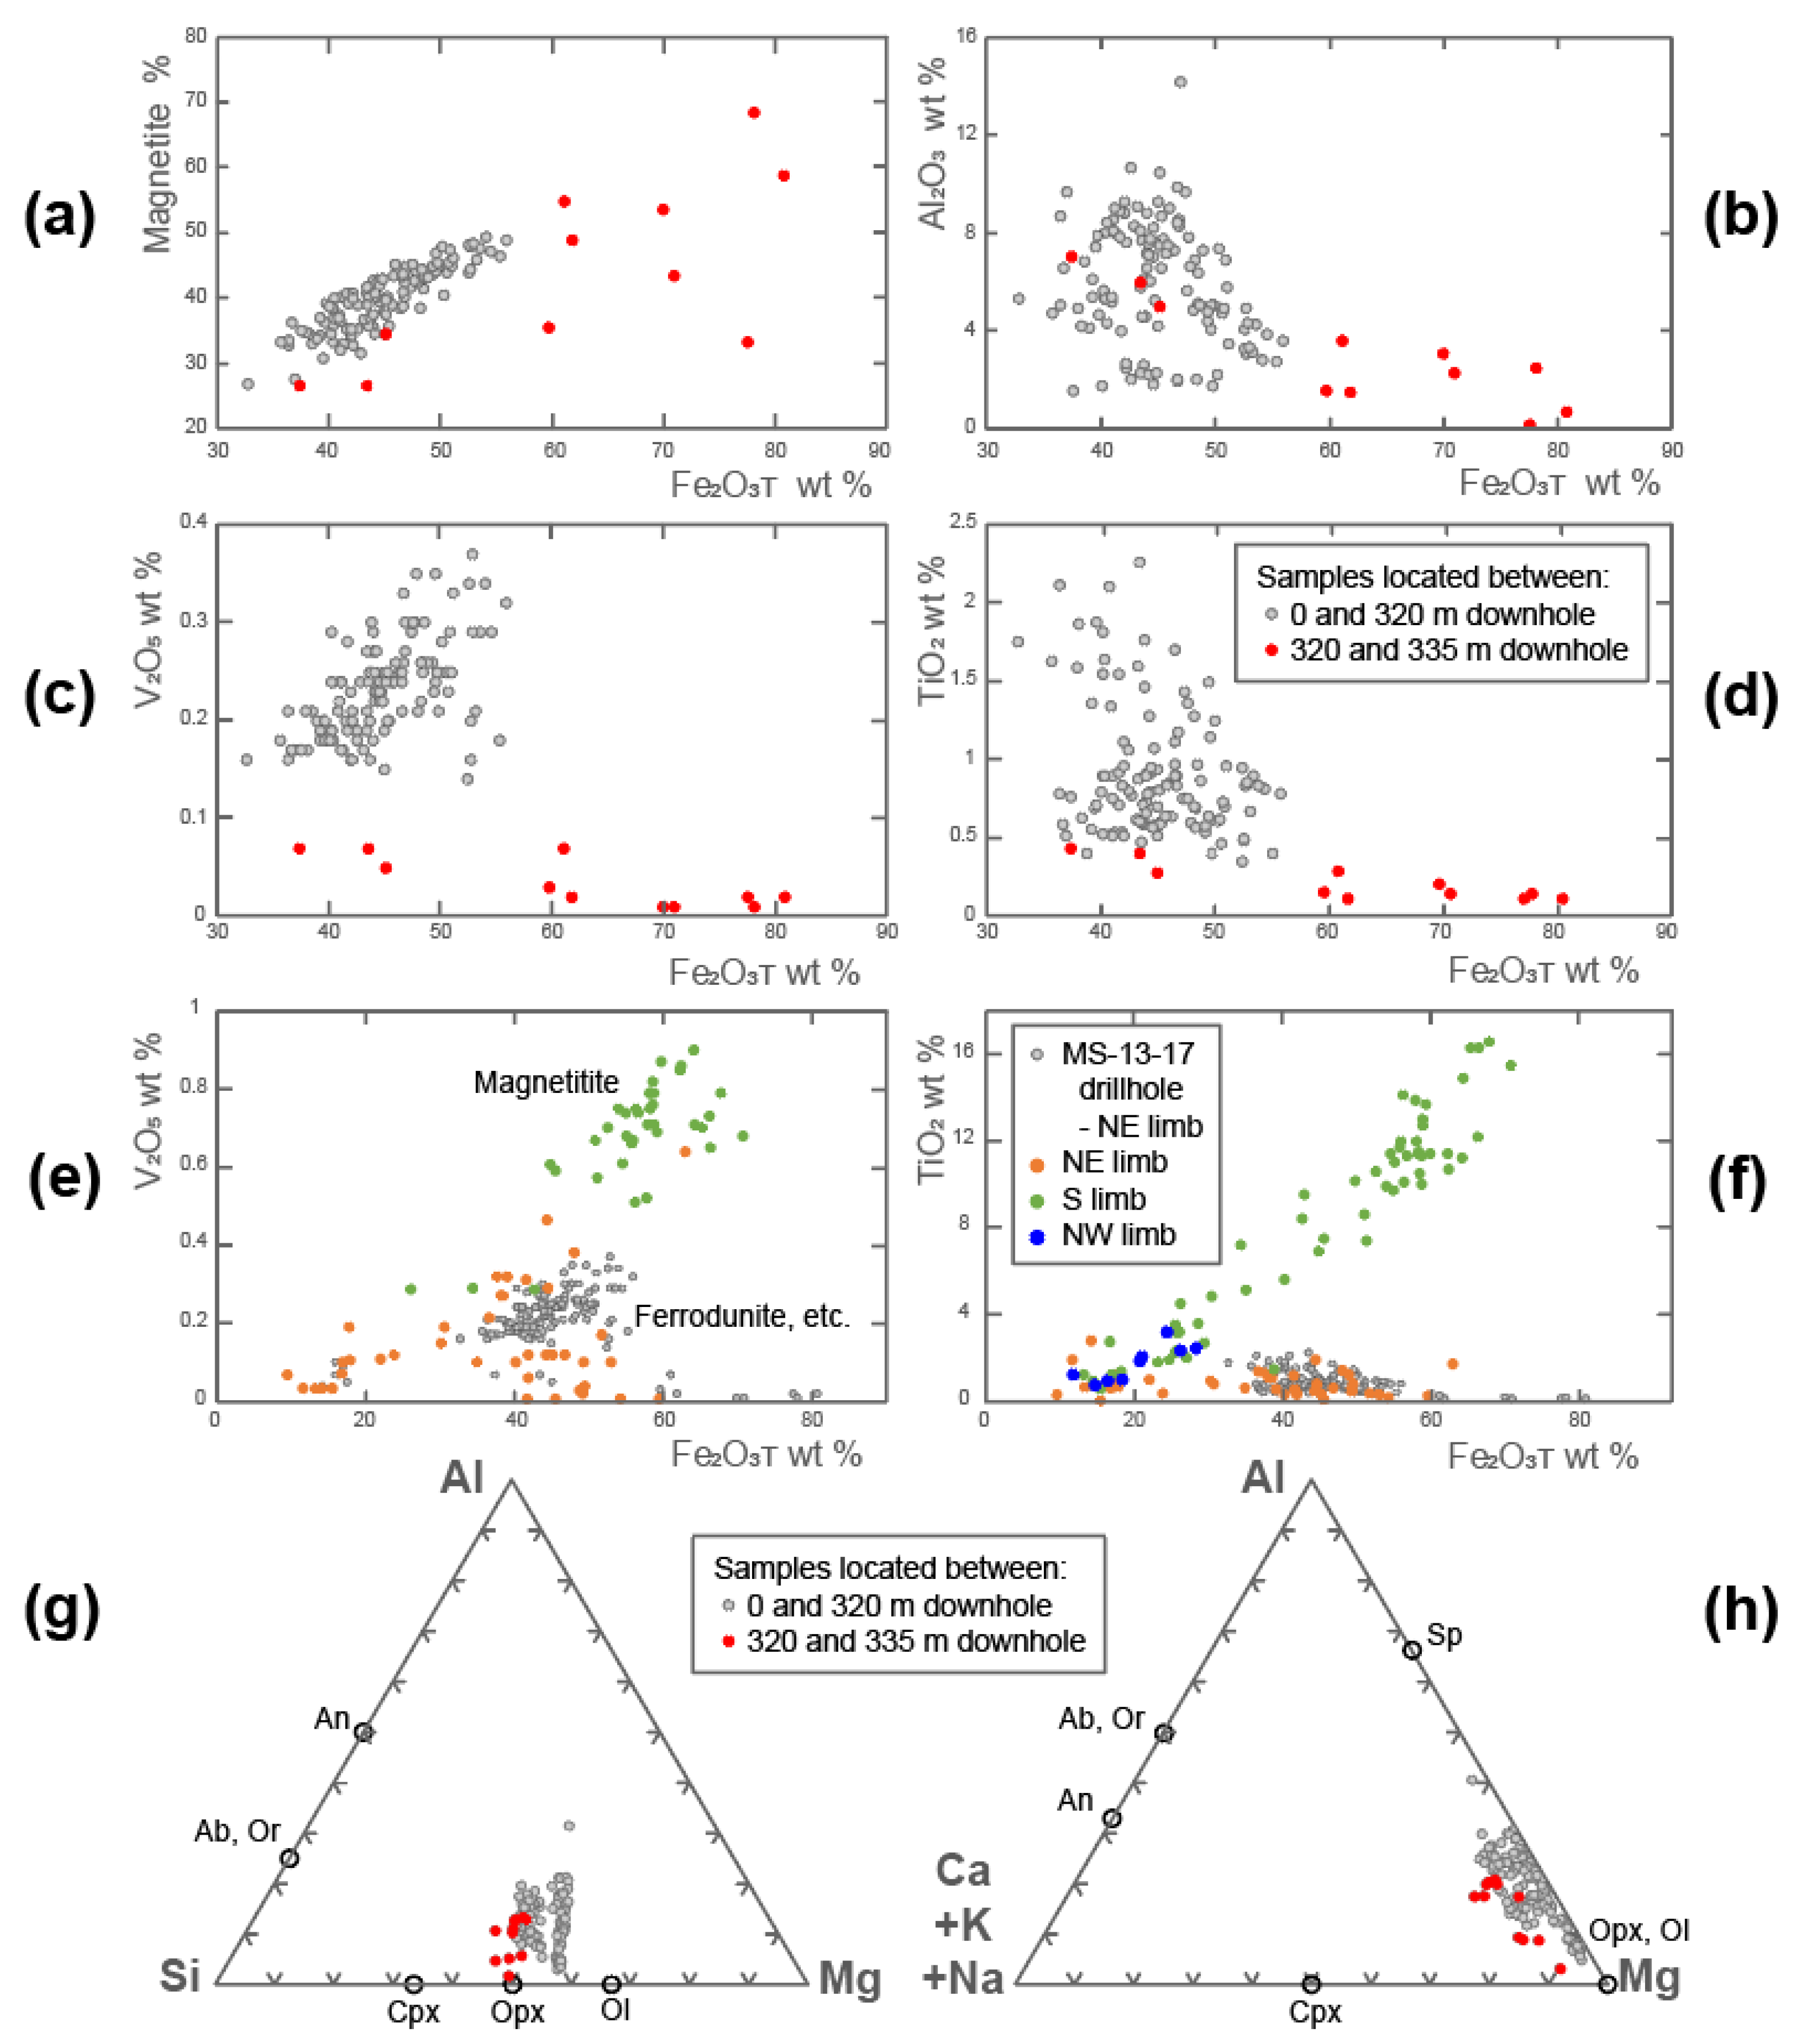
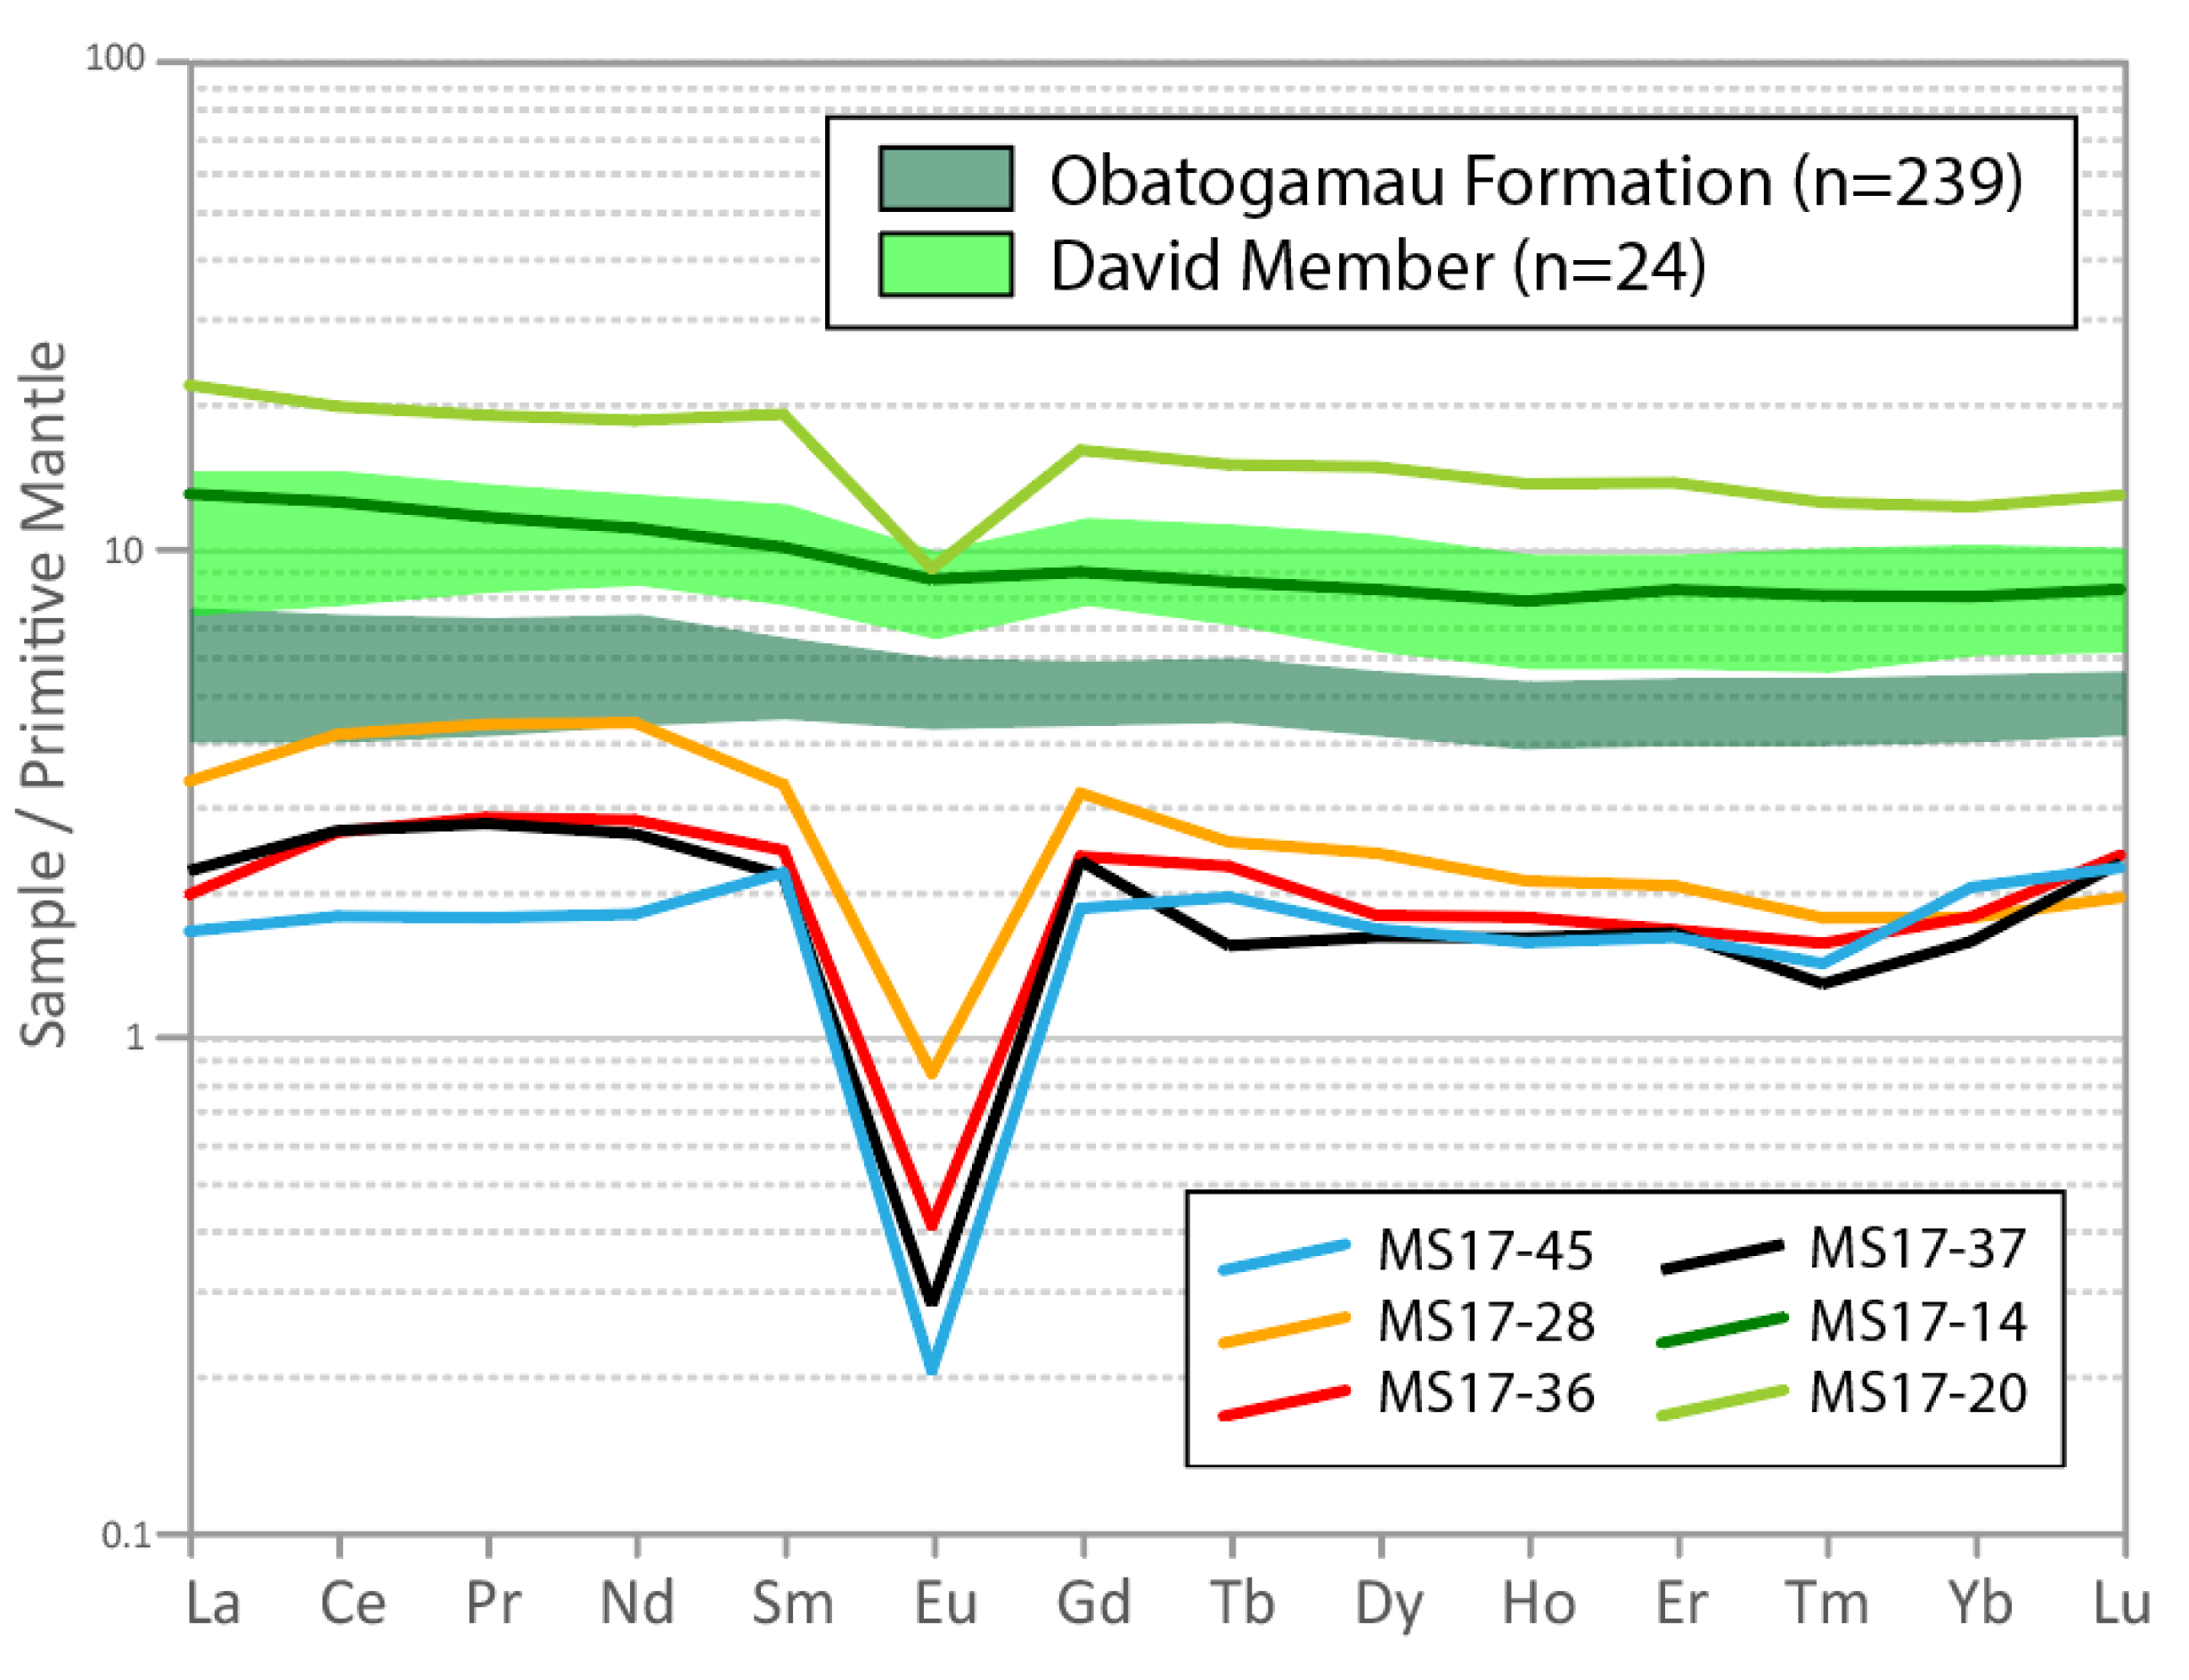
5.4. Whole Rock Chemical Analyses

The LDC rocks are SiO2-poor (20–30 wt %), contain minor amounts of Al2O3 (<10 wt %) and CaO (<4 wt %), as well as negligible amount of alkalis. These rocks are enriched in MgO and Fe2O3T (Table 1). Similar remarks can be made for the samples of the company dataset, which contain 30 to 60 wt % Fe2O3T (Figure 9). For these data, correlation coefficients are low between V, Ti, Al, and Fe, and they correspond to −0.31 (Fe2O3T – V), −0.47 (Fe2O3T − Ti), and −0.43 (Fe2O3T − Al). The Fe2O3T – V correlation, however, improves to 0.54 if the samples located >320 m downhole are discarded (Figure 9a–d). The studied layered zone (NE limb) differs from this of the S and NW limbs by a lower Ti-content, as well as a similar to lower V-content at equivalent Fe2O3T values (Figure 9e,f).
The six LDC samples analyzed for whole rock composition contain a low abundance of REE (Figure 10). The REE profiles are flat to slightly enriched in light REE (LREE) and display pronounced negative Eu anomalies (Figure 10). The volcanic rocks (samples MS17-14, -20) are mafic rocks according to their SiO2 content and plot in the field of basalt–andesite according to their Zr/TiO2 ratios [41]. The REE profiles of the volcanic rocks are flat and REE-richer than those of the LDC rocks. The profile of sample MS17-14 is similar to those reported for the basalts of the David Member, whereas sample MS17-20 is richer in REE and displays a negative Eu anomaly undocumented in the David Member lava flows (Figure 10).

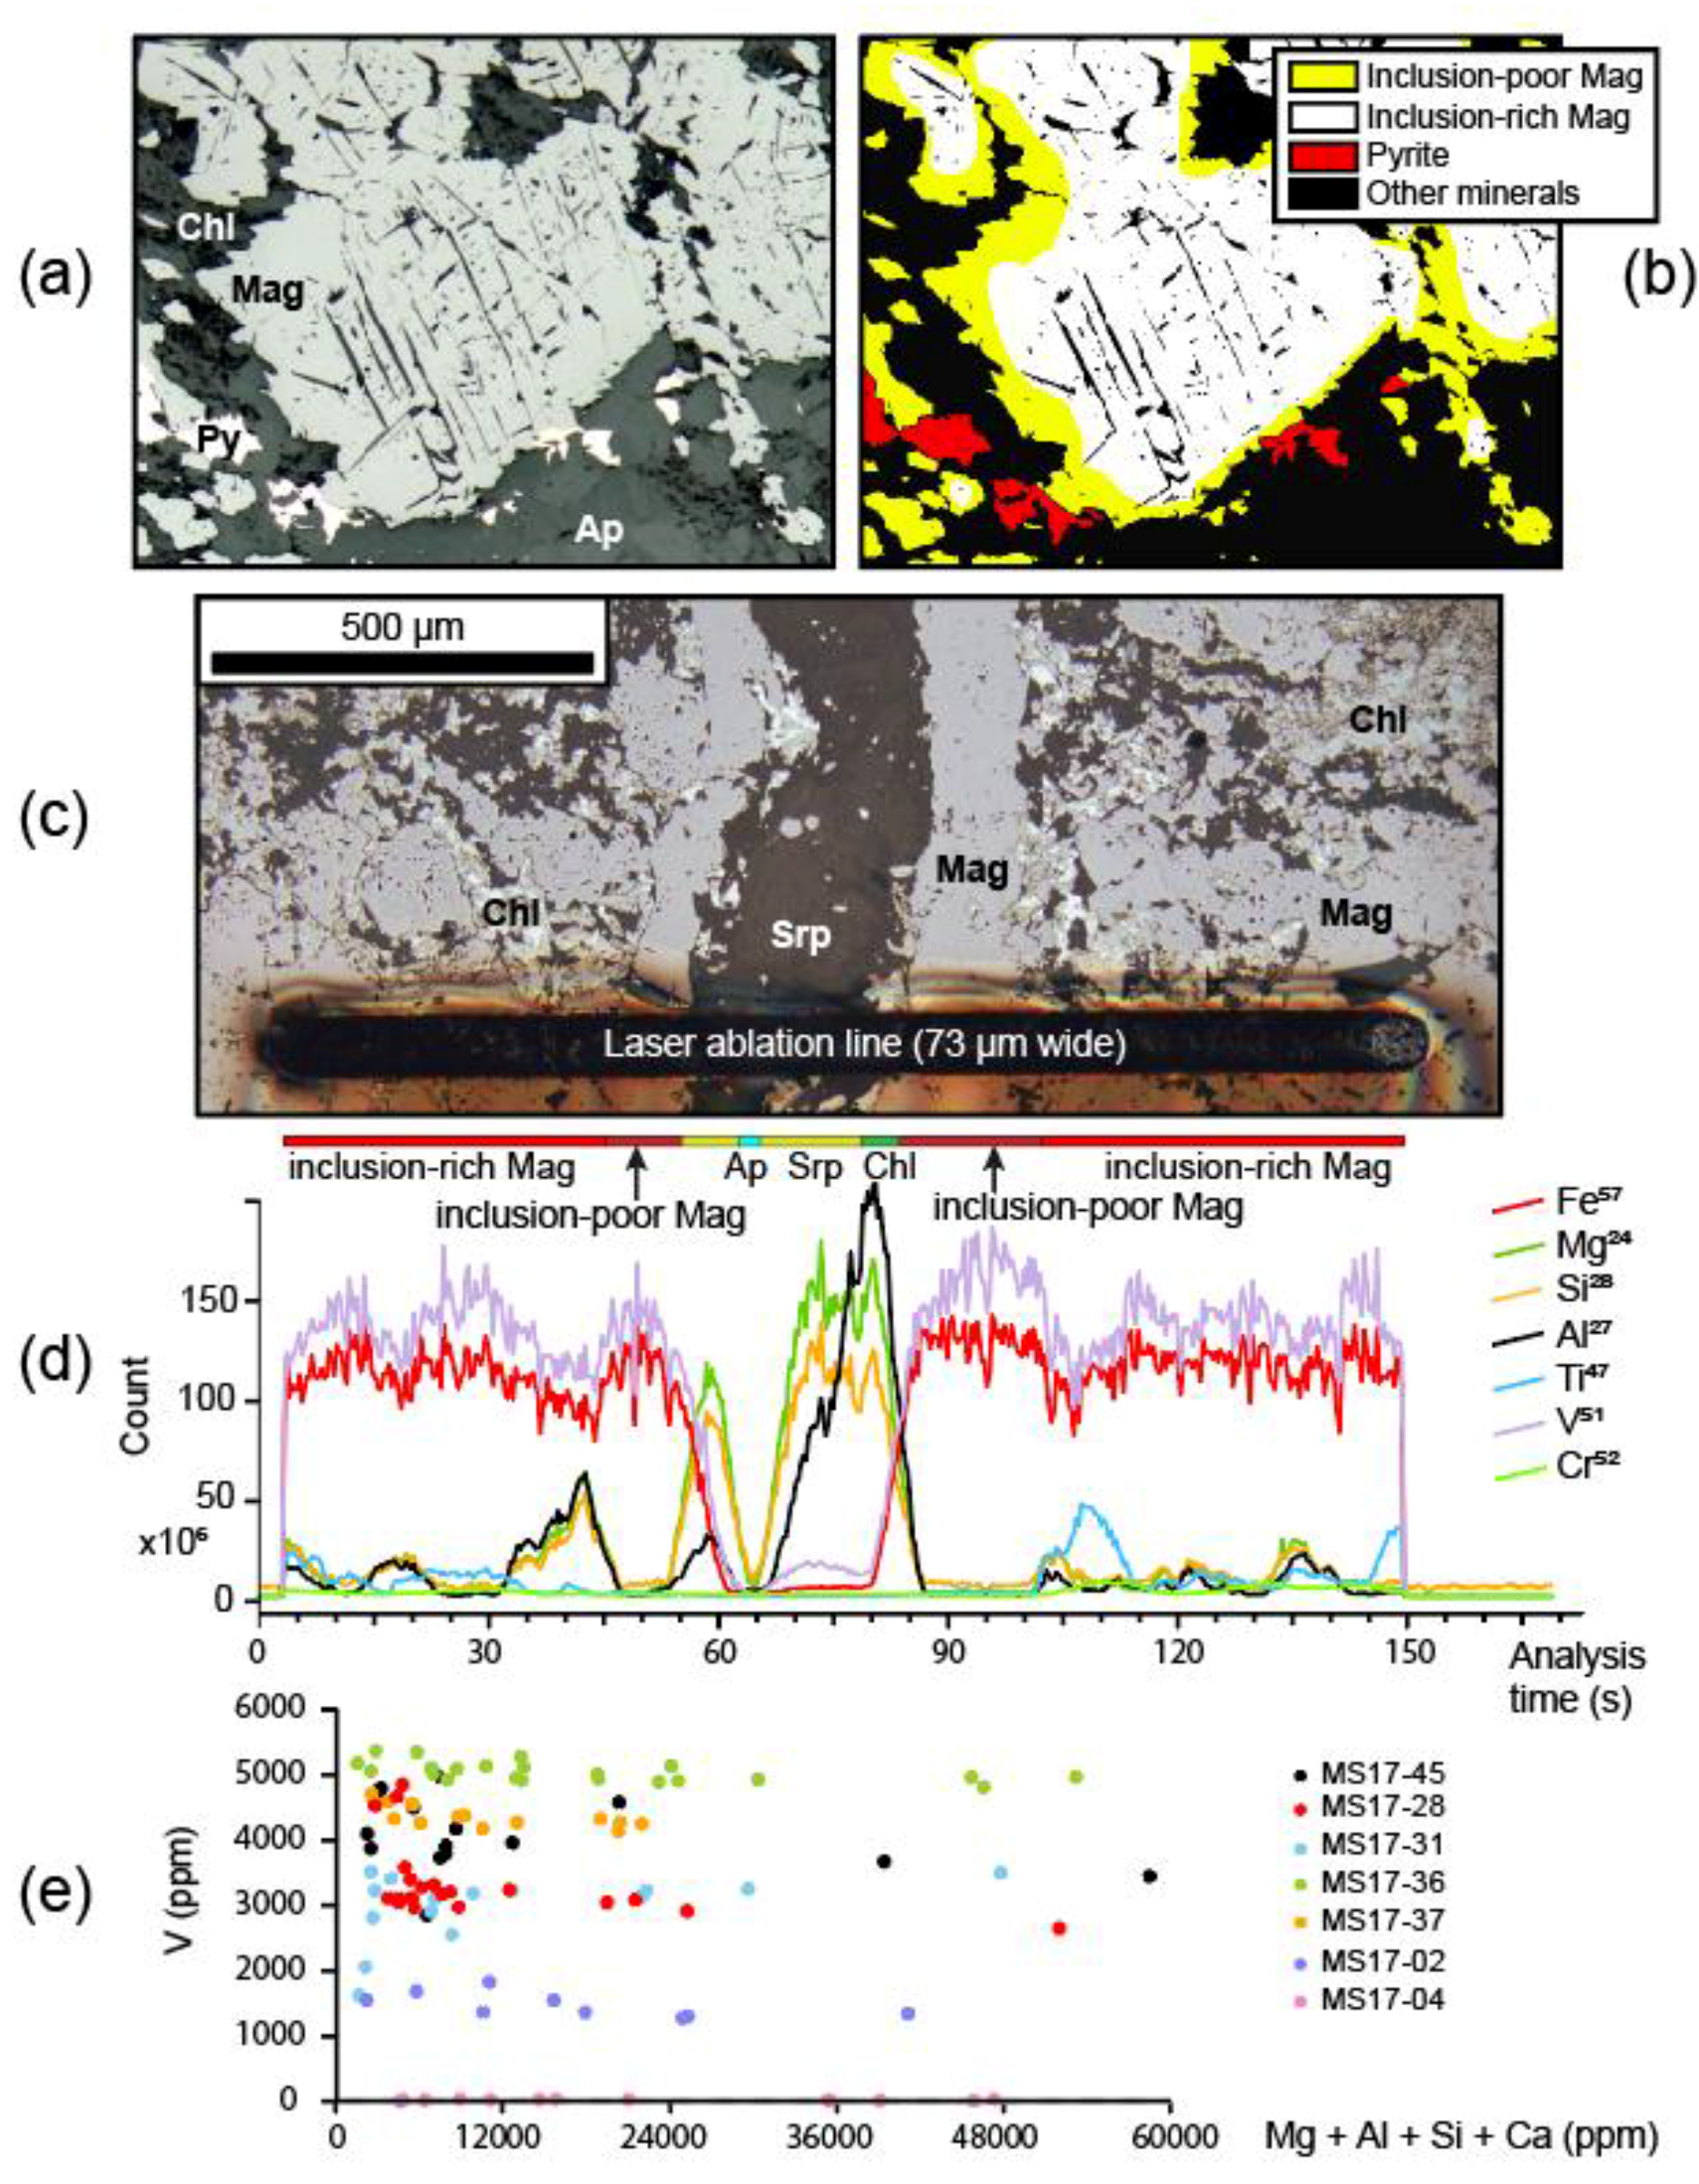
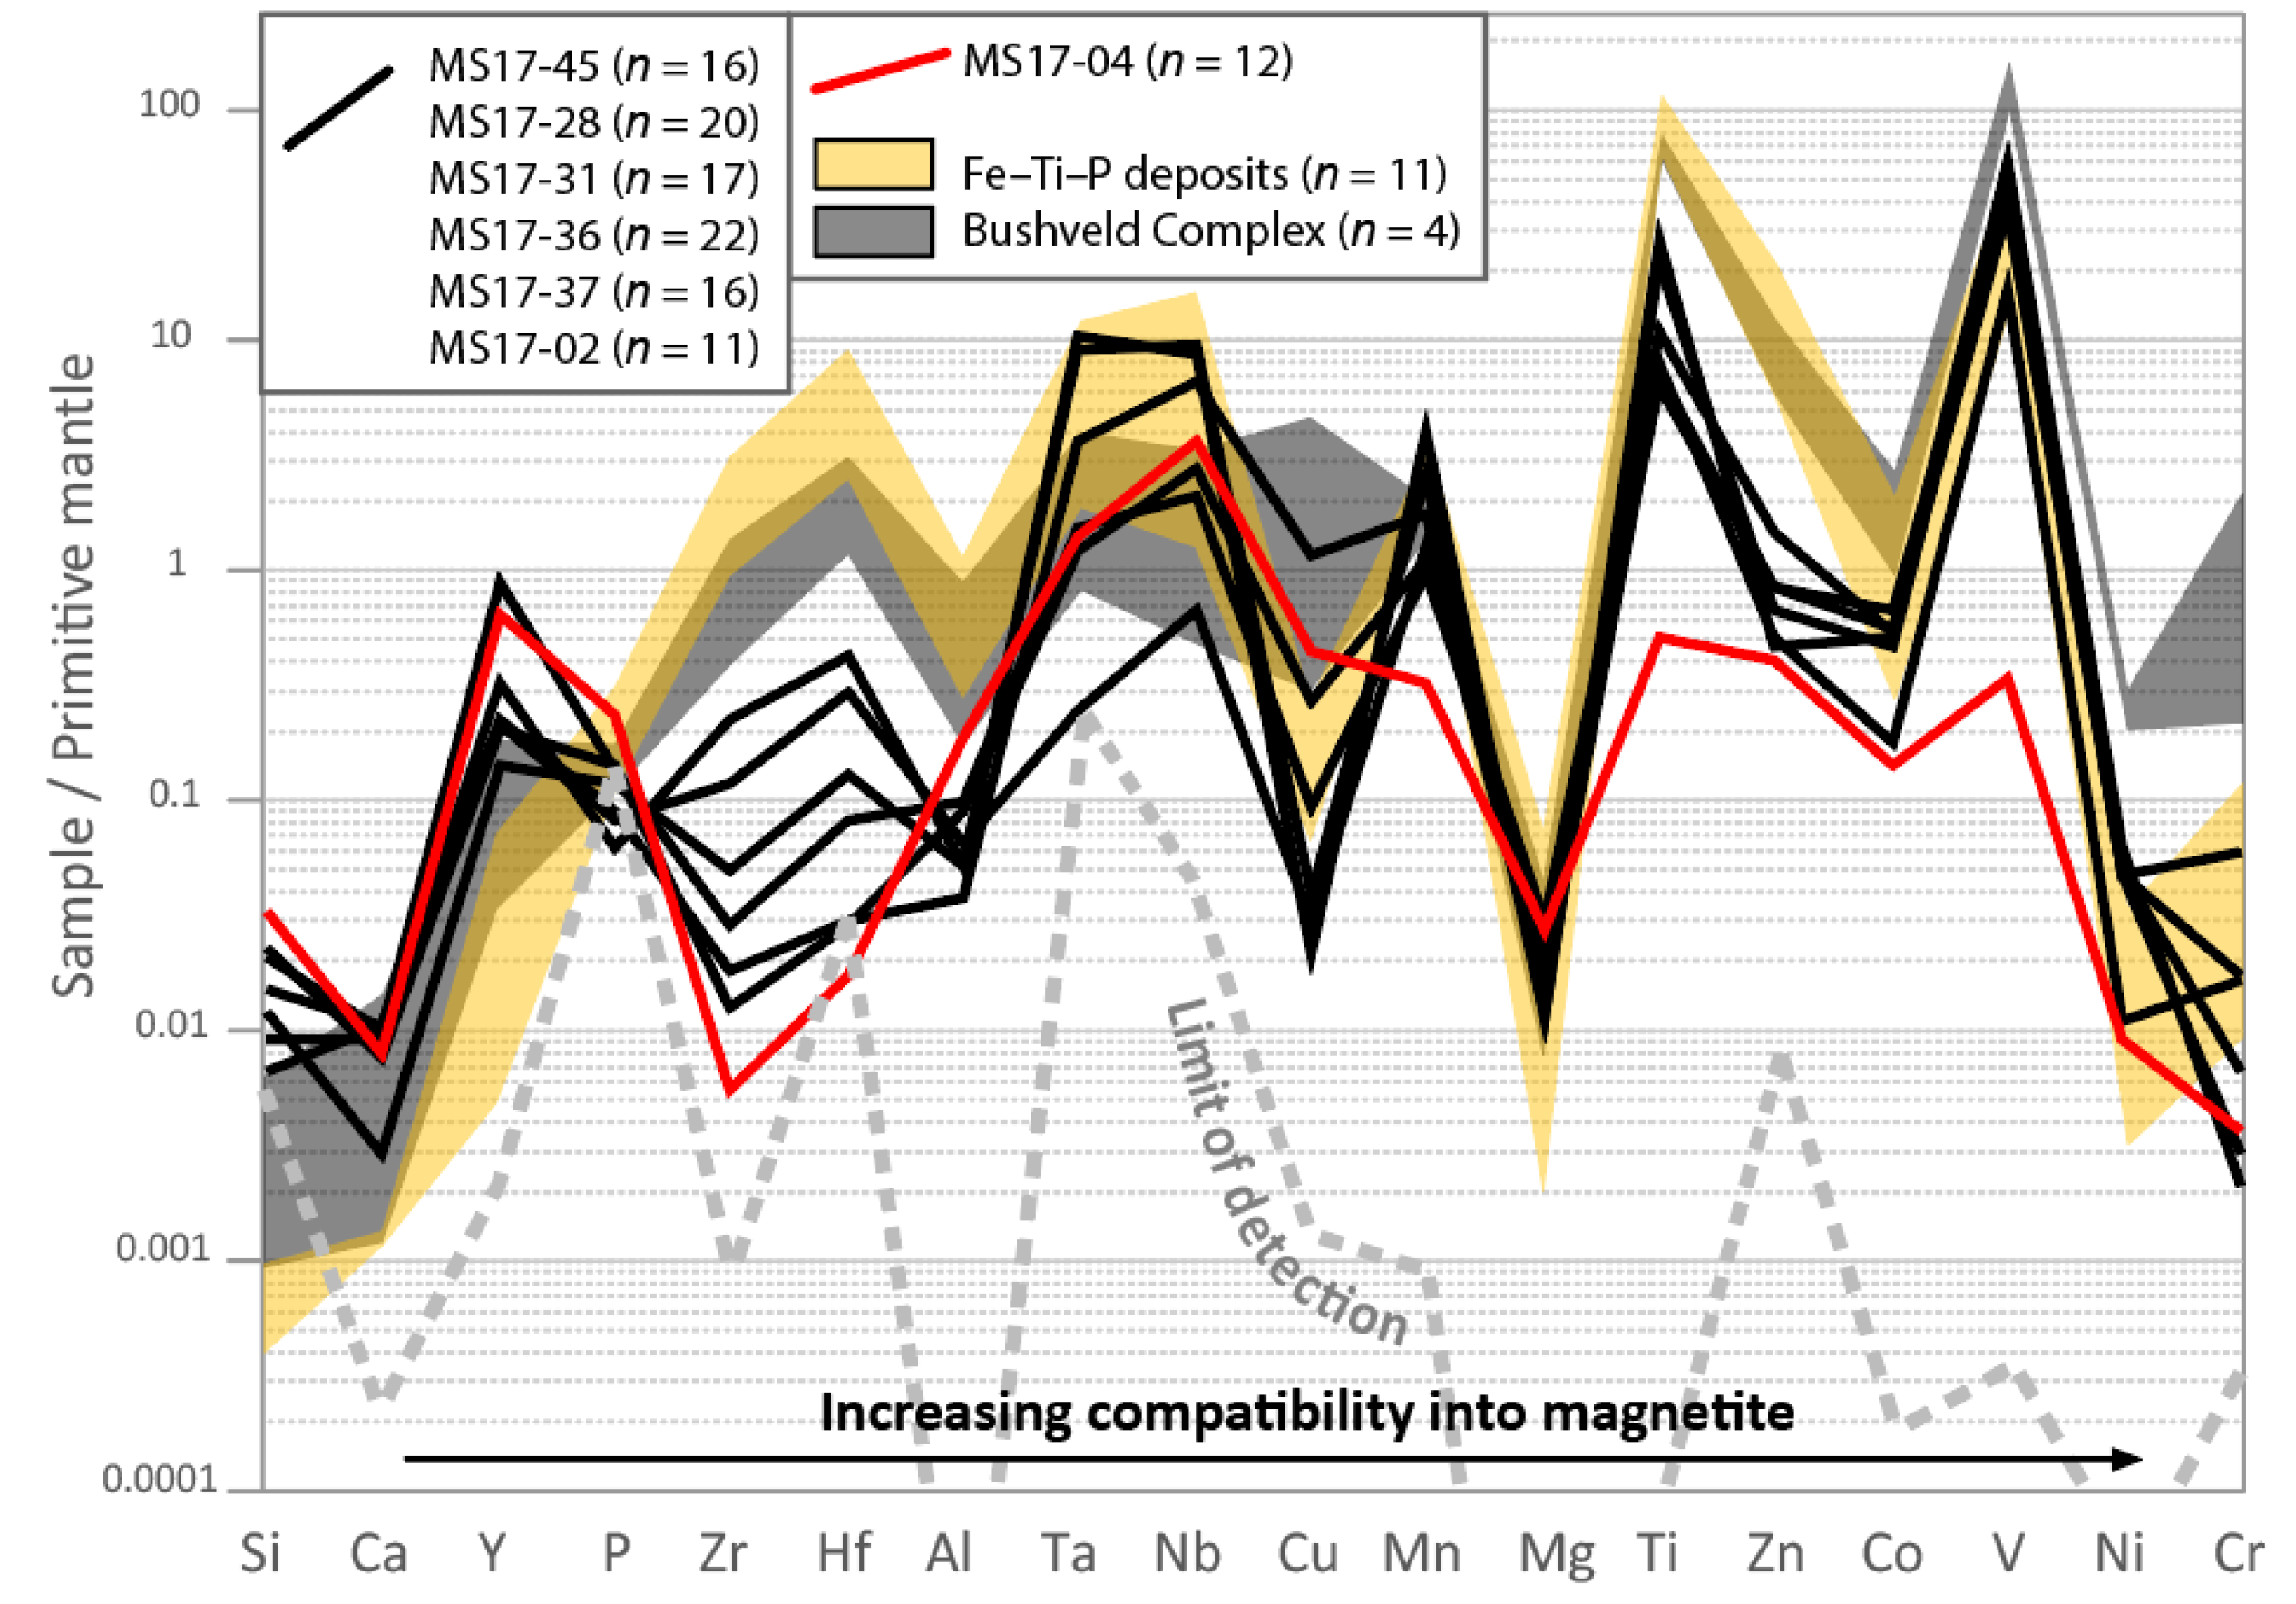
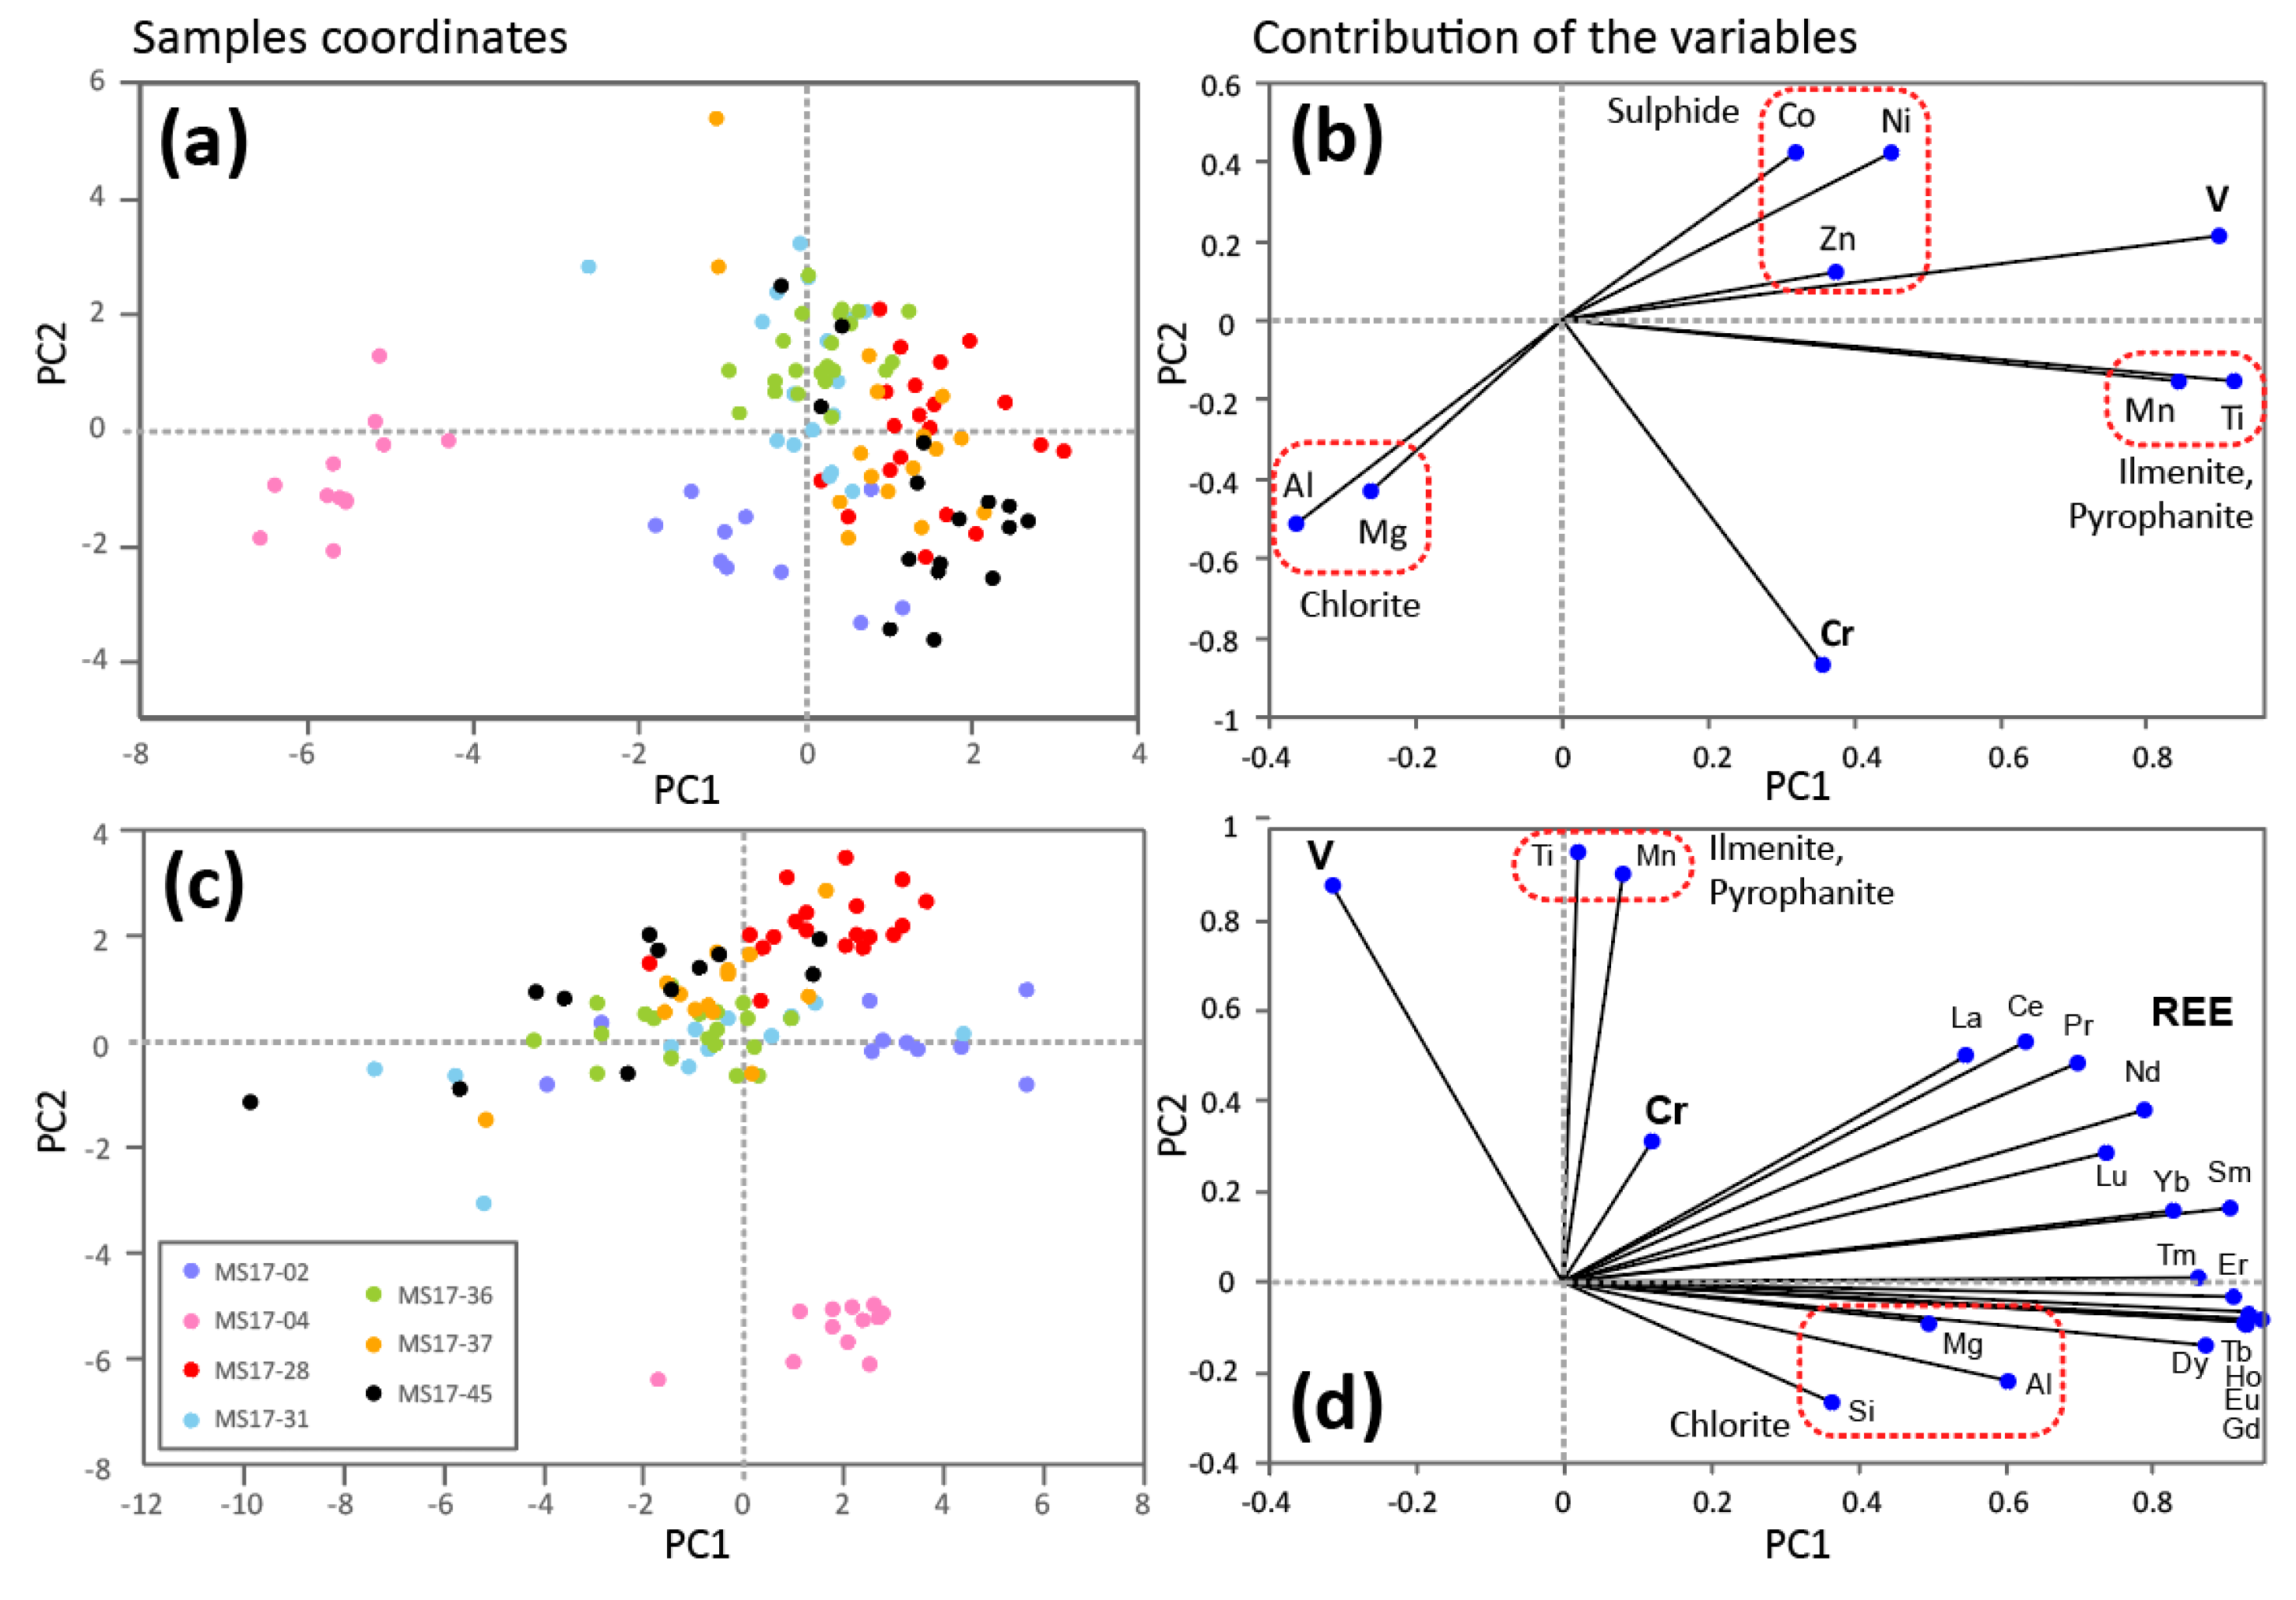
5.5. In Situ Chemical Analyses

In situ (LA-ICP-MS) analyses were performed on magnetite from the LDC rocks (Table 2). The main silicates were also analyzed to document their Mg#, as well as their V, Cr, and REE contents (Table 3) for comparison with magnetite composition.
According to line analyses, elements such as V correlate with Fe and are accommodated by magnetite. Other elements correlate with Al, Si, and Mg (chlorite inclusions) or with Ti (ilmenite exsolutions). Some elements have unclear distribution due to low abundance (e.g., Cr) (Figure 6d). Also, inclusion-rich and inclusion-poor magnetites display similar V and Cr contents (Figure 6d,e). Chemical maps also point to elements with homogeneous distribution (i.e., V, Cr) that are accommodated by magnetite. The other elements have a nugget-style distribution and are controlled by inclusions and exsolutions (Figure 11).
General magnetite compositions are presented by a diagram developed for this mineral [36] (Figure 12). The LDC magnetites are similar in composition, except for magnetite from sample MS17-04, which is the least enriched in Zr, Mn, Ti, and V (Figure 12). The LDC magnetites also have compositions that are comparable to those of magnetites from other layered complexes (e.g., V), except for the distinctively lower Zr, Hf, Al, and Zn; and higher Si and Y concentrations (Figure 12). Compared to titanomagnetite from the S limb layered zone (Figure 12 of Arguin and collaborators [3]), the studied oxides contain more Ca and Y and 10 times more Si, as well as equivalent concentrations of P, Cu, Mn, and Co. The studied titanomagnetites also contain less Zr, Hf, Al, slightly less V, Nb, and Ta, and 10 times less Ti, Zn, and Zr.
The chemical composition of the LDC magnetites was further investigated using a principal component analysis (PCA). The PCA is a coordinate transformation method that can be used to reduce the dimensionality of a dataset (n observations and m variables). The method calculates principal components (PC1, PC2, etc.) and by considering only PC1 and PC2 (Figure 13), the dimensionality of the data is reduced from m to two variables. In our case, m = 9 (Figure 13a,b) and m = 21 (Figure 13c,d) variables, n = 114 data (i.e., in situ magnetite analyses) and a natural logarithm transformation is performed to facilitate the combination of the variables.
For both PCA models, the magnetites from sample MS17-04 have a distinct chemistry (Figure 13). Also, the following elements are positively correlated: (1) Al, Mg and Si (chlorite inclusions); (2) Mn and Ti (ilmenite exsolution); and (3) Co, Ni, and Zn (sulfide micro-inclusions). Cr and V plot independently of the other elements. The REE are associated with Si, Al and Mg according to PC1 (Figure 13d).
The analyzed magnetites contain 1–10 ppm REE. The REE profiles are similar for all samples. The profiles are flat to slightly LREE-enriched and display a pronounced negative Eu anomaly (Figure 14a). The silicates are characterized by elevated Mg# (> 0.7–0.8) and they have V–Cr contents much lower than those measured in the magnetites (Table 3). The REE content of the silicates and oxides, on the other hand, are comparable (Table 2 and Table 3). The REE profiles of the silicates are flat with negative Eu anomalies. Chlorite, serpentine, and amphibole have distinct light and heavy REE (LREE and HREE) contents (Figure 14b).
The V-Ti content of the magnetite (in situ analyses) is compared to bulk rock Ti-V values using the company dataset (Figure 15a,b). The bulk Ti-content of the samples is ~9700 ppm V (median) between 50 and 120 m downhole, and ~4400 ppm V in the rest of the 0 to 320 interval. The Ti values recalculated to 100% magnetite have a similar spatial distribution: ~20,000–30,000 ppm V (median = 25,365) between 50 m and 120 m, and ~9000–10,000 ppm V (median = 11,130) for the rest of the samples. These values are similar to the Ti values determined from in situ analyses of magnetite (Figure 15a).
The studied rocks have homogeneous V-contents between 0 and 320 m downhole: ~1300 ppm V (median = 1288, standard deviation = 300 ppm V). The V values recalculated to 100% magnetite are more heterogeneous and are comprised between ~2500 ppm and ~5000 ppm V. These values decrease rapidly within 15 m of the contact between LDC and volcanic rocks. The V-content of the magnetite, from in situ analyses, is similar or higher to the bulk rock V-content recalculated to 100% magnetite (Figure 15b).

6. Chemical Modelling

Several methods were applied to bulk rock analyses to quantify the intensity of hydrothermal alteration and to comment on the primary magmatic assemblages.

6.1. Modelling Procedure

Given the proximity between the Mt. Sorcerer area and a porphyry-style hydrothermal system, the studied rocks were potentially altered. To document bulk rock chemical modifications, mass balance and alteration indices were calculated on volcanic and LDC samples.
Mass balance calculations were performed by comparing the analyzed rocks to precursors modelled using a neural network based on the rocks’ Ti, Al, Zr, Cr, Th, Nb, and Y contents (for a detailed description of this method, refer to Trépanier and collaborators [33]). This method applies only to rocks having a predictable chemistry (i.e., igneous rocks) well represented in the dataset used to train the neural network [45]. Because the Fe-enriched LDC rocks are unrepresented in this dataset, this mass balance method was only applied to volcanic rocks (samples MS17-14, -20). Results of these calculations are presented as absolute mass changes (Table 5).
The LDC rocks are displayed on triangular diagrams (Figure 9g,h) that will be used to discuss alteration trends. As magnetite is a resistant mineral, only the destabilization of silicates will be considered, using elements (Si, Ca, Na, and K) accommodated by feldspar and pyroxene. Al and Mg are also considered, even if they may have been incorporated by spinel during the crystallization of titanomagnetite.
The CONSONORM_LG method [33] mentioned previously includes the ALT_CARBS index that quantifies carbonatisation. The method was applied to the six samples analyzed for whole rock composition (Table 1), using the 2SV350 model and a normative estimate of CO2. A Fe2O3/Fe2O3T ratio of 0.2 was used to model the ferric and ferrous iron of the volcanic rocks, following recommendations made in the literature [46]. For the LDC rocks, the ratio was adjusted so that the proportion of normative magnetite approximated the amount of observed magnetite, and a Fe2O3/Fe2O3T ratio of 0.6 was used (Table 1).

6.2. Results of the Quantification of Hydrothermal Alteration

The global mass changes, as estimated by the modelled precursor method [45], point to mass gain being most pronounced for sample MS17-14 (Table 5). Individual mass changes within ±1 g (and ±10 g for SiO2) per 100 g of precursor fall within the method’s error and are considered negligible [47]. The volcanic rocks gained Fe and Mg and lost Ca (Table 5). Also, the precursors modelled using this method have the composition of basalts when plotted within the total alkali-silicate diagram [48]. The results of normative calculation (CONSONORM_LG method) points to negligible carbonatization (ALT_CARBS <4) in volcanic and LDC rocks (Table 1).
The distribution of the company dataset on the triangular diagrams is now considered (Figure 9g,h). If hydrothermal alteration was negligible, then the magmatic minerals were olivine, pyroxene, and ±feldspar, and excess Al-Mg was accommodated by spinel (Figure 9g,h). If chloritization occurred (i.e., main alteration type that induces Mg-gains), then chlorite would have formed at the expense of feldspar. In this hypothesis, and if the magmatic rock contained abundant feldspar, chloritization may have induced Mg-gains and Ca-Na-K-losses. There is, however, no textural evidences for magmatic feldspars. In addition, chloritization does not induce Si-losses (see chloritization of a plagioclase-bearing rock; Equation (1) and this process fails to explain the Si-poor nature of the rocks.
0.75   CaAl 2 Si 2 O 8 + 0.5   NaAlSi 3 O 8 + 5   Mg 2 + + 8   H 2 O = Mg 5 Al 2 Si 3 O 10 ( OH ) 8 + 0.75   Ca 2 + + 0.5   Na + + 8   H + anorthite albite fluid = chlorite fluid

7. Discussion

The studied rocks have been metamorphosed, deformed, and possibly altered by a nearby hydrothermal system (Central Camp Cu-Au porphyry-style deposits). The first part of the discussion evaluates the impact that these processes had on the chemistry and mineralogy of the studied area. The second part of the discussion evaluates the usefulness of magnetite-chemistry in a metamorphosed context. Eventually, a model for the magmatic evolution of the layered zone of the NE limb of the LDC is proposed.

7.1. Metamorphism

The LDC is metamorphosed to greenschist conditions (western portion, likely including the study area) to amphibolite (eastern portion) facies. The main silicates observed (serpentine, brucite or talc, chlorite, ±actinolite) are typical of low-grade metamorphism of ultramafic rocks [49].
Magmatic textures are preserved in the olivine-enriched zones, where the outline of the olivine grains, pseudomorphed by serpentine and brucite, are mantled by thin inclusion-free magnetites. The shape of the former olivine grains suggests that the pre-metamorphism rocks had equigranular textures and contained olivines with 120° grain boundaries. Other inclusion-free magnetites mantle inclusion-bearing magnetite grains. The inclusion-free magnetites likely formed from the iron expelled from the structure of the olivine during metamorphism (Equation (2)), while serpentine and brucite formed after forsterite (Equation (3); modified from [49]) and talc formed using the Si and Mg expelled, respectively, from the structure of fayalite and forsterite.
3   Fe 2 Si O 4 + 2   H 2 O = 2   Fe 3 O 4 + 3   SiO 2 + 2   H 2 , fayalite fluid magnetite fluid
3   Mg 2 Si O 4 + 4.5   H 2 O = 1.5   Mg 3 Si 2 O 5 ( OH ) 4 + 1.5   Mg ( OH ) 2 , forsterite fluid serpentine brucite
The inclusion-bearing magnetite grains contain ilmenite, chlorite, and pleonaste. As olivine is an Al- and Ti-poor mineral, the inclusion-bearing magnetites are unlikely to be derived from fayalite. These magnetites have irregular outlines (Figure 5d) and grains that merged during metamorphism (Figure 7a), which indicates that the inclusion-bearing magnetites are recrystallized magmatic titanomagnetites. Recrystallization is most intense in local shear zones, where size-reduced magnetite grains with well-developed triple junctions, as well as magnetite-hosted and external granular ilmenite, are observed (Figure 7b,c and Figure 8d,e).
The pre-metamorphism morphology of the magnetite grains may have been polygonal, with 120° grain boundaries similar to those inferred for the olivine grains (Figure 7a). This is typical of textural equilibration in cumulate rocks [50,51]. The texture likely developed prior to the metamorphic event and was accompanied by sub-solidus oxidation that formed the ilmenite exsolutions with sandwich-type textures as well as magnetite-hosted granular textures [40]. These textures may have been caused by annealing, a process frequently observed in large intrusions [52]. Given the poor preservation of the texture of intercumulus phases, the proportion of trapped liquid is not estimated, and questions remain on the nature of the cumulate (ad-, meso-, or ortho-cumulate?).
In the serpentine-enriched areas, the ratio between serpentine and inclusion-free magnetite is elevated (≥90%) (Figure 5a). The proportion of inclusion-free magnetite that mantles the inclusion-bearing magnetite is harder to estimate, as both magnetites have similar Cr and V contents (Figure 6d,e). The proportion of metamorphic magnetite is imprecisely estimated to <10–20% of total magnetite in most samples, to up to 30% in sample MS17-31 (Figure 6a,b), which has been recrystallized in a local shear zone (Figure 4c). These minor amounts of secondary magnetite indicate that the initial fayalite content of the olivine was low.
The proportion of forsterite and fayalite is estimated using Equations (2) and (3) and assuming: (1) 4–8 wt % secondary magnetite (i.e., 10 to 20% out of a total of ~40% magnetite); and (2) 40 wt % serpentine + brucite + talc (e.g., interval 0 to 50 m downhole; Figure 3). According to this calculation, the magmatic rocks likely contained 5.3 to 10.6 wt % fayalite, 33.6 wt % forsterite and 0.3 to 0.6 wt % SiO2 was produced by fayalite destruction. This gives a forsterite number (Fo# = Mg/(Mg + Fe) molar) of about 0.82–0.90 (Fo82–90). The serpentine-rich samples correspond to metamorphosed magnetite-forsterite-dominated rocks (ferrodunite). Also, the amount of SiO2 (produced by fayalite destruction) that could have been washed out by metamorphic fluids is limited (<1 wt % SiO2). The Si-poor nature of the studied rocks is thus a pre-metamorphism feature.
The Ni-content of the olivine is hard to reconstruct, as this element may have diffused toward the magnetite during metamorphism. However, the Ni-content of the magnetite is relatively low (<100 ppm; Table 2) and the metamorphic silicates contain minimal Ni (Table 3), suggesting that the olivine of the studied area was Ni-depleted compared to olivines having similar Mg# observed in other contexts [53].
A part of the observed chlorite is located in and around the magnetite grains and chlorite is the dominant Al-bearing inclusion observed in the magnetite of the NE limb. By contrast, the magnetite of the S limb contains Al-bearing oxides, including a significant amount (average of ~2.6 vol %) of pleonaste exsolutions [3]. In the S limb, Al exsolved with Mg and Zn and diffused to form Al-spinel exsolutions at the interface between ilmenite exsolutions and magnetite [3]. A similar process is postulated in the NE limb. The oriented chlorite observed in magnetite (Figure 8a,b) likely replaced pleonaste exsolutions during metamorphism.
In summary, the magmatic assemblage included magnetite and an olivine with elevated Mg-content (Fo82–90). These pre-metamorphism rocks also contained < 1 to up to 5 vol % of apatite (Table 4). Magnetite crystallization lowers the solubility of P in basaltic melts [54,55], which likely induced apatite crystallization in the studied area. Textural evidence for the presence of other silicates (i.e., feldspar and pyroxene) are lacking. However, the chlorite- and/or serpentine-bearing ‘patches’ observed in parts of the LDC rocks (Figure 3) may correspond to metamorphosed pyroxene oikocrysts; i.e., poikilitic pyroxenes with olivine inclusions. Oikocrysts crystallize from the intercumulus melt in permeable crystal mushes, even if alternative hypotheses have been proposed [56,57]. Their presence confirms the cumulus nature of the olivine and the occurrence of intercumulus pyroxene. The mafic ‘patches’ are occasionally rimmed by actinolite. This feature points to Ca-bearing pyroxene oikocrysts in a portion of the LDC rocks. Alternatively, the Ca of the actinolite may come from interstitial feldspar, of which, as for pyroxene, textural evidences have been obliterated by metamorphism.

7.2. Deformation

The LDC is folded and, in the studied area, small amplitude folds may be present [4] and faults are abundant (Figure 1). As a consequence of deformation, the MS-13-17 drill hole contains several fractured areas (broken-up core) and local shear zones with well recrystallized magnetite (Figure 4c and Figure 7b,c).
Of particular interest is the magnetitite unit (320 to 335 m downhole) located at the contact zone between the LDC rocks and their volcanic host: is this a primary magmatic contact or did deformation displace a portion of the upper units of the LDC? In the magnetite rocks, pyrrhotite partially replaced magnetite during sulphidation. Chalcopyrite has been preferentially remobilized into chlorite- and amphibole-bearing veins, pointing to successive or long-lasting hydrothermal events.
The small size of the magnetite grains (Figure 7e and Figure 8d) may reflect shearing-related grain-size reduction. The magnetites are also depleted in trace elements (including V) and their chemistry contrasts strongly with that of the other magnetites (Figure 12 and Figure 13). These magnetites have likely been extensively recrystallized and modified by circulating fluids. They may correspond to hydrothermal magnetites, which explain their low V-content (V is not a fluid-mobile element). The V-depleted nature of the contact zone magnetites is unlikely to be a magmatic feature.
The LDC contact area is a discontinuity that may have concentrated shear movements and channeled hydrothermal fluids. As a consequence, the magnetitite unit is strongly altered and deformed and lost its magmatic texture and chemistry. Also, because of the sheared nature of the LDC contact, LDC marginal units may be missing in the studied area.

7.3. Hydrothermal Alteration

The studied rocks (NE limb) are Mg-rich and are depleted in Si, Ca and alkalis compared to the layered zones of the S and NW limbs. These differences may result from complete modification of the NE limb by a hydrothermal event, as suggested by Dorr [4]. As discussed in this section, this hypothesis is not supported by the data.
The studied area is located ~15 km east of a cluster of Cu-Au porphyry-style deposits (Central Camp). The hydrothermal system has induced sulphidation, carbonatization, silicification, chloritization, and sericitisation in anorthosite rocks of the LDC [1,13]. Sericitisation is an acidic process that destroys feldspar and forms clay minerals or white mica. The studied layered zone lacks evidences of this process. Silicification is also unlikely in the Si-depleted rocks of the NE limb.
Chloritisation destabilizes feldspars (loss of Ca, Na, and K) and forms chlorite (gains of Mg and/or Fe). Intense chloritization is restricted to a few centimeters around the mineralized fractures of the Central Camp [6,7] and is unlikely in the Mt. Sorcerer area. Even if an undocumented hydrothermal system induced intense chloritization in the layered zone, the process would have replaced feldspar by chlorite (Equation (1)). In the studied rocks however, chlorite replaces pleonaste exsolutions and pyroxenes: chlorite did not form at the expense of feldspar. In addition, chloritization does not produce serpentine (Figure 3). This type of alteration is unlikely in the studied area.
The studied LDC rocks contain carbonate veins with amphibole-bearing alteration halos. These minerals point to carbonatization; i.e., additions of CO2 and possibly Ca. The studied rocks contain <2% carbonate (Table 4) and the ALT_CARBS index is <4% (Table 1), which point to negligible carbonatization. In addition, the low sulfide abundance (<1 vol % of pyrrhotite and ±chalcopyrite; Table 1) suggests moderate sulphidation. Hydrothermal processes formed pyrite and chalcopyrite in the Central Camp, and the pyrrhotite observed in the Mt. Sorcerer area may correspond to metamorphosed pyrite.
Alternatively, the sulfides observed in the studied rocks may have a magmatic origin. Disseminated magmatic sulfides are common in mafic intrusions, where the assemblages are dominated by pyrrhotite, pentlandite, and chalcopyrite, or by pyrrhotite and chalcopyrite in the evolved (Ni-poor) parts of magma chambers [58]. However, sulfides are rare in the layered zone (e.g., no sulfide reported by [1,3]), and a hydrothermal origin for the disseminated sulfides and for the sulfide micro-inclusions observed in magnetite is favored.
The bulk chemical composition of the studied rocks is unlikely to have been significantly modified by hydrothermal alteration. The layered zone is thus laterally heterogeneous. In the NW and S limbs, the layered zone is made of a rhythmical succession of magnetitite and magnetite-bearing anorthosite and gabbro [3]. In the NE limb, it is a relatively massive zone made, prior metamorphism, of ~40–50% magnetite (Figure 3), forsterite, ±pyroxene (clinopyroxene possibly), and ±feldspar (Figure 9g,h). The NE limb layered zone is made of metamorphosed ferrodunite, ferrowherlite (if the main pyroxene was clinopyroxene), and possibly olivine ferrogabbro (if plagioclase was present).

7.4. Hosting Rocks

The volcanic rocks that host the LDC are relevant to this study because they may have been assimilated by the magma of the NE limb layered zone. The nature and chemistry of these rocks is discussed in this section.
The host rocks are basalts in drill hole MS-13-17 (335–600 m downhole). Most of the studied volcanic rocks display assemblages expected in mafic rocks metamorphosed to greenschist conditions; i.e., chlorite–actinolite–albite–epidote [49]. The rocks in contact with massive to semi-massive sulfides are different and are dominated by chlorite and quartz (samples MS17-07, -08; Table 4) that suggest intense chloritization and silicification. These two types of alteration are frequently noted in VMS systems [59,60,61]. In addition, the disseminated sulfides and carbonate-bearing veins point to moderate sulphidation and carbonatization.
Mass balance calculations performed using the bulk composition of samples MS17-14 and -20 (Table 5) point to Ca-losses and Fe–Mg-gains. Such mass changes were likely induced by chloritization. By comparing with calculations performed on the Coulon VMS [62], the measured mass changes (Fe + Mg > 2–5 g per 100 g of precursor) correspond to moderate to intense chloritization.
The alteration minerals observed in volcanic rocks are likely related to syn-Waconichi Formation and David Member volcanogenic (VMS) systems. In the studied area, potential contaminants for the LDC magma are massive to semi-massive sulfides, as well as basalts and chloritized basalts. Additional contaminants are carbonate-rich rocks of the Lac Sauvage Formation (Figure 1).

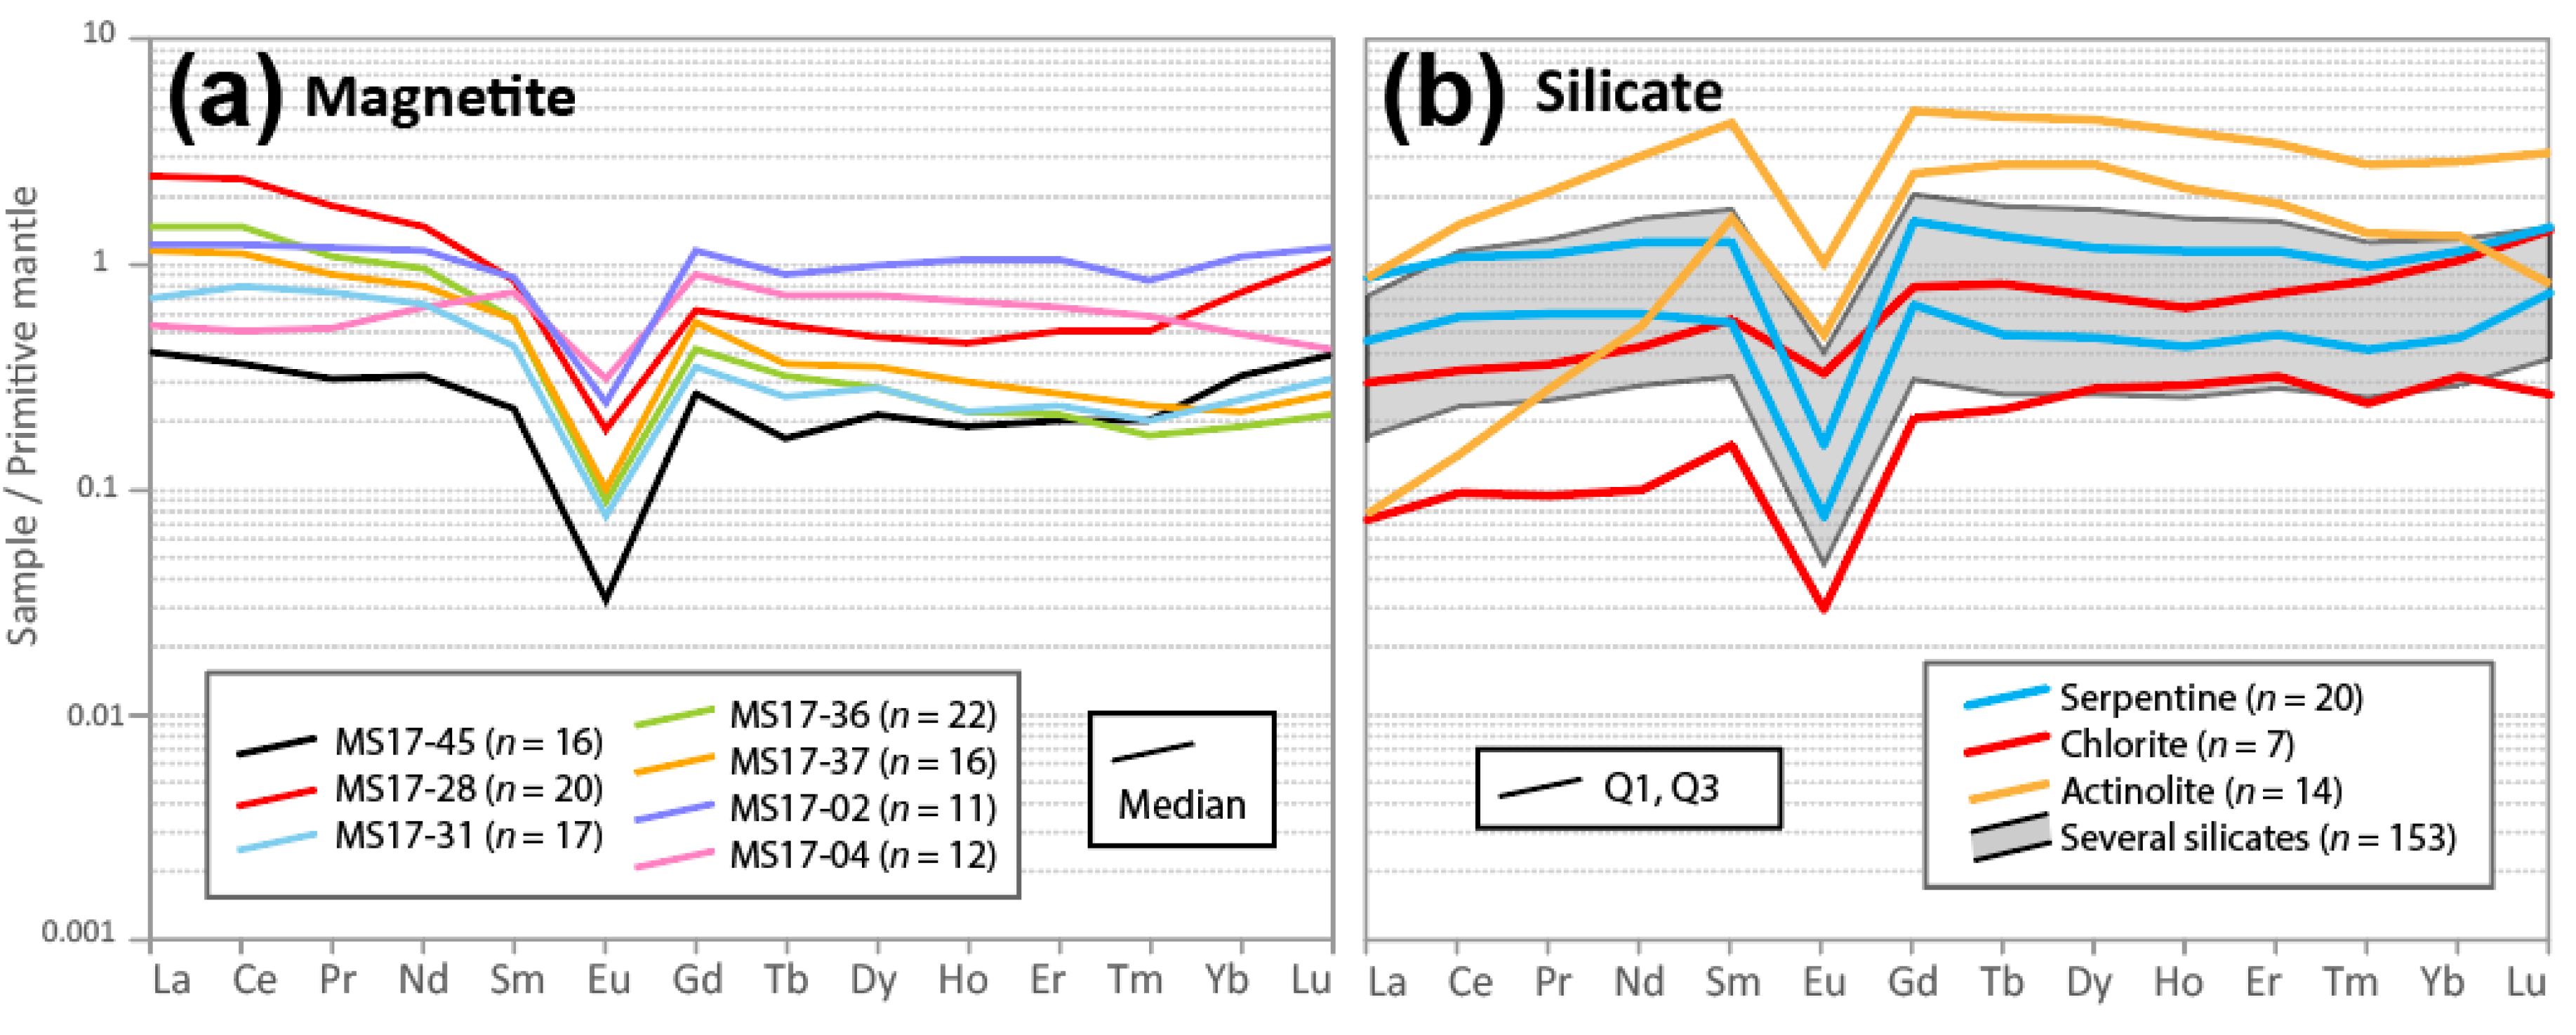
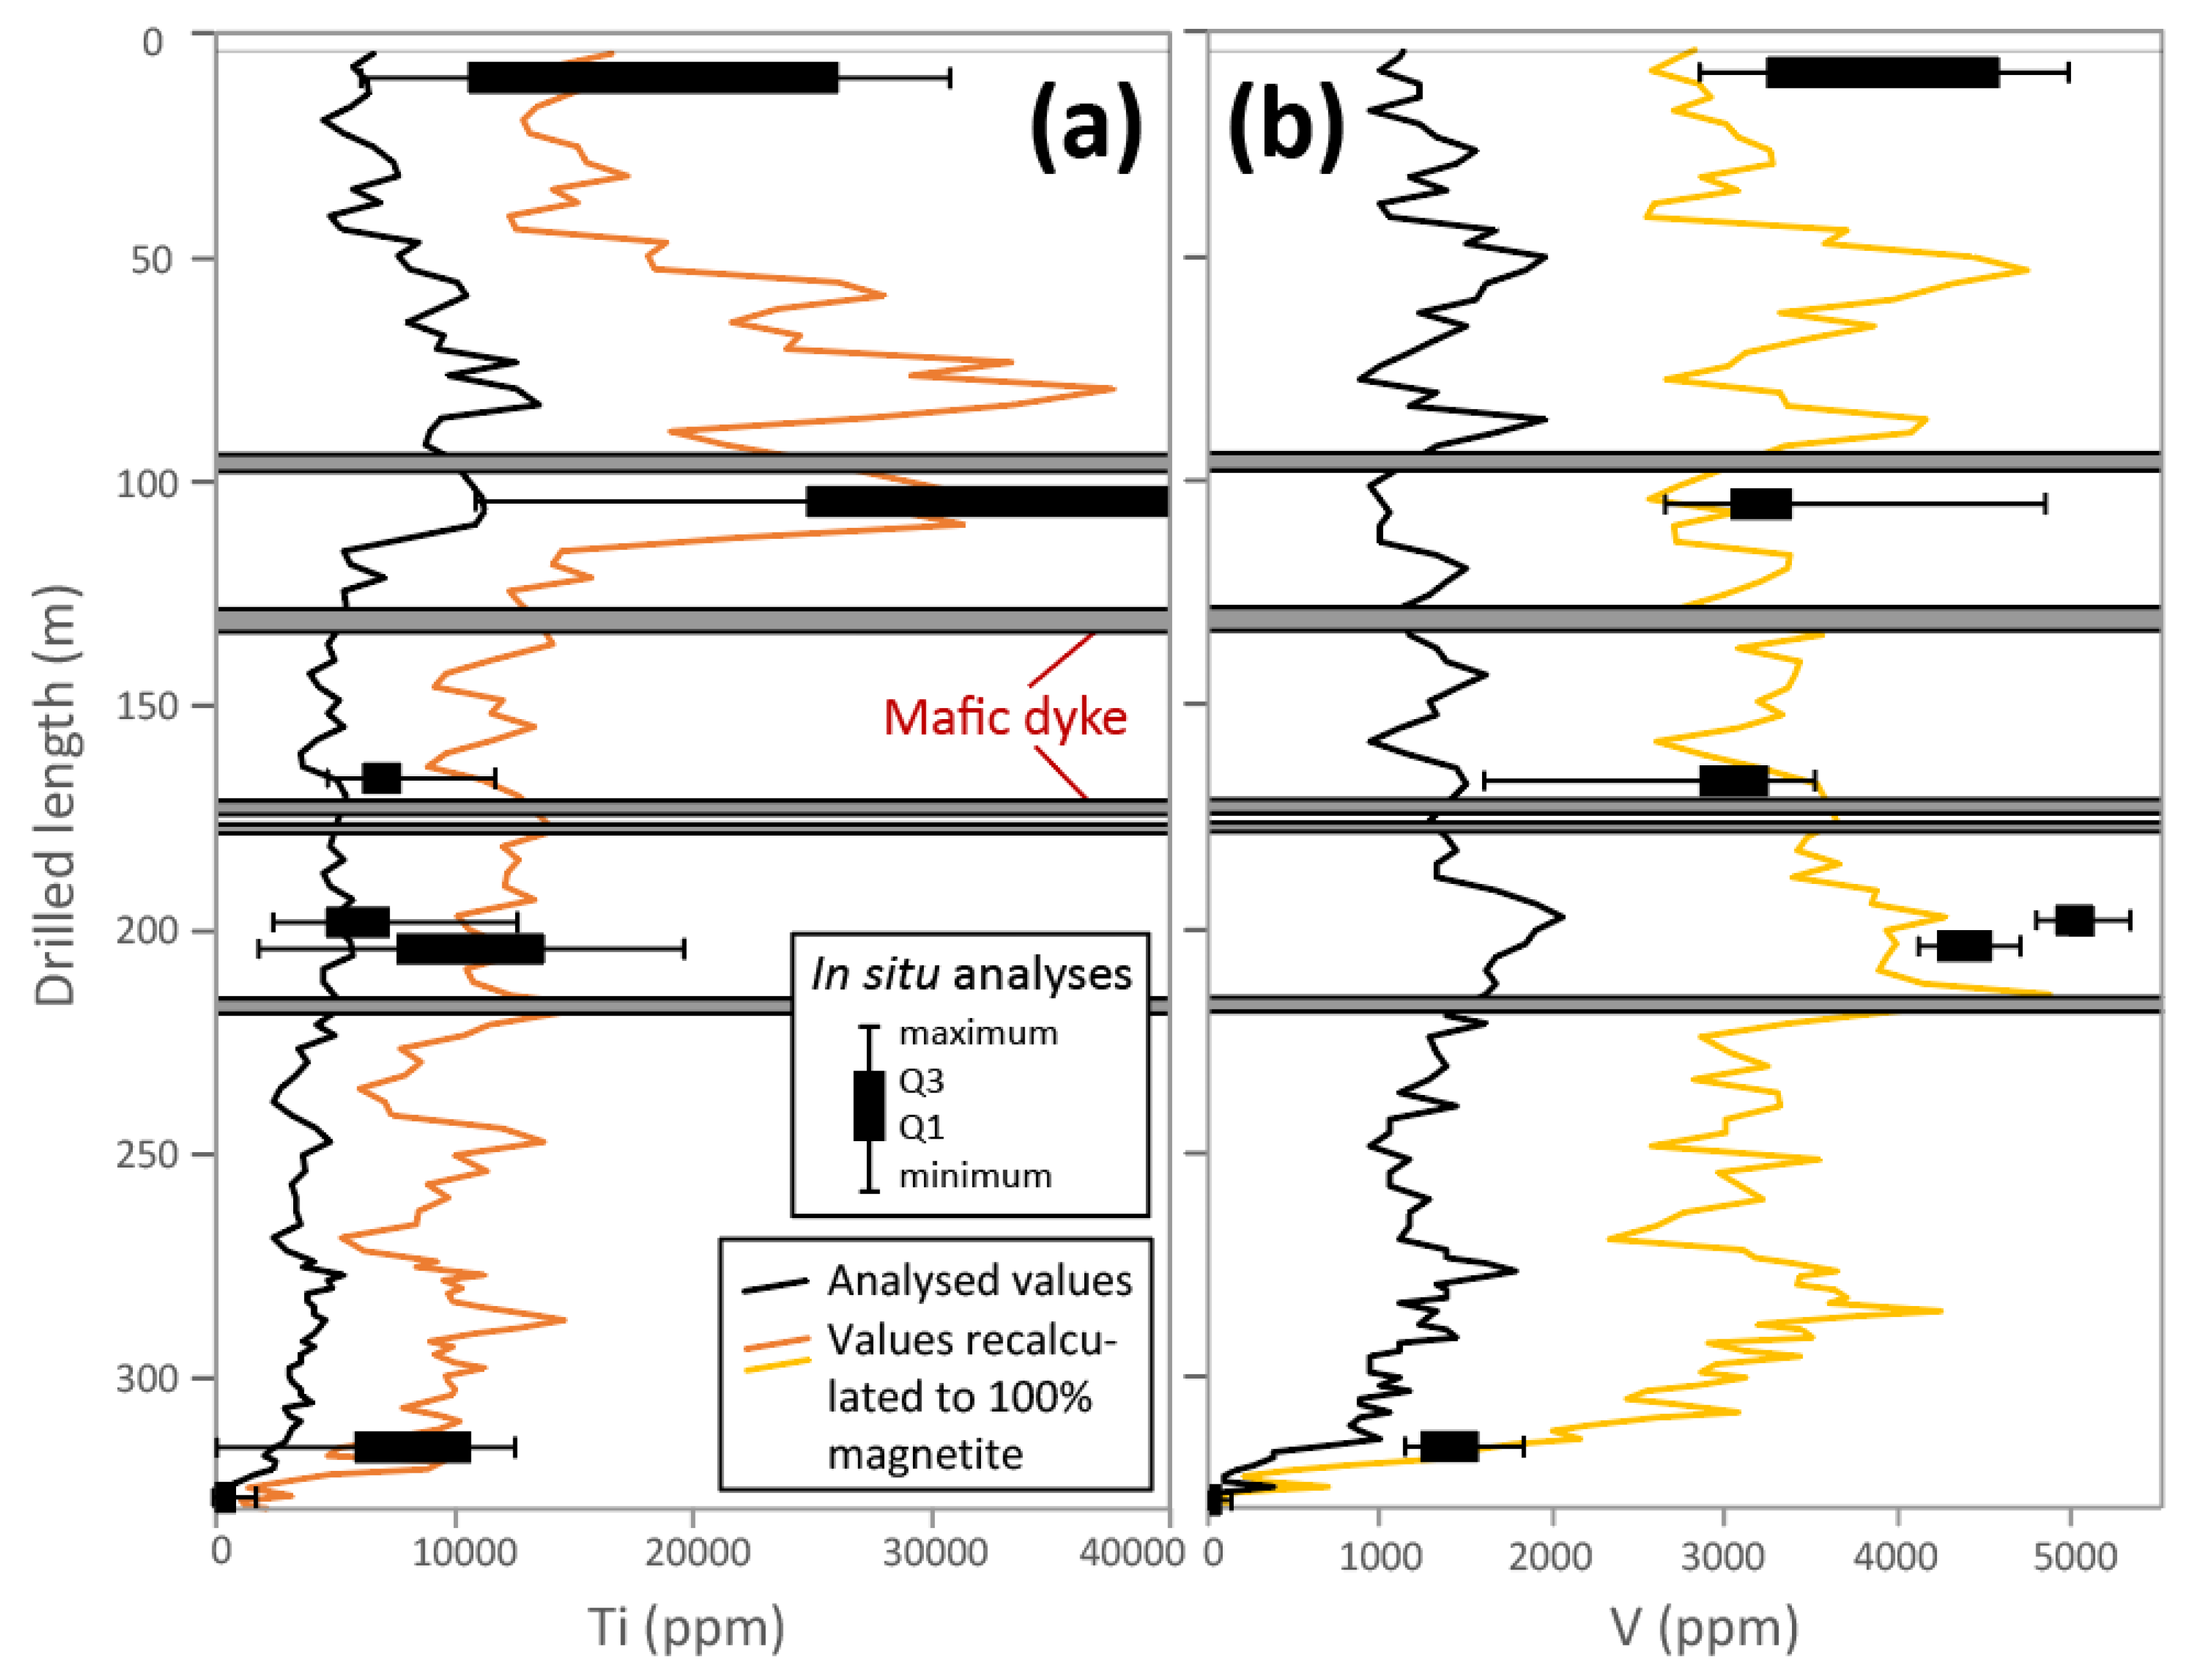
7.5. Magnetite Chemistry

To use magnetite as a petrogenetic indicator, an answer to the following question must be provided: do the in situ analyses reflect the composition of the magmatic magnetite? To address this point, the trace element content of this mineral is discussed in this section. After discussing the distribution of trace elements, the discussion will focus on elements (Cr and V) controlled mostly by the fractionation of oxides in magmas and that are useful indicators of magmatic processes [63,64,65].
Titanomagnetite likely oxy-exsolved to magnetite and ilmenite during the cooling of the LDC, as is generally observed in magmatic contexts [40,66]. As a result, Ti has a nugget distribution (Figure 11) and estimating the initial Ti-content of the titanomagnetite using in situ analyses is challenging; however, it can be estimated by recalculating the whole rock Ti-content to 100% magnetite (using the proportion of magnetite determined by SATMAGAN; Figure 15a). This indicates that the titanomagnetite likely contained ~9000–10,000 ppm Ti, which is comparable to the Ti-content of the S limb titanomagnetite [3]. The titanomagnetite of the 50 to 120 interval likely contained a similar amount of Ti, but the recalculation to 100% magnetite is biased by the presence of ilmenite that may originate from primary crystallization (Figure 5d). Primary ilmenite is however rare in the layered zone rocks of the study area (NE limb) and, as a result, these rocks are Ti-poor compared to the rocks of the S limb (Figure 9f).
Al, on the other hand, exsolved with Mg to form pleonaste (now chlorite), explaining the Al-depleted nature of the studied magnetite (Figure 12). As the rocks contained other Al-bearing magmatic minerals (possibly pyroxene and/or feldspar), the initial Al-content of the magnetite cannot be modelled. The in situ analyses are also unlikely to reflect the primary magnetite content in Si, Mn, and Mg that concentrate in Ti-oxides (Mn) and chlorite inclusions (Mg, Si).
A nugget distribution is also observed for Co, Zn (Figure 11), as well as Ni and Cu, which likely concentrate in sulfide micro-inclusions. The studied Fe-enriched units of the LDC are located high in the stratigraphy of the intrusion [1] and may correspond to differentiated magma. In tholeiitic and relatively reduced magmas, sulfide saturation occurs early [67] and an evolved magma such as that of the layered zone is unlikely to retain dissolved sulfur. However, the study area is in contact with sulfide-bearing volcanic material, and assimilation of such rocks may have formed immiscible Fe–S-liquid in the LDC magma. Yet, as the bulk of the studied rocks contain disseminated pyrrhotite ±chalcopyrite and as these rocks are located next to a Cu–Au porphyry-style mineralization, the sulfide micro-inclusions observed in magnetite likely formed due to the circulation of the Central Camp hydrothermal fluids.
Whether the circulating S-bearing fluids redistributed chalcophile elements within the magnetite or brought additional metals is hard to assess, and the initial Co, Zn, Ni, and Cu content of the magnetite remains uncertain. Among the other elements most compatible with magnetite (Figure 12), Zr and Hf also display a nugget distribution (Figure 11), Nb concentrates in ilmenite, and the distribution of Ca and P is controlled by apatite (Figure 11). The Zr, Hf, Nb, Ca, and P content of the magmatic titanomagnetite cannot be modelled with confidence.
The REE, on the other hand, have similar profiles in magnetite and silicates (Figure 13). PCA shows that REE, Al, Mg, and Si make a maximum contribution to the first principal component (PC1). The REE may thus be controlled by the chlorite or other inclusions observed in the magnetite (Figure 11). Given the extent of magnetite recrystallization, it is assumed that the observed REE profiles are unlikely to reflect those of the magmatic magnetite.
The PCA discriminates remarkably the elements concentrated by sulfide, ilmenite and chlorite, and shows that the distribution of Cr and V in the magnetite is not controlled by these inclusions (Figure 13b). Cr and V have a homogeneous distribution in this mineral (Figure 11) and their concentrations match those measured in other magnetites from layered complexes (Figure 12). In addition, both Cr and V are relatively immobile in fluids [68]. The magnetite content in Cr and V may thus have been little modified by post-magmatic processes. A similar conclusion was reached for the magnetites of the Bell River complex [69], a layered intrusion located in the northern part of the Abitibi Subprovince of similar age, geodynamic setting and metamorphic history as the LDC.
In the LDC, the Cr-content of the magnetite and bulk rocks is low (<100–200 ppm; Table 2), which is in agreement with the proposed evolved nature [1] of the Fe-enriched units of the LDC. The magnetites of the study area (NE limb) are Cr-poor compared to the magnetites of the S limb, which contain > 250 ppm Cr [3]. The studied magnetite is enriched in V and the V-contents of inclusion-bearing and inclusion-free magnetites are similar (Figure 6e). As the inclusion-free magnetite likely originates from the metamorphic decomposition of fayalite (Equation (2)), and as olivine is a V-poor mineral [70], the V contained in the magmatic magnetite may have integrated the structure of the secondary magnetite overgrowths during metamorphism (Figure 6d,e). The diluting effect of this process on the V-content of magnetite is likely limited because the rocks contained < 10% fayalite (see previous sections).
To approximate the V-content of the magmatic magnetite, the bulk rock V concentration is recalculated to 100% magnetite measured by SATMAGAN (Figure 15b). The recalculated V values are similar to the magnetite V-content determined with in situ analyses (box plots on Figure 15b). Only sample MS17-45 contains more V than the recalculated analysis, which likely reflects a small-scale heterogeneous V-distribution (i.e., <3 m, which corresponds to the length of the samples of the company dataset).
The recalculation to 100% magnetite indicates that the magmatic titanomagnetite may have contained ~2500–3500 to up to 5000 ppm V (Figure 15b). These values are comparable to the V-content of 98 magnetite concentrates (median = 6610, standard deviation = 1900 ppm V) performed on rocks from the S limb, and reported by Allard [1]. These values are lower to these reported from in situ measurements of S limb titanomagnetite, which contain 3000–7000 and up to 10,000 ppm V [3].

7.6. V-Content of Magnetite

V is abundant and substitutes for Fe in magnetite. The distribution of V in magnetite is undisturbed by exsolutions and inclusions (Figure 6). V is likely the best petrogenetic indicator available in the study area. However, prior to discussing the V-content of the magnetite, we must consider factors that may have modified the concentration of this element.
An important factor that generally modifies the chemistry of cumulate minerals corresponds to the trapped liquid shift; i.e., the reaction between the minerals and the trapped residual melt [71]. However, as V is strongly compatible in the magnetite [70,72], and given the large amount of magnetite crystallized in the study area (Figure 3), any trapped liquid would have been V- and Fe-depleted. Its reaction with the cumulate magnetite may have had a limited effect on the mean V-content of this mineral.
Another factor that may have modified the V-content of the magnetite corresponds to fluid circulation. As indicated previously, V is a relatively immobile element but, within 15 m of the contact between the LDC and its hosting material, fluids have leached trace elements, V included, from the magnetite (see previous sections). However, even if several shear zones are observed in drill hole MS-13-17, most of the LDC rocks do not display evidence of either strong hydrothermal alteration or trace elements leaching from the structure of the magnetite. Structural complications (e.g., unit repetition) are, however, possible in the study area.
In summary, the modelled V-content of the magnetite (Figure 15b) is likely representative of that of the magmatic magnetite. The bulk rock V-content (black line on Figure 15b) of the studied area is homogeneous. The V-content of the magnetite (orange line on Figure 15b), however, is variable. The cryptic variations (<5 m thick along the drill hole) are within 1000 ppm V. They could reflect primary (magmatic) small-scale modal layering. These small amplitude variations may also reflect local fO2 fluctuations during crystallization, as the partitioning coefficient of V (DV) in magnetite and olivine is mostly dependent on fO2 [72,73].
Larger-scale (~100 m thick along the drill hole) variations of the V-content of the magnetite are also observed (Figure 15b). The V-content of magnetite decreases up stratigraphically from 5000 ppm to 3000 ppm (50 to ~180–200 m downhole interval), from 2500–3000 ppm to 4000–5000 ppm (200–270 m interval), and from 2500–4000 ppm (270–320 m interval) (Figure 15b). As indicated previously, structural repetition cannot be ruled out completely, but the variation of the V-content of the magnetite may also correspond to reversals related to episodic influx of magma [2,65,74,75,76]. The NE limb layered zone is heterogeneous and is made of: (1) magnetite-forsterite-dominated intervals (ferrodunite; 0–50 m and 200–270 m downhole; Figure 3) as well as pyroxene- and plagioclase-bearing layers (ferrowherlite and olivine ferrogabbro; 50–200 m and 270–320 m downhole); and (2) of one primary ilmenite-bearing and actinolite-bearing layer (olivine ferrogabbro; 50–120 m downhole; Figure 15a). Note that these intervals match the V-reversal intervals.
These heterogeneities are likely the result of at least four injections of evolved basaltic magmas that formed the following intervals: (1) 0–50 m (ferrodunite); (2) 50–200 m (olivine ferrogabbro with primary ilmenite at the base and ferrowherlite at the top); (3) 200–270 m (ferrodunite to ferrowherlite); and (4) 270–320 m (olivine ferrogabbro). The 320–335 m interval (magnetite) has been too intensely deformed and altered to be interpreted. Each pulse may have differentiated and mixed to variable extents with subsequent injections. Each pulse may have evolved under increasing fO2 conditions, enhancing the V reversals (DV in magnetite decreases with increasing fO2 [72]). A similar model has been proposed for the S limb layered zone [3].
The rhythmical succession of magnetitite and silicate-rich rocks that characterizes the S limb [3] is not observed in the NE limb. This compositional layering, in the S limb, is likely the result of density settling and mechanical sorting processes [3]. These processes may not have occurred in the NE limb: (1) because the consolidated unit beneath the NE limb layered zone had a shallow dip that prevented gravity movement of cumulate slurry [75]; or (2) because the NE limb layered zone solidified too rapidly. Deformation prevents paleo-dip estimates. Rapid cooling rates may have been promoted by the presence of oxidizing CO2-bearing fluids (see next section).

7.7. Origin of the Olivine–Magnetite-Enriched Rocks

The studied portion of the LDC has the following characteristics:
  • Evolved characteristics: apatite-bearing unit located in the upper portion of the LDC that contains Ni-poor olivine. The unit is Fe-V-rich and is depleted in Cr and Ti (with ilmenite that originate from primary crystallization only observed in the 50–120 m interval);
  • Primitive characteristics: elevated Mg-content, low Si-content, and Fo82-90 olivine;
  • Multi-injections of magmas that may have solidified at a faster rate than the magmas of the NW and S limbs layered zones.
Magnetite does not usually coexist with poorly evolved olivine, as pointed out by Namur and collaborators [2], who summarized that the first liquidus Fe–Ti-oxides are generally in equilibrium with evolved silicates (e.g., Fo55–56, An45–53, cpx Mg-number 64–75). Exceptions correspond to the Sept-Iles and Panzhihua layered intrusions, where Fe–Ti-oxides crystallized early, at elevated temperatures, and are thus observed next to poorly evolved silicates [2,77]. To explain this early fractionation of Fe–Ti-oxides, it was argued that the compositional factor (magma with high Ti/Ca and Fe/Ca ratio) prevail over particular redox conditions or volatile contents [2,77]. The presence of an oxidizing CO2-rich fluid formed by the assimilation of carbonaceous rocks was; however, not completely excluded by the authors, as oxidizing conditions may favor the crystallization of magnetitite and explain the magnetite layers observed in the Panzhihua intrusion [78,79].
A similar hypothesis is applied to the LDC complex, and it is proposed that the olivine–magnetite-enriched unit formed due to the Fe–Mg-enriched and Si-depleted nature of the magma. The fractionation of this Si-poor magma has already been described by Lapallo [5] using Fe–Mg-Si ternary phase diagrams [80,81,82]. The magma of the NE limb may also have evolved under oxidizing conditions. To discuss this point, the temperature and fO2 conditions of equilibrium between magnetite and ilmenite was calculated using the ILMAT Excel worksheet [83], which implement several geothermometers [84,85,86]. The calculation uses in situ LA-ICP-MS line analyses performed on four pairs of minerals observed in sample MS17-28, which contains the largest ilmenite grains. The in situ analyses were reduced using integrations that encompass entire magnetite and ilmenite grains, exsolutions, and inclusions included (see Supplemental Material S8). Calculated temperatures and fO2 respectively range from 640 to 685 °C and +1.8 to +3.0 (relative to the fayalite-magnetite-quartz buffer; FMQ).
The temperatures are higher than greenschist grade metamorphism and are consistent with conditions of equilibrium upon cooling. The fO2 is much higher than this reported from the Sept-Ile (FMQ −1 to 0 at 650 °C; [3,87]) and Skaergaard (FMQ −1.5 to 0 at >1000 °C; [88]) intrusions. The fO2 is slightly higher that this reported for the Panzhihua intrusion (> FMQ +1.5 at >1000°C; [77]). The NE limb of the LDC may have evolved under high fO2 conditions.
At Sept-Iles and Panzhihua, magnetite crystallized early, i.e., in a poorly evolved magma [2,77]. Other hypotheses have been proposed to explain the reappearance of olivine in the fractionation sequence, in more differentiated magmas, e.g., the interaction of a fluid with a crystal-enriched magma that may produce olivine from the incongruent melting of pyroxene [89]. This hypothesis is not retained here, as little evidence (e.g., absence of pegmatite, Cl-content of apatite unknown, origin of the fluid, etc.) is available to sustain it. Extensive post-cooling hydrothermal modifications [4] are not considered either, as the rocks retain magmatic textures (Figure 5a).
The model proposed here implicates a Fe–Mg-rich and Si–Ca–Al–alkali-poor magma. A first possibility (model #1) is the injection of a poorly evolved Fe-rich magma; however, this hypothesis does not account for the high fO2 conditions and for the evolved characteristics (e.g., Ni–Cr-poor) of the studied unit. Injections of crystal-laden sills, however, may explain the large-scale segmented morphology of the layered zone of the NE limb (Figure 1). Displacement of the olivine- and possibly magnetite-bearing portion of a crystallizing magma located in a deeper magma chamber, as summarized by Marsh [90], may have separated the magma from early crystallized Ni-, Cr-, and Ti-bearing phases and from a part of the residual melt. This separation may have produced a magma that crystallized more olivine and titanomagnetite than theoretical cotectic proportions. This hypothesis requires the early, high temperature, crystallization of Fe–Ti-oxides, as is observed in the Panzhihua intrusion, for example.
Alternatively (model #2), the upper Fe-rich zone of the NE limb (Figure 2) may have formed from a magma similar to that of the other portions of the layered zone (NW and S limbs) that was modified by contamination. In the studied area, potential contaminants are sulfide-bearing (Fe-rich) and chloritised (Al-Mg-rich) volcanic rocks. It is unlikely that an evolved basaltic magma was able to assimilate the large amount of chloritised rocks required to drastically increase the Mg-content of the melt. Assimilation of sulfides would induce reducing conditions that would not favor the crystallization of magnetite + forsterite assemblages. Another potential contaminant is the Lac Sauvage iron formation [1,5]. This formation is documented in the Mt. Sorcerer area (Figure 1) but is not intersected by drill hole MS-13-17. In this drill hole, the contact zone between LDC rocks and basalts is a shear zone and units may have been displaced along the fault plane. The studied portion of the LDC may thus have been in contact with the Lac Sauvage unit prior deformation.
It is proposed that the NE limb layered zone is made of an evolved basaltic magma modified by the assimilation of a carbonate-facies iron formation [1,5]. The assimilation of Ca-carbonate by magma is known to favor the crystallization of clinopyroxene over plagioclase and to induce CO2 degassing and desilicification [91,92]. The assimilation of Ca–Mg-carbonates, on the other hand, favors the formation of olivine [93,94]. The assimilation of the Fe-enriched, Mg-bearing, and Si–Ca-poor rocks of the Lac Sauvage iron formation [19] may thus have desilicified and added Fe–Mg to an already Fe-enriched magma, and favored the formation of Mg-olivine. The formation of oxidizing CO2-bearing fluids may have favored the crystallization of magnetite, as proposed elsewhere [78,79,95]. The presence of a large amount of volatiles may also have promoted fast cooling rates. In this scenario, the segmented morphology of the NE portion of the layered zone (Figure 1) is attributed, at least in part, to structural repetitions. Model #2 (assimilation) is more satisfying because it implies oxidizing conditions, which are required for the crystallization of titanomagnetite and Mg-rich silicates. The consequence for V mineralization is that fast cooling rates may have prevented prolonged magma differentiation and related local V-enrichment. Fast cooling rate also prevented the mechanical sorting of the minerals. This formed a layered zone in which V has a relatively homogeneous spatial distribution.

8. Conclusions

The Lac Doré Complex (LDC) is a metamorphosed Archean layered intrusion located in the NE corner of the Abitibi Subprovince. The upper part of the complex consists of a V-mineralized layered zone composed of magnetite ±pyroxene ±plagioclase- and plagioclase + pyroxene-dominated layers in most of the exposed surface of the complex. In the studied area (NE limb of the LDC), however, the layered zone is made of olivine- (now serpentine) and magnetite-dominated rocks. The upper part of this unit located on the Mt. Sorcerer area (i.e., the upper Fe-rich zone) was investigated to evaluate the origin of the Fe-Mg-rich and Si-poor magma.
Through detailed petrographic and mineral chemistry investigations, it was shown that the studied unit has both evolved (e.g., Ni–Cr-poor, V-rich, apatite-bearing) and primitive (e.g., Fo82-90 olivine, Si-poor) characteristics. Hydrothermal alteration had a negligible effect on the chemistry of the magmatic rocks. Titanomagnetite was recrystallized by sub-solidus and post-magmatic processes (including greenschist facies metamorphism). The V-content of the recrystallized magnetite remained similar to this of the magmatic oxide. The observed V reversals and the poorly developed compositional layering (i.e., 10s of meter thick layers of ferrodunite, ferropyroxenite, and olivine ferrogabbro) are the consequence of episodic magma injections.
Magnetite and forsterite likely crystallized under high fO2 conditions (FMQ + 1.8–3.0). Following the model proposed by Allard and Lapallo [1,5], it is proposed that the Fe-Mg-rich magma of the Mt. Sorcerer area was modified by the assimilation of a carbonate-facies iron formation. The magma solidified rapidly in the presence of oxidizing CO2-bearing fluids. Rapid cooling rates explain the absence, in the NE limb layered zone, of a rhythmical succession of centimetre- to metre-thick magnetitite and silicate-rich rocks that characterize the NW and S limbs layered zones. This rapid cooling rate may also be responsible for the relatively homogeneous distribution of V in the layered zone of the NE limb of the LDC.

Supplementary Materials

The following are available online at https://www.mdpi.com/2076-3263/9/3/110/s1, S1: table—location of half core samples examined (drill hole MS-13-17), S2: graphic—standard GSE-1g (LA-ICP-MS analyses), S3: graphic—standard BC-28 (LA-ICP-MS analyses), S4: graphic—standard Gprob-6 (LA-ICP-MS analyses), S5: graphic—standard UQAC-FeS1 (LA-ICP-MS analyses), S6: table—in situ analyses performed on silicates, S7: table—in situ analyses performed on magnetite, S8: table—temperature and fO2 conditions of equilibrium between magnetite and ilmenite, S9: images—proportions (vol%) of minerals observed in thin section, S10: images—LA-ICP-MS map (all the elements) for sample MS17-37.

Funding

This project was funded by a UQAC start-up fund.

Acknowledgments

Many thanks to J. Mungall, G.O. Allard, J.C. Duchesne, and to anonymous reviewers who commented an early version of this manuscript. Special thanks are addressed to Vanadium One Energy Corp, Chibougamau Independent Mine, and Forage Chibougamau for permitting access to their drill cores, as well as many thanks to P.-J. Lafleur and J. Priestner. Also, A. Ben Ayad, P. Houle, C. Larouche, and F. Leclerc are thanked for stimulating discussions regarding the LDC and the Chibougamau area. Warm thanks are also given to A. Lavoie and D. Savard for helping with the LA-ICP-MS analyses, and to A. Ferland for SEM analyses. This is Metal Earth contribution number MERC-ME-2019-148.

Conflicts of Interest

The author declares no conflict of interest.

References

  1. Allard, G.O. Doré Lake Complex and its Importance to Chibougamau Geology and Metallogeny, Québec; MERN report DP-386; Ministère des richesses naturelles: Peterboroyugh, Canada, 1976. [Google Scholar]
  2. Namur, O.; Charlier, B.; Toplis, M.J.; Higgins, M.D.; Liégeois, J.-P.; Vander Auwera, J. Crystallization sequence and magma chamber processes in the ferrobasaltic Sept Iles layered intrusion, Canada. J. Petrol. 2010, 51, 1203–1236. [Google Scholar] [CrossRef]
  3. Arguin, J.-P.; Pagé, P.; Barnes, S.-J.; Girard, R.; Duran, C. An Integrated Model for Ilmenite, Al-Spinel, and Corundum Exsolutions in Titanomagnetite from Oxide-Rich Layers of the Lac Doré Complex (Québec, Canada). Minerals 2018, 8, 476. [Google Scholar] [CrossRef]
  4. Dorr, A. Magnetite Deposits in the Northern Part of the Doré Lake Complex, Chibougamau District, Québec. Master’s thesis, McGill University, Montréal, QC, Canada, 1969. [Google Scholar]
  5. Lapallo, C.M. Petrographic and Geochemical Relations between the Rocks on the North and South Limbs of the Chibougamau Anticline: Assimilation of Roof Rocks, Crystallization and Residual Liquid Compositions in the Dore Lake Complex, Quebec, Canada. Master’s Thesis, University of Georgia, Athens, GA, USA, 1988. [Google Scholar]
  6. Pilote, P. Le camp minier de Chibougamau et le parautochtone grenvillien: Métallogénie, métamorphisme et aspects structuraux. In Proceedings of the Livret-guide d’excursion B1; Joined anual meeting, Geological Association of Canada—Mineralogical Association of Canada (GAC-MAC), Montréal, QC, Canada, 12–14 May 2006; p. 138. [Google Scholar]
  7. Pilote, P.; Robert, F.; Kirkham, R.; Daigneault, R.; Sinclair, W.D. Minéralisation de type porphyrique et filonienne dans le Complexe du lac Doré - le secteur du lac Clark et de l’île Merrill. In Géologie et Métallogénie du District Minier de Chapais-Chibougamau: Nouvelle Vision du Potentiel de Découverte; Pilote, P., Ed.; MERN report DV 98-03; Ministère des Ressources naturelles du Québec: Québec, QC, Canada, 1998; pp. 71–90. [Google Scholar]
  8. Daigneault, R.; Allard, G.O. Le Complexe du Lac Doré et Son Environnement Géologique (Région de Chibougamau-Sous-Province de l’Abitibi); MERN report MM-89-03; Ministère des Ressources naturelles du Québec: Québec, QC, Canada, 1990; ISBN 2551123313. [Google Scholar]
  9. Polat, A.; Frei, R.; Longstaffe, F.J.; Woods, R. Petrogenetic and geodynamic origin of the Neoarchean Doré Lake Complex, Abitibi subprovince, Superior Province, Canada. Int. J. Earth Sci. 2018, 107, 811–843. [Google Scholar] [CrossRef]
  10. Leclerc, F.; Roy, P.; Pilote, P.; Bédard, J.H.; Harris, L.B.; McNicoll, V.J.; van Breemen, O.; David, J.; Goulet, N. Géologie de la Région de Chibougamau; MERN report RG 2015-03; Ministère des Ressources naturelles du Québec: Québec, QC, Canada, 2017. [Google Scholar]
  11. Mercier-Langevin, P.; Lafrance, B.; Bécu, V.; Dubé, B.; Kjarsgaard, I.; Guha, J. The Lemoine auriferous volcanogenic massive sulfide deposit, Chibougamau camp, Abitibi greenstone belt, Quebec, Canada: Geology and genesis. Econ. Geol. 2014, 109, 231–269. [Google Scholar] [CrossRef]
  12. Mortensen, J.K. U–Pb geochronology of the eastern Abitibi subprovince. Part 1: Chibougamau–Matagami–Joutel region. Can. J. Earth Sci. 1993, 30, 11–28. [Google Scholar] [CrossRef]
  13. Moritz, H.W. Muscovite-Paragonite Relationships in Altered and Mineralized Meta-anorthosite at Chibougamau, Quebec. Master’s Thesis, University of Georgia, Athens, GA, USA, 1975. [Google Scholar]
  14. Rivers, T.; Martignole, J.; Gower, C.F.; Davidson, A. New tectonic divisions of the Grenville Province, southeast Canadian Shield. Tectonics 1989, 8, 63–84. [Google Scholar] [CrossRef]
  15. Allard, G.O.; Caty, J.L. Géologie du Quart Nordest et D’une Partie du Quart Sud-est du Canton de Lemoine, Comtés d’Abitibi-Est et de Roberval; MERN report RP-566; Ministère des Ressources naturelles du Québec: Québec, QC, Canada, 1969. [Google Scholar]
  16. Taner, M.F.; Ercit, T.S.; Gault, R.A. Vanadium-bearing magnetite from the Matagami and Chibougamau mining districts, Abitibi, Quebec, Canada. Explor. Min. Geol. 1998, 7, 299–311. [Google Scholar]
  17. Arguin, J.-P.; Pagé, P.; Girard, R.; Barnes, S.-J. The spatial variation of mineralogy in the vanadiferous magnetite deposit of the Lac Doré Complex (Chibougamau, Québec) and its implications on the chemical purity of magnetite concentrates. In Proceedings of the 14th SGA Biennial Meeting 2017, the Mineral Resources to Discover, Quebec, QC, Canada, 20–23 August 2017; Volume 4, pp. 247–250. [Google Scholar]
  18. Baskin, G.D. The Petrology and Chemistry of a Portion of the North Limb of the Dore Lake Complex, Chibougamau, Québec, Canada. Master’s Thesis, University of Georgia, Athens, GA, USA, 1975. [Google Scholar]
  19. Henry, R.L. The Lac Sauvage Volcanogenic Iron Formation near Chibougamau, Quebec, Canada: Its Petrology, Geochemistry, Stratigraphy, Structure, and Economic Significance. Master’s Thesis, University of Georgia, Athens, GA, USA, 1978. [Google Scholar]
  20. Leblanc, M.; Larouche, C.P. Project: Mont Sorcier—Report of the Limited Surface Diamond Drilling Campaign Carried Out during the Period of August 29th to October 30th, 2013; Report GM-68458; Mines Indépendantes Chibougamau Inc.: Chibougamau, QC, Canada, 2014. [Google Scholar]
  21. Gaucher, E.H. Rapport Préliminaire sur le Quart Sud-est du Canton de Barlow, District Électoral d’Abitibi-est; MERN report RP-425; Ministère des Ressources naturelles du Québec: Québec, QC, Canada, 1960. [Google Scholar]
  22. Allard, G.O. Géologie du Quart Nord-ouest du Canton de Rinfret, Comtés d’Abitibi-Est et de Roberval: Rapport Préliminaire; MERN report 567, Map 1649; Ministère des Ressources naturelles du Québec: Québec, QC, Canada, 1967. [Google Scholar]
  23. Caty, J.L. Petrographie et Petrologie du Flanc Sud-est du Complexe du Lac Dore. Master’s Thesis, Université de Montréal, Montreal, QC, Canada, 1970. [Google Scholar]
  24. Bédard, J.H.; Leclerc, F.; Harris, L.B.; Goulet, N. Intra-sill magmatic evolution in the Cummings Complex, Abitibi greenstone belt: Tholeiitic to calc-alkaline magmatism recorded in an Archaean subvolcanic conduit system. Lithos 2009, 111, 47–71. [Google Scholar] [CrossRef]
  25. Toplis, M.J.; Carroll, M.R. An experimental study of the influence of oxygen fugacity on Fe-Ti oxide stability, phase relations, and mineral-melt equilibria in ferro-basaltic systems. J. Petrol. 1995, 36, 1137–1170. [Google Scholar] [CrossRef]
  26. Thy, P.; Lesher, C.E.; Nielsen, T.F.D.; Brooks, C.K. Experimental constraints on the Skaergaard liquid line of descent. Lithos 2006, 92, 154–180. [Google Scholar] [CrossRef]
  27. Grove, T.L.; Baker, M.B. Phase equilibrium controls on the tholeiitic versus calc alkaline differentiation trends. J. Geophys. Res. Solid Earth 1984, 89, 3253–3274. [Google Scholar] [CrossRef]
  28. Zhang, X.-Q.; Song, X.-Y.; Chen, L.-M.; Xie, W.; Yu, S.-Y.; Zheng, W.-Q.; Deng, Y.-F.; Zhang, J.-F.; Gui, S.-G. Fractional crystallization and the formation of thick Fe–Ti–V oxide layers in the Baima layered intrusion, SW China. Ore Geol. Rev. 2012, 49, 96–108. [Google Scholar] [CrossRef]
  29. Irvine, T.N. Crystallization sequences in the Muskox intrusion and other layered intrusions-II. Origin of chromitite layers and similar deposits of other magmatic ores. In Chromium: Its Physicochemical Behavior and Petrologic Significance: Papers from a Carnegie Institution of Washington Conference, Geophysical Laboratory; Pergamon Press Ltd.: Oxford, UK, 1976; pp. 991–1020. [Google Scholar]
  30. Mungall, J.E.; Kamo, S.L.; McQuade, S. U-Pb geochronology documents out-of-sequence emplacement of ultramafic layers in the Bushveld Igneous Complex of South Africa. Nat. Commun. 2016, 7, 13385. [Google Scholar] [CrossRef] [PubMed]
  31. Alfaro, M.A. Origin of the Granophyres within the Dore Lake Complex, Chibougamau, Quebec, Canada. Master’s Thesis, University of Georgia, Athens, GA, USA, 1990. [Google Scholar]
  32. Allard, G.O.; Whitney, J.A. Spatial and petrological relationships between granophyre and layering, and the type of country rock in the Dore Lake Complex, Chibougamau, Québec. In Proceedings of the 1977 Annual Meetings of GAC-MAC-SEG-CGU, Vancouver, Program with abstracts, Vancouver, BC, Canada, 15–19 May 1977; p. 4. [Google Scholar]
  33. Trépanier, S.; Mathieu, L.; Daigneault, R. CONSONORM-LG: New normative minerals and alteration indexes for low-grade metamorphic rocks. Econ. Geol. 2015, 110, 2127–2138. [Google Scholar] [CrossRef]
  34. Whitney, D.L.; Evans, B.W. Abbreviations for names of rock-forming minerals. Am. Mineral. 2010, 95, 185–187. [Google Scholar] [CrossRef]
  35. Jochum, K.P.; Willbold, M.; Raczek, I.; Stoll, B.; Herwig, K. Chemical Characterisation of the USGS Reference Glasses GSA 1G, GSC 1G, GSD 1G, GSE 1G, BCR 2G, BHVO 2G and BIR 1G Using EPMA, ID TIMS, ID ICP MS and LA ICP MS. Geostand. Geoanalytical Res. 2005, 29, 285–302. [Google Scholar] [CrossRef]
  36. Dare, S.A.S.; Barnes, S.-J.; Beaudoin, G. Variation in trace element content of magnetite crystallized from a fractionating sulfide liquid, Sudbury, Canada: Implications for provenance discrimination. Geochim. Cosmochim. Acta 2012, 88, 27–50. [Google Scholar] [CrossRef]
  37. Savard, D.; Bouchard-Boivin, B.; Barnes, S.-J.; Garbe-Schönberg, D. UQAC-FeS: A new series of base metal sulfide quality control reference material for LA-ICP-MS analysis. In Proceedings of the 10th International Conference on the Analysis of Geological and Environmental Materials, Sydney, Australia, 8–13 July 2018. [Google Scholar]
  38. Garbe-Schönberg, D.; Müller, S. Nano-particulate pressed powder tablets for LA-ICP-MS. J. Anal. At. Spectrom. 2014, 29, 990–1000. [Google Scholar] [CrossRef] [Green Version]
  39. Paton, C.; Hellstrom, J.; Paul, B.; Woodhead, J.; Hergt, J. Iolite: Freeware for the visualisation and processing of mass spectrometric data. J. Anal. At. Spectrom. 2011, 26, 2508–2518. [Google Scholar] [CrossRef]
  40. Buddington, A.F.; Lindsley, D.H. Iron-titanium oxide minerals and synthetic equivalents. J. Petrol. 1964, 5, 310–357. [Google Scholar] [CrossRef]
  41. Winchester, J.A.; Floyd, P.A. Geochemical discrimination of different magma series and their differentiation products using immobile elements. Chem. Geol. 1977, 20, 325–343. [Google Scholar] [CrossRef] [Green Version]
  42. Hofmann, A.W. Chemical differentiation of the Earth: the relationship between mantle, continental crust, and oceanic crust. Earth Planet. Sci. Lett. 1988, 90, 297–314. [Google Scholar] [CrossRef] [Green Version]
  43. McDonough, W.F.; Sun, S.-S. The composition of the Earth. Chem. Geol. 1995, 120, 223–253. [Google Scholar] [CrossRef]
  44. Dare, S.A.S.; Barnes, S.-J.; Beaudoin, G.; Méric, J.; Boutroy, E.; Potvin-Doucet, C. Trace elements in magnetite as petrogenetic indicators. Miner. Depos. 2014, 49, 785–796. [Google Scholar] [CrossRef]
  45. Trépanier, S.; Mathieu, L.; Daigneault, R.; Faure, S. Precursors predicted by artificial neural networks for mass balance calculations: Quantifying hydrothermal alteration in volcanic rocks. Comput. Geosci. 2016, 89, 32–43. [Google Scholar] [CrossRef]
  46. Middlemost, E.A.K. Iron oxidation ratios, norms and the classification of volcanic rocks. Chem. Geol. 1989, 77, 19–26. [Google Scholar] [CrossRef]
  47. Mathieu, L. Quantifying hydrothermal alteration: a review of methods. Geosciences 2018, 8, 245. [Google Scholar] [CrossRef]
  48. Le Bas, M.J.; Le Maitre, R.W.; Woolley, A.R. The construction of the total alkali-silica chemical classification of volcanic rocks. Mineral. Petrol. 1992, 46, 1–22. [Google Scholar] [CrossRef]
  49. Spear, F.S. Metamorphic Phase Equilibria and Pressure-Temperature-Time Paths; Monograph series; Mineralogical Society of America: Washington, DC, USA, 1993; Volume 1. [Google Scholar]
  50. Frost, B.R. Magnetic petrology; factors that control the occurrence of magnetite in crustal rocks. In Oxide Minerals: Petrologic and Magnetic Significance; Lindsley, D.H., Ed.; Mineralogical Society of America Reviews in Mineralogy Reviews in Mineralogy and Geochemistry: Mclean, Virginia, 1991; Volume 25, pp. 489–509. [Google Scholar]
  51. Hunter, R.H. Texture development in cumulate rocks. In Developments in Petrology; Cawthorn, R.G., Ed.; Springer: Berlin, Germany, 1996; Volume 15, pp. 77–101. ISBN 0167-2894. [Google Scholar]
  52. Higgins, M.D. Quantitative textural analysis of rocks in layered mafic intrusions. In Layered Intrusions; Charlier, B., Namur, O., Latypov, R., Tegner, C., Eds.; Springer Geology; Springer: Dordrecht, The Netherlands, 2015; pp. 153–181. [Google Scholar]
  53. Herzberg, C.; Asimow, P.D.; Ionov, D.A.; Vidito, C.; Jackson, M.G.; Geist, D. Nickel and helium evidence for melt above the core-mantle boundary. Nature 2013, 493, 393–398. [Google Scholar] [CrossRef] [PubMed]
  54. Toplis, M.J.; Libourel, G.; Carroll, M.R. The role of phosphorus in crystallisation processes of basalt: an experimental study. Geochim. Cosmochim. Acta 1994, 58, 797–810. [Google Scholar] [CrossRef]
  55. Jenner, F.E.; O’neill, H.S.C.; Arculus, R.J.; Mavrogenes, J.A. The magnetite crisis in the evolution of arc-related magmas and the initial concentration of Au, Ag and Cu. J. Petrol. 2010, 51, 2445–2464. [Google Scholar] [CrossRef]
  56. Kaufmann, F.E.D.; Vukmanovic, Z.; Holness, M.B.; Hecht, L. Orthopyroxene oikocrysts in the MG1 chromitite layer of the Bushveld Complex: implications for cumulate formation and recrystallisation. Contrib. to Mineral. Petrol. 2018, 173, 17. [Google Scholar] [CrossRef]
  57. Barnes, S.J.; Mole, D.R.; Le Vaillant, M.; Campbell, M.J.; Verrall, M.R.; Roberts, M.P.; Evans, N.J. Poikilitic textures, heteradcumulates and zoned orthopyroxenes in the Ntaka Ultramafic Complex, Tanzania: implications for crystallization mechanisms of oikocrysts. J. Petrol. 2016, 57, 1171–1198. [Google Scholar] [CrossRef]
  58. B Barnes, S.-J.; Lightfoot, P.C. Formation of magmatic nickel-sulfide ore deposits and processses affecting their copper and platinum-group element contents. In Economic Geology 100th Anniversary Volume: 1905–2005; Society of Economic Geologists: Littelton, CO, USA, 2005; pp. 179–213. [Google Scholar]
  59. Franklin, J.M.; Gibson, H.L.; Jonasson, I.R.; Galley, A.G. Volcanogenic Massive Sulfide Deposits. In One Hundredth Anniversary Volume; Hedenquist, J.W., Thompson, J.F.H., Goldfarb, R.J., Richards, J.P., Eds.; Society of Economic Geologists: Littelton, CO, USA, 2005; pp. 523–560. ISBN 9781887483018. [Google Scholar]
  60. Galley, A.G.; Hannington, M.D.; Jonasson, I.R. Volcanogenic massive sulphide deposits. In Mineral Deposits of Canada: A Synthesis of Major Deposit-Types, District Metallogeny, the Evolution of Geological Provinces, and Exploration Methods; Geological Association of Canada, Mineral Deposits Division: St. John’s, NL, USA, 2007; Volume 5, pp. 141–161. [Google Scholar]
  61. Hannington, M.D.; de Ronde, C.D.J.; Petersen, S. Sea-floor tectonics and submarine hydrothermal systems. In One Hundredth Anniversary Volume; Hedenquist, J.W., Thompson, J.F.H., Goldfarb, R.J., Richards, J.P., Eds.; Society of Economic Geologists: Littelton, CO, USA, 2005; pp. 111–141. [Google Scholar]
  62. Mathieu, L.; Bouchard, R.-A.; Pearson, V.; Daigneault, R. The Coulon deposit: Quantifying alteration in volcanogenic massive sulphide systems modified by amphibolite-facies metamorphism. Can. J. Earth Sci. 2016, 53, 1443–1457. [Google Scholar] [CrossRef]
  63. McCarthy, T.S.; Cawthorn, R.G. The geochemistry of vanadiferous magnetite in the Bushveld Complex: implications for crystallization mechanisms in layered complexes. Miner. Depos. 1983, 18, 505–518. [Google Scholar] [CrossRef]
  64. Tegner, C.; Cawthorn, R.G.; Kruger, F.J. Cyclicity in the Main and Upper Zones of the Bushveld Complex, South Africa: crystallization from a zoned magma sheet. J. Petrol. 2006, 47, 2257–2279. [Google Scholar] [CrossRef]
  65. Song, X.Y.; Qi, H.W.; Hu, R.Z.; Chen, L.M.; Yu, S.Y.; Zhang, J.F. Formation of thick stratiform Fe Ti oxide layers in layered intrusion and frequent replenishment of fractionated mafic magma: evidence from the Panzhihua intrusion, SW China. Geochem. Geophys. Geosystems 2013, 14, 712–732. [Google Scholar] [CrossRef]
  66. Tan, W.; Liu, P.; He, H.; Wang, C.Y.; Liang, X. Mineralogy and origin of exsolution in Ti-rich magnetite from different magmatic Fe-Ti oxide-bearing intrusions. Can. Mineral. 2017, 54, 539–553. [Google Scholar] [CrossRef]
  67. Wallace, P.; Carmichael, I.S.E. Sulfur in basaltic magmas. Geochim. Cosmochim. Acta 1992, 56, 1863–1874. [Google Scholar] [CrossRef]
  68. Humphris, S.E.; Thompson, G. Trace element mobility during hydrothermal alteration of oceanic basalts. Geochim. Cosmochim. Acta 1978, 42, 127–136. [Google Scholar] [CrossRef]
  69. Polivchuk, M. The Formation of Vanadium Deposits in the Archean Rivière Bell Complex, Quebec: Insights from Fe-Ti Oxide Chemistry. Master’s Thesis, University of Ottawa, Ottawa, Canada, 2017. [Google Scholar]
  70. Lindstrom, D.J. Experimental Study of the Partitioning of the Transition Metals between Clinopyroxene and Coexisting Silicate Liquids. Ph.D. Thesis, University of Oregon, Eugene, OR, USA, 1976. [Google Scholar]
  71. Barnes, S.J. The effect of trapped liquid crystallization on cumulus mineral compositions in layered intrusions. Contrib. Mineral. Petrol. 1986, 93, 524–531. [Google Scholar] [CrossRef]
  72. Toplis, M.J.; Corgne, A. An experimental study of element partitioning between magnetite, clinopyroxene and iron-bearing silicate liquids with particular emphasis on vanadium. Contrib. to Mineral. Petrol. 2002, 144, 22–37. [Google Scholar] [CrossRef]
  73. Canil, D. Vanadium partitioning and the oxidation state of Archaean komatiite magmas. Nature 1997, 389, 842. [Google Scholar] [CrossRef]
  74. Cawthorn, R.G.; Ashwal, L.D. Origin of anorthosite and magnetitite layers in the Bushveld Complex, constrained by major element compositions of plagioclase. J. Petrol. 2009, 50, 1607–1637. [Google Scholar] [CrossRef]
  75. Maier, W.D.; Barnes, S.-J.; Groves, D.I. The Bushveld Complex, South Africa: formation of platinum-palladium, chrome-and vanadium-rich layers via hydrodynamic sorting of a mobilized cumulate slurry in a large, relatively slowly cooling, subsiding magma chamber. Miner. Depos. 2013, 48, 1–56. [Google Scholar] [CrossRef]
  76. Wilson, A.H. The earliest stages of emplacement of the eastern Bushveld Complex: development of the Lower Zone, Marginal Zone and Basal Ultramafic Sequence. J. Petrol. 2015, 56, 347–388. [Google Scholar] [CrossRef]
  77. Pang, K.-N.; Zhou, M.-F.; Lindsley, D.; Zhao, D.; Malpas, J. Origin of Fe-Ti oxide ores in mafic intrusions: evidence from the Panzhihua intrusion, SW China. J. Petrol. 2007, 49, 295–313. [Google Scholar] [CrossRef]
  78. Namur, O.; Abily, B.; Boudreau, A.E.; Blanchette, F.; Bush, J.W.M.; Ceuleneer, G.; Charlier, B.; Donaldson, C.H.; Duchesne, J.-C.; Higgins, M.D. Igneous layering in basaltic magma chambers. In Layered Intrusions; Charlier, B., Namur, O., Latypov, R., Tegner, C., Eds.; Springer Geology; Springer: Dordrecht, The Netherlands, 2015; pp. 75–152. [Google Scholar]
  79. Pang, K.-N.; Shellnutt, J.G.; Zhou, M.-F. The panzhihua intrusion, SW China. In Layered Intrusions; Springer: Berlin, Germany, 2015; pp. 435–463. [Google Scholar]
  80. Presnall, D.C. The join forsterite-diopside-iron oxide and its bearing on the crystallization of basaltic and ultramafic magmas. Am. J. Sci. 1966, 264, 753–809. [Google Scholar] [CrossRef]
  81. Muan, A.; Osborn, E. Phase equilibria at liquidus temperatures in the system MgO-FeO-Fe2O3-SiO2. J. Am. Ceram. Soc. 1956, 39, 121–140. [Google Scholar] [CrossRef]
  82. Roeder, P.L.; Osborn, E.F. Experimental data for the system MgO-FeO-Fe2O3-CaAl2Si2O8-SiO2 and their petrologic implications. Am. J. Sci. 1966, 264, 428–480. [Google Scholar] [CrossRef]
  83. Lepage, L.D. ILMAT: an excel worksheet for ilmenite--magnetite geothermometry and geobarometry. Comput. Geosci. 2003, 29, 673–678. [Google Scholar] [CrossRef]
  84. Spencer, K.J.; Lindsley, D.H. A solution model for coexisting iron-titanium oxides. Am. Mineral. 1981, 66, 1189–1201. [Google Scholar]
  85. Powell, R.; Powell, M. Geothermometry and oxygen barometry using coexisting iron-titanium oxides: A reappraisal. Mineral. Mag. 1977, 41, 257–263. [Google Scholar] [CrossRef]
  86. Andersen, D.J.; Lindsley, D.H. New (and final!) models for the Ti-magnetite/ilmenite geothermometer and oxygen barometer. In Proceedings of the Abstracts of American Geophysical Union 1985 Spring Meeting, Baltimore, MD, USA, 27–31 May 1985. [Google Scholar]
  87. Nabil, H. Genèse des dépôts de Fe-Ti-P Associés Aux Intrusions Litées (Exemples: L’intrusion Mafique de Sept-Iles, au Québec; Complexe de Duluth aux États-Unis). Ph.D. Thesis, Université du Québec à Montréal, Montreal, QC, Canada, 2003. [Google Scholar]
  88. McBirney, A.R.; Noyes, R.M. Crystallization and layering of the Skaergaard intrusion. J. Petrol. 1979, 20, 487–554. [Google Scholar] [CrossRef]
  89. Boudreau, A.E. Investigations of the Stillwater Complex; 4, The role of volatiles in the petrogenesis of the JM Reef, Minneapolis adit section. Can. Mineral. 1988, 26, 193–208. [Google Scholar]
  90. Marsh, B.D. On some fundamentals of igneous petrology. Contrib. to Mineral. Petrol. 2013, 166, 665–690. [Google Scholar] [CrossRef] [Green Version]
  91. Giuffrida, M.; Holtz, F.; Vetere, F.; Viccaro, M. Effects of CO2 flushing on crystal textures and compositions: experimental evidence from recent K-trachybasalts erupted at Mt. Etna. Contrib. to Mineral. Petrol. 2017, 172, 90. [Google Scholar] [CrossRef]
  92. Mollo, S.; Gaeta, M.; Freda, C.; Di Rocco, T.; Misiti, V.; Scarlato, P. Carbonate assimilation in magmas: a reappraisal based on experimental petrology. Lithos 2010, 114, 503–514. [Google Scholar] [CrossRef]
  93. Ariskin, A.A.; Konnikov, E.G.; Danyushevsky, L.V.; Kislov, E.V.; Nikolaev, G.S.; Orsoev, D.A.; Barmina, G.S.; Bychkov, K.A. The Dovyren intrusive complex: Problems of petrology and Ni sulfide mineralization. Geochem. Int. 2009, 47, 425. [Google Scholar] [CrossRef]
  94. Iacono-Marziano, G.; Gaillard, F.; Pichavant, M. Limestone assimilation and the origin of CO2 emissions at the Alban Hills (Central Italy): Constraints from experimental petrology. J. Volcanol. Geotherm. Res. 2007, 166, 91–105. [Google Scholar] [CrossRef]
  95. Ariskin, A.A.; Fomin, I.S.; Zharkova, E.V.; Kadik, A.A.; Nikolaev, G.S. Redox conditions during crystallization of ultramafic and gabbroic rocks of the Yoko-Dovyren massif (Based on the results of measurements of intrinsic oxygen fugacity of olivine). Geoche. Int. 2017, 55, 595–607. [Google Scholar] [CrossRef]
Figure 1. Geological map of the Lac Doré Complex (LDC) from the Ministère de l’Énergie et des Ressources Naturelles (MERN), Québec (système d’information géominière du Québec—SIGEOM; http://sigeom.mines.gouv.qc.ca). The geographic projection is UTM (NAD83, zone 18U). The zoomed map (top of the figure) is adapted from the map of Lapallo [5], and the geographic projection uses WGS84.
Geosciences 09 00110 g001
Figure 2. Stratigraphic column of the Lac Doré Complex (LDC) showing the units observed in (a) the NW and S limbs of the LDC [1] and (b) in its NE limb [5].
Geosciences 09 00110 g002
Figure 3. Minerals represented as a function of downhole length (drill hole MS-13-17). Magnetite proportions measured by SATMAGAN [20] and normative greenschist facies minerals calculated with the CONSONORM_LG method [33] are represented. The samples considered by this study are designated as MS17-xx (see also Supplemental Material S1). The mafic dykes correspond to thin-grained intervals with sharp contacts. Mineral abbreviations are as reported in the literature [34].
Geosciences 09 00110 g003
Figure 4. Photographs of half-core samples from drill hole MS-13-17. The samples are: (a) MS17-28; (b) MS17-37; (c) MS17-31; (d) MS17-42; (e) MS17-01; (f) MS17-02; (g) MS17-04; and (h) MS17-07. The scale is shown in (h) and mineral abbreviations are as reported in the literature [34].
Geosciences 09 00110 g004
Figure 5. Images showing the textures of samples: (a) MS17-45, with linear magnetite that rim olivine grains pseudomorphed by serpentine and talc; (b) MS17-45, chlorite cluster in a magnetite-serpentine matrix; (c) MS17-28, edge of an actinolite-bearing chlorite cluster; (d) MS17-28, ilmenite with magnetite exsolutions rimmed by magnetite with ilmenite exsolutions, in a chlorite–amphibole matrix; (e) MS17-02, assemblage of apatite, pyrrhotite, and small granular magnetite; and (f) MS17-37, serpentine and chlorite with interstitial apatite and pyrite. In the red rectangle (a), pixel counts (GIMP software) indicate 90.4 vol % of serpentine + brucite and 9.6 vol % of inclusion-free magnetite. Images have been obtained using a conventional microscope with both (a,e) reflected light and (b) transmitted light, as well as (c,d,f) with a backscattered electron SEM. Mineral abbreviations are as reported in the literature [34].
Geosciences 09 00110 g005
Figure 6. (a) Reflected light image and (b) assisted mineral recognition (using the GIMP software) performed on sample MS17-31. (c) Reflected light image and (d) time-resolved profiles showing the distribution of 57Fe, 24Mg, 28Si, 27Al, 47Ti, 51V, and 52Cr in the minerals of sample MS17-37. Mineral abbreviations are as reported in the literature [34]. (e) Magnetite analyzed by LA-ICP-MS (n = 114) displayed on a binary diagram. The sum (Mg + Al + Si + Ca) is a proxy for exsolutions and inclusions: in the inclusion-poor magnetite, the sum of these elements is less than a few hundred ppm. Note that V concentration is uncorrelated to inclusion abundance.
Geosciences 09 00110 g006
Figure 7. Reflected light images showing magnetite textures in samples: (a) MS17-45 (note the ilmenite exsolutions and the chlorite inclusions); (b) MS17-36 (granoblastic magnetite with granular chlorite and ilmenite exsolutions); (c) MS17-37 (granular magnetite of variable sizes); (d) MS17-02 (zoned magnetite); (e) MS17-04 (cluster of small magnetites); (f,g) MS17-14 (Ti-rich magnetite). The red dashed lines (a) outline the possible extent of primary (magmatic) magnetite based on the distribution of the chlorite inclusions and the orientation of the ilmenite exsolutions. Mineral abbreviations are as reported in the literature [34].
Geosciences 09 00110 g007
Figure 8. Reflected light images showing magnetite textures in samples: (a) MS17-31 (rectilinear chlorite inclusions controlled by the crystallography of the magnetite); (b) MS17-28 (thick chlorite inclusion and ilmenite lamellae—note the absence of inclusions and exsolutions in the immediate vicinity of these minerals); (c) MS17-02 (rectilinear chlorite inclusions, granular ilmenite exsolutions, and micro-inclusions of chlorite and/or pleonaste); (d) MS17-04 (size-reduced magnetite grains with well-developed triple-junctions and granular ilmenite exsolutions); (e) MS17-36 (rectilinear and globular chlorite inclusions and granular ilmenite exsolutions – note the abundance of chlorite and/or pleonaste micro-inclusions). (f) Magnetite analyzed by LA-ICP-MS (n = 114) displayed on a Si-Mg-Al (molar) ternary diagram, indicating that the inclusions and micro-inclusions are chlorite, ±other silicates and ±pleonaste. Mineral abbreviations are as reported in the literature [34].
Geosciences 09 00110 g008
Figure 9. Binary diagrams displaying whole rock analyses (ad,g,h) from the company dataset (n = 159 minus 7 mafic dyke samples) and (e,f) from a literature review performed by Allard [1]. Analyses of the company dataset are separated into two groups because samples located between 320 and 335 m along-hole (i.e., magnetitite unit) have distinct chemistries. The ternary diagrams display elements (molar) controlled by silicates and pleonaste. The data compiled by Allard [1] are whole rock analyses of gabbro, pyroxenite, magnetitite, and ferrodunite.
Geosciences 09 00110 g009
Figure 10. REE diagram normalized to the primitive mantle [42] for whole rock chemical analyses performed on behalf of this study (samples MS17-xx) and compiled from the MERN dataset (see Figure 1 for reference) (Obatogamau Formation and David Member).
Geosciences 09 00110 g010
Figure 11. Reflected light image and chemical maps (LA-ICP-MS) of sample MS17-37. The 39K (red) + 27Al (green) + 24Mg (blue) map displays three elements. The other chemical maps display the relative abundance of an element of interest (44Ca, 59Co, 52Cr, 139La, 47Ti, 51V, 66Zn, and 90Zr), represented by the colors red and green, against the internal standard for magnetite (57Fe), represented in blue (for additional maps, see Supplemental Material S10). Mineral abbreviations are as reported in the literature [34].
Geosciences 09 00110 g011
Figure 12. Trace element profiles (median values for n samples) of magnetites analyzed by LA-ICP-MS and normalized to the primitive mantle [43]. The elements are ordered by increasing compatibility in magnetite [44]. The LDC magnetites are compared to magnetites reported by Dare and collaborators [44] and collected from: (1) Fe–Ti–P deposits from several intrusions; and (2) a massive magnetite unit in the Bushveld Complex.
Geosciences 09 00110 g012
Figure 13. Results of principal component analysis (PCA) performed on (a,b) 9 and (c,d) 12 elements analyzed in the magnetite by LA-ICP-MS. The PC1 vs. PC2 binary diagrams display (a,c) the location of the analyses and (b, d) the contribution of each variable. PC1 and PC2 explain, respectively, 41% and 24% (PCA performed on 9 elements), as well as 41% and 26% (PCA performed on 12 elements) of the variance.
Geosciences 09 00110 g013
Figure 14. REE diagram normalized to the primitive mantle [42] for (a) magnetites and (b) silicates as analyzed by LA-ICP-MS.
Geosciences 09 00110 g014
Figure 15. Ti (a) and V (b) contents (company dataset minus seven mafic dyke samples) represented as a function of downhole length. The V and Ti contents are analyzed bulk rock values (black lines) and values recalculated to 100% magnetite (orange lines). The magnetite proportions used to perform these calculations were measured by SATMAGAN.
Geosciences 09 00110 g015
Table 1. Whole rock analyses performed on LDC and volcanic rock samples.
ElementLOD 1MS17-14MS17-20MS17-28MS17-36MS17-37MS17-45
Volcanic RocksUpper Fe-rich Zone of the LDC
SiO2 (wt %)0.0147.450.628.214.6520.723.3
Al2O30.0112.313.255.062.944.792.95
Fe2O3T0.0119.815.5536.363.846.345.8
CaO0.015.243.272.650.180.20.08
MgO0.018.087.9920.514.4520.822.7
Na2O0.013.033.210.030.030.030.03
K2O0.010.440.150.050.030.040.03
TiO20.011.652.131.690.960.921.16
MnO0.010.450.190.280.150.150.15
P2O50.010.110.180.120.10.110.02
LOI0.011.424.774.892.955.795.62
Total0.0199.95101.2999.77100.2499.83101.85
Zr (ppm)29915413272541
Cr10804020n.d. 23070
Th0.050.530.760.360.560.450.58
Nb0.24.96.92.82.82.82.2
Y0.130.650.98.27.36.87.2
V54374461150362024501670
La0.1813.121.21.31
Ce0.120.130.96.54.24.12.8
Pr0.032.834.481.030.680.640.42
Nd0.113.221.55.13.332.1
Sm0.033.927.21.240.930.80.83
Eu0.031.271.310.120.060.040.03
Gd0.054.638.061.581.21.140.93
Tb0.010.811.380.230.210.140.18
Dy0.055.39.261.481.130.991.05
Ho0.011.121.910.290.250.220.22
Er0.033.465.620.830.690.660.66
Tm0.010.520.790.110.10.080.09
Yb0.033.334.990.710.730.630.83
Lu0.010.530.810.120.150.140.14
Alteration Indices of the CONSONORM_LG Method (Dimensionless Values Comprised between 0 and 100)
Modelled Fe2O3/Fe2O3T0.20.20.60.60.60.6
ALT_CARBS index03.970.780.511.170.02
1 LOD = Limit of Detection; 2 n.d. = not detected.
Table 2. Average chemical compositions of magnetite analyzed by LA-ICP-MS in LDC rocks.
ElementIsotopeLOD 1MS17-45
(n = 16)
MS17-28
(n = 20)
MS17-31
(n = 17)
MS17-36
(n = 22)
MS17-37
(n = 16)
MS17-02
(n = 11)
MS17-04
(n = 12)
Medianstd. 2Medianstd.Medianstd.Medianstd.Medianstd.Medianstd.Medianstd.
Si (ppm)2815002872.53598.832115.02642.301550.03515.745362.54327.023567.53802.464850.08029.097572.56135.76
Ca445.059.50108.18195.00943.42214.50604.75159.00173.69223.25115.08207.001716.62163.50574.53
Y890.010.6180.3481.4250.8050.9121.2350.8830.2160.9880.3283.9052.7122.7330.397
P311510.836.065.783.307.6582.0313.086.338.4842.7212.3013.1621.487.36
Zr900.010.5200.2542.4252.6621.260179.0730.1340.2620.1940.0740.3090.8600.0570.310
Hf1780.010.0370.0200.1210.1060.0844.4570.0080.0050.0090.0060.0230.0440.0050.006
Al270.21250.51915.161262.51525.451550.01714.152092.51613.37876.251468.222350.02609.274487.52989.17
Ta1810.010.3500.1710.4000.1690.0090.1320.0450.0310.1360.0860.0590.0620.0530.022
Nb930.036.5103.6275.9302.6450.4452.3751.8680.7254.3232.9921.3800.8882.4280.516
Cu630.041.211.890.674.480.907.238.0578.6036.0092.512.8517.0013.35325.22
Mn551.02702.5857.594247.51558.881376.5248.241182.5268.751845.8842.721036.0248.07339.7579.96
Mg240.12467.54823.662460.03184.893450.03985.706055.05710.814192.54835.596550.07470.535932.54752.36
Ti470.121,1377261.642707511,093.6069801548.2762251657.0510,6355873.547690.02372.93502.50291.58
Zn660.536.78142.7126.53232.9248.0090.5748.0550.6380.7539.5928.258.4822.8516.03
Co590.0248.975.5355.403.2272.403.8858.404.5057.282.7218.75124.2014.93121.69
V510.034025.8461.753142.5420.243186.5361.715009.0120.774322.3146.351360.50276.2827.786.28
Ni600.195.9031.3798.0520.6095.008.09126.1313.8794.259.6221.80465.9518.13236.53
Cr521.0157.4386.4417.2628.637.788.395.612.2646.3819.9043.70230.749.702.40
La1390.010.2460.1881.5051.0880.4290.1880.9030.3920.7040.2870.7490.3500.3300.097
Ce1400.010.5730.3873.8531.9551.2810.5712.3280.8381.7550.6351.9300.8490.8050.224
Pr1410.010.0750.0520.4380.2100.1830.0680.2610.0850.2190.0730.2840.1150.1260.030
Nd1460.010.3740.2341.7600.7430.7950.3501.1350.3460.9500.3291.3600.5650.7600.149
Sm1520.020.0870.0690.3260.1170.1660.0950.2170.0530.2210.0830.3400.2250.2860.072
Eu1530.010.0050.0030.0270.0100.0110.0080.0130.0080.0140.0060.0360.0190.0450.011
Gd1570.030.1360.0810.3200.1230.1780.1280.2150.0700.2830.0740.5800.3310.4660.067
Tb1590.010.0160.0130.0500.0270.0240.0210.0290.0060.0340.0150.0850.0640.0690.011
Dy1630.020.1370.0860.3040.1900.1790.1700.1780.0380.2230.0710.6300.4720.4630.097
Ho1650.010.0270.0150.0640.0390.0310.0430.0320.0100.0420.0140.1490.0980.0980.017
Er1660.020.0850.0440.2100.1520.0980.2110.0890.0220.1110.0390.4370.2840.2690.052
Tm1690.010.0130.0060.0320.0300.0130.0380.0110.0030.0150.0050.0540.0380.0380.007
Yb1720.010.1330.0410.3060.2840.1040.3250.0780.0190.0900.0270.4480.2290.2010.044
Lu1750.010.0250.0070.0670.0700.0190.0720.0140.0040.0170.0040.0760.0390.0270.006
1 LOD = limit of detection, 2 std. = standard deviation.
Table 3. Average chemical composition of silicates analyzed by LA-ICP-MS in LDC rocks.
ElementIsotopeLOD 4Chlorite 1
n = 6
Serpentine ± Talc, Brucite 2
n = 19
Actinolite 3
n = 13
Medianstd. 5Medianstd.Medianstd.
SiO2 (wt %)28150030.704.8842.982.5353.078.76
TiO2470.10.030.010.010.000.020.02
Al2O3270.217.5701.0010.9270.4290.2070.851
CaO445.00.100.280.030.2112.664.83
FeO561.09.7469.2106.0882.8236.2703.788
MgO240.129.2223.81837.7492.10122.9712.151
Na2O230.70.000.000.000.140.040.05
K2O392.00.0160.0060.0010.0100.0160.007
P2O531150.0050.0050.0160.0470.0070.009
MnO551.00.080.090.070.020.240.15
Mg# 0.750.150.860.060.780.09
V (ppm)510.0329.5415.9586.5869.458.5361.81
Cr521.0a1.511.090.792.420.460.74
Ni580.131.284.7530.16101.5814.2510.66
La1390.010.110.060.420.150.312.28
Ce1400.010.320.161.300.531.418.97
Pr1410.010.050.030.210.080.371.74
Nd1460.010.300.181.170.432.625.66
Sm1520.020.130.080.380.141.090.74
Eu1530.010.0210.0190.0150.0060.1270.045
Gd1570.030.2220.1470.6030.2201.7480.717
Tb1590.010.0320.0280.1020.0350.3120.136
Dy1630.020.2630.1510.6270.2161.9280.643
Ho1650.010.0600.0320.1330.0460.3930.154
Er1660.020.1800.0900.3840.1261.1610.469
Tm1690.010.0210.0180.0570.0190.1090.070
Yb1720.010.1610.1420.4170.1340.6570.746
Lu1750.010.0300.0320.0870.0260.0830.143
1 Chlorite (samples MS17-02, -04), 2 serpentine (samples MS17-02, -28, -36, -45), 3 actinolite (samples MS17-02, -04, -28), 4 LOD = limit of detection, 5std. = standard deviation.
Table 4. Approximate proportions (vol %) of minerals observed in thin sections.
SampleUnitSrp 1ActChlAb, EpMagTtnApSulphideAlteration Minerals
MS17-45LDC30% 20% 40% <1%1% (Py, ±Ccp)
MS17-28LDC5%20%35% 36%, 4% (Ilm) <1%
MS17-31LDC 50% 47% <1%<1% (Po, ±Ccp)2% (Amp, Cal)
MS17-36LDC20% 30% 50% <1%<1% (Po)
MS17-37LDC15% 35% 50% <1%<1% (Py)<1% (Cal vein)
MS17-38mafic dyke 34%30%30% 5% <1% (Po, ±Ccp)1% (Ep, Fsp, Chl, Cal)
MS17-02LDC 20%35% 30% 5%10% (Po, ±Ccp)1% (Ms-vein)
MS17-04LDC 10%20% 50% 20% (Po, ±Ccp)Act
MS17-07volc. 2 2%25% 3% 60% (Po, ±Ccp)10% Qz
MS17-08volc. 28%22% 2% (Ilm) 38% (Po, ±Ccp)10% Qz
MS17-14volc. 30%30%30%9% (Mag) 1% (Py)
MS17-16volc. 20%37%25%5% (Ilm) 8% (Po, Py, ±Ccp)5% (Amp)
MS17-20volc. 10%50%10% 5% 10% (Po, Py)5% (Cal, Amp)
1 Srp = serpentine ±brucite or talc, 2 mafic volcanic rock. Mineral abbreviations as reported in the literature [34].
Table 5. Results of mass balance calculations performed on volcanic rocks.
MS17-14MS17-20
Precursor 1BM-ABS 2PrecursorBM-ABS
SiO249.856.8749.484.74
FeOT12.378.9513.001.99
MgO5.873.804.334.23
CaO10.45−4.188.77−5.26
Na2O2.491.132.720.72
K2O0.370.160.72−0.56
Global mass change 19.61 8.53
1 Precursor = composition of the modelled precursor (in wt %); 2 BM-ABS = mass balance result, in g per 100 g of precursor (absolute mass changes).

