Article

Ephemeral Mediterranean Watercourses Strongly Altered by Growth in Tourism: The Case of Benidorm (Spain)

by
Estela García-Botella
1,* and
Alfredo Ramón-Morte
2
1
Department of Regional Geographic Analysis and Physical Geography, University of Alicante, 03690 San Vicente del Raspeig, Spain
2
Geomatics Laboratory, Interuniversity Institute of Geography, University of Alicante, 03690 San Vicente del Raspeig, Spain
*
Author to whom correspondence should be addressed.
Geosciences 2023, 13(8), 247; https://doi.org/10.3390/geosciences13080247
Submission received: 13 June 2023 / Revised: 28 July 2023 / Accepted: 31 July 2023 / Published: 16 August 2023
(This article belongs to the Special Issue Flood Hazard and Risk in Urban Areas)

Abstract

:
Many ephemeral Mediterranean watercourses are affected by the growth of tourism and the demand for holiday homes. Calculating the runoff threshold in these small basins is vital for understanding the impact generated by urban growth and its incidence on the increase in flood hazards. The reconstruction of paleochannels, as well as appropriate scalar analysis and the use of geographical information variables, are fundamental for the correct estimation of flood risk and the implementation of coherent territorial planning policies. This case study of the Barceló ravine in the city of Benidorm, Spain, demonstrates the importance of the correct and complementary use of official, standardised, and open databases. The correct use of these geoinformation repositories, together with the fieldwork and historical reconstruction of paleofloods, form the set of strategic information variables for the study of flooding in these altered and dangerous watercourses that affect touristic urban zones around the Mediterranean.

1. Introduction

Floods in urban areas are the result of natural phenomena; however, their impact is determined by human action. The alteration of the natural landscape of the Mediterranean coastline is aggravated by the disappearance of traditional rural development and the de-structuring of the territory caused by the rapid growth of artificial surfaces and the overgrowth of structuring systems [1] for emerging urban areas and land uses centred on tourism [2].
On the Mediterranean coast, small ravines connect the coastal mountain ranges with coastal plains, forming small basins with very steep slopes and ephemeral flow towards their floodplain [1], which are activated with high-intensity rainfall events.
These flat areas are the richest for agricultural use and have been occupied [2,3,4,5,6,7], resulting in excessive settlement growth [8] caused by a lack of planning [9], exacerbated flood consequences [10], and increased losses [11,12,13] due to soil sealing [14,15,16,17]. This is all due to a lack of risk perception [18], in which one assumes responsibility for the damage caused by the creation of vulnerable spaces [19].
Although models predict a reduction in precipitation and an aggravation of water stress [20], the Spanish Levante coast will be affected by an increase in intensity [21,22,23], deseasonalisation of precipitation [24,25], and an increase in the recurrence of extreme events [16,26], with small Mediterranean ravines being the most affected [27], since they are the place that concentrates the highest number of these types of events [5] and population [28].
Therefore, it is crucial to understand in detail the impact that these actions on the territory entail for the alteration of the natural regime of the ephemeral channels of these areas in the first phase of the hazard analysis. This work proposes methods based on comprehensive knowledge of historical events and landscape reconstruction to understand the consequences of these actions on the territory during flood events. The keys to this study are the recreation of the evolution conditions of the river basin and the transformations suffered on the territory, as well as the use of geographic information adapted to the scale of the watershed analysed.
Directive 2007/60/EC of the European Parliament (Council of the European Union, 23 October 2007) on ‘Flood Risk Assessment and Management’ requires all Member States to use flood hazard and risk mapping as basic tools for risk management and spatial planning. The directive proposes that the drainage basin be considered a unit of action for these measures. The transposition of this directive into Spanish legislation was achieved in Royal Decree 903/2010 (9 July) for the assessment and management of flood risks. The decree unified the regulatory framework and instruments for the assessment and management of flood risks and required the creation of hazard and risk mapping as basic tools for land use planning [29].
The main objective of this research is to review the documents derived from the application of flood risk management regulations, specifically those applied in Flood Risk Management Plans (FRMP), with the aim of studying improvements in cartographic content through methodological proposals for greater integration of geographic information variables in the mapping of flood-prone areas in heavily altered urban spaces. As a specific objective, the repercussions of changes in the territory that have worsened the consequences of flooding will be analysed in a particular case study (own models and land cover change matrixes) applied to the East Side of Benidorm City, a reference tourist enclave in the Western Mediterranean.
The results of this work contribute to improving flood prevention measures in this type of emerging urban area, which is abundant on the Mediterranean coast, by proposing criteria for the integration of historical geographic information and scales in the development of flood risk studies.

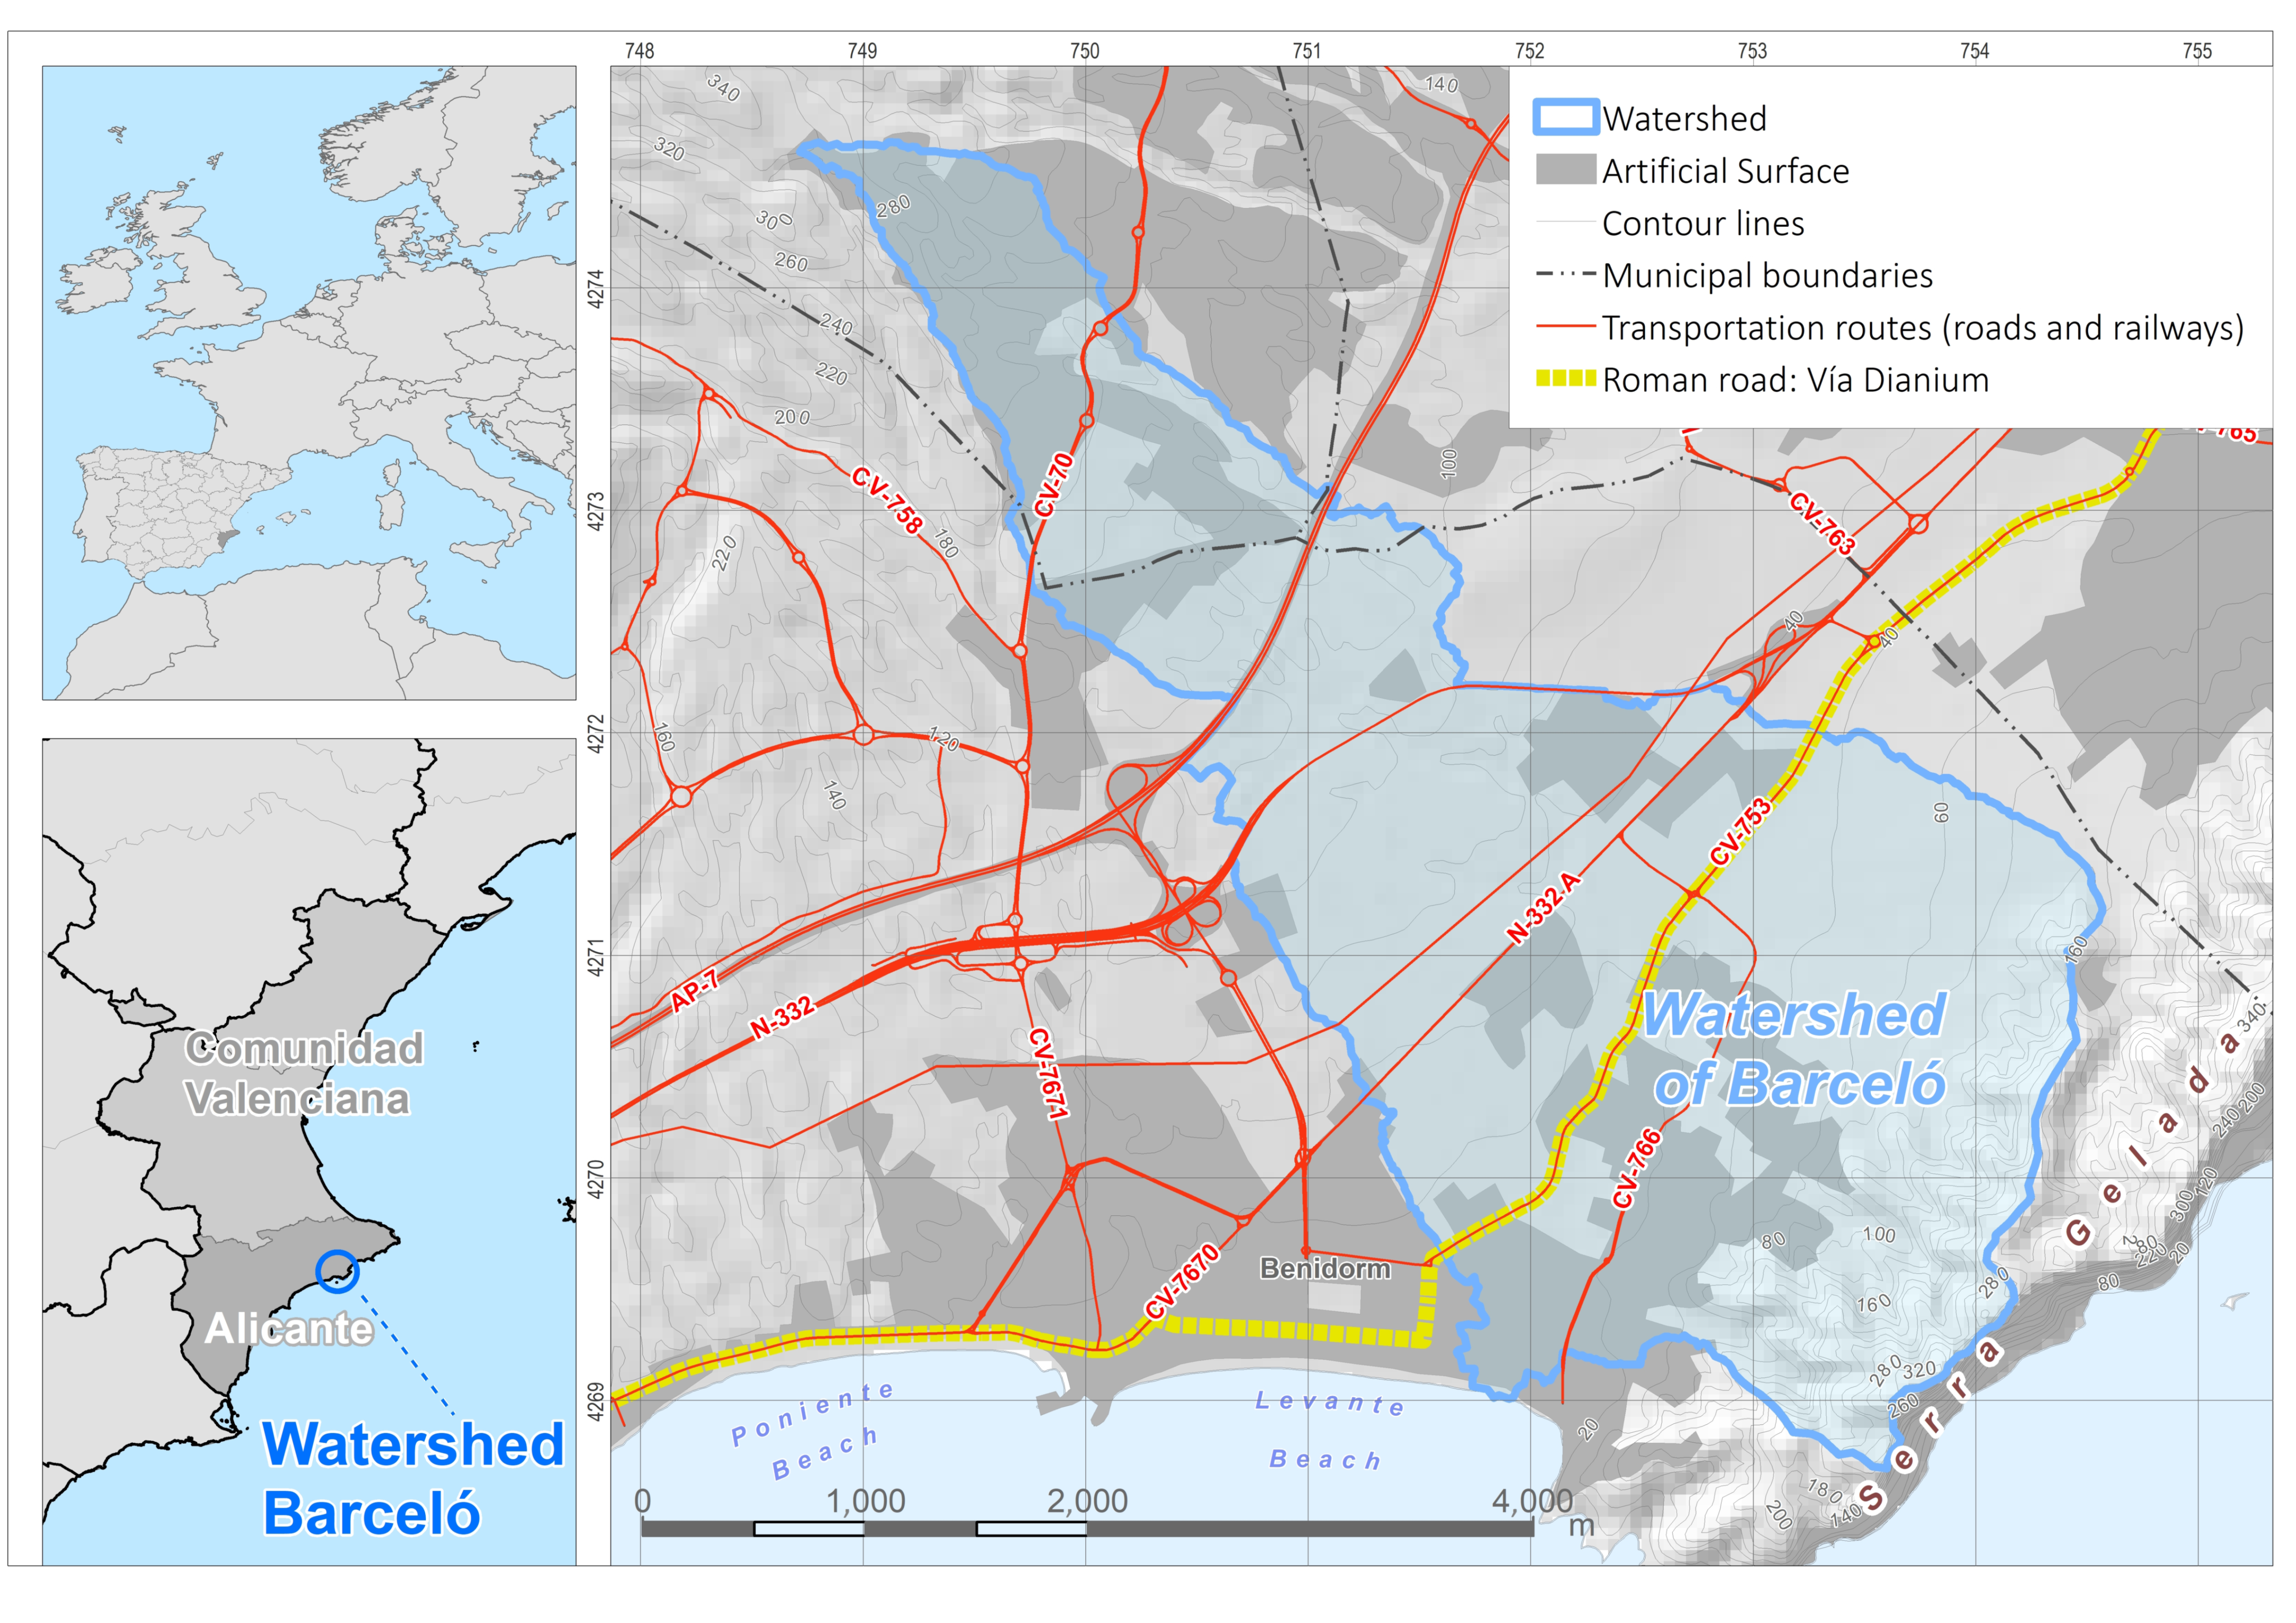
2. Geographical Context

To test the initial hypothesis based on the impact of land use changes on the worsening of flood damages, the research area chosen is the drainage basin of the Barceló ravine, which flows into the Mediterranean Sea in the easternmost sector of the urban area of Benidorm, in the province of Alicante (a place known as Racó de L’oix). Specifically, the article analyses the overgrowth of road infrastructure and artificially sealed areas that have led to the disappearance of much of its route and the consequences that these changes produce at its mouth.
The city of Benidorm is a coastal enclave with intense tourist activity. Urban growth only began in the middle of the last century, and this has resulted in a man-made alteration of the traditional rural landscape of dry farmland at the foot of a mountainous area. The rapid growth of artificial areas has increased the risk of flooding due to an increase in human activities that has been aggravated by two important factors: the increasing meteorological frequency of isolated high-level depressions (associated with flooding and known as ‘gota frías’ in Spain); and above all, by the changes made to a complex hydrological network, with runoff altered by the development of a large urban area with a network of roads and service areas that have grown parallel to the coast.
The area analysed is framed by the mountainous foothills of La Marina (the highest peaks being in the Sierra Cortina, Sierra Aitana, and Puig Campana) on the western flank and the coastal foothills of the Serra Gelada mountains on the eastern flank (Figure 1). Between these foothills is a boxed-in route for the Barceló ravine in a hilly system with variable slopes leaning towards the sea.
From a geological and structural perspective, the study area is on the eastern edge of the Baetic Mountains, known as Prebetic Alicantino, where its nearness to the coast has made it part of the recent movements of the marine Quaternary. The Triassic and Quaternary formations and the limestone outcrops of the Lower Cretaceous and Oligocene Aquitanian predominate in the eastern area, in contrast to the larger limestone and sandstone outcrops in the west, where the largest mountainous formations in the province are found. Between both anticlinal reliefs, we find a mostly Quaternary lithology composed of detritic materials of colluvial and alluvial origin (sands, silts, and gravels), which give this area a gentle sloping topography that forms an interfluve basin between two more clearly defined basins (around the River Algar and River Amadorio).
From an anthropic point of view, the Barceló basin has always been on a communications route that connects the north and south of the province of Alicante by avoiding the mountainous inland area. The ancient Roman roads gave way to a coastal road network, which has gradually been split into several routes, accompanying the rapid growth of the city and creating the four main communication routes of today: the N-332 road; the AP-7 motorway; the A-7 motorway; and the Valencia regional railway line. The perpendicularity of these roads to the water flow has helped disfigure the historical drainage system [30], causing the flow of water to follow the imprint of directional routes that are parallel to the coast, and this has profoundly changed the hydrological behaviour of the flows. In addition, these roads have led to surface sealing due to the recent proliferation of urban developments and have even affected the size and shape of the middle and upper parts of the basin.

3. Justification

A series of basic geographical observations can be made that justify selecting the Barceló ravine for an analysis of the increased danger facing East Benidorm.
Firstly, in addition to the spasmodic rhythm of rainfall, there is a geological and structural context that gives the study area a high geomorphological hazard classification, according to the Territorial Action Plan for Flood Prevention in the Valencia Region (PATRICOVA 2015 CC BY 4.0 © Institut Cartogràfic Valencià, Generalitat Valenciana) —see Figure 2 [31].
Secondly, the impact of recent urban and communication developments on the territory is highlighted by the rapid urban growth in recent decades, together with the major changes made to key communication routes, which make hydrological analyses difficult (even for the simple delimitation of the Barceló basin as offered by official information sources).
Thirdly, the definition of local territorial competences is important because this area lies mainly between two different territorial jurisdictions. Although the lower part of the basin belongs to the urban fabric of the city centre of Benidorm and its municipality, a large part of the upper basin is in another municipality, La Nucia, which implies the need to coordinate efforts and define joint studies and strategies.
Fourth, and finally, the recent increase in catastrophic events as the city has grown can be seen in Figure 3. We have listed flooding episodes that coincide with tourism-focused urban developments in the city, based on a compilation of media news stories [32], local blogs with articles related to the problems analysed [33], as well as the Flood Risk Management Plan of the Marina Baja Area (of which Benidorm is part) [34]. This information has been verified with weather data from the Spanish Meteorological Agency and the Valencian Meteorological Association, as well as the National Catalogue of Historical Floods [35].
In the data collected, it was found that there was no data on precipitation before the second decade of the 21st century. Furthermore, none of the events included in this research appear in global databases on this subject, such as EM-DAT, although these events caused noticeable damage in the area studied.
As this research developed, Benidorm City Council approved an action plan for the risk of flooding [36], which identifies 21 danger spots throughout the city, of which eight are in the urban area of the lower part of the Barceló ravine.
From the above, it is clear that the Barceló ravine is a main floodway to the urban centre of Benidorm, whose most affected points are located in the eastern part of the city (Figure 4), coinciding with the CV-753 road, Avenida del Almirante Bernat de Sarriá, and the N-332 road near the municipal cemetery (the point where waters enter the city and affect hospital infrastructure, parking areas, sports, educational facilities, and even homes) [37].

4. Materials and Methods

The mapping of flood risk in our country has focused on calculating hazards overlooked exposure and vulnerability, and therefore has an incomplete vision of the concept of risk [5]. However, good risk mapping cannot be achieved without first characterising hazards properly to avoid creating new spaces of risk [38].
For the analysis of hazards, an adaptation of the hydro-meteorological method developed by the US Soil Conservation Service (SCS) in 1972, which converts rainfall into discharge flow, has been used in our environment [39]. This methodology is required by official administrations [40,41] for watersheds that do not have available discharge flow data. The result of this study will serve to make a comparison with the mapping in the official documents consulted [36], which support the management and planning of this coastal area.
The Runoff Threshold is one of the most sensitive parameters [42] and, in turn, one of the parameters that will have the greatest impact on the results of hazard studies. Therefore, hazards have been calculated by adapting them to the analysis scale of a watershed with small dimensions and deep changes in land use.
For the methodological proposal of the Benidorm case study (Figure 5), three lines of work have been developed that cover the impact of land use and land cover changes: a delimitation of the Barceló basin; a historical reconstruction of the changes in land use; and finally, a calculation of the runoff threshold and estimation of flows using standard methodology (considering the two previous aspects). All the lines of research have been verified by fieldwork at specific locations. In turn, all the cartographic information used in this paper has the reference system European Terrestrial Reference System 1989 (ETRS89) zone 30 (EPSG25830).

4.1. Hydrological Analysis and Delimitation of the Barceló Basin

There is disagreement regarding the delimitations of the basin, and so a basic hydrographic analysis or computational hydrology [43] has been conducted using the set of tools included in most GIS programmes (in this case, QGIS and SAGA GIS). The basis for this analysis was a digital surface model made with the TIN method and with an accuracy of one metre from a LiDAR mapping (light detection and ranging or laser imaging detection and ranging) whose official description is ‘Mapa-LiDAR 2019 CC-BY 4.0′ as published by the Instituto Geográfico Nacional. The density of the LIDAR point cloud is a minimum of 0.5 points per square metre (first returns), with a point spacing ≤ 1.41 metres. From a basic filtering of the LiDAR data, road infrastructure and buildings have been included in the DEMs used for both hydrological and hydraulic analysis.
The basin indicated by the Júcar Water Authority (Confederación Hidrográfica del Júcar) and the basin termed the ‘urban basin’ in the Benidorm flood plan [36] were taken as references and compared with our own delimitation made from a reconstruction of the basin based on historical maps such as ‘National Topographical Map (MTN50)—with information between 1915 and 1960′ (these maps are colloquially known as ‘catastrones’ due to the type of paper on which they were printed and have been available since 2016 in the Web Map Service of the Instituto Geográfico Nacional, together with aerial photographs of the ‘American Flight, Army Map Service, 1956–1957 CC-BY 4.0 Series B’). In this way, we have made a historical reconstruction and compared the various delimitations of the basins shown in official maps to analyse the cause of these differences.

4.2. Historical Changes in Land Use

Due to the implications of a change in runoff and the increased danger of floods, a quantitative analysis of the drastic changes in the study area has also been made. For objective criteria on the changes in recent land use and land cover in the Barceló watershed, we used aerial photographs from 1956 as well as the most recent images from the National Aerial Orthophotography Plan of the Instituto Geográfico Nacional (‘PNOA 2021 CC BY 4.0′), in addition to constructing GIS vector layers from the reclassified information of the databases of the Information System for Land Occupation in Spain (SIOSE) and the 2018 Corine Land Cover data, to adapt to a reference scale of 1:25,000 vector layers and raster layers with a pixel resolution of 50 cm. The Land Cover data in Spain, both CLC and SIOSE, share the same standardised support provided by the European Environment Information and Observation Network (EIONET Network) of the European Environment Agency (EEA). SIOSE has become a large geographic information infrastructure for multidisciplinary use and is periodically updated, ready for integration with other European land cover databases (e.g., CORINE Land Cover) and worldwide (e.g., Global Cover), and constitutes one of the best examples of geographic information harmonised in its databases and standardised in its procedures [44]. These two data sources are not exactly comparable; however, they are complementary for our purposes. The digitised raster data from aerial photography, with the help of fieldwork and the consultation of cartographic documentation from each period, allow us to improve the spatial resolution of the CLC data and reduce its ambiguity at a detailed scale. The classification used for the unification of both land use data sources is given in [38], where hydrological behaviour is equated with land use.
The reclassified land use classes that most influence changes in runoff are: (1) artificial surfaces and settlements; (2) irrigated crops; (3) rainfed crops; and (4) forest and scrub.
Using the SAGA and QGIS programs, each class was assigned specific codes (according to the year) to make a time intersection of the layers of uses and coverages obtained from the interpretation of the 1956 and 2021 flights.
With the results of each class, cross-tabulation matrices were made for the Barceló watershed to identify the persistence, gain, and loss in land use for each case. Additionally, other parameters were found that have been offered as percentages, such as total change, exchange, and net change, to enable a detailed determination of the land use and land cover changes.
Table 1 shows the calculations made to obtain the parameters shown in [45,46]. The exchange value (S) results from twice calculating the minimum value between gains (G) and losses (Ls). This calculation assumes that each cell that gains is paired with a cell that loses, thus producing an exchange. The net change (NC) results from the absolute value of the difference between G and Ls, with the result corresponding to the cells that did not exchange. The total change (TC) was calculated from the sum of NC and S.

4.3. Calculation of the Runoff Threshold

The severe change in the rural landscape, the disappearance of traditional rainfed agriculture, and the increase in artificial surfaces have drastically changed the runoff threshold and increased the amount of water that reaches the mouth of the ravine in the centre of Benidorm. This aspect is the third line of work of the research and includes the consideration of this landscape change in the calculation of the runoff threshold by means of applying the curve number method developed by the Soil Conservation Service (which has been constantly updated since 1972) and the Spanish Road Drainage Standard I.C.5.2. (a standard that must be observed when making flood studies in Spain and which includes, following its revision in 2013, an adaptation of its methodology for calculating flows in small basins in the SE Iberian Peninsula). Important methodological proposals have also been considered in specific studies related to ephemeral streams in this geographical area [1,47,48]. Thanks to these contributions, it can be inferred how the situation has worsened at the mouth of the Barceló ravine at Racó de L’oix (East Benidorm) using hydraulic modelling with the Iber programme [49] (a freely distributed two-dimensional mathematical model that is frequently used and recommended by the state administrations and was developed in collaboration with Spanish research groups and the Centro de Estudios Hidrográficos).

5. Results

From the very beginning, it was difficult to establish a clear delimitation of the basin because of the significant changes suffered in the study area. To make a detailed reconstruction, we used the most recent and detailed official LiDAR information from the second LiDAR flight of the National Aerial Orthophotography Plan [50] for the basic hydrographical analysis, together with intense fieldwork and historical geographical information.
This detailed layout of the watershed was compared with the official mapping of the basin as shown in the data produced by the Júcar Water Authority. The comparison revealed discrepancies between our detailed map and the official map, and several areas were worth analysing in greater detail.
To better understand the differences, the various delimitations of the basin are shown in Figure 6, namely: the delimitation obtained from fieldwork and historical geographical information; the delimitations on the official maps produced in the Benidorm flood plan and by the Júcar Water Authority; and finally, the delimitation calculated from a 1-metre-pixel digital elevation model produced from data captured on a LiDAR flight. The vectorial superimposition in QGIS of the obtained versions enabled us to identify the four areas with the greatest differences (Figure 7) so that we could make a further analysis.
Zone 1, corresponding to the headwaters of the watershed, includes sectors that the other three delimitations do not consider to be within the watershed. The detail shown below (Figure 6) reveals how the Benidorm flood plan includes part of a watercourse that runs to the west of the Barceló watershed and corresponds to the Lliriet ravine (and which is outside the Barceló watershed).
Zone 2 is the territory to the north of the regional railway line. All the maps include this zone as being within the Barceló basin, except for the delimitation we have made from the basic hydrographic analysis and the surface digital model with 1-metre precision (LiDAR). After an exhaustive analysis of the fieldwork, the conclusion is that this portion of land cannot be connected to the Barceló watershed, as the cultivation terraces and railway embankment create an authentic drainage divide (see Figure 7 and Figure 8). The historical cartography reveals the profound man-made alteration of the area and how the drainage pattern has changed.
Zone 3 includes the dividing line between the two urban basins (the Lliriet and Barceló) that flow into the Racó de L’oix neighbourhood in East Benidorm. This area is the most conflictive, as the layout of the basins has been radically altered by recent urban developments that have superimposed a street layout on the hydrographic network (Figure 7).
Finally, zone 4 corresponds to the delimitation of the basin that extends along the south-western slope of the Serra Gelada mountains and where the Benidorm flood plan map excludes a large watershed (thereby eliminating all the water that this mountain range drains to the urban areas). Figure 7 shows that the flooding danger points, as defined by the Benidorm flood plan, coincide with this drainage network descending from the Serra Gelada (which is clearly shown in the LiDAR 1-metre mapping contained in the basic hydrographic analysis made in this work).
The discrepancies analysed are shown on the official maps, which offer the greatest level of detail. If we resort to less detailed maps, such as the master plan for flood defence in the Marina Baja Region, also produced by the Júcar Water Authority but at a smaller scale [51], the differences increase considerably in comparison with those shown so far (see Figure 9).
An analysis of the official geographical information for the Barceló watershed confirms the importance of scale in these small watersheds and the importance of using historical information for the reconstruction of the landscape. The use of the most current and detailed geographic information (the LiDAR flight) and fieldwork is also essential to confirm the results.

5.1. Changes in Landscape and Land Use

The major dynamic of the land use and land cover changes in the Barceló watershed has been net changes and swaps, and these affect rainfed crops, forest and scrub, and artificial surfaces and settlements. This shows a significant change in land use for around 70% of the study area, which, from a quantitative point of view, means the complete disappearance of dry farmland. This disappearance has meant the elimination of almost 50% of the old cultivation terraces (now abandoned, in the process of destruction, or invaded by forest and sclerophyllous scrub). The remaining dry farmland has been replaced by urban development and, to a lesser extent, by irrigated farmland.
From a qualitative point of view, a significant increase in artificial surfaces and infrastructure is notable (see Table 2 and Table 3), and this is an important change if we consider the percentage occupation of this type of land use. This is not the main change from the point of view of surface data; however, it is significant if we consider that artificial areas have increased mainly at the cost of farmland. In the Table 2 the most notable changes have been highlighted in bold.
By analysing the intermediate stages between 1956 and 2021 in the historical aerial photographs, we can see that most of these changes occur from 1986 onwards, as can be seen in the 1980–1986 national flight (Instituto Geográfico Nacional). In other words, the change in land use, shown in Table 3, and the catastrophic events have a certain and worrying relationship.
The concentration of land use and land cover changes has developed, firstly, due to the disappearance of dry farmland in its entirety, which largely gave way to the woodland and forest (dark green on the map in Figure 9) that occupies much of these abandoned and degraded spaces. Secondly, the replacement of some of the old dry farmland terraces (olive groves, carob trees, etc.) and much of the irrigated land by artificial surfaces (an extensive network of motorways, paved roads, housing, and industrial estates), as shown in red in Figure 10, is of such strategic importance that these artificial areas preferentially occupy the areas most attractive to the new economic objectives associated with tourism.

5.2. Runoff Threshold and Its Effect on Land Use and Land Cover Changes

This part of the research is focused on the consequences of the profound change in landscape and land use to determine how they affect the calculation of runoff threshold values (P0).
Table 4 shows the flows have been calculated by applying various hydrometeorological methods (the rational method and a method adapted to small basins in eastern Spain included in IC.5.2) to obtain the value of the runoff threshold for the land uses as interpreted from the 1956 American Flight Series B and for current land uses as verified in the fieldwork (Figure 11). Two types of calculations have been made for current land uses: the first with the total length of the riverbed (including the urban layout in the lower part of the basin) and the second with the layout of the natural riverbed (only including the still-identifiable sections). The results obtained have been compared with the official runoff threshold data that the Ministry entrusted CEDEX (P0 Spain) [52] (Figure 12).
Table 5 shows the peak flows for the Barceló ravine were taken from the hydrographs, as detailed in the master plan for flood defence in the Marina Baja (Estudio de soluciones barrancos Lliriet, Barceló, Murtal y Xixó) [34].
Finally, the flow data obtained from results exp. 1 and 3 in Table 4 was modelled using the Iber 2D hydraulic modelling program. Figure 13 shows the danger spots indicated in the Benidorm flood plan (2022) [36], based on my own modelling with the official hazard categorisation of the Territorial Action Plan for Flood Prevention in the Valencia Region (PATRICOVA) [31].
Figure 14 has been included as a graphic example where the consequences of these events can be visualised on Benidorm’s Levante beach, where the Barceló ravine flows into the sea.

6. Discussion

Official geographical information sources publish differing borders for the Barceló basin, and this represents a fundamental problem. In some cases, such as the basin delimited by the Júcar Water Authority, the differences can be attributed to the scale of work, since the official cartography used for the National System for Mapping Floodable Zones (SNCZI) is made on a general scale for the whole nation, which applies a scale lacking the necessary detail for a small basin. Disparities in the maps of the various local authorities make it necessary to propose a geographical description of the basin that unifies these versions or that clarifies in the metadata how each map should be used in flood studies (as they are official documents).
Although the study area includes a system of the LLiriet and Barceló ravines [51], which flow to the same point, this research focuses on the delimitation of the Barceló basin because it is the best example of the problems that can arise when delimiting a basin that has undergone considerable change.
The land use and land cover change analysis (P-Matrix) shows the profound changes suffered since the 1960s with the implementation of an economic model based on tourism and intensive urban development [32]. These changes in the study area took place in the middle of the last century, when traditional agriculture occupied most of the basin in the form of terraces at the bottom of the ravines. In the aerial photographs of the American Flight (Series B of 1956), we can see the roads that correspond to some of the main current communication routes (the N-332a national road and the regional railway Alicante-Denia) [38] that run perpendicular to the drainage of the river courses.
The drastic transformation of the landscape and the significant level of change in the occupation of the territory explain much of the increase in the danger of flooding. Dry farming was terraced and relied on the infiltration of scarce and spasmodic rainwater into the fields. It was a form of farming oriented towards the retention and use of these flows and captured a large part of the water in circulation to favour the creation of fertile soil from the sedimentation of suspended materials [53,54,55].
The disappearance of this terraced landscape, made for the retention and infiltration of floods, even if replaced by ruined structures invaded by scrub and trees, implies an increase in the water circulating on the surface during the heavy showers typical of the climate of this area (with variations that reflect changes in vegetation) [56].
Moreover, if we consider the multiplication of road infrastructures perpendicular to the flow of water and the expansion of artificial surfaces linked to settlements [57], we can assume an increase in the risk of flooding due to the increased circulation of water, together with the alteration of the watercourses due to the creation of road infrastructures, and, finally, the increased exposure of inhabited areas. All these aspects, as caused by the recent change in land use, must be considered in the calculation of the runoff threshold.
After applying the standardised methods for flow estimation, this precipitation can reach values of 430.9 m3/seg (Table 4). This figure is clearly overestimated because runoff threshold data taken from a mapping of the whole of Spain [52] is unsuitable for small catchments. The half-kilometre-pixel spatial resolution used in this information (Figure 12) produces a highly arbitrary and geographically inaccurate assessment for such small watersheds. Even so, these values could be indicative examples of what may happen if measures are not taken to reduce soil sealing.
The runoff threshold value (P0) calculated for 1956 doubles the P0 value for Spain (Table 4 and Figure 11) based on the official government source for all of Spain. This doubles the resulting flows (from 69.8 m3/seg for a 500-year return period to 134.8 m3/seg using the rational method). When applying the formulas in the method given for drainage in Road Instructions IC.5.2 published by the Spanish Ministry of Works and Planning, we can see how the values shoot up to 430.9 m3/seg for the same 500-year return period.
The report of the flood defence master plan for the Marina Baja reveals that the urban water collector for the Barceló ravine has a capacity of 15 m3/seg. If we compare the capacity of this collector with the calculations obtained previously, we see that it is clearly insufficient, not only for the lowest results but also for the flow for the 500-year return period included in the study of solutions for the Barceló ravine in the master plan for flood defence in the Marina Baja [34].
Faced with this situation, the priority measures implemented are structurally channelling the flow to take it to the sea as quickly as possible. However, the canalization of the final sections, instead of solving the problem, aggravates it [58], since structural solutions not only fail to reduce flood damage [8,59] but also do not provide a response to the challenges of climate change [60]. Annex 2 of the master plan for flood defence in the Marina Baja is dedicated to this ravine and defines a series of non-structural and structural corrective measures for the Barceló and Lliriet channels (which are considered a single system) [51].
The non-structural corrective measures proposed in this plan are very basic (creation of appropriate flood risk mapping, development and approval of Municipal Action Plans for Flood Risk, review of municipal urban planning, and a series of recommendations for promotion and dissemination). It is essential that affected citizens are aware of the risk [61]. However, at no time is any hydro-forestry action or action on runoff to reduce the amount of water reaching the lower part of the basin considered.
Therefore, it is necessary to add integrated management to the specific actions defined in the Benidorm flood plan [36] currently being implemented, such as the conditioning of the rainwater network. It is important to improve rainwater systems dimensioned for intense precipitation in tourist cities [24], such as the case at hand, as included in the management documents consulted; however, these structural measures must be complemented with effective non-structural measures. Figure 13 shows that the danger points in this plan coincide with the watercourses descending from the slopes of the Serra Gelada (to the east of the basin), so in the modelling included in the municipal action plan, it is assumed that the existing rainwater network is well dimensioned (Figure 4). This means that there are discrepancies between the hazards of official documents and the hazards of our own elaboration. A good risk map cannot be made unless the criteria for hazard analysis are unified beforehand.
The renaturalisation of the river beds is not feasible in areas that have undergone such profound changes. However, it would be advisable to reduce runoff by revising municipal plans and adding corrective measures in the middle and upper parts of the basin to the works already carried out in the lower part of the basin. Such measures would reduce soil sealing and so reduce the flow reaching the mouth (where the consequences of flooding are the most severe).
Finally, actions carried out in the middle and upper parts of the basin would have a decisive effect downstream on the volume of water reaching the centre of Benidorm. Likewise, for an integrated management of the basin, it is necessary to agree on measures that integrate the municipalities responsible for the basin, since part of the upper basin, in which there is a considerable degree of occupation, is in the municipality of La Nucia.

7. Conclusions

Much of the city of Benidorm is exposed to the damaging consequences of flash flooding. Rapid urban growth has been associated with a lack of urban planning, a lack of foresight for handling the flows that descend from the surrounding hills, a lack of effective drainage, elevated levels of occupation, and the complete disappearance of the lowest section of the river course. It was not until the flood of 5 October 1971, that a modification to the general city plan prohibited the construction of buildings on the riverbed (but it was still permitted on the slopes and banks of the riverbed). Such measures served little purpose since these fluvial spaces are now completely occupied by urban construction [33].
Most changes in land use are irreversible; however, they can be better adapted through a planning policy that recognises the problem. The affected territories can be made more resilient; this is the line of work followed by the institutions with competence in this field [62]. This implies actions that are more than just structural and can mitigate the consequences of extreme rainfall.
Such watercourses have increased rapidly in artificial areas and on sealed surfaces because of an acceleration of flow, decreased infiltration, and dragging of suspended materials, and there has also been the complete disappearance of farmed areas that caused a deceleration and lamination of flows as well as increased infiltration and sedimentation. In these areas, urban planning should not focus on structural measures alone but on more comprehensive measures for flood prevention while considering the peculiarities of wetlands that have been invaded by the rapid growth of urban developments. Together with essential hydraulic actions, priority must be given to the design of green infrastructure [63,64] in the remaining unsealed areas in the middle and upper basin areas. An understanding of the historical functioning of these watercourses must be applied by creating blue infrastructure [65,66,67] that will help to restore, albeit partially, the historical runoff conditions prior to urban development, at least in those areas that have not yet been sealed. These measures must be agreed upon between all jurisdictions comprising the catchment in order to comply with PATRICOVA specifications, which state that any measure must not increase damage downstream.
We cannot forget that this change in land use is taking place in the context of climate change [5,14,22,25,63,68,69,70,71], where there is an increase and change in the seasonality of rainfall and floods. Therefore, responding appropriately is increasingly urgent; we cannot simply wait for more catastrophic events. It is advisable to avoid easy and short-term solutions. State administrations must diagnose the problems in detail, as has been conducted in the Benidorm flood plan, and take structural and non-structural measures that will mitigate the disastrous consequences of floods and help prevent their aggravation in the future.
Nor must we forget to raise social awareness and work with neighbourhood groups in affected areas by publicising the problem, the solutions, and the remedies that could be adopted in the future to win public support for tackling the problems more effectively.
Although current trends emphasise the importance of downscaling for studies on adaptation to climate change [63], it is essential to use a scale that allows for the integration of neighbouring municipalities in the analysis. These river basins cannot be delimited by local administrative boundaries, and what happens in a neighbouring municipality can severely affect downstream and the river’s mouth.
A better understanding of the functioning of these events is necessary so that we can specify appropriate measures. Maps with inappropriate scales cannot be used without considering the transformations made in the basin due to drastic changes in occupation. Measures must be coordinated between all jurisdictions comprising the catchment in order to comply with PATRICOVA specifications, which state that any measure must not increase damage downstream. It would be highly recommended to support research on the behaviour of floods in these channels and how they impact the new urban fabric. Such research deserves to be conducted with a high level of detail. The capture of data from drones and suitable sensors would enable us to greatly improve the geographical information available. This case study of the Barceló basin in Benidorm illustrates a situation that occurs in many other places in the Spanish Mediterranean, and so the results, discussion, and conclusions of this work and future methodological revisions could help alleviate the serious problem of changed ephemeral watercourses caused by rapid urban growth that is found in many areas of the Mediterranean.
In conclusion, good risk mapping cannot be conducted without accurate hazard delineation. This requires an accurate representation of the area using any techniques (mathematical models, geomorphological analyses, radar interferometry, etc.) that allow a faithful representation of all the elements that modify surface runoff, including road infrastructure.

Author Contributions

Methodology and conceptualization: E.G.-B. and A.R.-M.; supervision: A.R.-M.; processing LULC data: A.R.-M.; flood map analysis: E.G.-B.; formal analysis and investigation: E.G.-B. and A.R.-M.; writing: E.G.-B.; review and editing: A.R.-M.; resources, funding acquisition, and project administration: A.R.-M. All authors have read and agreed to the published version of the manuscript.

Funding

This research includes and extends part of the results of the doctoral thesis “Geographic information variables in flood studies in small altered basins of the southeast peninsular (Spain)” by Estela García, under the supervision of Alfredo Ramon-Morte at the University of Alicante. This doctoral thesis was funded and conducted by the SIOSE-INNOVA Project (CSO2016-79420-R AEI/FEDERUE. Ministry of Science and Innovation. Spain).

Institutional Review Board Statement

Not applicable.

Informed Consent Statement

Informed consent was obtained from all subjects involved in the study.

Data Availability Statement

All researchers involved approve the availability of the data.

Acknowledgments

The authors are grateful to the SIOSE-INNOVA Project for funding and supporting this research, the Segura Hydrographic Confederation (Spanish Ministry for the Ecological Transition), the Instituto Geográfico Nacional (IGN) and Instituto Valenciano de Cartografía (ICV) for the data given on the Barceló ravine ephemeral stream.

Conflicts of Interest

The authors declare no conflict of interest.

References

  1. López García, M.J.; Camarasa Belmonte, A.M.; Mateu Bellés, J.F. Cambios en los usos del suelo y producción de escorrentía en ramblas mediterráneas: Carraixet y Poyo (1956–1998). Boletín Asoc. Geógrafos Españoles 2007, 44, 69–94. [Google Scholar]
  2. Mateu Bellés, J.F. Avenidas y riesgo de inundación en los sistemas fluviales mediterráneos de la Península Ibérica. Boletín Asoc. Geógrafos Españoles 1990, 10, 45–86. [Google Scholar]
  3. Camarasa Belmonte, A.M. Génesis de avenidas en pequeñas cuencas semiáridas: La rambla de poyo (Valencia). Cuad. Geográficos 1990, 48, 81–104. [Google Scholar]
  4. Segura Beltrán, F. Inundaciones de ramblas y barrancos en las tierras valencianas (1980–1999): Causas, procesos y espacios inundables. Série Geográfica 2000, 9, 27–47. Available online: https://ebuah.uah.es/dspace/handle/10017/1091 (accessed on 1 June 2020).
  5. Camarasa Belmonte, A.; Soriano-García, J. Flood risk assessment and mapping in peri-urban Mediterranean environments using hydrogeomorphology. Application to ephemeral streams in the Valencia region (eastern Spain). Landsc. Urban Plan. 2012, 104, 189–200. [Google Scholar] [CrossRef]
  6. Duarte, P. Caracterización hidrogeomorfológica y evaluación del riesgo en un curso efímero mediterráneo: El río Seco (Aragón, España). INDES Rev. Investig. Desarro. Sustentable 2014, 2, 9–19. [Google Scholar]
  7. Bournas, A.; Baltas, E. Investigation of the gridded flash flood Guidance in a Peri-Urban basin in greater Athens area, Greece. J. Hydrol. 2022, 610, 127820. [Google Scholar] [CrossRef]
  8. Pérez-Morales, A.; Gil-Guirado, S.; Quesada García, A. ¿Somos todos iguales ante una inundación? Análisis de la vulnerabilidad social en el litoral mediterráneo español. Boletín Asoc. Geógrafos Españoles 2021, 88, 6. [Google Scholar] [CrossRef]
  9. Gil-Guirado, S.; Pérez-Morales, A.; Olcina Cantos, J. Building risk territories: Evolution of exposure to flood hazard in the coast of the Region of Murcia. Rev. Geogr. N. Gd. 2022, 2022, 407–428. [Google Scholar] [CrossRef]
  10. Gyekye, A. Geomorphic Assessment of Floods within the Urban Environment of Gbawe-Mallam, Accra. Ghana J. Geogr. 2011, 3, 199–229. [Google Scholar]
  11. López-Martínez, F.; Pérez-Morales, A. Influencia del turismo residencial sobre el riesgo de inundación en el litoral de la región de Murcia. Scr. Nova 2017, 21, 1–28. [Google Scholar] [CrossRef]
  12. Karagiorgos, K.; Thaler, T.; Heiser, M.; Hübl, J.; Fuchs, S. Integrated flash flood vulnerability assessment: Insights from East Attica, Greece. J. Hydrol. 2016, 541, 553–562. [Google Scholar] [CrossRef]
  13. Barredo-Cano, J.I. Normalised flood losses in Europe: 1970–2006. Nat. Hazards Earth Syst. Sci. 2009, 9, 97–104. [Google Scholar] [CrossRef]
  14. Illán-Fernandez, E.J.; Pérez-Morales, A.; Romero-Díaz, A. El sellado antropogénico del suelo. Análisis bibliométrico. Cuad. Geográficos 2022, 61, 107–128. [Google Scholar] [CrossRef]
  15. García-Alvarado, J.M.; García-Rodríguez, M.P.; Pérez-Gonzalez, M.E. Sellado de suelos a partir de teledetección y SIG en el Programa de Actuación Urbanística (PAU) del sudeste de Madrid (España). Cuad. Geográficos 2018, 57, 39–60. [Google Scholar] [CrossRef]
  16. Gallegos-Reina, A.; Gómez-Monedero, C. Ciudad Dispersa e Inundaciones en Málaga (España). Los Espacios Fluviales Urbanos Como Vector de Reflexión Sobre la Actividad Humana y su Ocupación del Medio Natural. Inundaciones y Sequías. Análisis Multidiscip. Mitigar Impacto Fenómenos Climáticos Extrem. October, 2021, III Congreso Nacional del Agua. pp. 215–223. Available online: https://riuma.uma.es/xmlui/handle/10630/22982 (accessed on 1 March 2023).
  17. Illán-Fernández, E.J.; Romero-Díaz, A.; Pérez-Morales, A. Fiabilidad en la detección de las superficies selladas empleando datos del programa Copernicus. Boletín Asoc. Geógrafos Españoles 2022, 93, 10. [Google Scholar] [CrossRef]
  18. Martínez-Ibarra, E. La inundación extraordinaria del 12 de octubre de 2007 en Calpe (Alicante, España): Una perspectiva geográfica. Cuad. Geográficos 2010, 87, 89–110. [Google Scholar]
  19. Perles-Roselló, M.J. El riesgo como una construcción social. Vulnerabilidad, adaptación y percepción del riesgo en un área de inundabilidad crónica. Baetica Estud. Hist. Mod. Y Contemp. 1999, 21, 157–175. [Google Scholar]
  20. García-Ruiz, J.M.; López-Moreno, J.I.; Serrano, S.M.V.; Martínez, T.L.; Beguería, S. Mediterranean water resources in a global change scenario. Earth-Sci. Rev. 2011, 105, 121–139. [Google Scholar] [CrossRef]
  21. Olcina Cantos, J. Incremento de episodios de inundación por lluvias de intensidad horaria en el sector central del litoral mediterráneo español: Análisis de tendencias en Alicante. Sémata Cienc. Sociais Humanid. 2017, 29, 143–163. [Google Scholar] [CrossRef]
  22. Camarasa-Belmonte, A.M.; Rubio, M.; Salas, J. Rainfall events and climate change in Mediterranean environments: An alarming shift from resource to risk in Eastern Spain. Nat. Hazards 2020, 103, 423–445. [Google Scholar] [CrossRef]
  23. Pastor, F.; Valiente, J.A.; Estrela, M.J. Sea surface temperature and torrential rains in the Valencia region: Modelling the role of recharge areas. Nat. Hazards Earth Syst. Sci. 2015, 15, 1677–1693. [Google Scholar] [CrossRef]
  24. Miró-Pérez, J.J.; Olcina-Cantos, J. Climatic change and thermal comfort. Effects on the tourism industry in the region of Valencia. Investig. Tur. 2020, 20, 1–30. [Google Scholar] [CrossRef]
  25. Miró-Pérez, J.J.; Estrela, M.J.; Olcina-Cantos, J.; Martin-Vide, J. Future projection of precipitation changes in the júcar and segura river basins (Iberian peninsula) by CMIP5 GCMs local downscaling. Atmosphere 2021, 12, 879. [Google Scholar] [CrossRef]
  26. Gil-Guirado, S.; Pérez-Morales, A.; Pino, D.; Peña, J.C.; Martínez, F.L. Flood impact on the Spanish Mediterranean coast since 1960 based on the prevailing synoptic patterns. Sci. Total Environ. 2022, 807, 150777. [Google Scholar] [CrossRef] [PubMed]
  27. Barredo, J.I.; Saurí, D.; Llasat, M.C. Assessing trends in insured losses from floods in Spain 1971–2008. Nat. Hazards Earth Syst. Sci. 2012, 12, 1723–1729. [Google Scholar] [CrossRef]
  28. Estrela, M.J.; Pastor, F.; Gómez, I. Meteorological Risk Factors and Torrential Precipitation in the Spanish Mediterranean Coast. Advers. Weather. Spain 2013, 15, 108–120. [Google Scholar]
  29. Mellado, L. La interrelación Entre la Ordenación del Territorio y los Nuevos Planteamientos de Gestión de los Riesgos de Inundación. Talavera de la Reina. 2011. Available online: https://fnca.eu/biblioteca-del-agua/directorio/file/1385-1306271427-05-mellado (accessed on 1 March 2023).
  30. Conesa-García, C.; Pérez-Cutillas, P.; García-Lorenzo, R.; Martínez-Salvador, A. Cambios históricos recientes de cauces y llanuras aluviales inducidos por la acción humana. Nimbus 2012, 29–30, 159–176. [Google Scholar]
  31. Generalitat Valenciana. PATRICOVA-Plan de Acción Territorial de Carácter Sectorial Sobre Prevención del Riesgo de Inundación en la Comunidad Valenciana—Normativa; Generalitat Valenciana: Valencia, Spain, 2013.
  32. Martínez-Ibarra, E. Análisis geográfico de inundaciones relámpago en espacios turísticos del norte de la provincia de Alicante. Papeles Geogr. Número monográfico del XV Coloq. Ibérico Geogr. 2017, 65–81. [Google Scholar] [CrossRef]
  33. Amillo, F. Las Inundaciones de Octubre de 1971 en Benidorm, una Catástrofe Previsible. 2015. Available online: https://histobenidorm.blogspot.com (accessed on 1 March 2021).
  34. Confederación Hidrográfica del Júcar (C.H.J.). Plan Director de Defensa Contra las Avenidas en la Comarca de la Marina Baja (Alicante): Estudio de Soluciones Barrancos Lliriet, Barceló, Murtal y Xixó; Ministerio de Agricultura: Madrid, Spain, 2013; pp. 1–343.
  35. Dirección General de Protección Civil. Catálogo Nacional de Inundaciones Históricas (CNIH) asociado a la Base Nacional de Datos sobre Zonas Inundables, de la Dirección General de Protección Civil (2014). 2010. Available online: https://www.proteccioncivil.es/catalogo/naturales/cnih/cnih2014/B4_Actual.html (accessed on 1 March 2021).
  36. Ajuntament de Benidorm. PAM-Plan de Actuación Municipal ante el Riesgo de Inundaciones de Benidorm. 2022. p. 147. Available online: https://benidorm.org/es/ayuntamiento/concejalias/obras/ingenieria/proyectos-ingenieria/plan-actuacion-municipal-ante-riesgo-inundaciones-de-benidorm (accessed on 1 July 2022).
  37. Ayuntamiento de Benidorm. Plan Territorial Municipal Frente a Emergencias de Benidorm; Ayuntamiento de Benidorm: Benidorm, Spain, 2019; p. 100. [Google Scholar]
  38. García-Botella, E. Variables de Información Geográfica en Estudios de Inundabilidad en Pequeñas Cuencas Alteradas del Sureste Peninsular. Ph.D. Thesis, Universidad de Alicante, Alicante, Spain, 2021. [Google Scholar]
  39. Témez-Pelaez, J.R. Cálculo Hidrometeorológico. Caudales Máximos pequeñas cuencas. 1978. Available online: https://www.mitma.es/recursos_mfom/0610400.pdf (accessed on 1 August 2022).
  40. Ministerio de Fomento. Norma 5.2-IC Drenaje Superficial de la Instrucción de Carreteras. Boletín Of. Estado 2016, 60, 18882–19023, BOE-A-2016-2405. Available online: https://www.boe.es/boe/dias/2016/03/10/pdfs/BOE-A-2016-2405.pdf (accessed on 1 March 2016).
  41. Ministerio de Fomento. Resolución de 26 de Marzo de 2018, de la Dirección General de Carreteras, por la que se Actualizan Determinadas Tablas de la Norma 5.2 IC Sobre Drenaje Superficial de la Instrucción de Carreteras. Boletín Of. Estado 2018, 136, 58028–58030, BOE-A-2018-7489. Available online: https://www.boe.es/diario_boe/txt.php?id=BOE-A-2018-7489 (accessed on 1 March 2019).
  42. Ferrer-Polo, F.J. Recomendaciones para el Cálculo Hidrometeorológico de Avenidas, CEDEX. Madrid: CEDEX; Centro de Estudios Hidrográficos: Madrid, Spain, 1993. [Google Scholar]
  43. Olaya-Ferrero, V. Hidrología Computacional y Modelos Digitales del Terreno. 2006. Available online: https://www.hidrosm.com/2021/02/libro-hidrologia-computacional-y.html (accessed on 1 July 2022).
  44. IGN. Documento técnico SIOSE 2014.” D.G. Instituto Geográfico Nacional; Sistema de Información de Ocupación del Suelo en España (SIOSE); Observación del Territorio. S.G de Cartografía Servicio de Ocupación del Suelo; Madrid, 2018; p. 16. Available online: www.siose.es (accessed on 1 July 2022).
  45. Pontius, R.G.; Shusas, E.; McEachern, M. Detecting important categorical land changes while accounting for persistence. Agric. Ecosyst. Environ. 2004, 101, 251–268. [Google Scholar] [CrossRef]
  46. Pineda de Carías, M.C.; Flores, G.; Castro, M.; Jiménez, P.; Reyes, G.; López, E. Cambios importantes en la cobertura de la tierra y análisis de transiciones sistemáticas en un sector del occidente de Honduras. Cienc. Espac. 2015, 8, 469–492. [Google Scholar] [CrossRef]
  47. Camarasa-Belmonte, A.M.; Caballero-López, M.P.; Iranzo-García, E. Cambios de uso del suelo, producción de escorrentía y pérdida de suelo. Sinergias y compensaciones en una rambla mediterránea (Barranc del Carraixet, 1956–2011). Boletín Asoc. Geógrafos Españoles 2018, 2018, 127–153. [Google Scholar] [CrossRef]
  48. Conesa-García, C.; Pérez-Cutillas, P. Alteraciones geomorfológicas recientes en los sistemas fluviales mediterráneos de la península ibérica. Síntomas y problemas de incisión en los cauces. Rev. Geogr. N. Gd. 2014, 2014, 25–44. [Google Scholar] [CrossRef]
  49. Bladé, E.; Cea, L.; Corestein, G.; Escolano, E. Iber: Herramienta de simulación numérica del flujo en ríos. Rev. Int. Métodos Numéricos Cálculo Diseño Ing. 2014, 30, 1–10. [Google Scholar] [CrossRef]
  50. Ramón-Morte, A.; Navarro-Carrión, J.T.; García-Botella, E. Objective Assessment of Land Use in Hydrographical Studies. 2019. Available online: http://rua.ua.es/dspace/handle/10045/101647 (accessed on 1 July 2022).
  51. CHJ. Memoria del Plan Director de Defensa Contra las Avenidas. Comarca de la Marina Baja (Alicante); Ministerio de Agricultura: Madrid, Spain, 2013; p. 343. Available online: https://www.chj.es/es-es/ciudadano/consultapublica/Paginas/PlandirectordefensaavenidasMarinaBaja(Alicante).aspx (accessed on 8 March 2020).
  52. CEDEX. Mapa de Caudales Máximos en Régimen Natural Para toda la España Peninsular. Ministerio de Agricultura y Pesca, Alimentación y Medio Ambiente. 2014. Available online: https://www.miteco.gob.es/es/cartografia-y-sig/ide/descargas/agua/mapa-caudales.aspx (accessed on 1 March 2018).
  53. Morales-Gil, A.; Box-Amorós, M. El aprovechamiento del agua y los suelos en un dominio semiárido: La cuenca del Barranco Blanco. Investig. Geográficas 1986, 4, 7–24. [Google Scholar] [CrossRef]
  54. Marco-Molina, J.A.; Morales-Gil, A. Terrazas de cultivo abandonadas en el sureste peninsular: Aspectos evolutivos. Investig. Geográficas 1995, 13, 81–90. [Google Scholar] [CrossRef]
  55. Hernández Hernández, M.; Morales-Gil, A. Los aprovechamientos tradicionales de las aguas de turbias en los piedemontes del sureste de la península ibérica: Estado actual en tierras alicantinas. Boletín Asoc. Geógrafos Españoles 2013, 63, 105–124. [Google Scholar] [CrossRef]
  56. Marco-Molina, J.A.; Olcina-Cantos, J.; Padilla-Blanco, A.; Rico-Amoros, A.M. Abandono de terrazas de cultivo: Recolonización vegetal y erosión en el sureste peninsular. Cad. Lab. Xeol. de Laxe 1996, 21, 133–146. Available online: https://ruc.udc.es/dspace/handle/2183/6246 (accessed on 1 March 2022).
  57. Vera-Rebollo, J.F.; Marco-Molina, J.A. Impacto de los usos del suelo y erosión en cuencas vertientes del sur del País Valenciano. Investig. Geográficas 1988, 6, 7–31. [Google Scholar] [CrossRef]
  58. Camarasa-Belmonte, A.M.; López-García, M.J.; Soriano, J. Cartografía de vulnerabilidad frente a inundaciones en llanos mediterráneos. Caso de estudio del Barranc de Carraixet y Rambla de Poyo. Ser. Geográfica 2008, 14, 75–91. [Google Scholar]
  59. Pérez-Morales, A.; Gil-Guirado, S.; Olcina-Cantos, J. La información catastral como herramienta para el análisis de la exposición al peligro de inundaciones en el litoral mediterráneo español. EURE 2016, 42, 231–256. Available online: https://www.eure.cl/index.php/eure/article/view/1712/939 (accessed on 1 March 2022). [CrossRef]
  60. Pacetti, T.; Cioli, S.; Castelli, G.; Bresci, E. Planning Nature Based Solutions against urban pluvial flooding in heritage cities: A spatial multi criteria approach for the city of Florence (Italy). J. Hydrol. Reg. Stud. 2022, 41, 101081. [Google Scholar] [CrossRef]
  61. Serrato, A.B.; Gastelum, A.G.; Beltran, C.F.; Cebada, D.P. Percepción del riesgo de inundación por desbordamiento de presa en zona urbana vulnerable. Papeles Geogr. 2016, 62, 77. [Google Scholar] [CrossRef]
  62. Olcina-Cantos, J.; Morote-Seguido, Á.F.; Hernández-Hernández, M. Assessment of natural hazards in urban planning policies of the municipalities in the province of Alicante (Spain). Legislation and risk mapping. Cuad. Geográficos 2018, 57, 152–176. [Google Scholar] [CrossRef]
  63. Kim, J.; Lee, J.; Hwang, S.; Kang, J. Urban flood adaptation and optimization for net-zero: Case study of Dongjak-gu, Seoul. J. Hydrol. Reg. Stud. 2022, 41, 101110. [Google Scholar] [CrossRef]
  64. Prieto-Cerdán, A.P. Infraestructura Verde Como Instrumento de Ordenación del Territorio: Análisis multiescalar. 2021. p. 328. Available online: http://hdl.handle.net/10045/119631 (accessed on 1 March 2022).
  65. Ollero-Ojeda, A.; Conesa-García, C.; Vidal-Abarca, M.R. Buenas Prácticas en Gestión y Restauración de Cursos Efímeros Mediterráneos: Resiliencia y Adaptación al Cambio Climático, no. September. 2021. Available online: https://www.researchgate.net/publication/354850113_BUENAS_PRACTICAS_EN_GESTION_Y_RESTAURACION_DE (accessed on 1 September 2022).
  66. Magdaleno-Mas, F.M.; Cortés-Sánchez, F.M.; Martín, B.M. Infraestructuras verdes y azules: Estrategias de adaptación y mitigación ante el cambio climático. Rev. Digit. Cedex 2018, 191, 105–112. Available online: http://ingenieriacivil.cedex.es/index.php/ingenieria-civil/article/view/2350 (accessed on 1 September 2022).
  67. Yacamán-Ochoa, C.; Mata-Olmo, R. Infraestructura verde, un instrumento renovador para mejorar la resiliencia urbana. Una propuesta para el sur metropolitano de Madrid. In Naturaleza, Territorio y Ciudad en un Mundo Global; AGE—Asociación de Geografos de España: Madrid, Spain, 2017; pp. 579–588. [Google Scholar]
  68. Pérez-Morales, A.; Gil-Guirado, S.; Martínez-García, V. Dasimetry Dash Flood (DDF). A method for population mapping and flood exposure assessment in touristic cities. Appl. Geogr. 2022, 142, 102683. [Google Scholar] [CrossRef]
  69. Alfonso-Torreño, A.; Schnabel, S. Variación espacial de las precipitaciones en una pequeña cuenca hidrográfica del suroeste de España. Geographicalia 2017, 69, 65. [Google Scholar] [CrossRef]
  70. Gallegos-Reina, A.; Perles-Roselló, M.J. Problems and weaknesses of Spanish coastal peri-urban areas with regard to natural risks: Applied analysis in the province of Malaga. Ciudad y Territ. Estud. Territ. 2022, 53, 97–114. [Google Scholar] [CrossRef]
  71. Olcina-Cantos, J. Cambio climático y riesgos climáticos en el litoral mediterráneo. Oportunidades para la geografía. Doc. D’anàlisi Geogràfica 2020, 66, 159. [Google Scholar] [CrossRef]
Figure 1. Location map (Europe, Spain, Valencia Region). Source: Institut Cartográfic Valencià.
Geosciences 13 00247 g001
Figure 2. Geomorphological hazard zones are shown in brown. Source: Territorial Action Plan for Flood Prevention in the Valencia Region [31].
Geosciences 13 00247 g002
Figure 3. Cumulative flood events (1971–2022).
Geosciences 13 00247 g003
Figure 4. In the municipal action plan for the risk of flooding in Benidorm, approved in 2022 [36], 8 of the 21 danger spots are located within the Barceló ravine (points 2 to 9 out of a total of 21).
Geosciences 13 00247 g004
Figure 5. Outline of the methodology.
Geosciences 13 00247 g005
Figure 6. Top left (A), the watershed calculated from a digitisation of the planimetric sketches (catastrones); top right (B), the watershed shown in the Benidorm flood plan; bottom left (C), the basin calculated from a basic hydrographical analysis based on the 1-m digital terrain model; and bottom right (D), the watershed as officially defined by the Júcar Water Authority.
Geosciences 13 00247 g006
Figure 7. Representation of all the watersheds–highlighting the areas where the disparity between the delimitations is greatest. Two details from points 2 and 3 are included.
Geosciences 13 00247 g007
Figure 8. The railway that divides the basin. Authors.
Geosciences 13 00247 g008
Figure 9. The watershed of the study area is shown in the master plan for flood defence in Marina Baja [51].
Geosciences 13 00247 g009
Figure 10. (left) land uses in the Barceló watershed in 1956 from the photointerpretation of the American Flight Series B; (right) the correction of the land uses in the SIOSE Land Occupation in Spain database from a photointerpretation of the Instituto Geográfico Nacional flight of 2021.
Geosciences 13 00247 g010
Figure 11. Runoff thresholds from the sources used.
Geosciences 13 00247 g011
Figure 12. Runoff threshold map for the Barceló watershed. Source: official mapping for Spain [52].
Geosciences 13 00247 g012
Figure 13. Results of the hydraulic modelling carried out with the IBER application using runoff values from 1956 (left map) and 2021 (right map). The relief modelling has been carried out based on a DEM with an accuracy of 1 metre. Authors.
Geosciences 13 00247 g013
Figure 14. Flooding on 5 October 2014 at Benidorm’s eastern beach, in the Racó de L’oix and La Carxana neighbourhoods. This sector of the beach is affected by every event, the most recent of which was on 19 September 2022. Source: BY CC Meteored, Tiempo.com.
Geosciences 13 00247 g014
Table 1. Calculation of land use and land cover change (LULC) parameters according to the methodology in [45,46] Authors.
LULC Gain (G%)Loss (D%)Total Change (TC%)Swap (S%)Net Changes (NC%)
1 LULC ClassG1L1TC1 = G1 + L1S1 = 2 × min (G1 & L1)CN1 = │G1-L1│
n LULC ClassGnLnTCn = Gn + LnSn = 2 × min (Gn & Ln)CNn = │Gn-Ln│
TotalsG1 + … + GnL1 + … + Ln(TC1 + … + TCn)/2(S1 + … + Sn)/2(CN1 + … + CNn)/2
Table 2. Land use change trend analysis table (1956–2021), Barceló watershed. Authors.
LULCGain
(%)
Loss
(%)
Total Change
(%)
Swap
(%)
Net Changes (%)Persistence
(%)
Artificial Surface–Settlements37.340.0237.360.0437.327.47
Irrigated crops6.3813.0619.4412.756.698.35
Rainfed crops052.9052.90052.900
Forest and scrub26.884.6131.499.2322.2613.59
Totals70.5970.5970.5911.0759.5929.41
Table 3. P transition matrix table (land use and land cover changes, P MATRIX) of land use changes (1956–2021) for the Barceló watershed. Authors.
2021
Artificial Surface–SettlementsIrrigated CropsRainfed CropsForest and ScrubTotals
(1956)
Loss ↓
(Ha)
1956 Artificial Surface–Settlements114.300.122400.16114.580.28
Irrigated crops129.56127.77070.28327.61199.84
Rainfed crops372.1196.460340.7809.27809.27
Forest and scrub69.620.950207.84278.4170.57
Totals (2021) 685.59225.300619.021529.871079.96
Gain (Ha) 527.2997.530411.141079.97Persistence = 449.91
Table 4. Runoff threshold results and flow rates calculated from sources for the Barceló ravine.
SourceMethodArea Watershed
(Km2)
Length Stream
(Km)
ExperimentT.25
Years
T.100
Years
T.500
Years
P0 (mm)
Rain (128 mm)(165 mm)(235 mm)
Land use 1956Rational method11.017.25Exp–116.632.669.827.43
Land use 2021Rational method
IC.5.2.
(2016)
12.426.03Exp–228.451.50103.522.21
12.426.03Exp–328.4103.4246.0
12.428.16Exp–424.544.589.5
12.428.16Exp–524.588.1210.6
P0 SpainRational method12.226.13Exp–644.573.5134.814.75
IC.5.2.
(2014)
12.226.13Exp–744.5183.9430.9
Table 5. Peak flows for the Barceló ravine, plan for flood defence in the Marina Baja [34].
Return PeriodT.25 YearsT.100 YearsT.500 Years
Specific discharge4 mm12 mm25 mm
Disclaimer/Publisher’s Note: The statements, opinions and data contained in all publications are solely those of the individual author(s) and contributor(s) and not of MDPI and/or the editor(s). MDPI and/or the editor(s) disclaim responsibility for any injury to people or property resulting from any ideas, methods, instructions or products referred to in the content.

