


Geological and Climatic Factors Affecting the Correlation between Electrical Resistivity and SPT N-Value in Sandy Soils of Phuket, Thailand

 ,
,  ,
,
Abstract
:1. Introduction
2. Site Description
3. Methods
3.1. SPT N-Value Data Collection and VES Surveys
3.2. Data Classifications and Validation
3.3. Regression Analysis
4. Results and Discussion
4.1. The Relationship between SPT N-Value and Electrical Resistivity
4.2. Developed Correlation between SPT N-Value and Electrical Resistivity Due to Geological and Climate Classifications
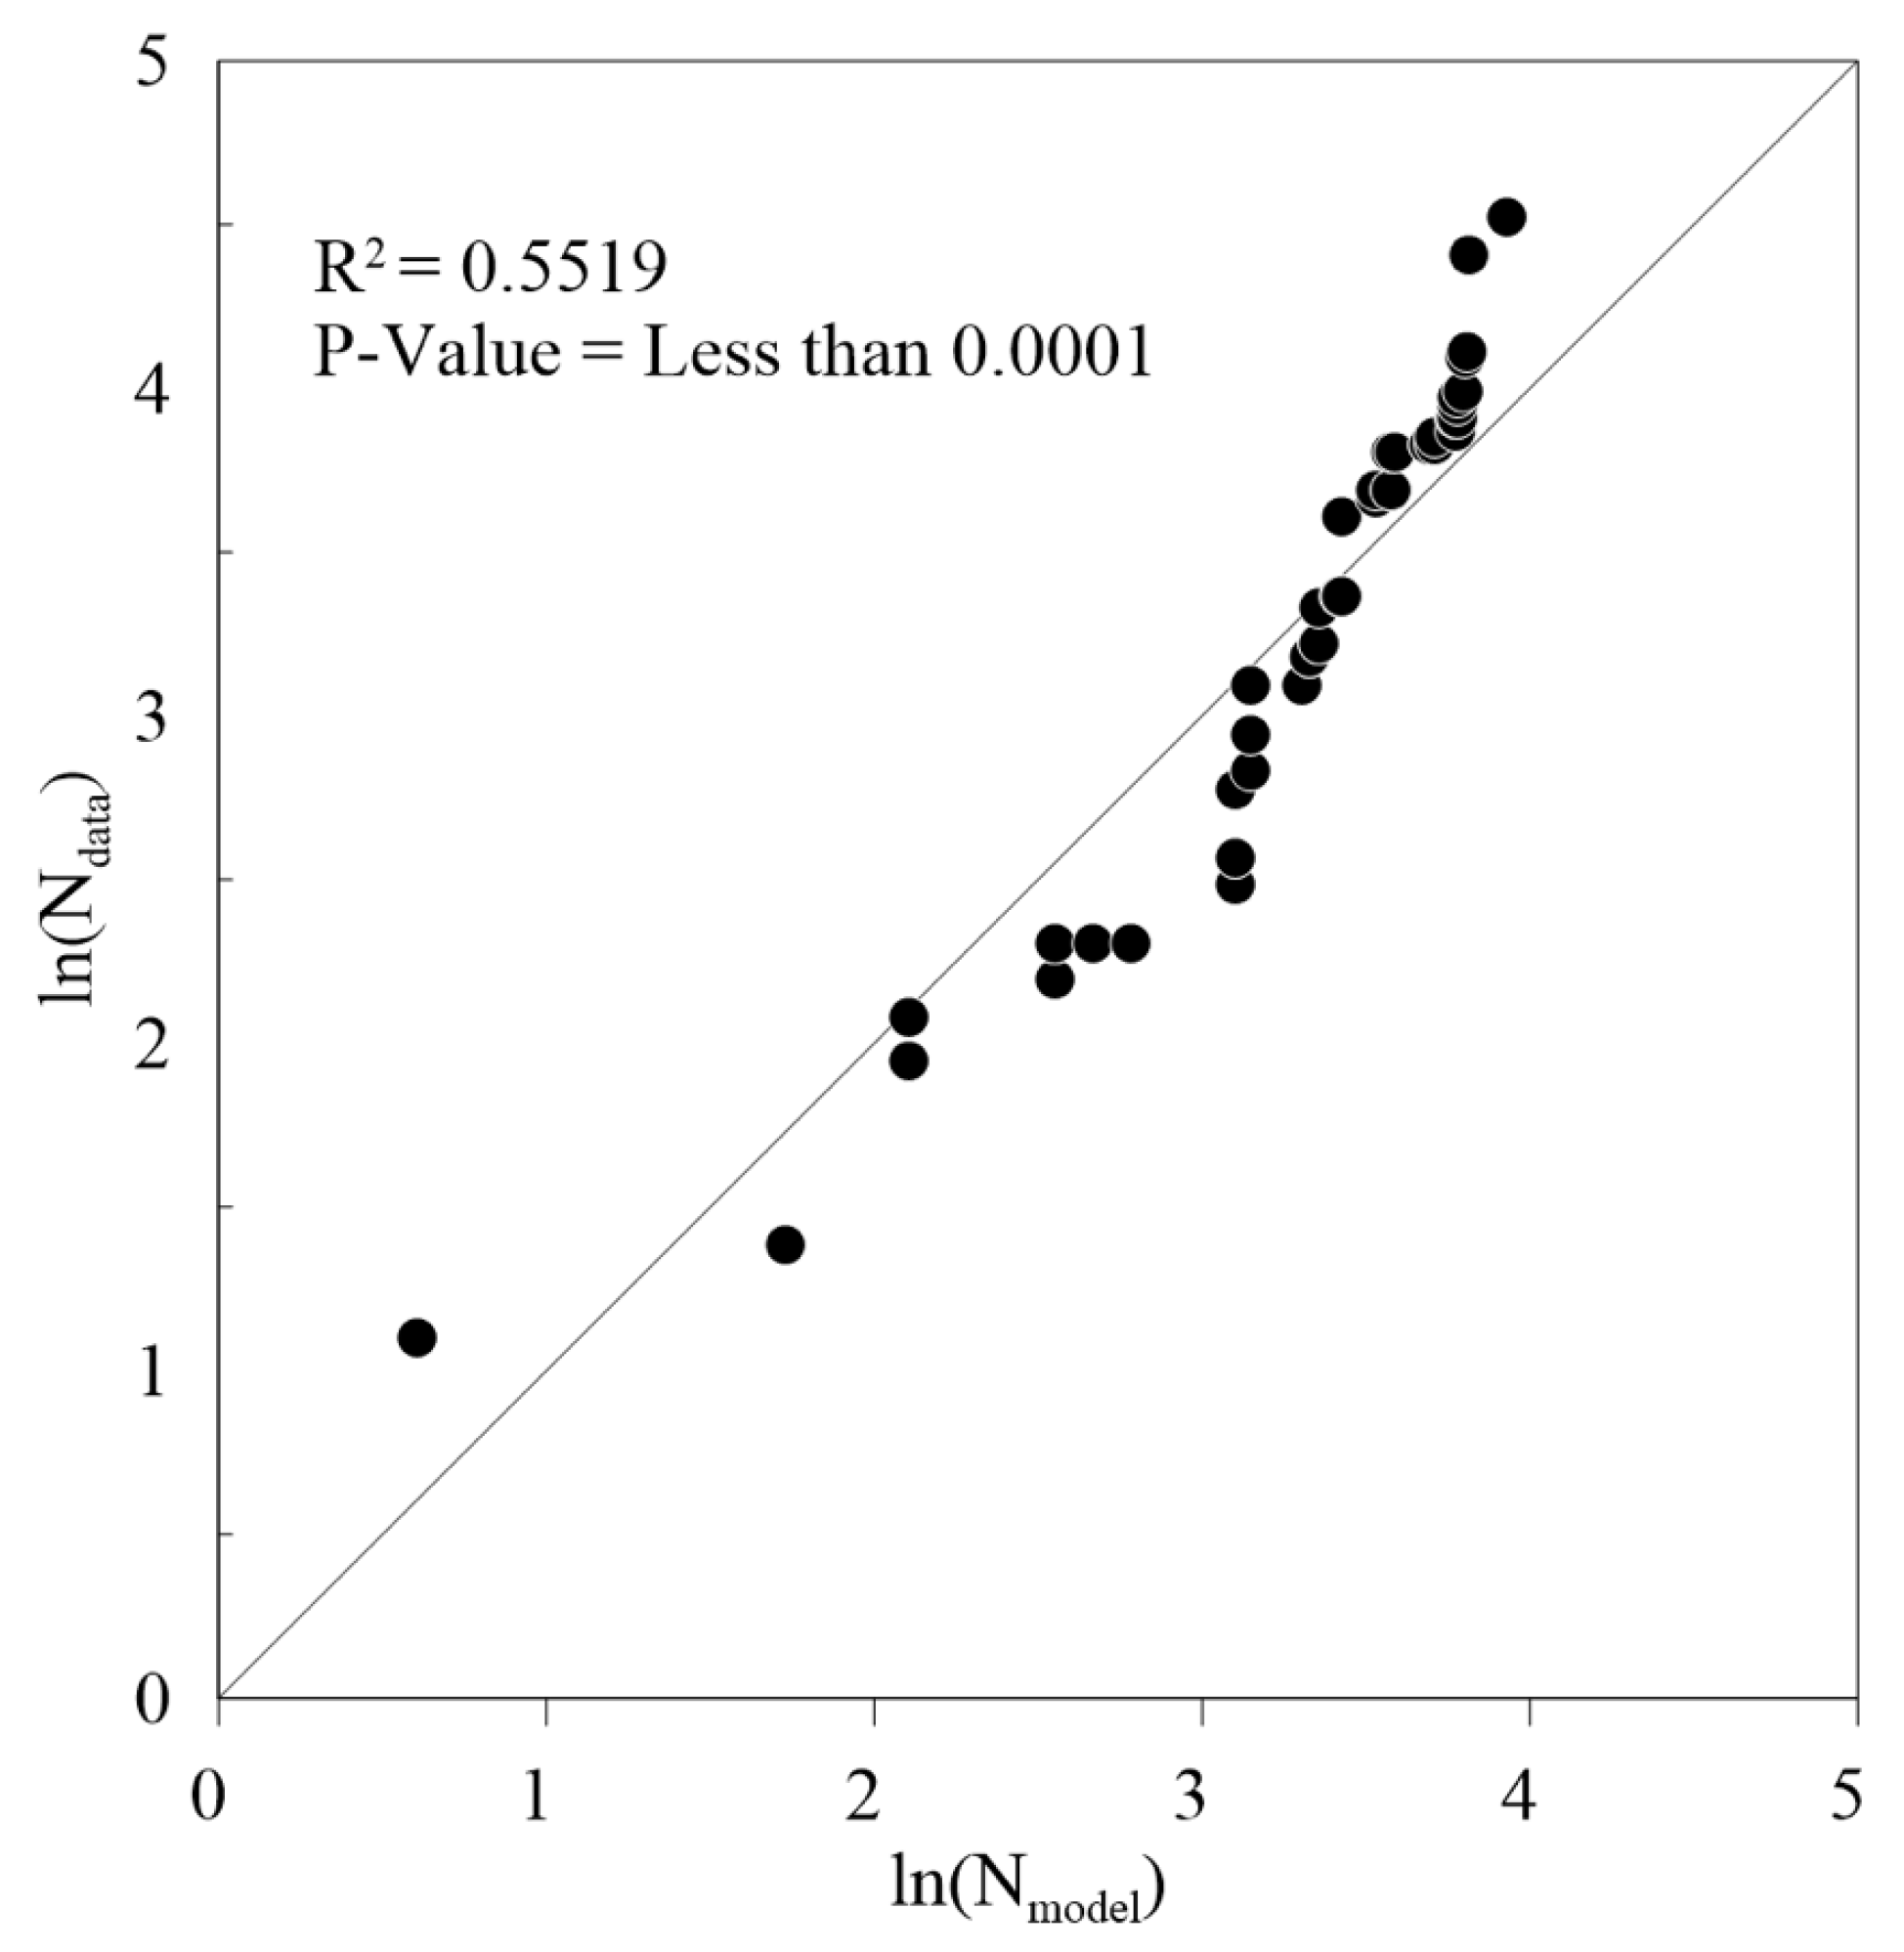
4.3. Validation and Interpretation Results from Classifications
5. Conclusions
- The SPT N-value does not present a clear and unambiguous correlation with electrical resistivity in the absence of data classifications.
- The association between the SPT N-value and electrical resistivity was shown to be stronger (R2 increases from 0.0171 to 0.1721) with bedrock categorization of the data.
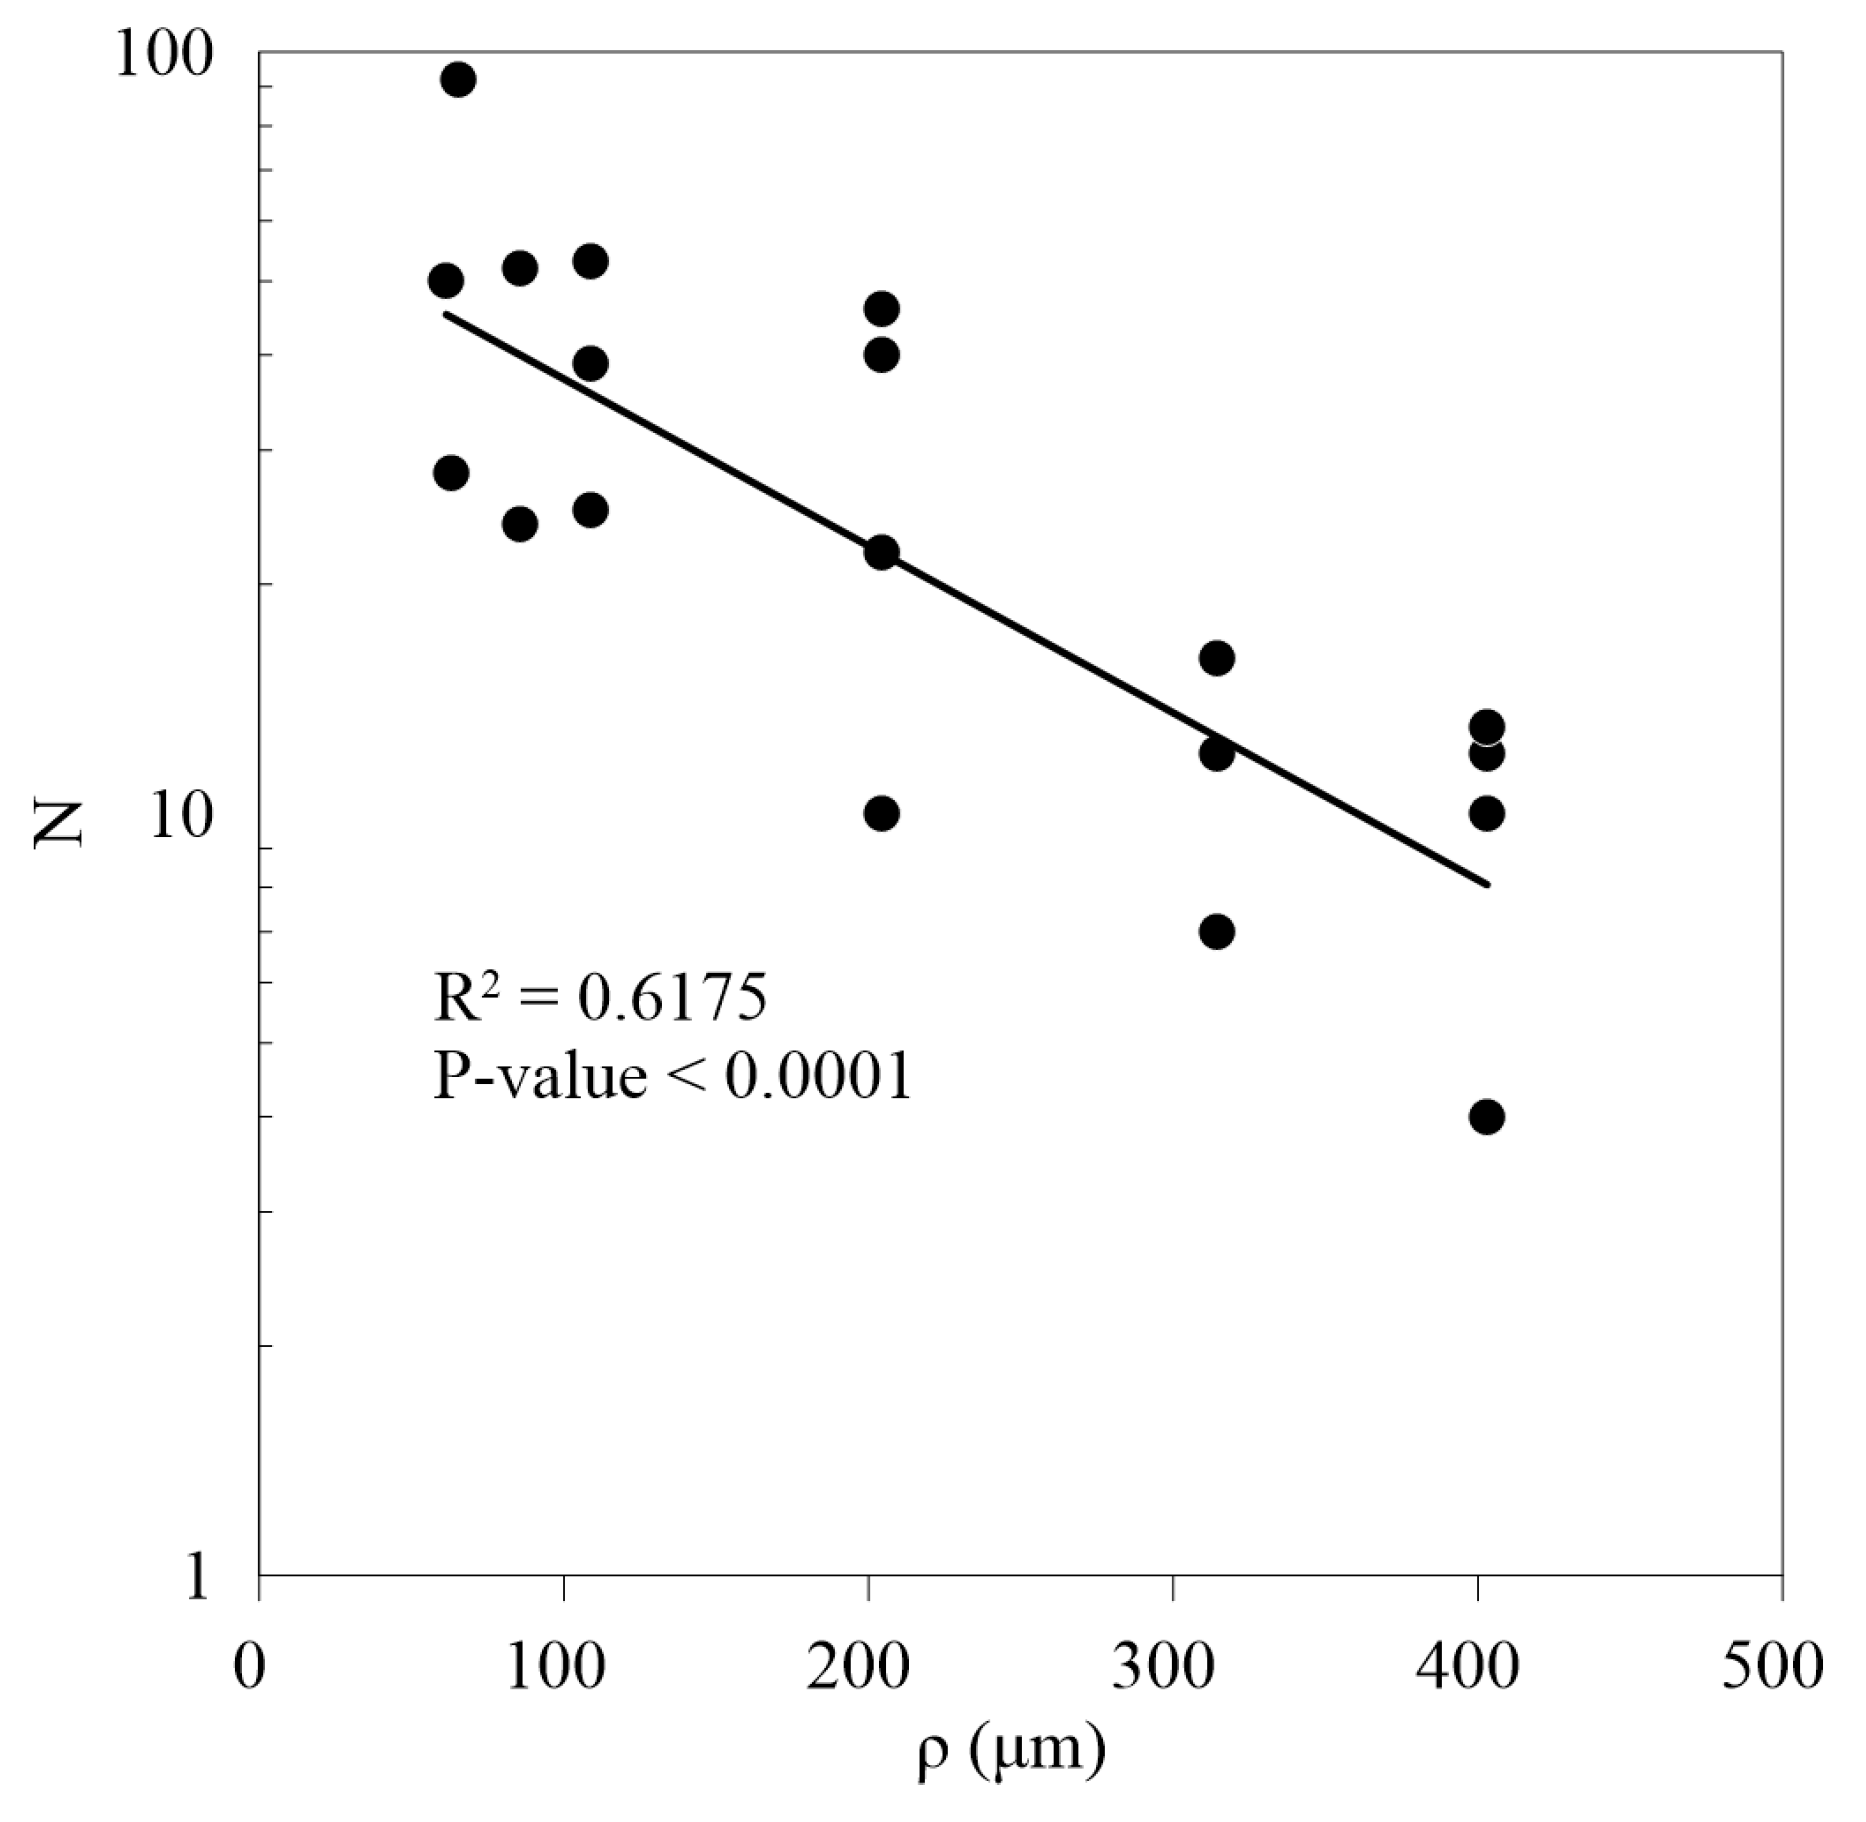
- An exponential function can be used to express the relationship based on the data classification of geology and climate factors, with a best-fit line through the data (R2 = 0.6175). Electrical resistance increased while the SPT N-value decreased.
- The results demonstrated that when correlation studies between the SPT N-value and electrical resistivity are conducted, the geology and the climate of the data are significant factors.
Author Contributions
Funding
Data Availability Statement
Acknowledgments
Conflicts of Interest
Nomenclature
| SPT | Standard penetration test |
| VES | Vertical electric sounding |
| N | SPT N-value |
| Electrical resistivity | |
| Ohmmeter | |
| Coefficient of determination | |
| Meter | |
| SGR | Saturation growth rate |
References
- Siddiqui, F.I.; Osman, B.A. Integrating Geo-Electrical and Geotechnical Data for Soil Characterization. Int. J. Appl. Phys. Math. 2012, 2, 104–106. [Google Scholar] [CrossRef] [Green Version]
- Hegde, A.; Anand, A. Resistivity Correlations with SPT-N and Shear Wave Velocity for Patna Soil in India. Indian Geotech. J. 2022, 52, 161–173. [Google Scholar] [CrossRef]
- Gonçalves, J.T.D.; Botelho, M.A.B.; Machado, S.L.; Netto, L.G. Correlation between field electrical resistivity and geotechnical SPT blow counts at tropical soils in Brazil. Environ. Chall. 2021, 5, 1–12. [Google Scholar] [CrossRef]
- Panjamani, A.P.; Ingale, S.G. Status quo of Standard Penetration Test in India: A Review of Field Practices and Suggestions to Incorporate in IS 2131. Indian Geotech. J. 2021, 51, 421–434. [Google Scholar] [CrossRef]
- Hore, R.; Chakraborty, S.; Arefin, M.R.; Ansary, M.A. CPT & SPT Tests in assessing liquefaction potential. Geotech. Eng. J. SEAGS AGSSEA 2020, 51, 61–68. [Google Scholar]
- Devi, A.; Israil, M.; Anbalagan, R.; Gupta, P.K. Subsurface soil characterization using geoelectrical and geotechnical investigations at a bridge site in Uttarakhand Himalayan region. J. Appl. Geophys. 2017, 144, 78–85. [Google Scholar] [CrossRef]
- Archie, G.E. The Electrical Resistivity Log as an Aid in Determining Some Reservoir Characteristics. Trans. AIME 1942, 146, 54–62. [Google Scholar] [CrossRef]
- Kowalczyk, S.; Maślakowski, M.; Tucholka, P. Determination of the correlation between the electrical resistivity of non-cohesive soils and the degree of compaction. J. Appl. Geophys. 2014, 110, 43–50. [Google Scholar] [CrossRef]
- Jusoh, H.; Osman, S.B.S. The Correlation between Resistivity and Soil Properties as an Alternative to Soil Investigation. Indian J. Sci. Technol. 2017, 10, 1–5. [Google Scholar] [CrossRef] [Green Version]
- Bin Razali, M.N.F.; bin Syed Osman, S.B.A. Non-quantitative correlation of soil resistivity with some soil parameters. In Proceedings of the National Postgraduate Conference, Perak, Malaysia, 19–20 September 2011; pp. 1–4. [Google Scholar]
- Siddiqui, F.I.; Osman, S.B.A.B.S. Simple and multiple regression models for relationship between electrical resistivity and various soil properties for soil characterization. Environ. Earth Sci. 2013, 70, 259–267. [Google Scholar] [CrossRef]
- Osman, S.B.S.; Fikri, M.N.; Siddique, F.I. Correlation of Electrical Resistivity with Some Soil Parameters for the Development of Possible Prediction of Slope Stability and Bearing Capacity of Soil using Electrical Parameters. Pertanika J. Sci. Technol. 2014, 22, 139–152. [Google Scholar]
- Osman, S.B.S.; Siddique, F.I. Possible Assessment of Slope Stability by Using Electrical Resistivity: Comparison of Field and Laboratory Results. IACSIT Int. J. Eng. Technol. 2015, 7, 386–389. [Google Scholar] [CrossRef] [Green Version]
- Lin, J.; Cai, G.; Liu, S.; Puppala, A.J.; Zou, H. Correlations Between Electrical Resistivity and Geotechnical Parameters for Jiangsu Marine Clay Using Spearman’s Coefficient Test. Int. J. Civ. Eng. 2017, 15, 419–429. [Google Scholar] [CrossRef]
- Kizhlo, M.; Kanbergs, A. Research of the parameter changes of the grounding system. In Proceedings of the World Non-Grid-Connected Wind Power and Energy Conference, Nanjing, China, 24–26 September 2009; pp. 1–4. [Google Scholar] [CrossRef]
- Islam, I.; Ahmed, W.; Rashid, M.U.; Orakzai, A.U.; Ditta, A. Geophysical and geotechnical characterization of shallow subsurface soil: A case study of University of Peshawar and surrounding areas. Arab. J. Geosci. 2020, 13, 949. [Google Scholar] [CrossRef]
- Pazha, H.; Muhammad, F.H.; Agustina, A.D.; Wiratama, R. The Identification of Hard Bottom Surface Structure using Correlation of Geoelectrical Resistivity Methods and SPT Data as Preliminary Studies for Laying the Foundation at Passing Cross Sumatera Toll Road, South Lampung Station. J. Phys. Conf. Ser. 2019, 1155, 012007. [Google Scholar] [CrossRef]
- Alel, M.N.A.; Upom, M.R.A.; Abdullah, R.A.; Abidin, M.H.Z. Estimating SPT-N Value Based on Soil Resistivity using Hybrid ANN-PSO Algorithm. J. Phys. Conf. Ser. 2018, 995, 012035. [Google Scholar] [CrossRef] [Green Version]
- Hatta, K.A.; Osman, S.B.A.S. Correlation of Electrical Resistivity and SPT-N value from Standard Penetration Test (SPT) of Sandy Soil. Appl. Mech. Mater. 2015, 785, 702–706. [Google Scholar] [CrossRef]
- Tan, S.N.M.A.; Tonnizam, M.E.; Saad, R.; Dan, M.F.M.; Nordiana, M.M.; Hazreek, Z.A.M.; Madun, A. Correlation of Resistivity Value with Geotechnical N-Value of Sedimentary Area in Nusajaya, Johor, Malaysia. J. Phys. Conf. Ser. 2018, 995, 012079. [Google Scholar] [CrossRef] [Green Version]
- Sudha, K.; Israil, M.; Mittal, S.; Rai, J. Soil characterization using electrical resistivity tomography and geotechnical investigations. J. Appl. Geophys. 2009, 67, 74–79. [Google Scholar] [CrossRef]
- Saunders, M.K.; Fookes, M.G. A review of the relationship of rock weathering and climate and its significance to foundation engineering. Eng. Geol. 1970, 4, 289–325. [Google Scholar] [CrossRef]
- Chanyotha, S.; Kranrod, C.; Tokonami, S.; Suwankot, N.; Pangza, K.; Pornnumpa, C. Terrestrial Gamma Radiation in Phuket Island, Thailand. Eng. J. 2011, 15, 65–76. [Google Scholar] [CrossRef]
- Brown, G.F.; Buravas, S.; Charaljavanaphet, J.; Jalichandra, N.; Johnston, W.D., Jr.; Sresthaputra, V.; Taylor, G.C., Jr. Geologic Reconnaissance of the Mineral Deposits of Thailand; Geological Survey: Washington, DC, USA, 1951; pp. 3–20. [Google Scholar] [CrossRef]
- Mayakun, J.; Kim, J.H.; Prathep, A. Effects of herbivory and the season of disturbance on algal succession in a tropical intertidal shore, Phuket, Thailand. Phycol. Res. 2010, 58, 88–96. [Google Scholar] [CrossRef]
- Puttiwongrak, A.; Men, R.; Vann, S.; Hashimoto, K.; Suteerasak, T. Application of Geoelectrical Survey and Time-Lapse Resistivity with Groundwater Data in Delineating a Groundwater Potential Map: A Case Study from Phuket Island, Thailand. Sustainability 2021, 14, 397. [Google Scholar] [CrossRef]
- Vijarnsorn, P.; Fehrenbacher, J.B. Characteristics and classification of three granite derived soils in Peninsular Thailand. Geoderma 1973, 9, 105–118. [Google Scholar] [CrossRef]
- Neyamadpour, A.; Abdullah, W.A.; Taib, S.; Neyamadpour, B. Comparison of Wenner and dipole–dipole arrays in the study of an underground three-dimensional cavity. J. Geophys. Eng. 2010, 7, 30–40. [Google Scholar] [CrossRef]
- Zou, K.H.; Tuncali, K.; Silverman, S.G. Correlation and Simple Linear Regression. Radiology 2003, 227, 617–628. [Google Scholar] [CrossRef] [Green Version]


| Area | District | SPT Station | Borehole | Depth (m) | Number of Data | |
|---|---|---|---|---|---|---|
| I | Mai Khao | SPT 1 | BH 1-1 | 1.50–26.00 | 14 | 41 |
| BH 1-2 | 1.50–24.50 | 13 | ||||
| BH 1-3 | 1.50–24.50 | 14 | ||||
| II | Choeng Thale | SPT 2 | BH 2-1 | 1.50–23.00 | 5 | 5 |
| III | Ratsada | SPT 3 | BH 3-1 | 1.50–5.00 | 4 | 20 |
| BH 3-2 | 2.50–8.00 | 3 | ||||
| BH 3-3 | 1.50–5.00 | 5 | ||||
| BH 3-4 | 1.50–2.50 | 3 | ||||
| BH 3-5 | 1.50–11.00 | 5 | ||||
| IV | Kathu | SPT 4 | BH 4-1 | 0.50–5.50 | 6 | 18 |
| BH 4-2 | 0.50–5.50 | 6 | ||||
| BH 4-3 | 0.50–5.50 | 6 | ||||
| Area | District | VES Station | Depth (m) | Length (m) | Spacing (m) | Array | Number of Data | |
|---|---|---|---|---|---|---|---|---|
| I | Mai Khao | VES 1-1 | 1.50–26.00 | 8.67–150.30 | 2.89–50.10 | Wenner | 14 | 28 |
| VES 1-2 | 1.50–26.00 | 8.67–150.30 | 2.89–50.10 | Wenner | 14 | |||
| II | Choeng Thale | VES 2-1 | 1.50–23.00 | 8.67–132.96 | 2.89–44.32 | Wenner | 5 | 10 |
| VES 2-2 | 1.50–23.00 | 8.67–132.96 | 2.89–44.32 | Wenner | 5 | |||
| III | Ratsada | VES 3-1 | 1.50–11.00 | 8.67–63.59 | 2.89–21.20 | Wenner | 5 | 5 |
| IV | Kathu | VES 4-1 | 0.50–5.50 | 2.89–31.80 | 0.96–10.60 | Wenner | 6 | 6 |
| Area | District | Station | Geology | Climate | |||
|---|---|---|---|---|---|---|---|
| SPT | VES | SPT | VES | SPT | VES | ||
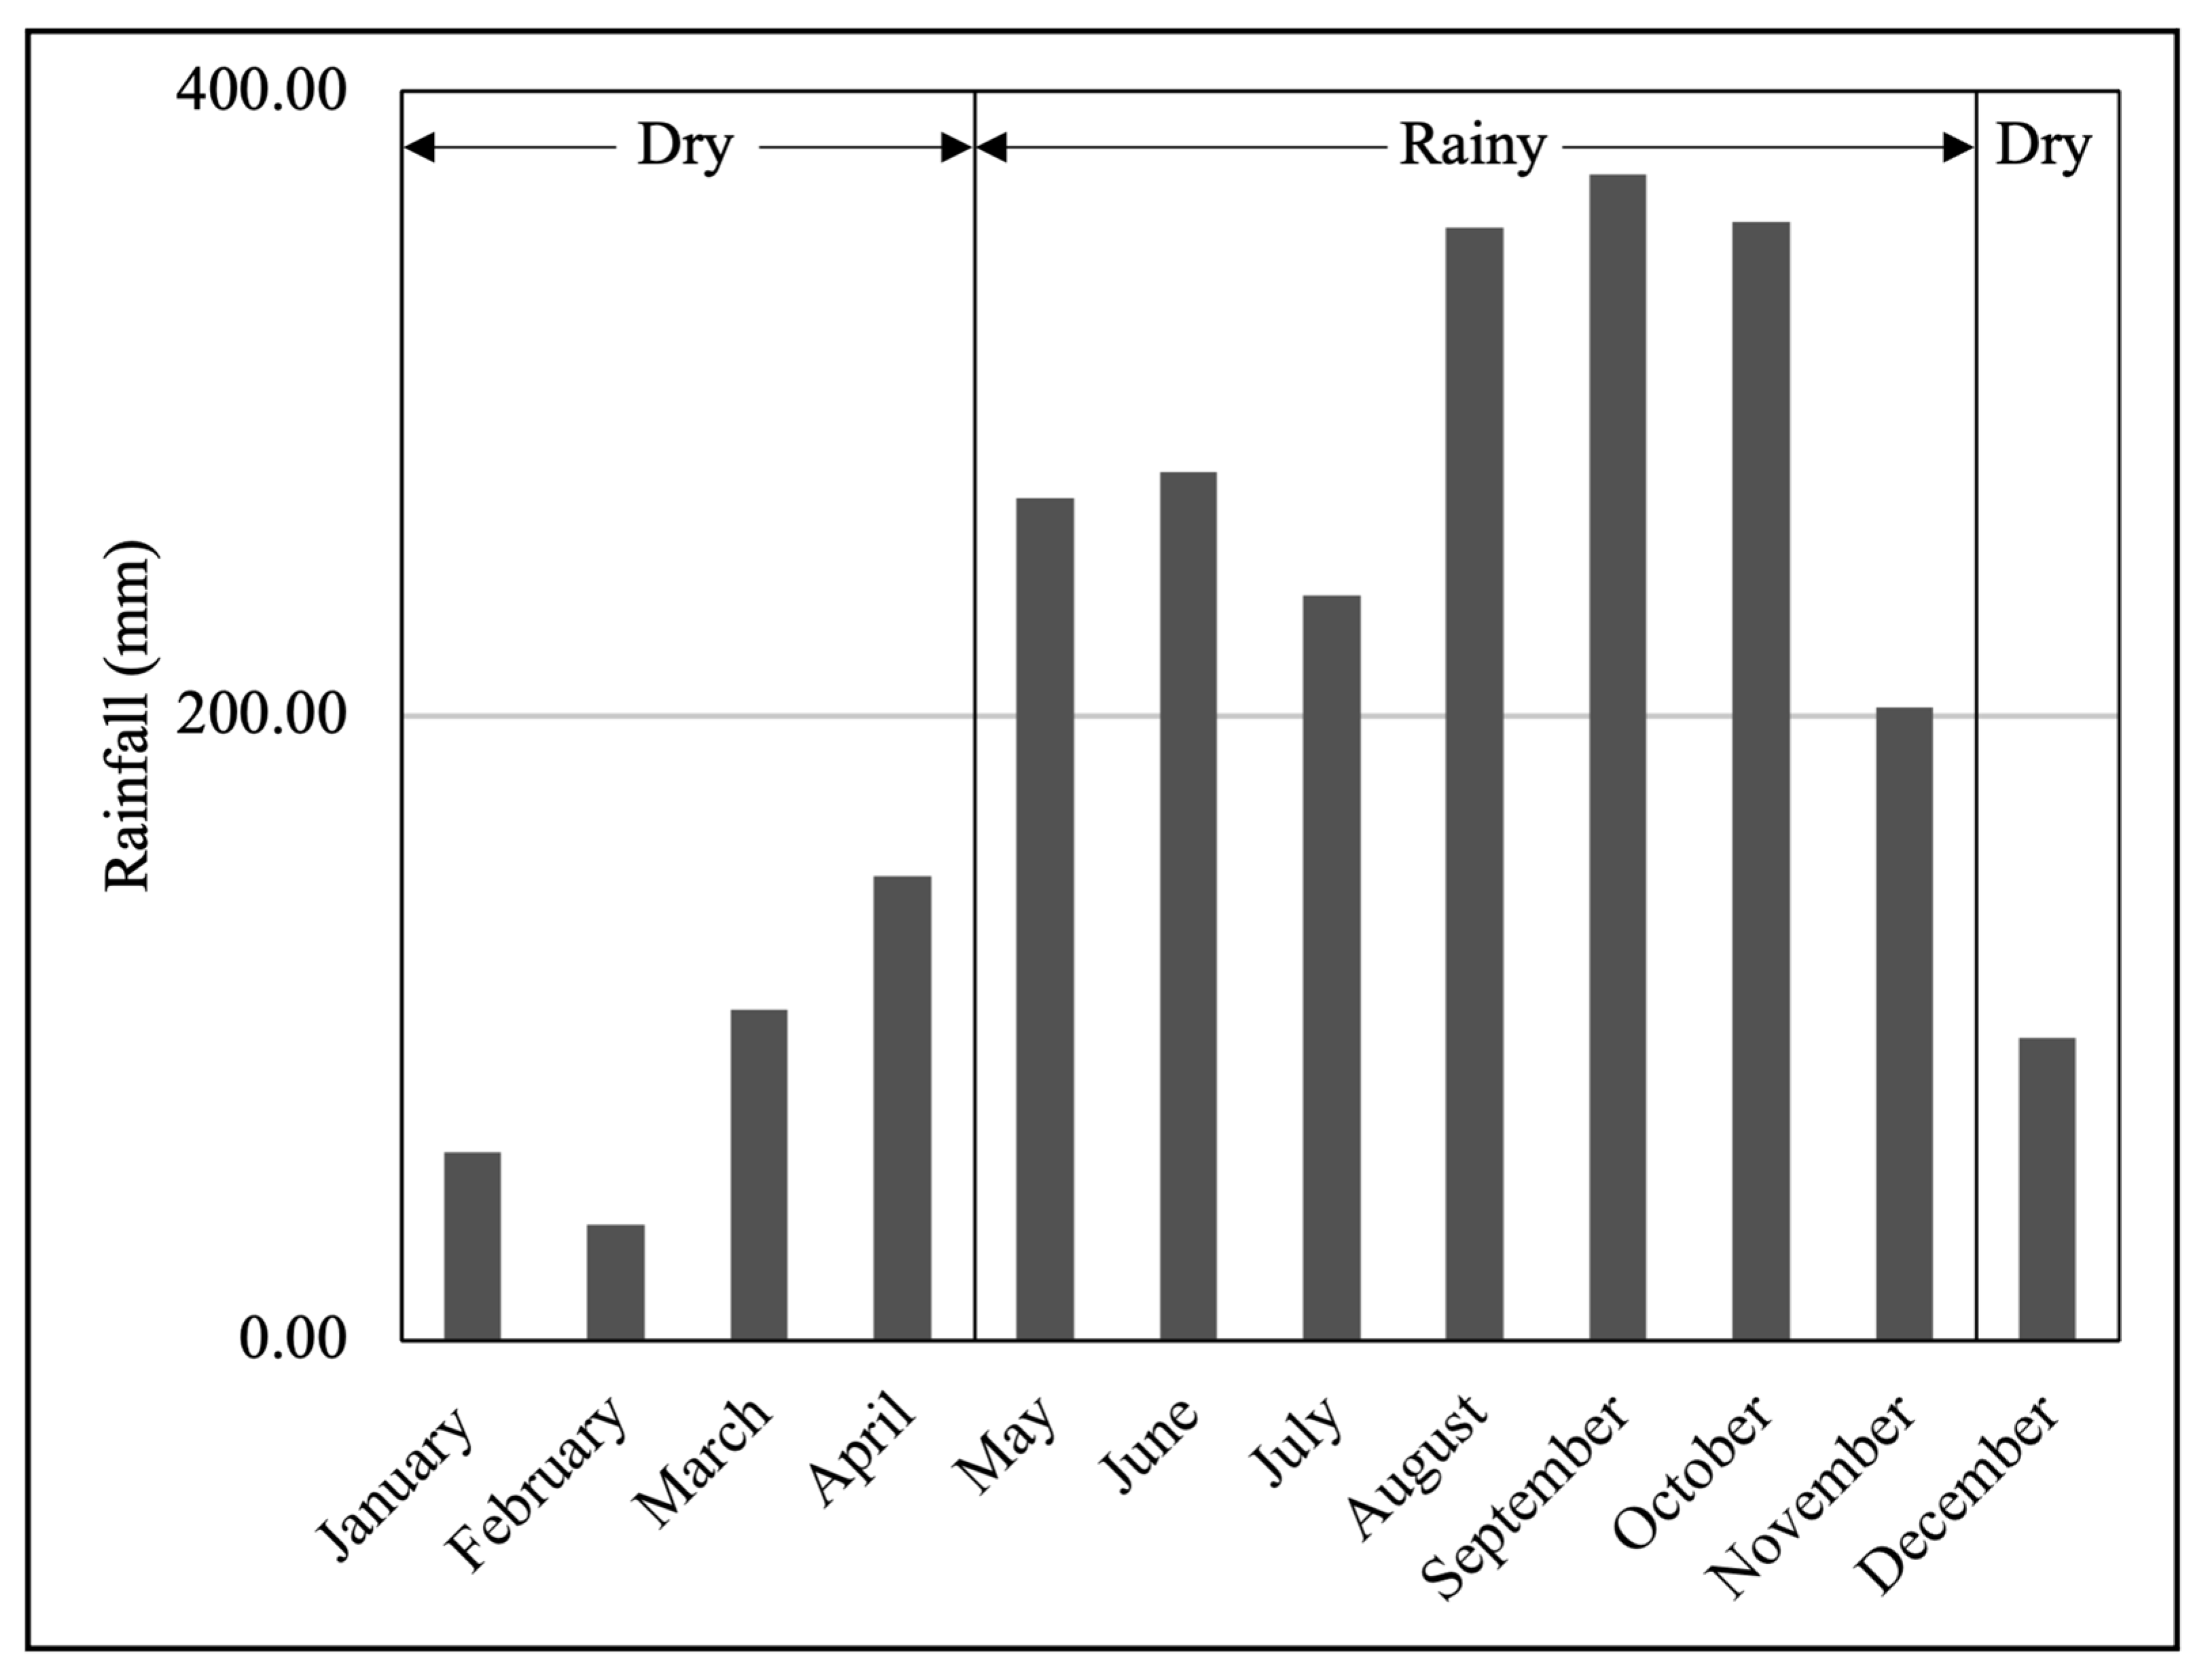
| I | Mai Khao | SPT 1 | VES 1-1 | Sedimentary and metamorphic rocks | Rainy | Dry | |
| VES 1-2 * | Rainy | ||||||
| II | Choeng Thale | SPT 2 | VES 2-1 | Sedimentary and metamorphic rocks | Rainy | Dry | |
| VES 2-2 * | Rainy | ||||||
| III | Ratsada | SPT 3 | VES 3-1 | Sedimentary and metamorphic rocks | Dry | Dry | |
| IV | Kathu | SPT 4 | VES 4-1 | Igneous rocks | Dry | Dry | |
| Area | Data Sources/Data Number | Coefficient of Determination () | ||||
|---|---|---|---|---|---|---|
| Linear | Exponential | Power | SGR | |||
| I | BH 1-1–VES 1-1 | 14 | 7 × 10⁻⁶ | 0.0171 | 0.0114 | 0.0002 |
| BH 1-2–VES 1-1 | 13 | |||||
| BH 1-3–VES 1-1 | 14 | |||||
| II | BH 2-1–VES 2-1 | 5 | ||||
| III | BH 3-1–VES 3-1 | 4 | ||||
| BH 3-2–VES 3-1 | 3 | |||||
| BH 3-3–VES 3-1 | 5 | |||||
| BH 3-4–VES 3-1 | 3 | |||||
| BH 3-5–VES 3-1 | 5 | |||||
| IV | BH 4-1–VES 4-1 | 6 | ||||
| BH 4-2–VES 4-1 | 6 | |||||
| BH 4-3–VES 4-1 | 6 | |||||
| Area | Data Sources/Data Number | Geology | Coefficient of Determination () | ||||
|---|---|---|---|---|---|---|---|
| Linear | Exponential | Power | SGR | ||||
| I | BH 1-1–VES 1-1 | 13 | Sedimentary and Metamorphic Rocks | 0.1295 | 0.1721 | 0.1483 | 0.1030 |
| BH 1-2–VES 1-1 | 12 | ||||||
| BH 1-3–VES 1-1 | 14 | ||||||
| II | BH 2-1–VES 2-1 | 1 | |||||
| III | BH 3-1–VES 3-1 | 3 | |||||
| BH 3-2–VES 3-1 | 2 | ||||||
| BH 3-3–VES 3-1 | 4 | ||||||
| BH 3-4–VES 3-1 | 3 | ||||||
| BH 3-5–VES 3-1 | 4 | ||||||
| Area | Data Sources/Data Number | Geology | Climate | Coefficient of Determination () | ||||
|---|---|---|---|---|---|---|---|---|
| Linear | Exponential | Power | SGR | |||||
| III | BH 3-1–VES 3-1 | 4 | Sedimentary and Metamorphic Rocks | Dry | 0.4917 | 0.6175 | 0.6089 | 0.3592 |
| BH 3-2–VES 3-1 | 3 | |||||||
| BH 3-3–VES 3-1 | 5 | |||||||
| BH 3-4–VES 3-1 | 3 | |||||||
| BH 3-5–VES 3-1 | 5 | |||||||
Disclaimer/Publisher’s Note: The statements, opinions and data contained in all publications are solely those of the individual author(s) and contributor(s) and not of MDPI and/or the editor(s). MDPI and/or the editor(s) disclaim responsibility for any injury to people or property resulting from any ideas, methods, instructions or products referred to in the content. |
© 2023 by the authors. Licensee MDPI, Basel, Switzerland. This article is an open access article distributed under the terms and conditions of the Creative Commons Attribution (CC BY) license (https://creativecommons.org/licenses/by/4.0/).
Share and Cite
Puttiwongrak, A.; Keo, S.; Vann, S.; Arpornthip, T.; Suteerasak, T.; Sukontasukkul, P. Geological and Climatic Factors Affecting the Correlation between Electrical Resistivity and SPT N-Value in Sandy Soils of Phuket, Thailand. Geosciences 2023, 13, 185. https://doi.org/10.3390/geosciences13060185
Puttiwongrak A, Keo S, Vann S, Arpornthip T, Suteerasak T, Sukontasukkul P. Geological and Climatic Factors Affecting the Correlation between Electrical Resistivity and SPT N-Value in Sandy Soils of Phuket, Thailand. Geosciences. 2023; 13(6):185. https://doi.org/10.3390/geosciences13060185
Chicago/Turabian StylePuttiwongrak, Avirut, Solina Keo, Sakanann Vann, Tanwa Arpornthip, Thongchai Suteerasak, and Piti Sukontasukkul. 2023. "Geological and Climatic Factors Affecting the Correlation between Electrical Resistivity and SPT N-Value in Sandy Soils of Phuket, Thailand" Geosciences 13, no. 6: 185. https://doi.org/10.3390/geosciences13060185