1. Introduction
The use of drainage to reduce the excess pore-water pressure generated by ground shaking is a common ground improvement method to mitigate earthquake-induced liquefaction. Since the 1970s, and after the design chart of [
1], vertical drains (in the form of stone columns, gravel drains and, more recently, prefabricated vertical drains, [
2,
3,
4]), have been widely used as a liquefaction remediation technique.
The partially drained hydraulic mechanism which takes place during liquefaction can be summarized as follows: the tendency of the soil to contract during vibrations gives rise to excess pore pressure (Δu generation), which in turn causes a vertical hydraulic gradient and triggers an upward fluid flow (Δu dissipation) [
5,
6]. Near the ground surface, the inflow level from deeper soil is higher than the outflow level and excess pore pressure accumulates and holds longer than at depth, causing soil fluidification [
7]. Drainage systems generally consist of vertical drains placed in a spaced grid and are usually applied at new construction sites. The basic concept of drains is to increase the dissipation capacity to prevent a liquefiable layer from accumulating too high Δu values, and thus losing strength and stiffness. As drains have a permeability of at least one order of magnitude greater than the surrounding soil, pore pressure dissipation occurs faster in the drains than in the soil and drains become preferential drainage paths, allowing the starting of excess pore pressure dissipation as soon as the pore pressure begins to rise and speeding up the process of re-equilibration of stresses within the soil mass, with the final result of avoiding soil fluidification.
Ref. [
8] analyzed the behavior of single stone columns in a liquefiable sandy deposit via centrifuge tests and observed experimentally how the presence of a drain generates locally a horizontal flow. The authors distinguished the soil involved in a horizontal flow from that affected by vertical drainage and concluded that, when moving further from the drain, the effects of vertical drainage overcome that of horizontal flow. They also observed that in the presence of a drain extended down deep into the whole sandy stratum, fluid flow from deeper layers starts first, reducing the effectiveness of the drain for near-surface soil strata. However, reducing the penetration depths of vertical drains does not improve their efficacy, which, on the contrary, is maximized if they extend through the full depth of liquefiable soil [
9].
The use of prefabricated vertical drains (PVDs) has been of much interest in recent years. Ref. [
10] carried out centrifuge tests on mildly sloping liquefiable deposits, capped by a clay crust, treated and untreated by prefabricated vertical drains. The tests showed that the efficacy of drains on the excess pore pressure build-up was affected by the characteristics of the applied dynamic excitation, and their effectiveness was larger for input motions which gradually increased in intensity, rather than when input motions with few large intensity cycles were applied. The authors also observed that, under the specific test conditions, reducing the pore pressure ratio to values lower than 0.5 limited significantly the ground deformations. When applied under buildings [
11], PVDs behave satisfactorily in reducing the extent and duration of large excess pore pressures and net foundation settlements but induce an increase in transverse acceleration and deformation demands on the foundation and superstructure. In the case of intervention under an existing building, 1 g shaking table tests by [
12] evidenced that a set of vertical drains all around the building is not sufficient to protect the structure from liquefaction and all the soil under the foundation must be reached by inclined drains, especially the shallower foundation ground. The settlement of the building does not decrease unless a full set of drains is installed under the structure.
The implementation of horizontal drains as a liquefaction remediation method is at the preliminary stage of research, their primary application being slope stabilization and fine layer consolidation. However, horizontal drains seem a very promising method of liquefaction mitigation to be implemented at already developed sites not previously treated against liquefaction, to avoid excess pore pressure accumulation below existing structures or infrastructures. Horizontal drains can be directionally drilled below the structure and treat all the soil below the building footprint.
The idea of using horizontal drains for liquefaction mitigation came after the 2012 Emilia seismic sequence in Italy. The two main events of the sequence are the May 20 and May 29 earthquakes, characterized by moment magnitude of Mw = 6.1 and Mw = 5.9, respectively (
http://cnt.rm.ingv.it/, (accessed on 7 June 2023)). The most relevant liquefaction manifestations were observed during the May 20 shake in the Ferrara Province, at sites located about 15 km SE of the epicentre. Liquefaction manifestations consisted in craters, sand boils, surface cracks and lateral spreading. The soils which experienced liquefaction are shallow (within 12–15 m from the ground surface) river deposits of sandy silt, silty sand and sand, topped by a clayey silt layer of lower permeability, up to 2 m thick. The ground water table is close to the soil surface. The consequences of soil liquefaction were the tilt of buildings and lateral movements of foundations. It was observed that the least damaged structures were those equipped with water wells, as the sand was ejected through them. During the rebuild, the execution of vertical drains to mitigate liquefaction under buildings to be retrofitted was funded by the local administration. However, treating the soils below existing structures with vertical and inclined drains may not be as efficient as realising drains in free field conditions before building. So, the idea of horizontal drains emerged, with the idea of using Directional Drilling Technique (DDT) to install HDs directly from the ground surface employing a probe equipped with accelerometers and magnetometers, temperature sensors and digitizing circuitry for a real-time survey of the drilling path.
Within the frame of the LIQUEFACT project (
http://www.liquefact.eu/ (accessed on 7 June 2023), experimental data available at
https://www.zenodo.org/record/1281598#.W-mWVOhKjIU (accessed on 7 June 2023)), a series of dynamic centrifuge tests were carried out at the ISMGEO laboratory, to comparatively evaluate the efficacy of vertical and horizontal drains (VD and HD, respectively) to reduce the liquefaction susceptibility of a level ground, saturated, sandy deposit and to assess the applicability of horizontal drains as a remediation technique. Other tests analyzed the triggering mechanism in untreated homogeneous and stratified models, reconstituted using different sands, and subjected to earthquakes of increasing intensity [
13,
14]. In the tests discussed in this paper, the efficacy of vertical and horizontal drainage systems with variable spacing in reducing the excess pore pressure accumulation is verified and compared with an untreated homogeneous sandy model. During the LIQUEFACT project, a field trial to test Directional Drilled (HDs) was also carried out [
15].
2. Experimental Details
The geometrical scaling factor of the models was N = 50. The tests with drains were carried out using Ticino Sand (here indicated as S1); the models discussed below were homogeneous and were tested in free field conditions (M1 models). The modelled sand layer was 14 m high at the prototype scale and its natural frequency was 2.3 Hz.
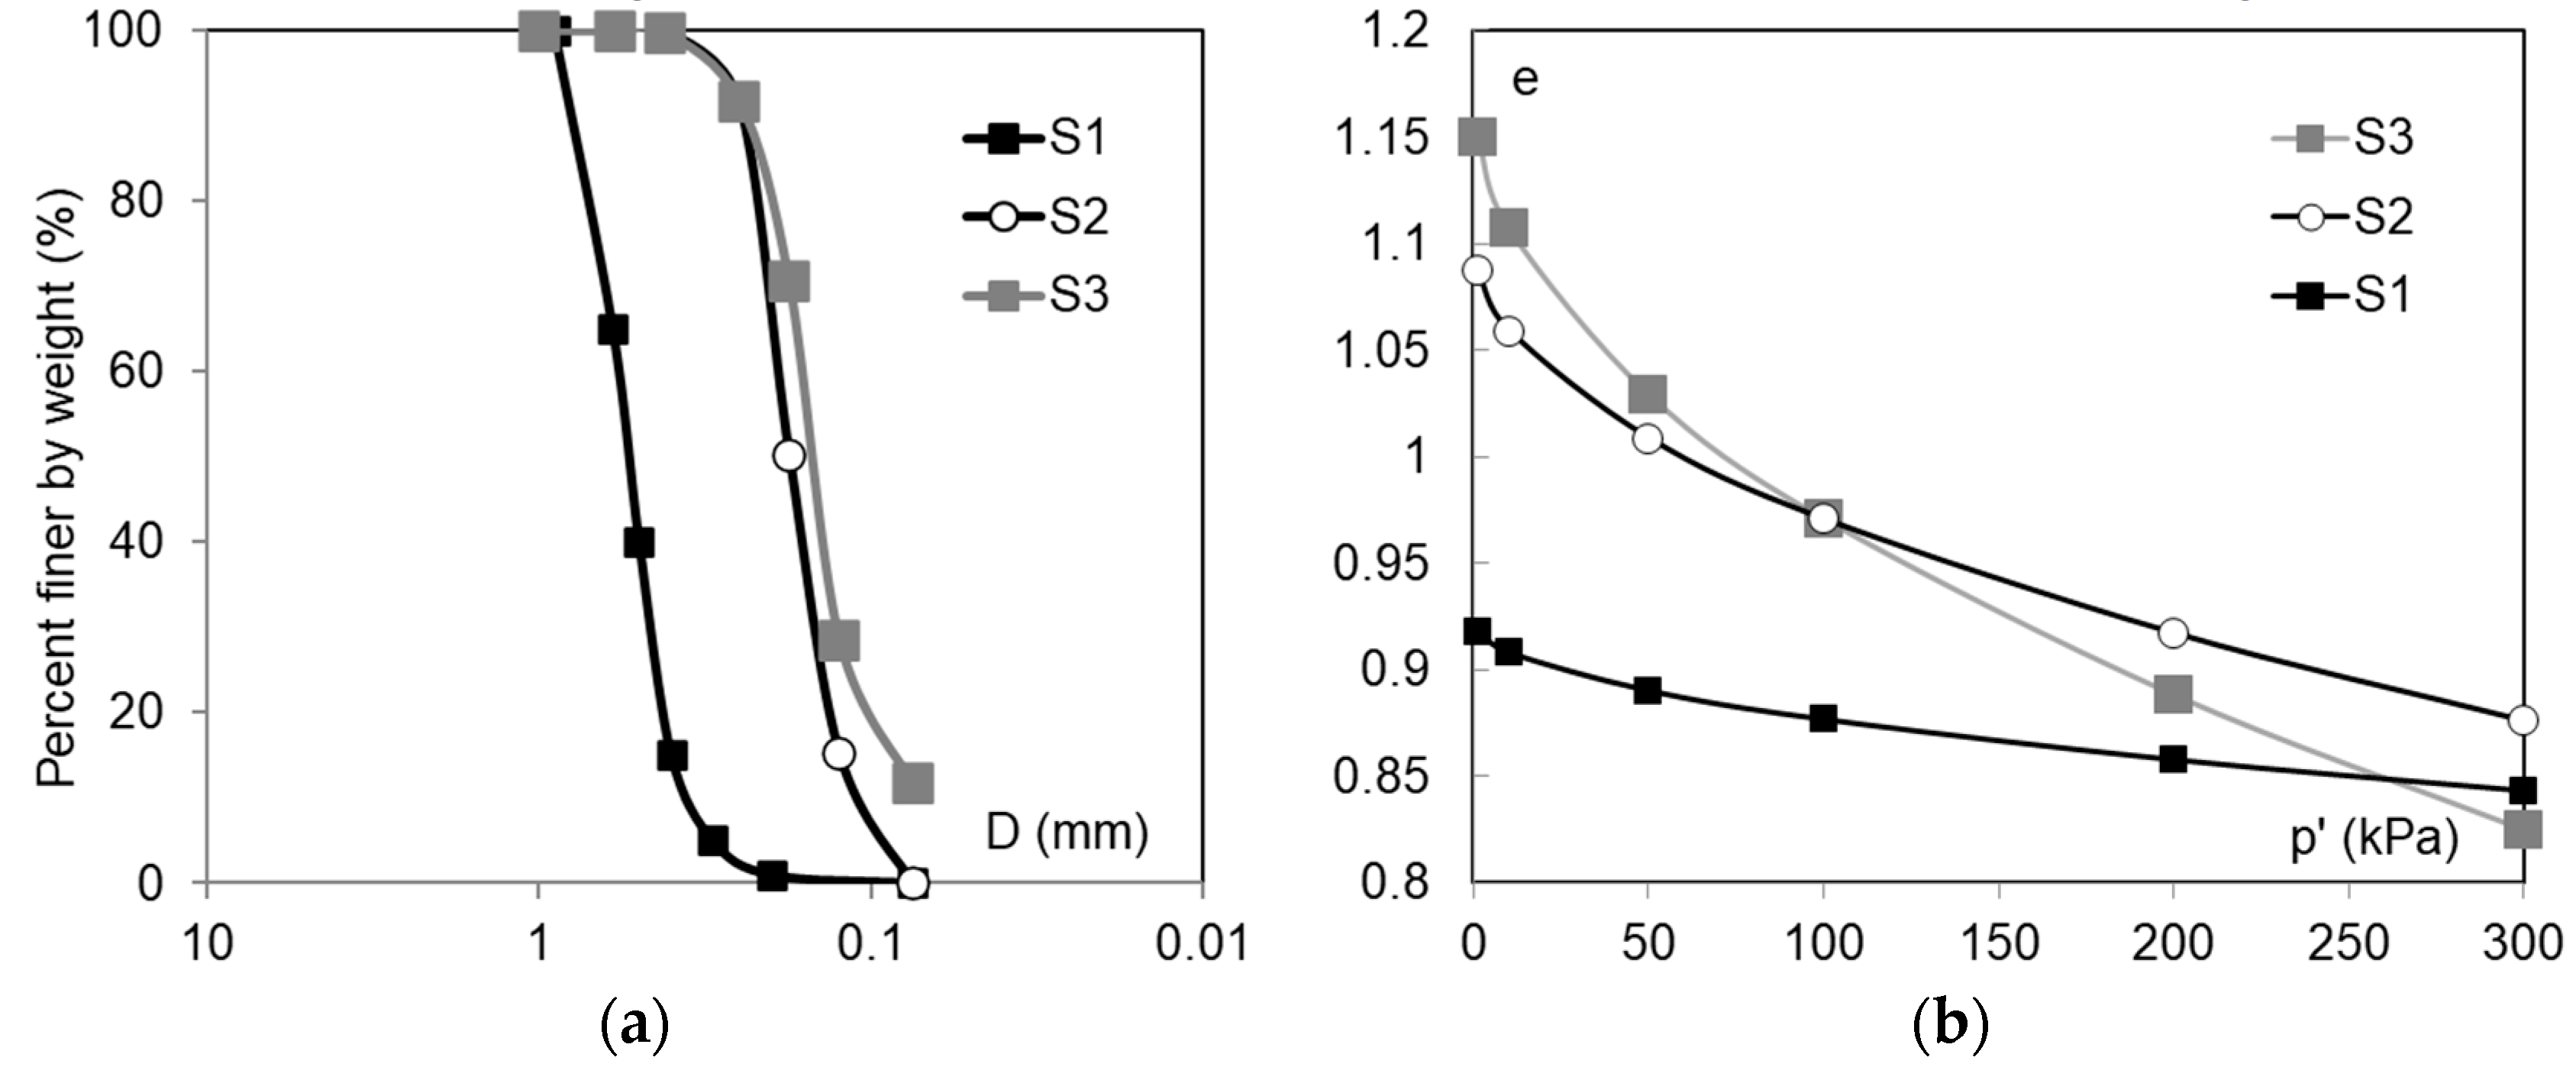
S1 is a uniform, coarse to medium sand (
Figure 1a) made of angular to sub-rounded particles and composed of 30% quartz, 65% feldspar and 5% mica. The angle of sharing resistance at the critical state is 34° (stress ratio at critical state M = 1.36), and the critical state line in the e-p’ plane is shown in
Figure 1b. A detailed description of its static and dynamic properties can be found in [
16]. TS hydraulic conductivity to water at the test density is of the order of 2 × 10
−3 m/s, as measured via laboratory tests.
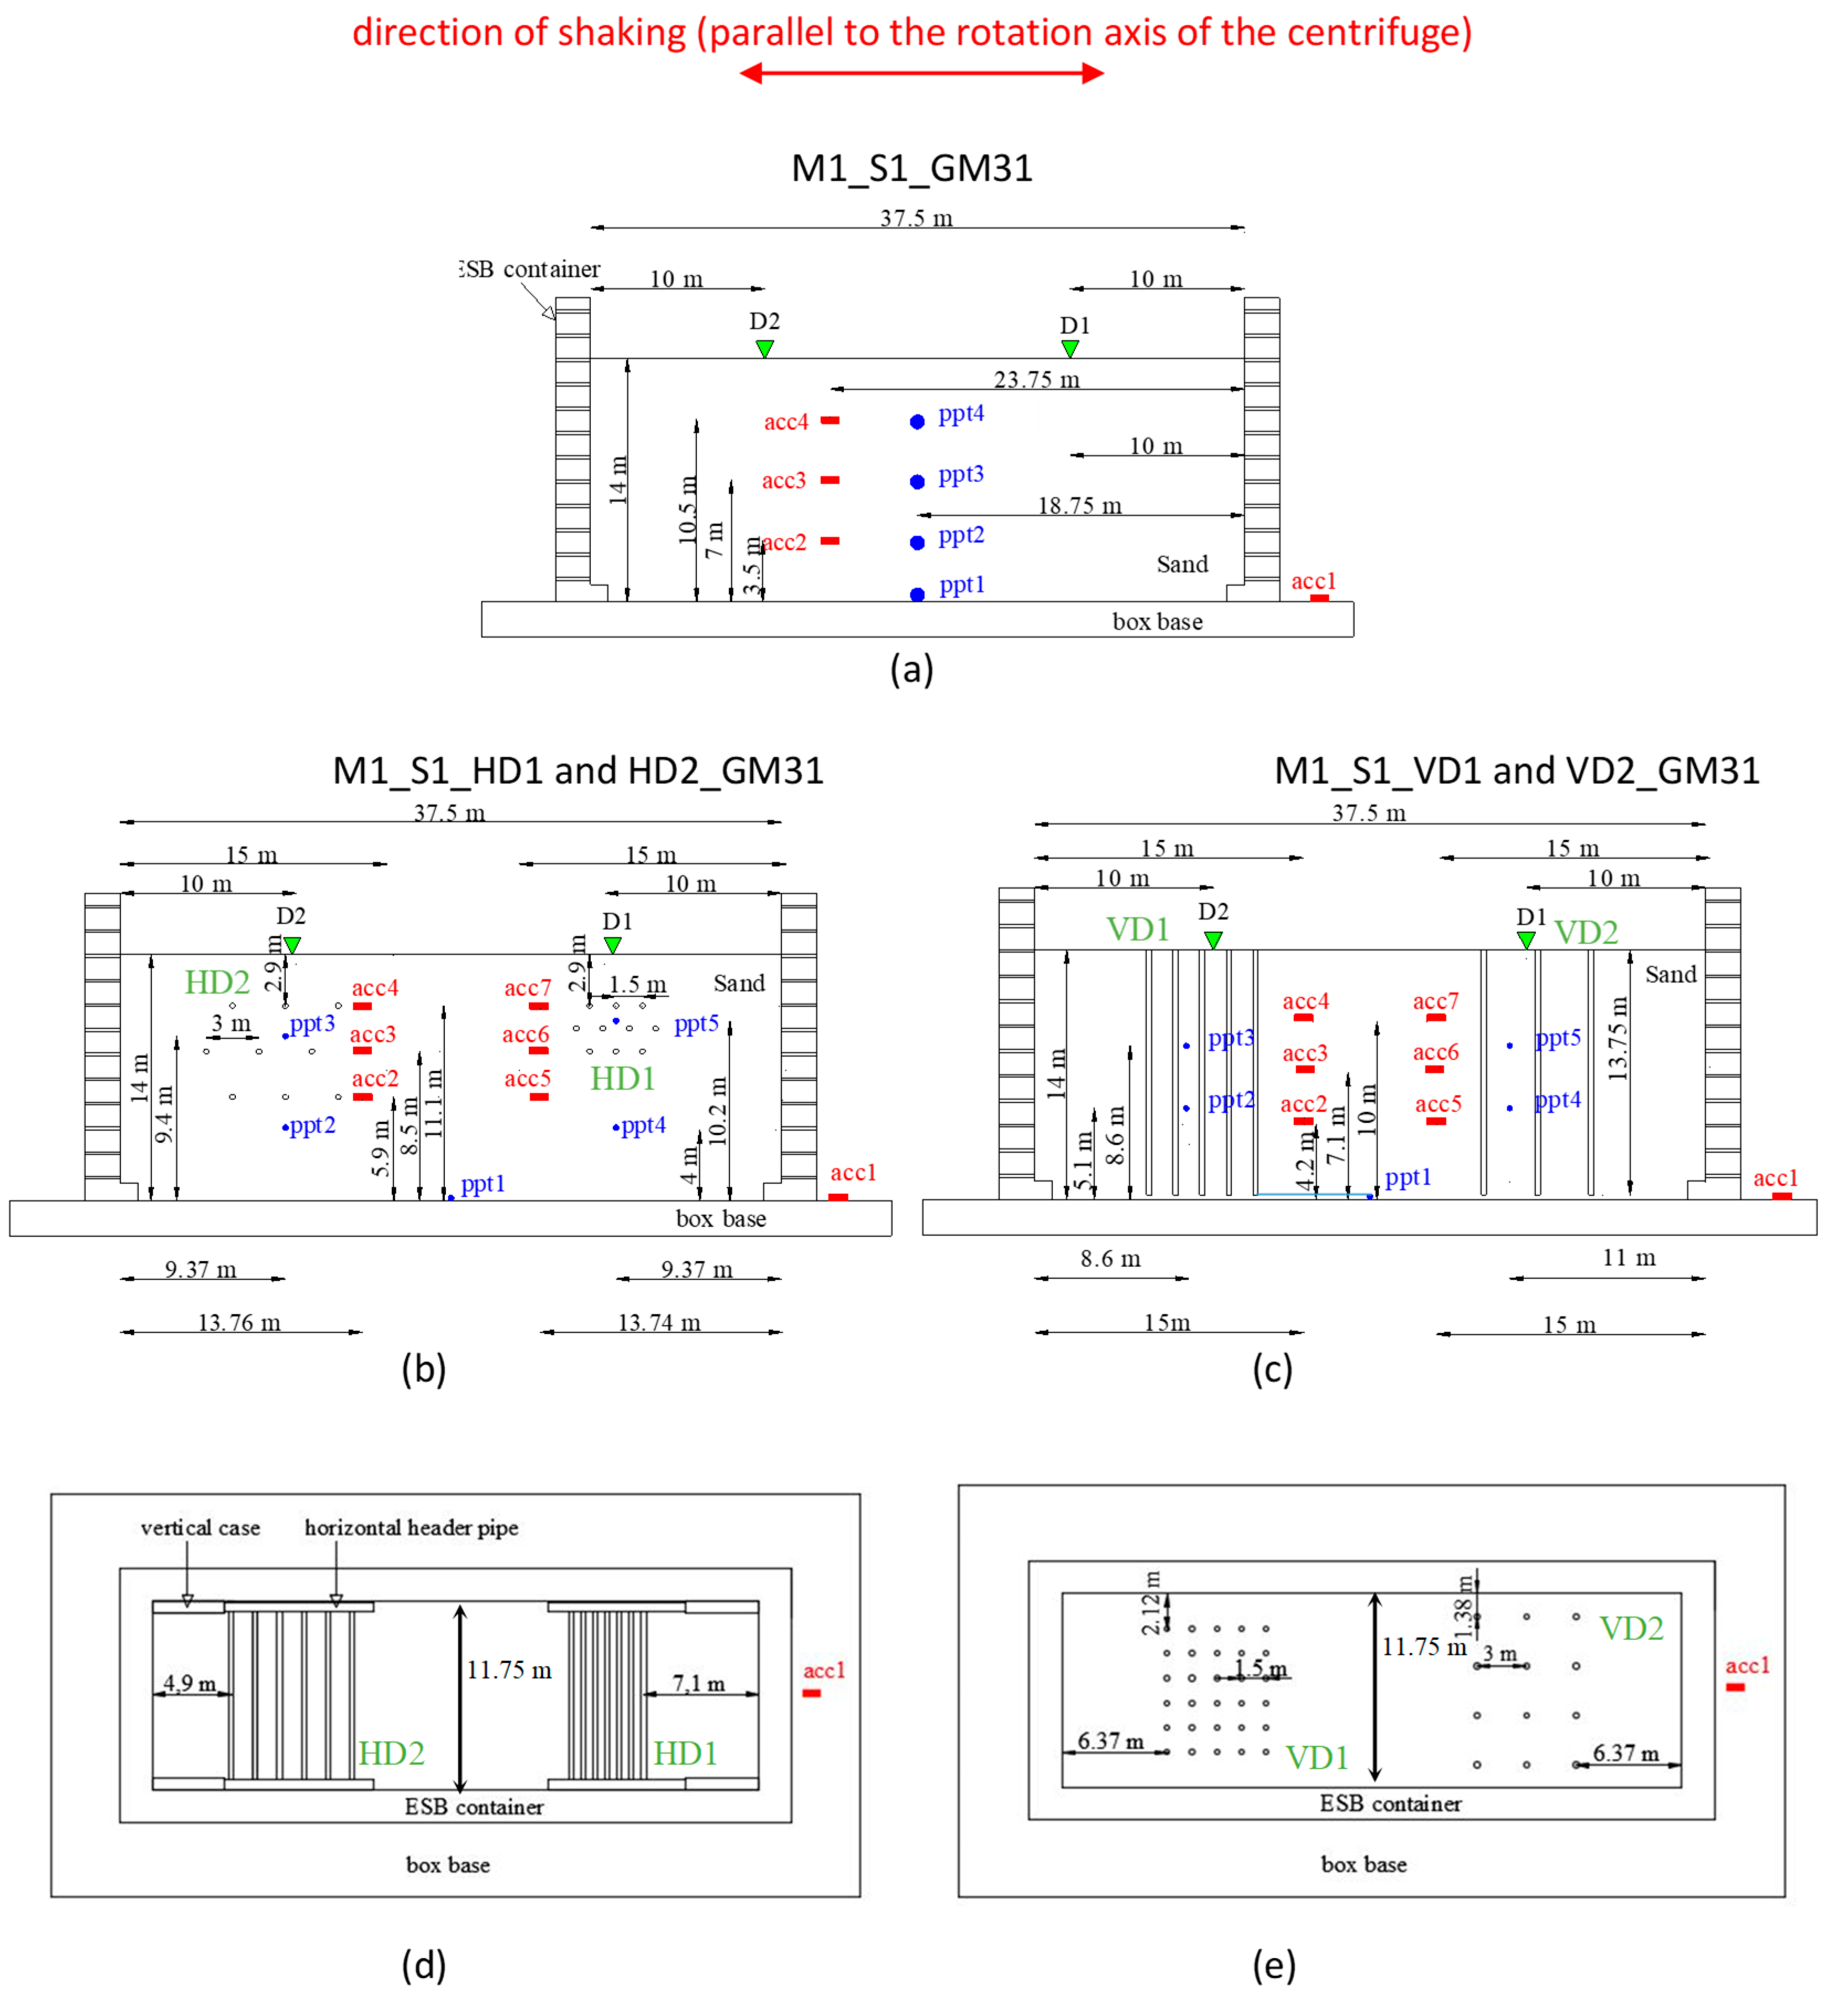
As shown in
Figure 2, where the schemes of the tests are drawn, the models were instrumented with miniaturized accelerometers (acc), pore pressure transducers (ppt) and displacement transducers (D) to measure horizontal accelerations along the shaking direction, fluid pressure and settlement, respectively. A further accelerometer was fixed to the base of the model container in order to measure the time history applied by the shaking table. The linear displacement transducer’s tip rested above a thin and light plate, necessary to minimize the tip sinking. The sand layer was reconstituted by dry pluviation into an Equivalent Shear Beam (ESB, [
17]) container.
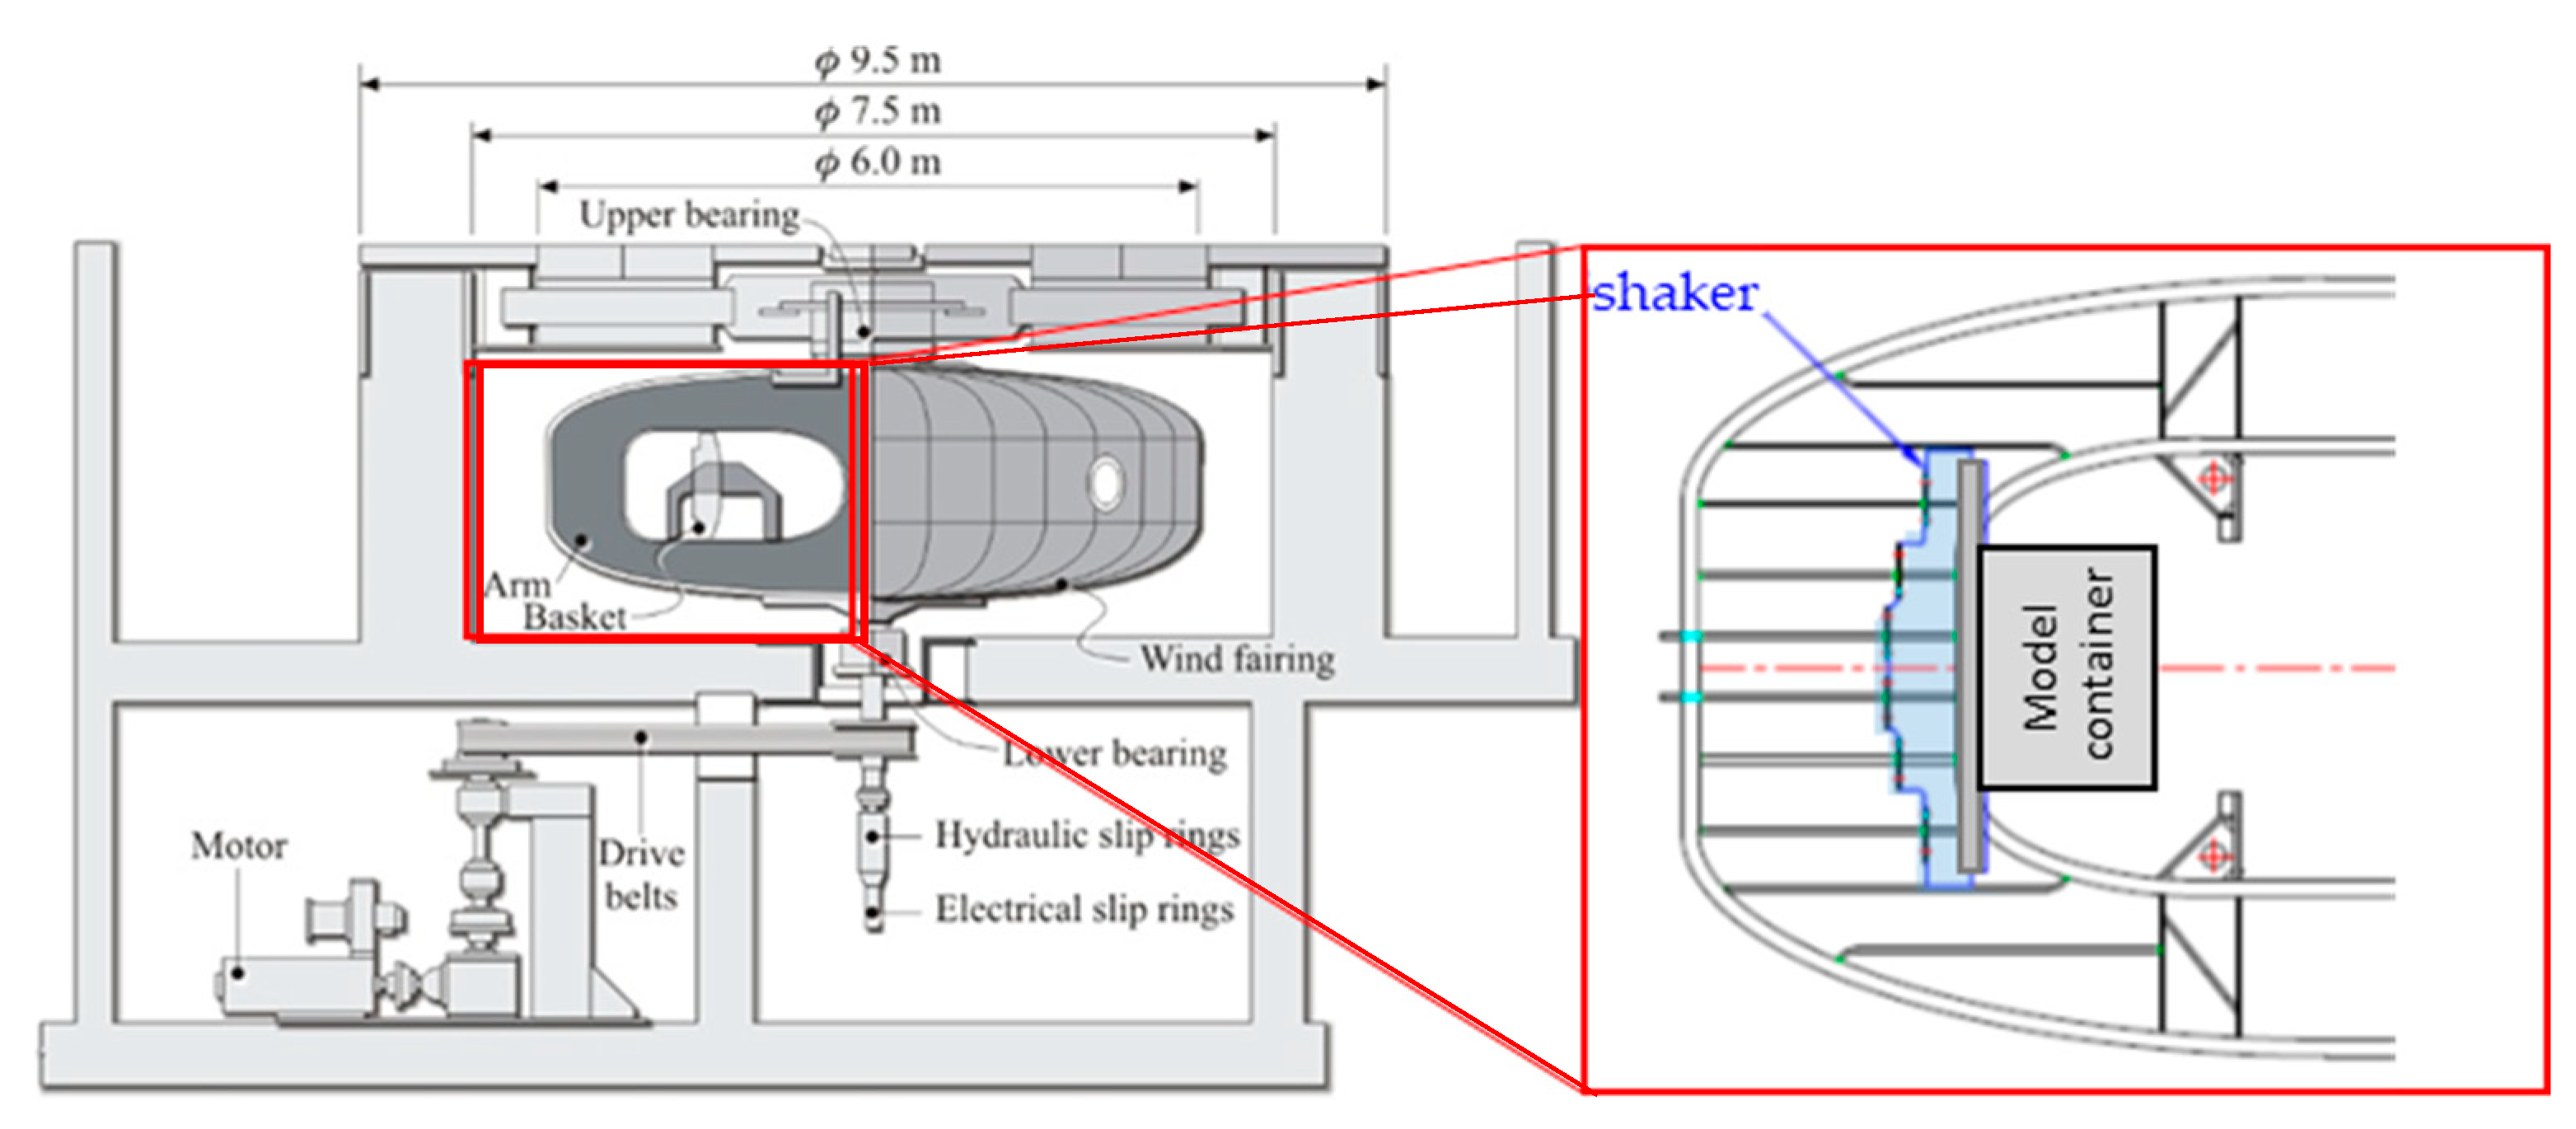
In flight, the long side of the container is vertical and parallel to the rotation axis of the centrifuge, so that the distortion effect due to the rotation does not affect the central section of the model along which the instruments were located. In addition, the shaking direction is parallel to the rotation axis of the centrifuge, thus problems related to Corioli’s acceleration are minimized. A sketch of the ISMGEO seismic centrifuge and the shaking table is shown in
Figure 3.
The 1 g density of the pluviated sand was about 40%, and increased during the following stages (saturation, centrifuge acceleration, inflight consolidation) to about 45–55%. This range of relative density was considered an acceptable experimental scatter. The height of the sand layer was measured during all the test stages. The values of density in
Table 1 refer to the pre-shaking condition. The sensors embedded in the sand layer were placed in the models during the deposition, having interrupted the pluviation at the prescribed heights. Their position prior to liquefaction was derived assuming a linear displacement profile, with the displacement equal to zero at the bottom and equal to the measured surface settlement at the top of the soil layer. Their position after liquefaction was checked at the end of the test and was consistent with the superficial settlement.
Saturation of the models was carried out at the end of the model reconstruction using a viscous fluid (solution of water and hydroxypropyl methylcellulose) with a viscosity 50 times the water viscosity. The saturation was carried out under a vacuum pressure of −60 kPa by means of a low gradient fluid flow from the container bottom upward. The saturation was considered achieved when the fluid volume flowing within the sand was at least equal to the estimated volume of voids.
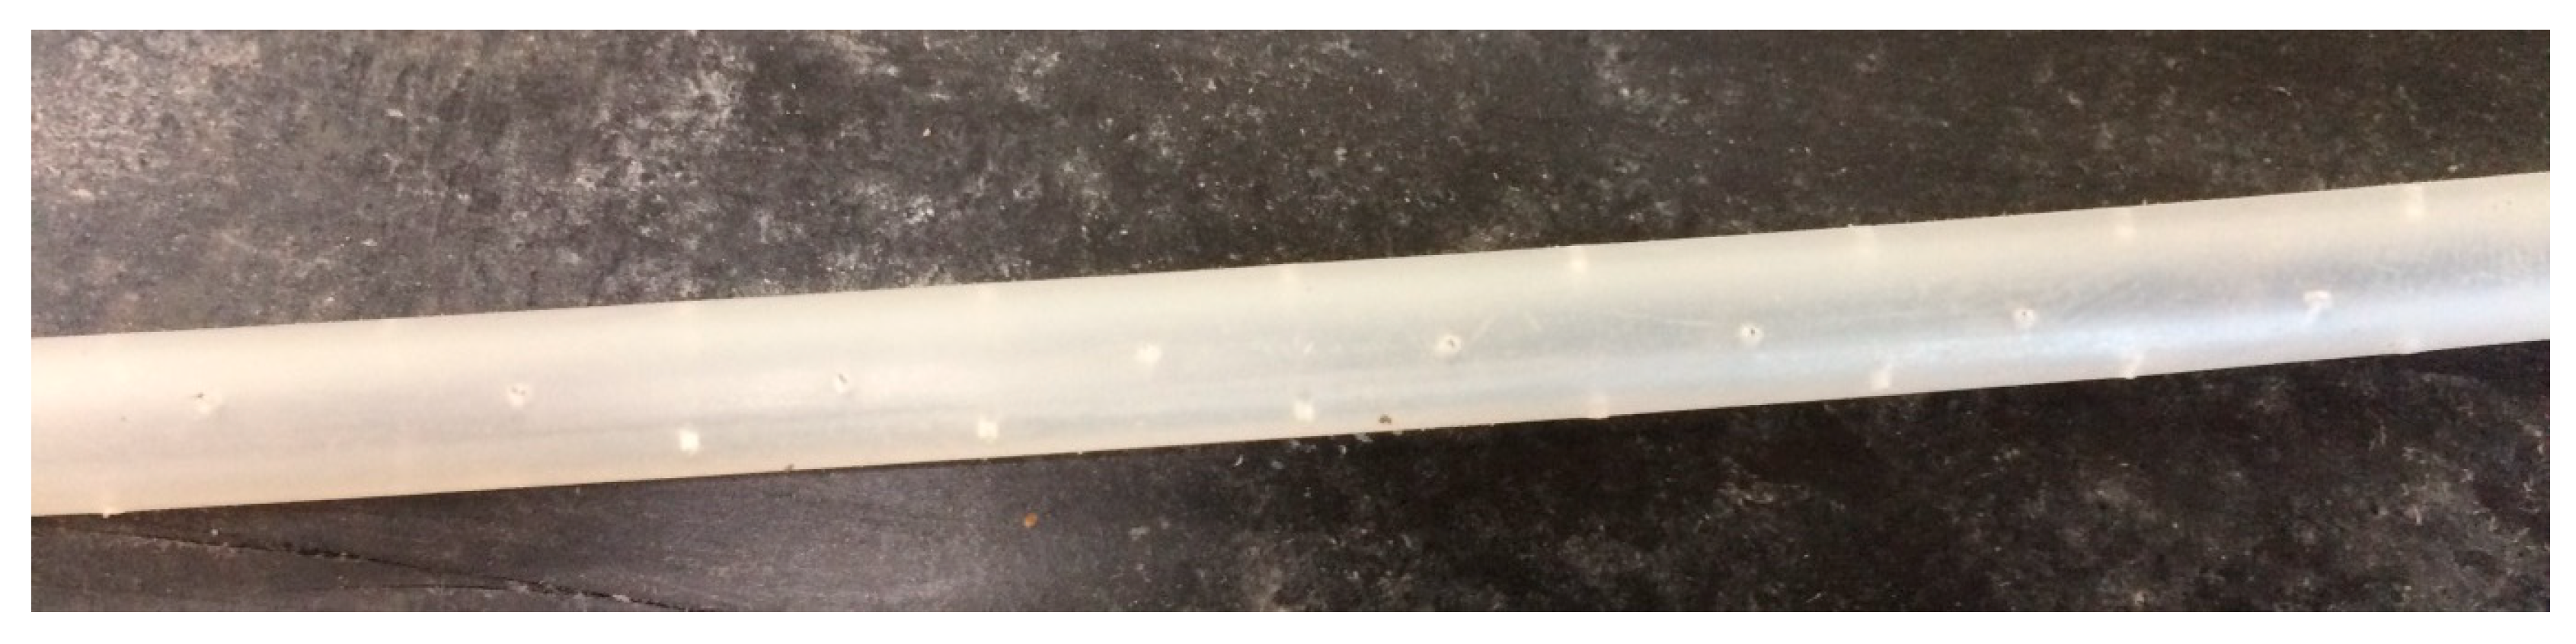
Prefabricated drains were simulated using flexible silicon pipes with an external diameter of 6 mm and an internal diameter of 4 mm (300 mm and 200 mm at the prototype scale, respectively).
As shown in
Figure 4, couples of diametrically opposed holes, 0.5 mm in diameter, were pierced along the pipe. Two subsequent hole couples were pierced at a distance of 5 mm, rotated at 90°. Permeability tests indicated a hydraulic conductivity coefficient to water of 1.7 × 10
−2 m/s, about an order of magnitude higher than the hydraulic conductivity to water of S1at the test average density.
In VD models, the tip of each vertical drain was closed with a nut and blocked by heat-shrink tubing. A threaded rod was inserted inside the drain and screwed to its bottom. The drain was then driven into the soil, once the saturation process was completed, by pushing on the threaded rod. When the drain head was at the same level as the ground surface, the insertion was interrupted and the threaded rod was removed. The vertical drains were 275 mm long (13.75 m at the prototype scale) and at the end of the installation procedure, their tip was 5 mm (0.25 m) distant from the container bottom (
Figure 2). VDs were installed according to a square mesh, the spacing S between drains being equal to 5 or 10 diameters (30 and 60 mm, 1.5 and 3 m at the prototype scale) in models called VD1 and VD2, respectively. Models VD1 and VD2 were simulated together, each in half of the container. The number of drains was 30 in VD1 models and 12 in VD2 models. The treated area was about 45 m
2 and 54 m
2 at the prototype scale in VD1 and VD2, respectively. The minimum distance of the drains from the ESB longitudinal walls was 27.5 mm (4.5 diameters), as shown in
Figure 2. During the tests, when the seismic excitation induced excess pore pressure, vertical drains were free to spill the pore fluid on the ground surface. The choice of testing in the same model with the two scenarios of drains enabled us to analyze and compare their efficacy under the same dynamic excitation; on the other hand, it did imply some limitations in the instrumentation, which was concentrated in the treated areas.
As to horizontal drains (HD), they were 225 mm long and were installed during the model reconstruction. The sand pouring was interrupted at prescribed heights, as for the installation of miniaturized sensors, and each level of horizontal drains was placed. The ends of the horizontal drains joined into horizontal header pipes (diameter 12 mm), placed along the longitudinal sides of the ESB (
Figure 2), but not fixed to the lateral walls. Horizontal header pipes were vented into four plastic vertical cases, placed at the ESB corners and filled with gravel up to the ground surface. This system allowed the dissipation of pore overpressures with a reduced disturbance on the shear movement of the ESB container. Horizontal drains were installed according to a triangular mesh, the spacing S between drains being equal to 5 or 10 diameters (30 and 60 mm, 1.5 and 3 m at the prototype scale) in models called HD1 and HD2. Models HD1 and HD2 were simulated together, each in half of the container. Each layer of drains consisted of 3 or 4 pipes. The total number of horizontal drains was 10 and 9, in HD1 and HD2 models, respectively. The treated area was about 9 m
2 and 31 m
2 in HD1 and HD2, respectively. The top row of drains was placed at a distance of 58 mm (about 10 diameters) from the sand surface, the bottom row was 170 mm or 118 mm above the container bottom, in HD1 and HD2, respectively. The external rows of drains were at least 97.5 mm (16 diameters) distant from the ESB walls.
The installation method of vertical and horizontal drains did not reproduce a real scale procedure. In the case of vertical drains, due to the narrow space among the tubes, it was not possible to place the pipes during sand pouring and the pipes were driven at 1g in the already saturated model. In situ, horizontal drains can be realized using directional drilling of reinforced well screen, heads and tips of drains outcropping on the ground surface or in shallow pits filled with high permeability material. In the tests here presented, horizontal drains were placed during reconstitution, to avoid inducing soil disturbance when drilling at 1 g from the model surface rows of horizontal pipes in a sand column a few centimeters deep with a very low-stress field. Furthermore, the lateral discharge system did not reproduce a specific prototype but was designed only to guarantee a drainage area for the horizontal pipes. While the placement method of horizontal drains did not produce any effect on the soil density, the 1 g jacking of vertical drains caused local densification of the soil. The average pre-shock density listed in
Table 1 accounts for, among others, also the effect of drain drilling. However, in the treated areas, and especially in the VD1 configuration, the soil density between drains was higher, as the volume of drains reduced the volume of voids. The local density among drains was not measured at the end of the tests. In the test interpretation, reference was made to the average density of the model.
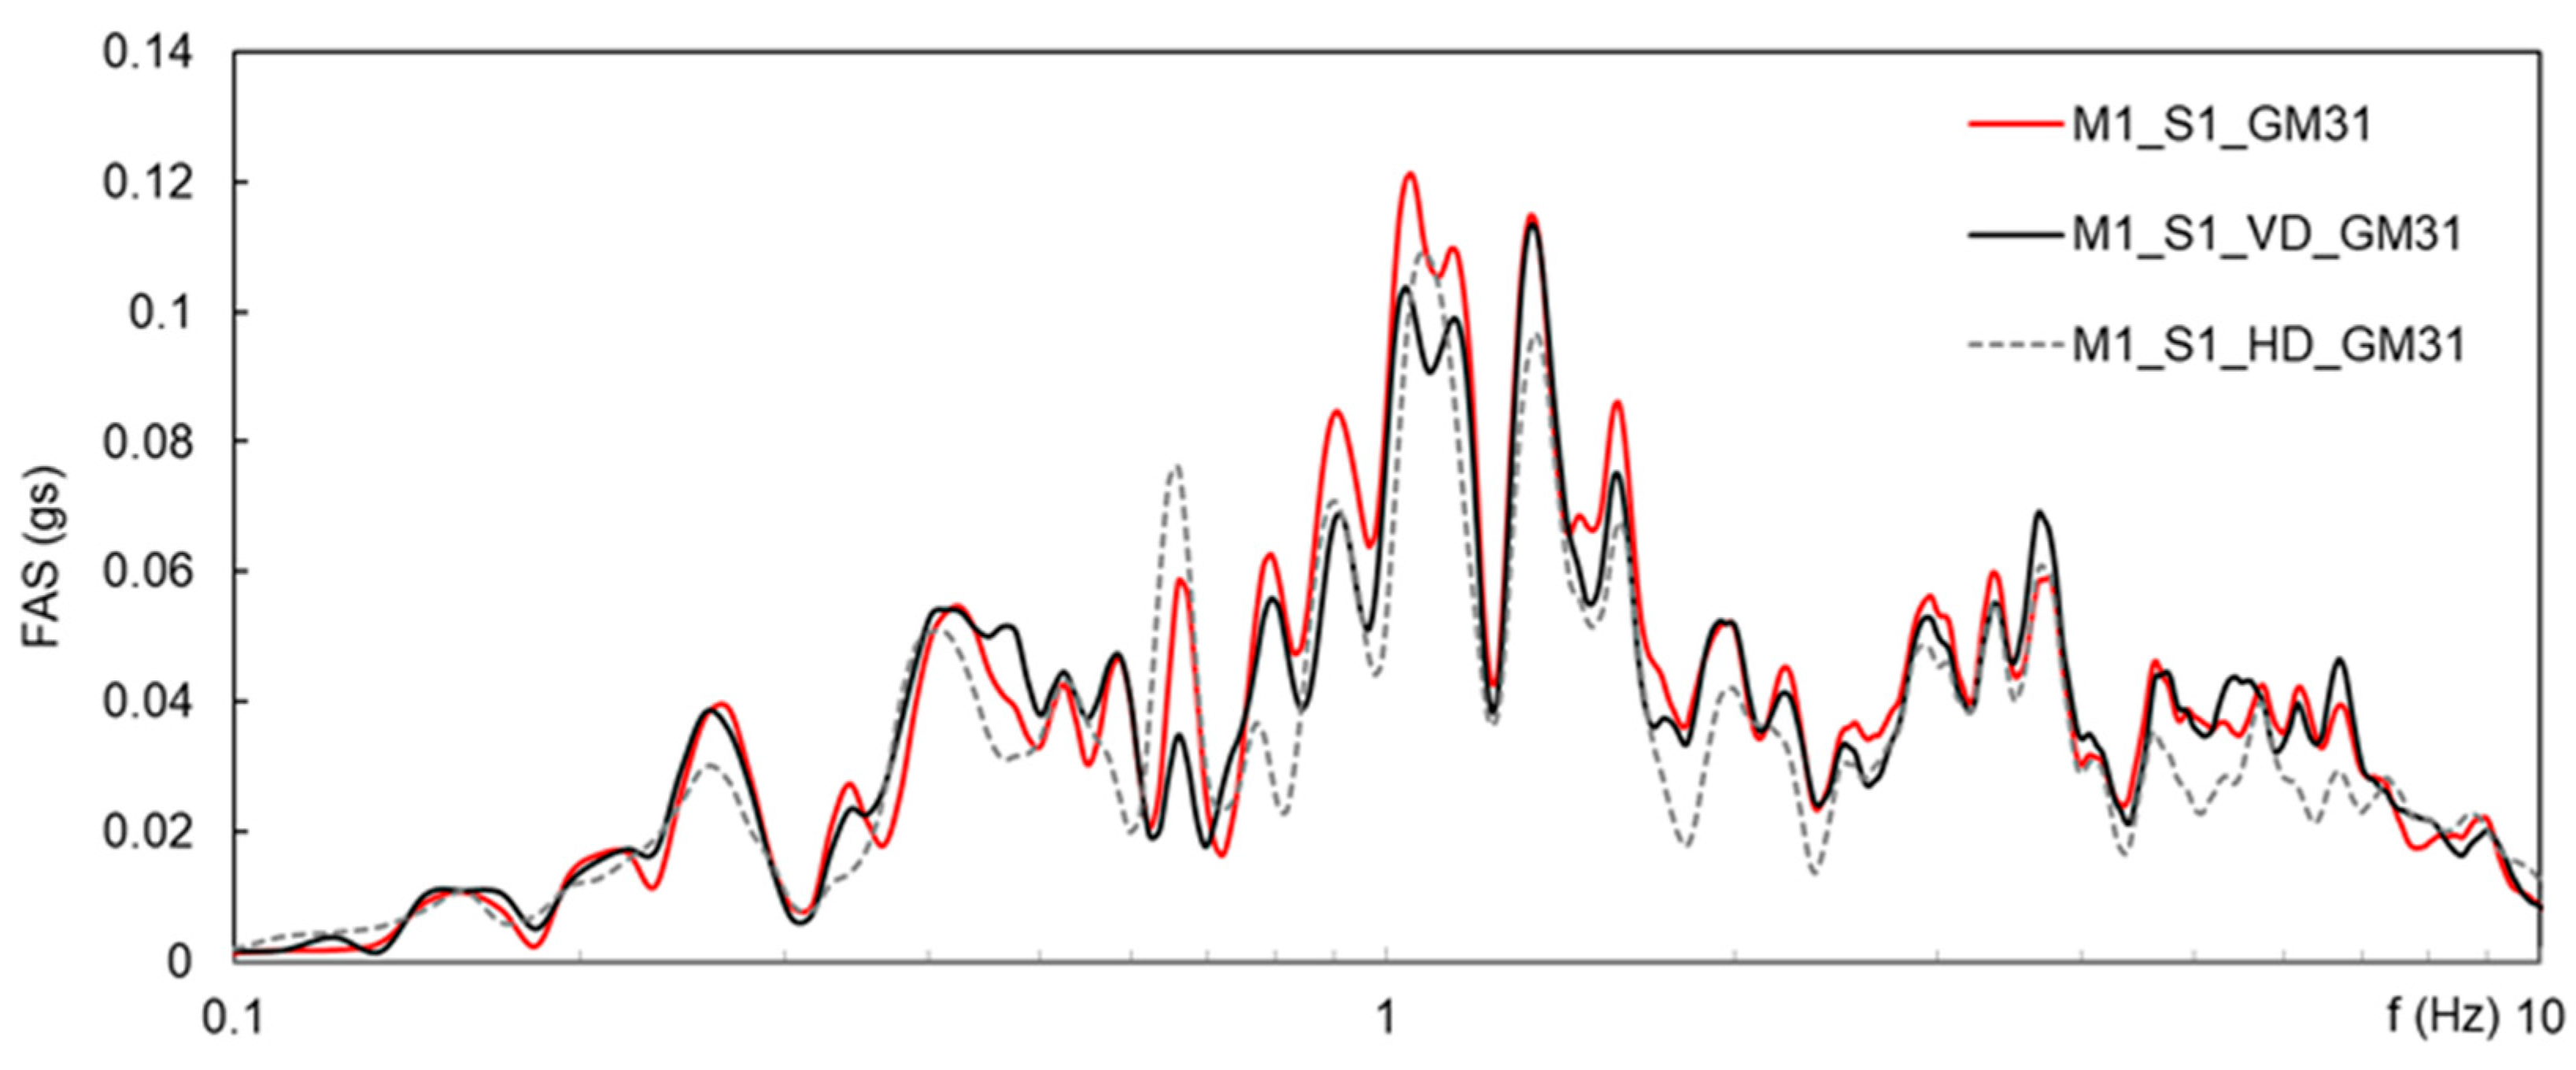
All the VD and HD models were subjected to the same ground motion, GM31, whose energy is mainly concentrated between 0.8 and 2 Hz.
Figure 5 shows the Fourier Amplitude Spectra (FAS) of the motions reproduced by the shaking table, measured by acc1 on the box base.
Table 2 reports their main characteristics.
The shaking table was able to reproduce quite well the target input motion. However, some differences in PGA and intensity have to be acknowledged.
3. Results
The results of the reference test on an untreated model, discussed in detail in [
13], are first briefly recalled. Some results obtained on models reconstituted using different sands and/or subjected to different earthquakes [
14] are then presented to produce a framework which contextualizes the results of models equipped with VDs and HDs, the object of this contribution. All the records are represented in prototype units in the Figures that follow.
3.1. Reference Untreated Model
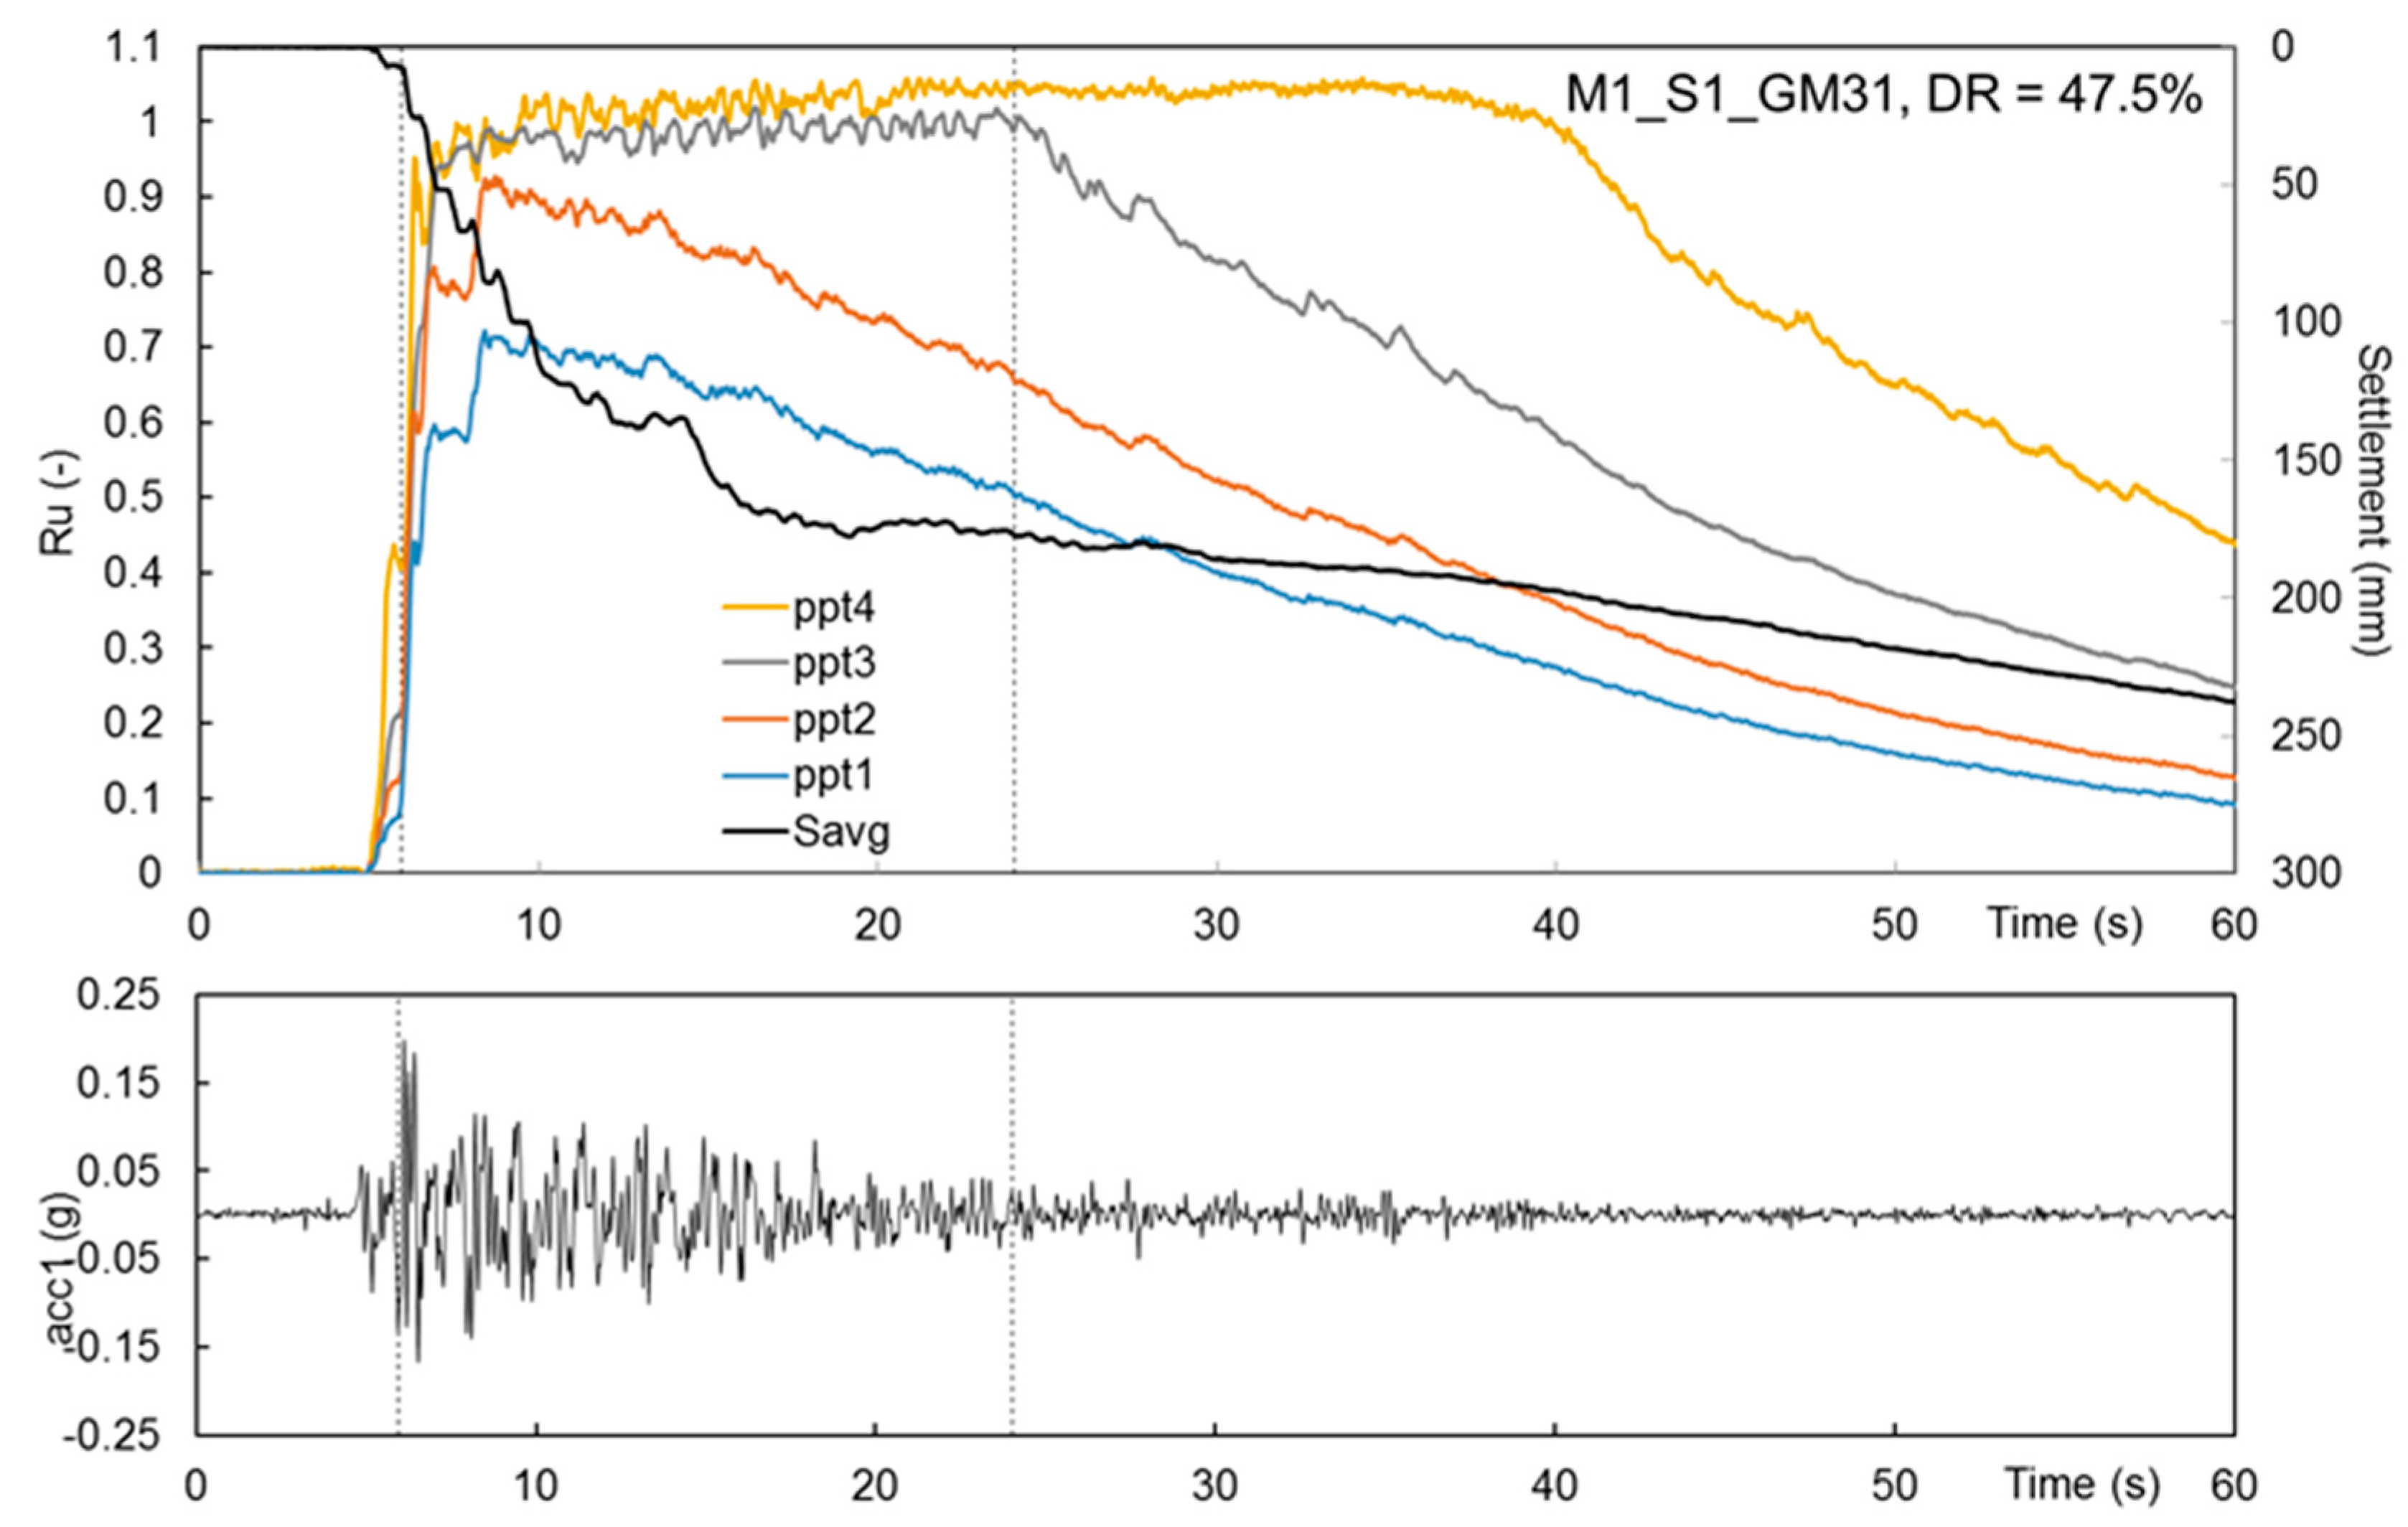
Figure 6 shows the time history of the normalized excess pore pressure Ru, average superficial settlement and base acceleration recorded on the untreated model M1_S1_GM31, sketched in
Figure 2a. Two vertical dotted lines in this Figure and in the following indicate the time instants at which 5% and 95% of the Arias Intensity was released, respectively, considered as the ‘start’ and ‘end’ of the base motion. In all Figures, only the first 60 s of the recording are shown.
Ru is the ratio between the excess pore pressure Δu measured by ppts and the vertical effective stress σ’v0 acting at the depth of the sensors prior to liquefaction. The pre-shock depth of sensors was estimated by the superficial settlement accumulated by the model after sand deposition, saturation, acceleration, assuming a linear distribution of strains with depth. In test interpretation, Ru larger than 0.9 and constant for a period of time was considered as an indicator of soil liquefaction.
At all depths, GM31 induced a quick Ru build-up within the first 2.5 s of shaking. Liquefaction was reached first near the ground surface (ppt4), the liquefaction front moved downward, and passed through ppt3 but did not reach the deeper half of the model, where ppt2 and 1 were located (Ru = 0.91 and 0.71, respectively). After 2.5 s, the upper half of the sand layer was fluidified, and this state lasted up to the end of the earthquake at ppt3 and for a further 16 s at ppt4; the bottom half remained at the solid state and Δu started to decay during the earthquake. At the end of the earthquake, Δu at ppt3 started to decay and a solidification front [
7] moved upward and reached ppt4 in 16 s.
The onset of Δu reduction from the container bottom after only a few seconds of loading cycles evidences that the stress–strain behaviour of sand during an earthquake is a partially drained process, during which the generation of pore pressure, higher at greater depths and lower at shallower depths, induces in the sand column a transient hydraulic gradient, which triggers an upward fluid flow. Generation and dissipation of Δu are contemporaries phenomena: in the present model, the latter prevailed at depth, and the former, combined with the upward fluid flow from the model base, prevailed near the soil surface and induced liquefaction. The direct consequence of these mechanisms was the progressive settlement of the soil surface all along the earthquake, even when Δu generation was the dominant process. The settlement rate was at its maximum during the first 2.5 s of the earthquake and two third of the final settlement was co-seismic. After 110 s, Ru almost reset at all depths and the settlement rate zeroed.
The decay of excess pore pressure during and after the earthquake was interpreted with a negative exponential function, according to [
18]:
where T
d = d
2/c
v is a drainage period function of the sand consolidation coefficient and of the drainage distance for excess pore pressure flows to the surface. T
d resulted equal to 17 s and was computed assuming: (i) an average drainage distance equal to half the height of the models; (ii) a confined modulus M = 15 MPa, derived in the stress range 50–100 kPa from an oedometric test on S1 reconstituted at the void ratio of the centrifuge models; (iii) a pore fluid unit weight γ
f = 9.84 kN/m
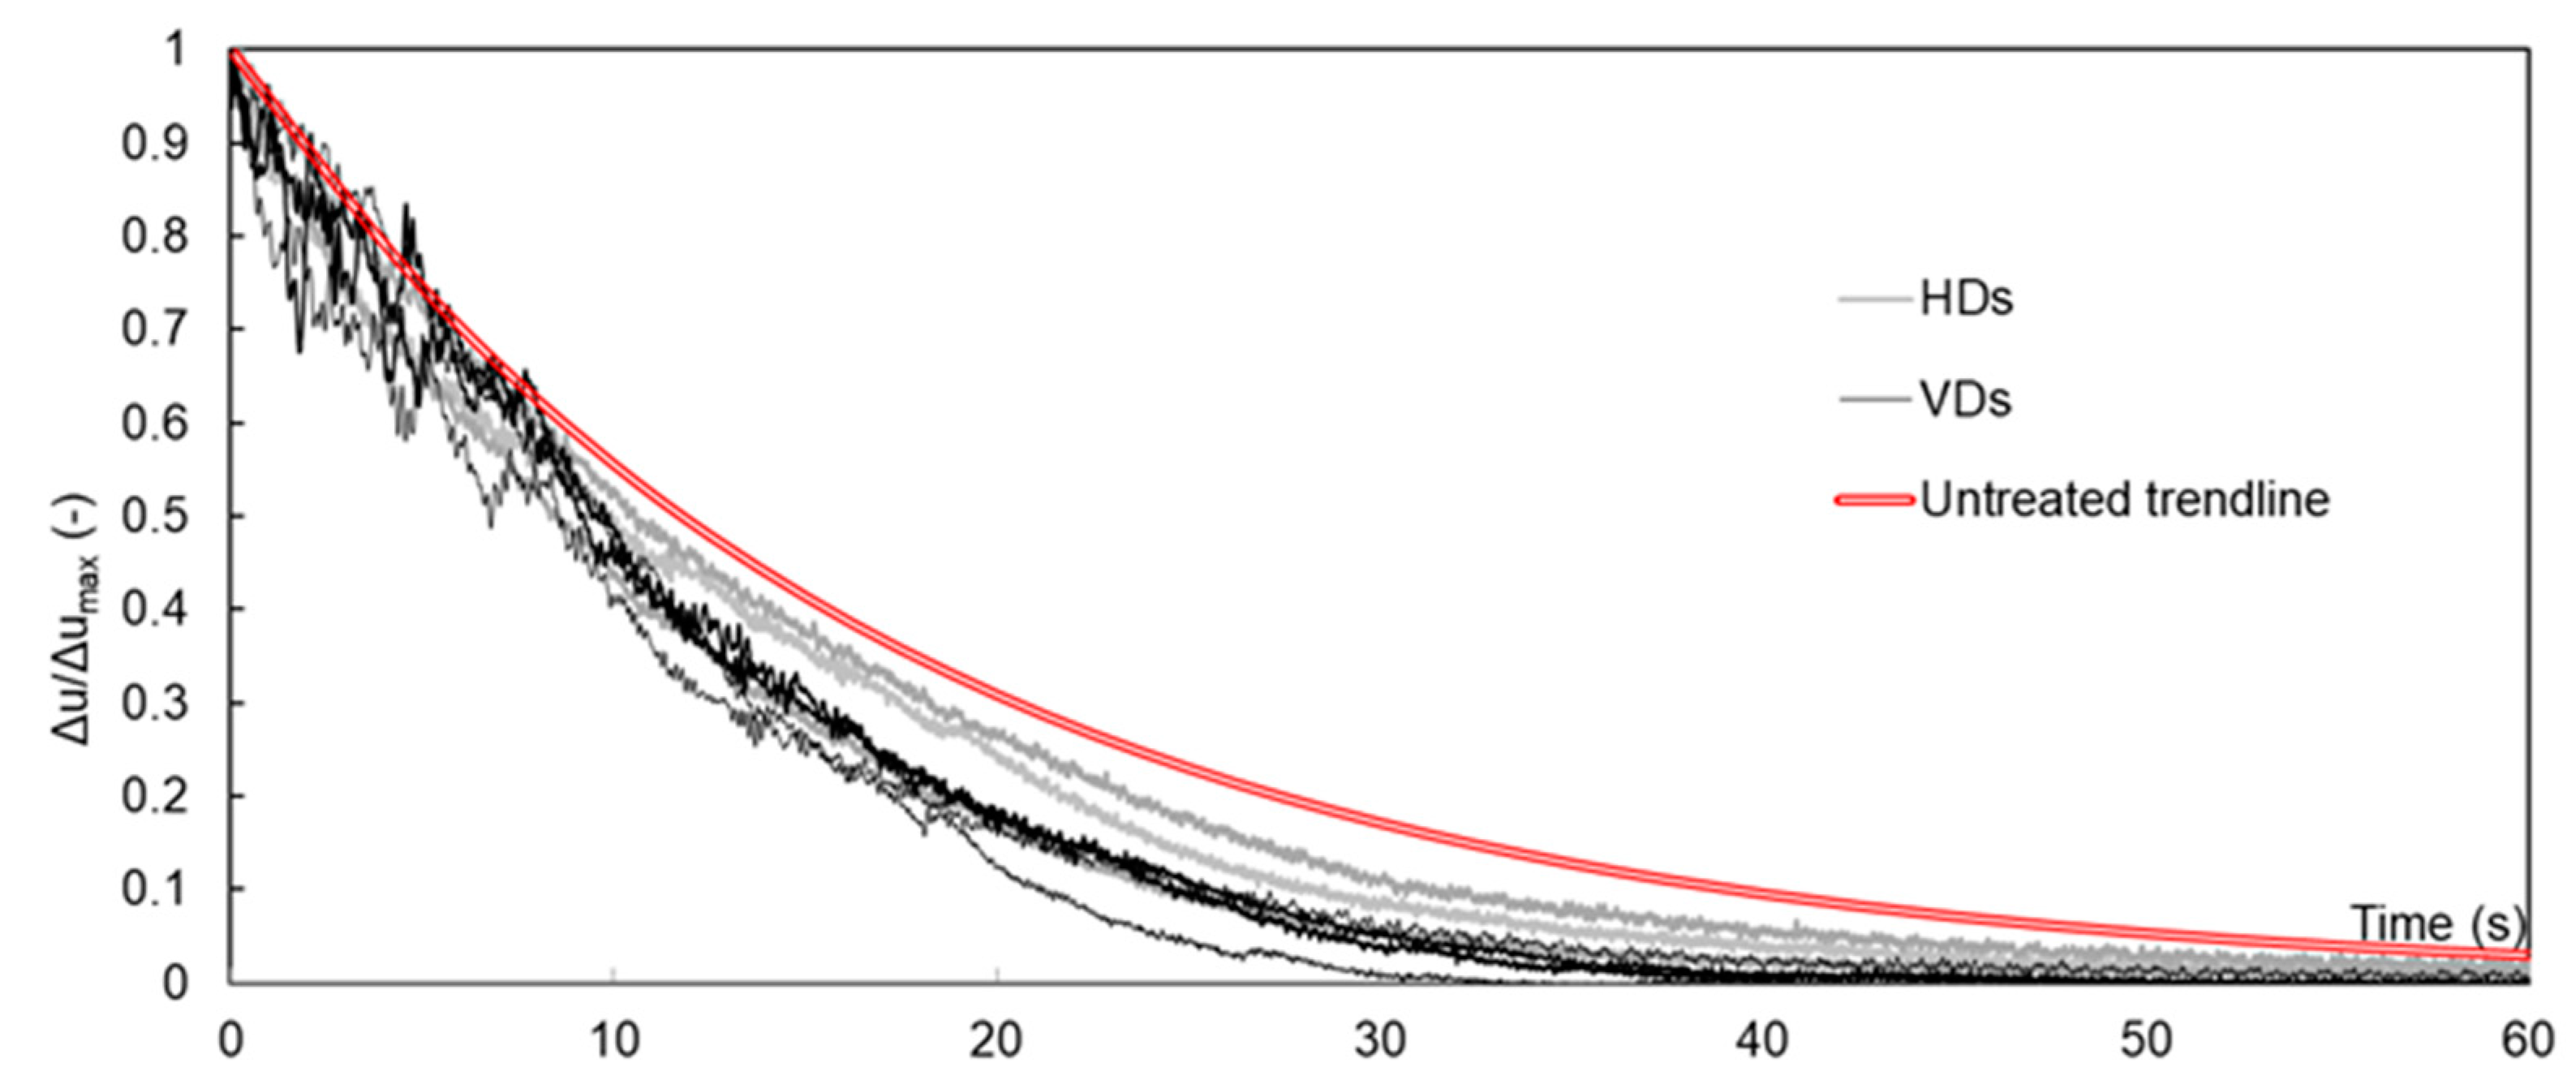
3. To obtain the best fit of the experimental curves, the hydraulic conductivity assumed was k = 0.0017 m/s. The decay function is represented as a red line in
Figure 7, where the measured decay of Δu is normalised over the maximum Δu. The red line is an average function computed to represent the dissipation trends of all the ppts, irrespective of their depth and, for this reason, the average drainage path length has been assumed in the computation.
3.2. General Observations from Other Models
The work discussed in this paper belongs to a large experimentation carried out to deepen some aspects of the phenomenon of liquefaction, including the triggering conditions. To this aim, the same untreated homogeneous model M1 described above was reconstituted using two other sands beyond S1: models M1_S2 and M1_S3 (test Ns. 11–12) in
Table 3. S3 is a natural, liquefiable sand retrieved at a site in Italy (Pieve di Cento) where liquefaction occurred in 2012; S2 consists of Pieve di Cento sand after the removal of fines particles (finer than 0.075 mm). The particle size distribution of S2 and S3 is represented in
Figure 1a. S2 and S3 are fine, uniform sands; the natural fine content of S3 is about 12% and is not plastic. S3 is composed of 45% quartz, 20% calcite, 22% feldspar, 6% chlorinate, 4% mica and 3% kaolinite. S2 and S3 have both φ’
cs = 34.5° (M = 1.4) and the critical state lines are shown in
Figure 1b.
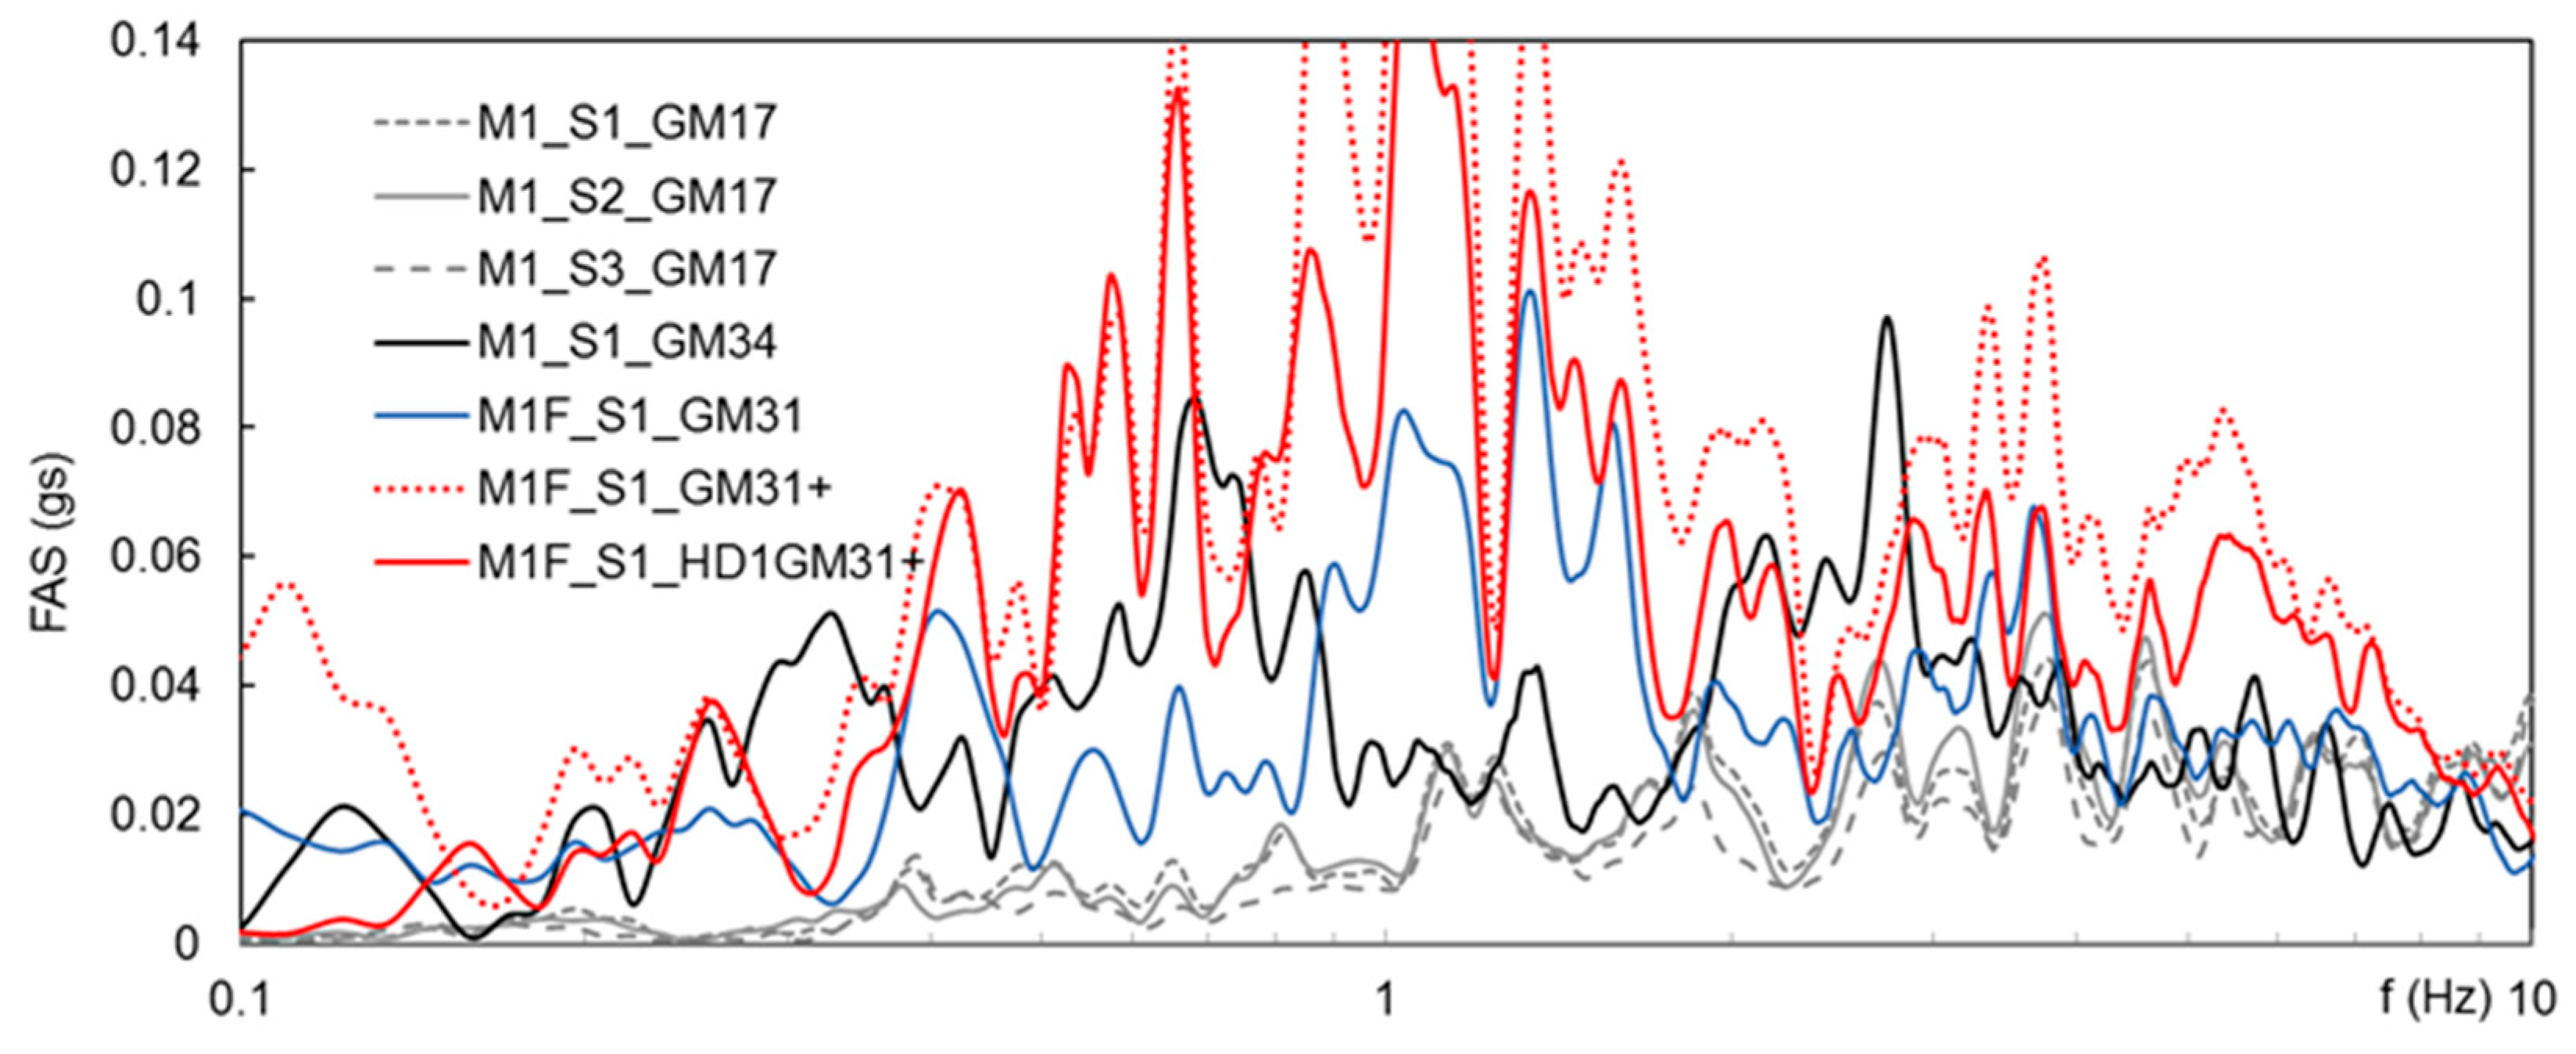
Model M1, reconstituted with S1, S2, and S3, was subjected to ground motions of variable intensity (GM17, GM34, GM31+) in addition to GM31 discussed above. GM31+ is an amplified version of GM31; details and the principal findings of these tests are discussed in [
13,
14]; in this section, only some results useful to evaluate the efficacy of drains are highlighted. Details of the eight additional tests here considered are given in
Table 3. The FASs of the applied GMs are shown in
Figure 8. In the test ID:
M1 indicates a homogeneous model;
S1, S2 and S3 are the testing sands;
F (tests N. 8, 9 and 10) indicates the presence of a structure, but the data reported below refer to the free field area, far from the foundation;
HD1 (test N. 10 in
Table 3) indicates the presence of a HD1 group of drains below the structure, but in this section, only data from the free field area, far from the structure and the drains are reported.
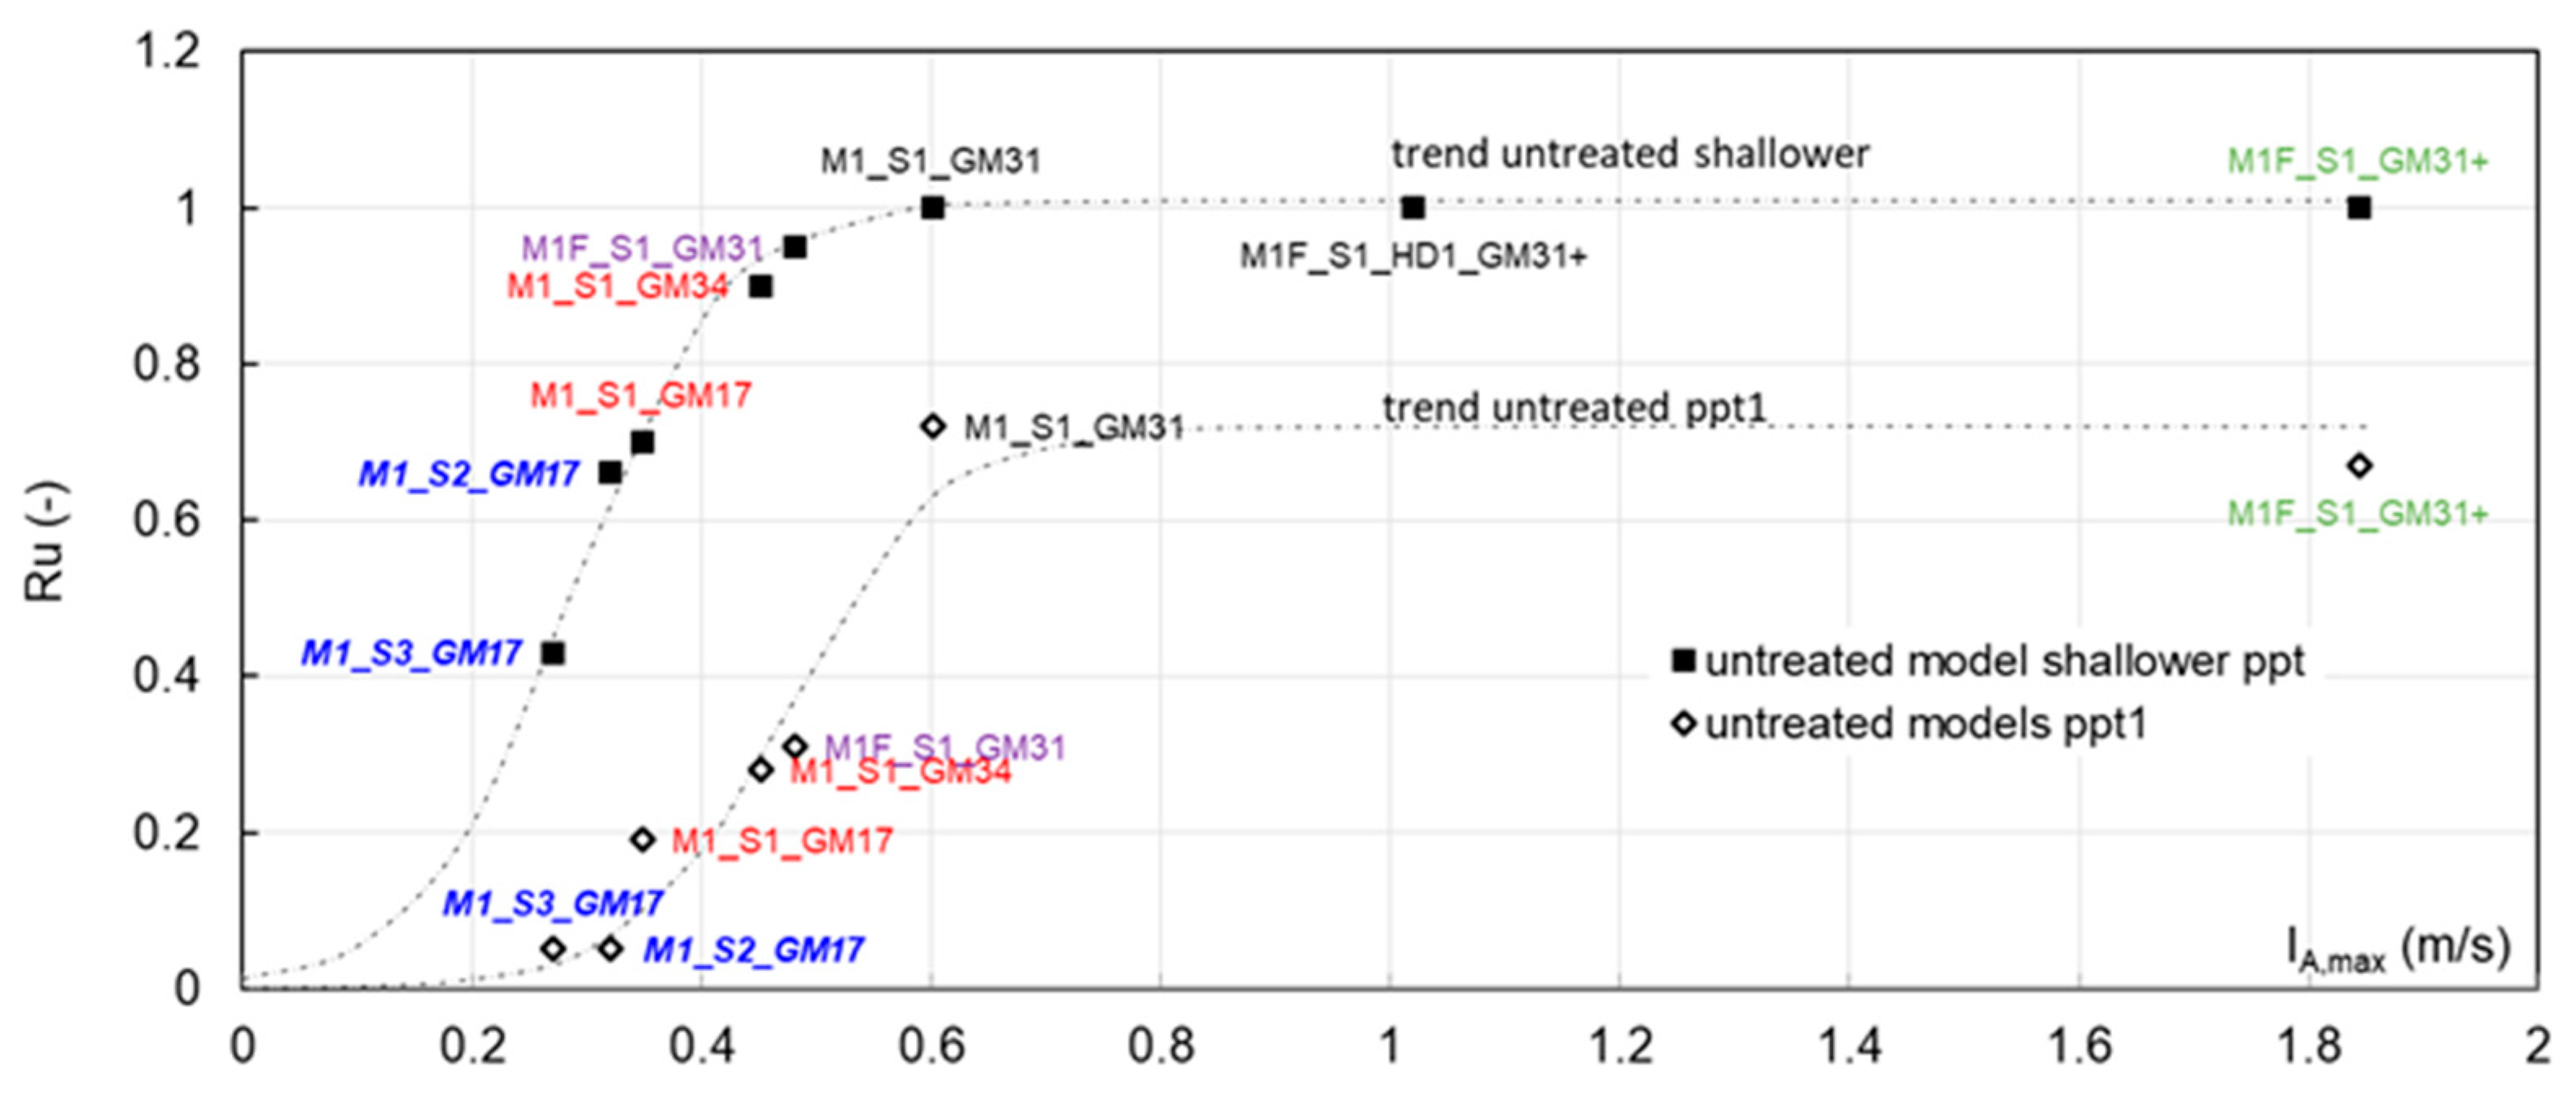
Referring to the eight models N. 1, 6–12 in
Table 3,
Figure 9 plots the max Ru values measured during the whole shaking by the base ppt, called ppt1, and by the shallower (free field) ppts, as a function of the max Arias Intensity. The distribution of Ru for both the deepest and the shallowest ppts follows a sigmoid function (herein referred to as Ru-Sig-function), as evidenced by the dotted interpolation curves sketched in the Figure and is unique for the tested models (stratigraphy and density). Ru increases with I
A,max up to a plateau reached for I
A,max ~0.6, for this specific stratigraphy. For I
A,max = 0.6, the shallower part of the model experiences liquefaction as a consequence of vibration induced excess pore pressure and fluid flows from below; the bottom of the container, on one side accumulates excess pore pressure due to the earthquake, on the other dissipates Δu upward, so avoiding exceeding Ru = 0.6.
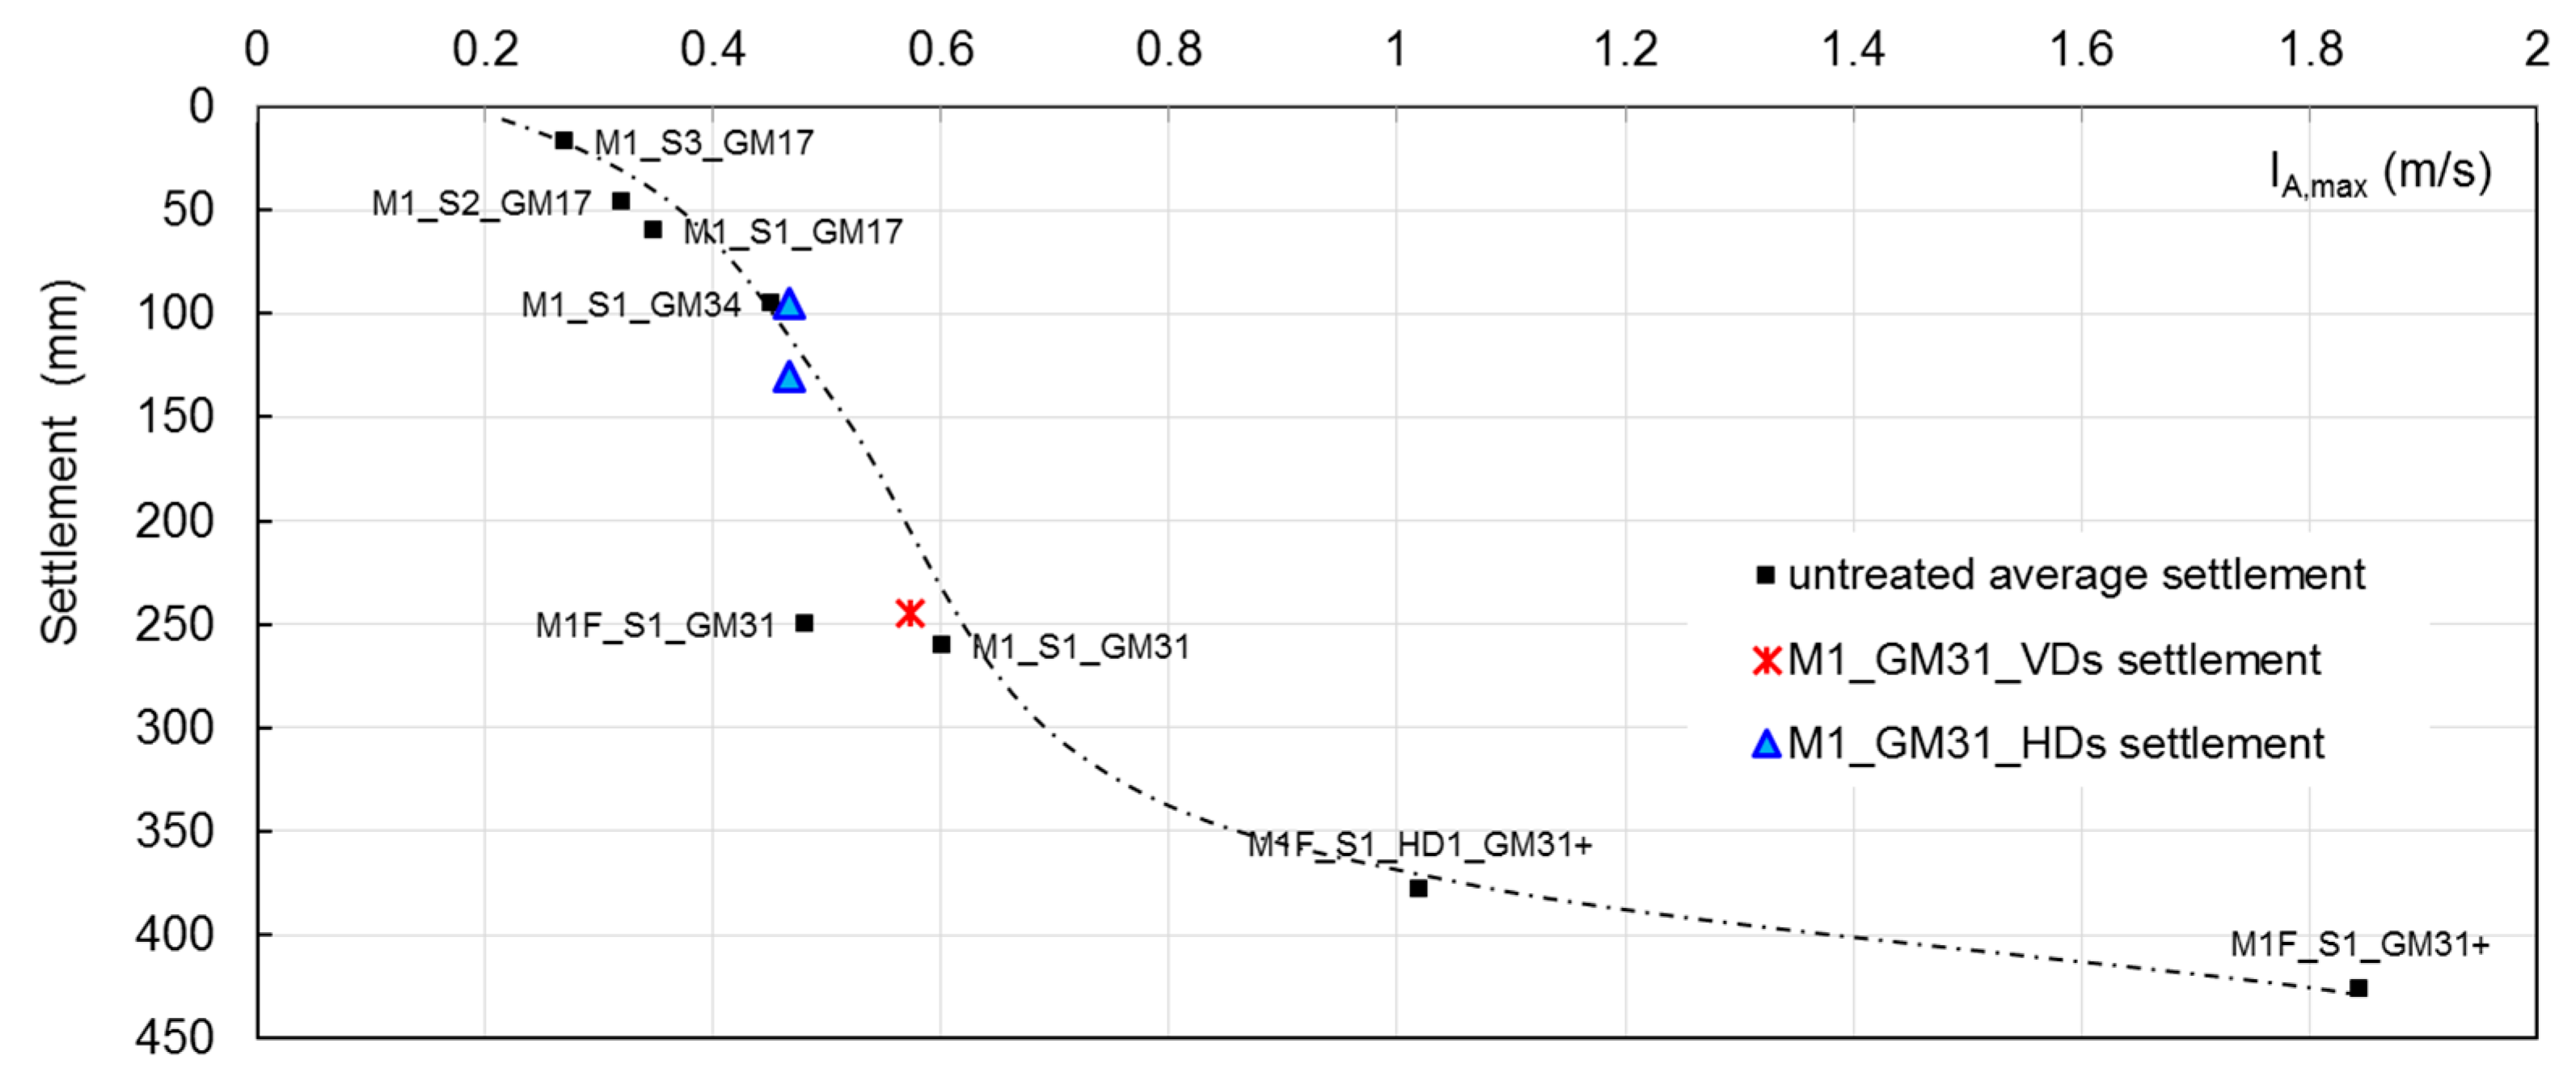
The final (end of recordings) superficial free field settlements from models N. 1, 6–12, plotted in
Figure 10, appear to follow an S-shape function (Settlement-S-function).
As a working hypothesis, the trends obtained from the untreated models shown in
Figure 9 and
Figure 10 are considered a link of general validity, for the tested geometry, between the intensity of the applied input motion and its effects in terms of induced excess pore pressure and superficial settlement.
Figure 9 and
Figure 10 can then be used to compare max Ru and superficial settlement measured in tests characterised by slightly different intensities and will be useful to interpret the results of models treated with drains discussed hereafter.
3.3. Effect of Vertical Drains on Pore Pressure Accumulation and Dissipation
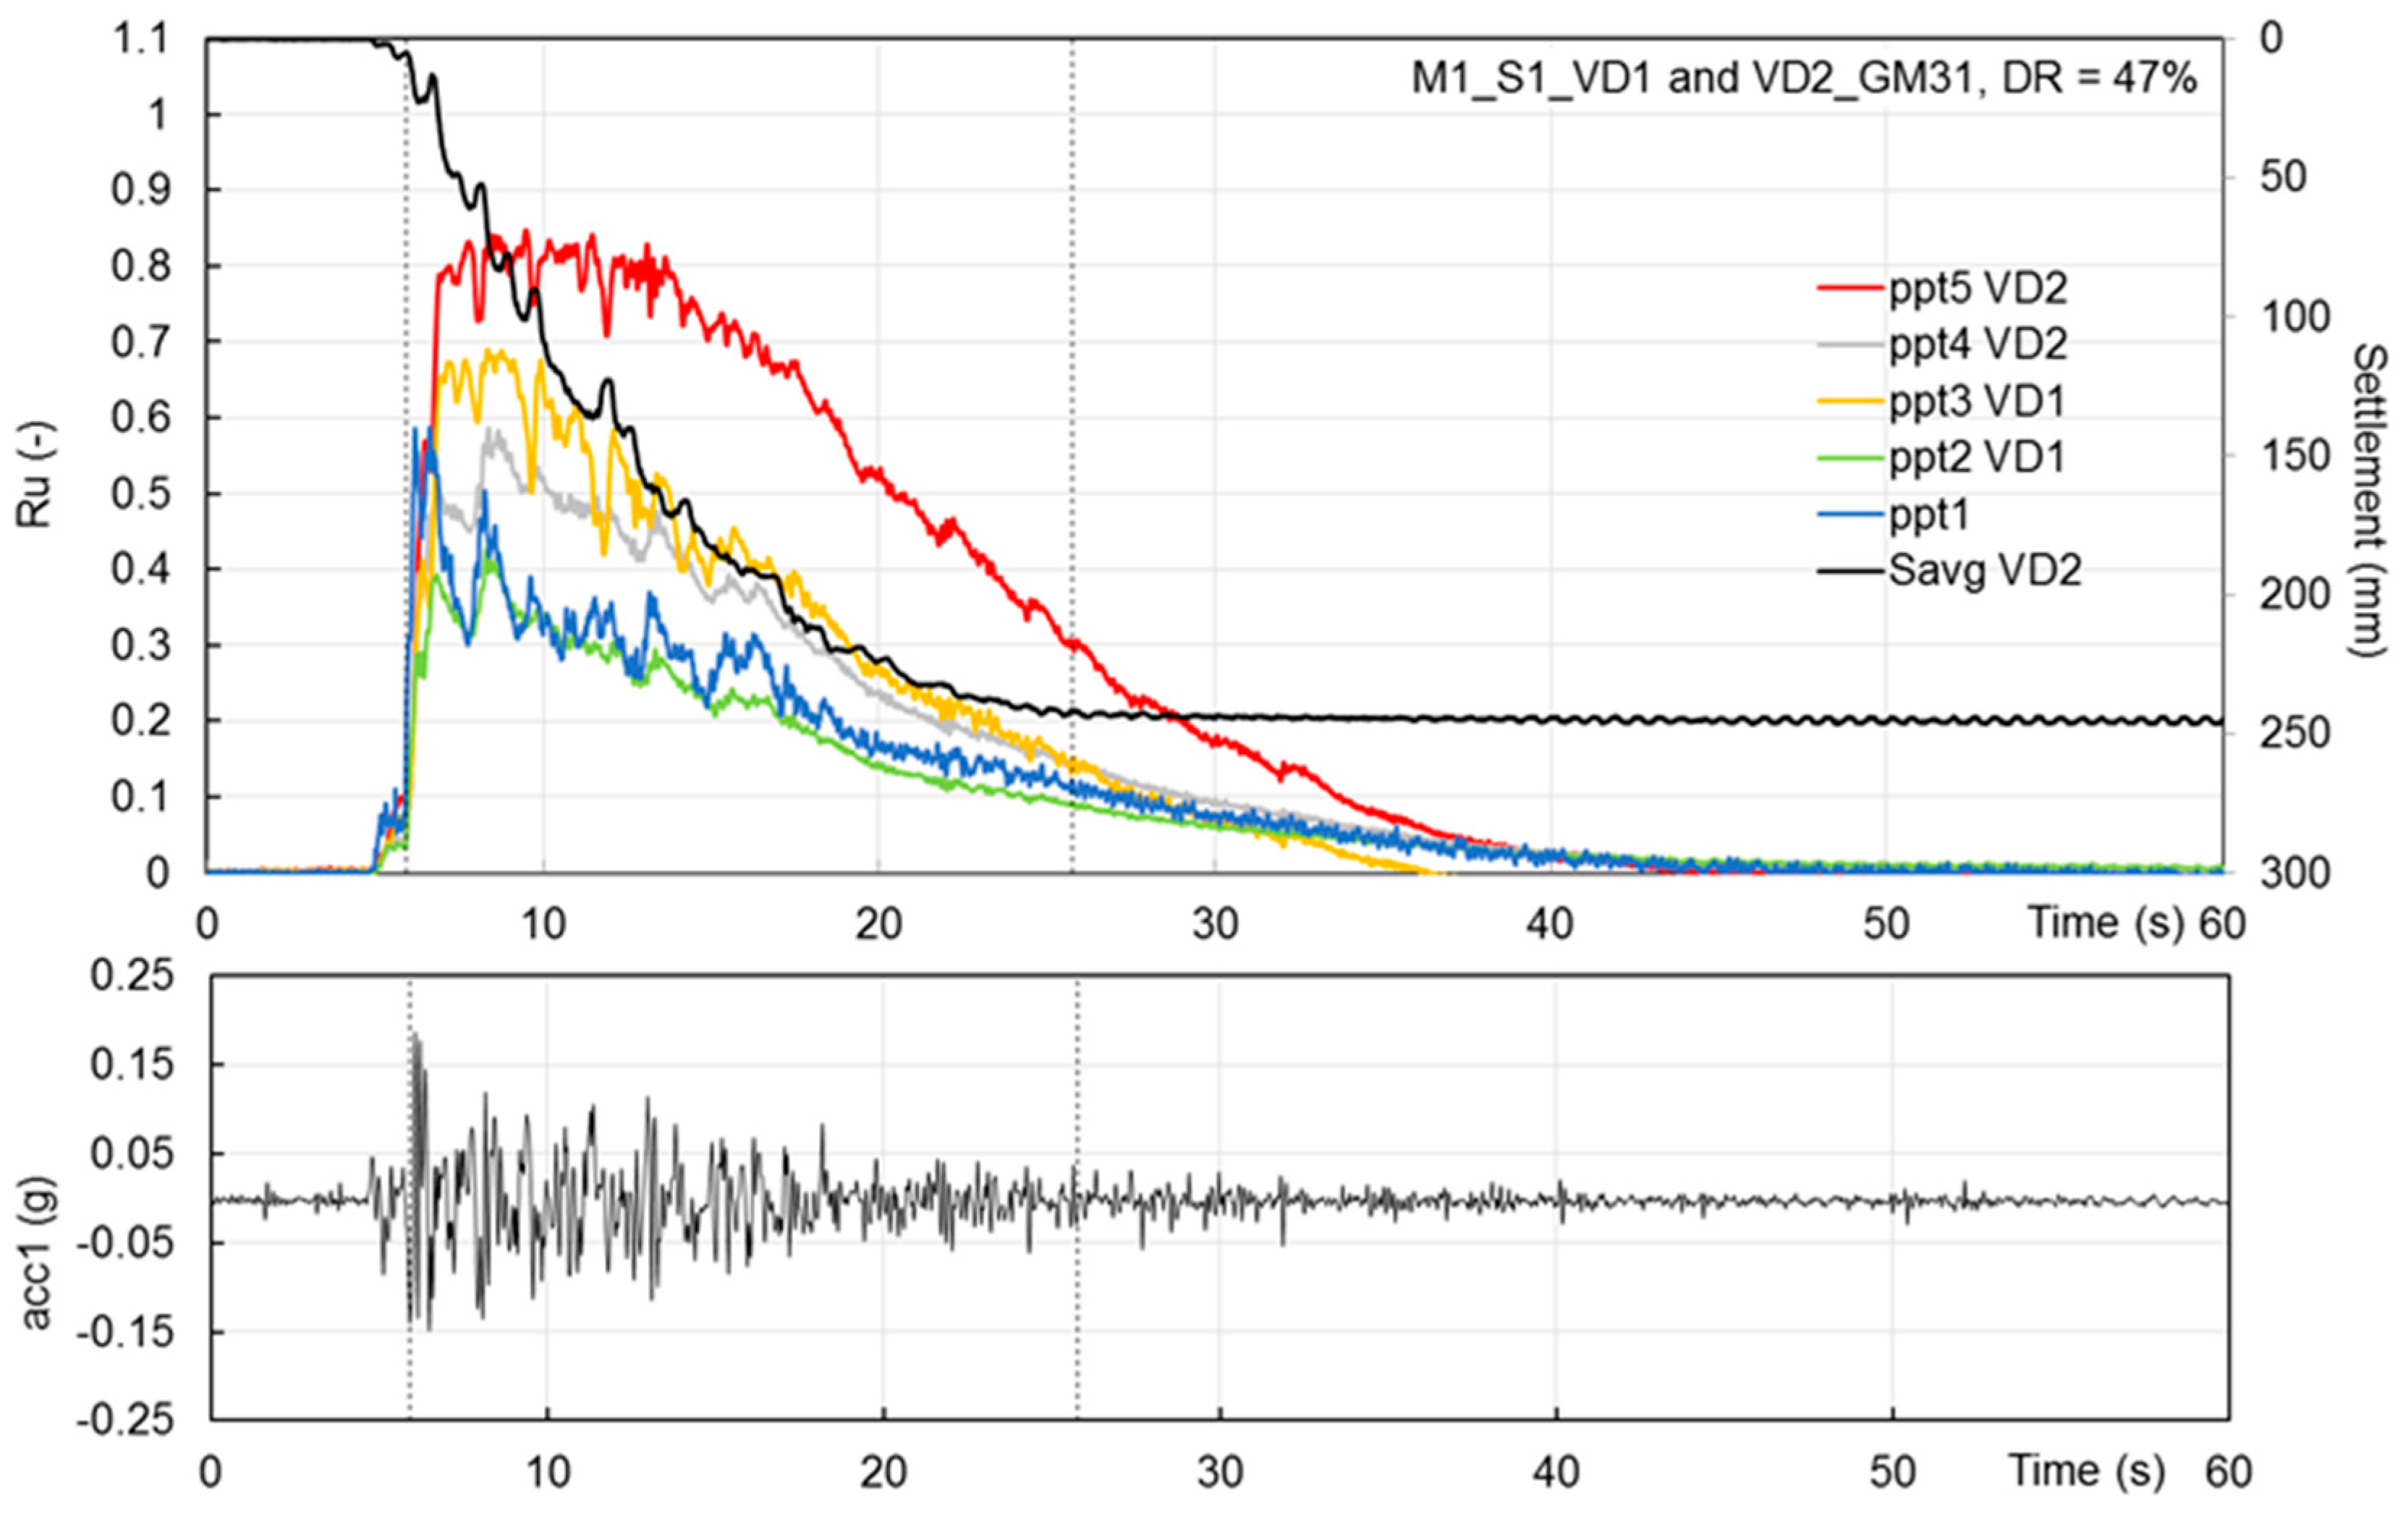
Figure 11 shows the time history of the base motion, of the pore pressure ratio Ru and surface settlement measured in the models equipped with vertical drains (results of both configurations of vertical drains, VD1 and VD2, superimposed). The related layout is plotted in
Figure 2b.
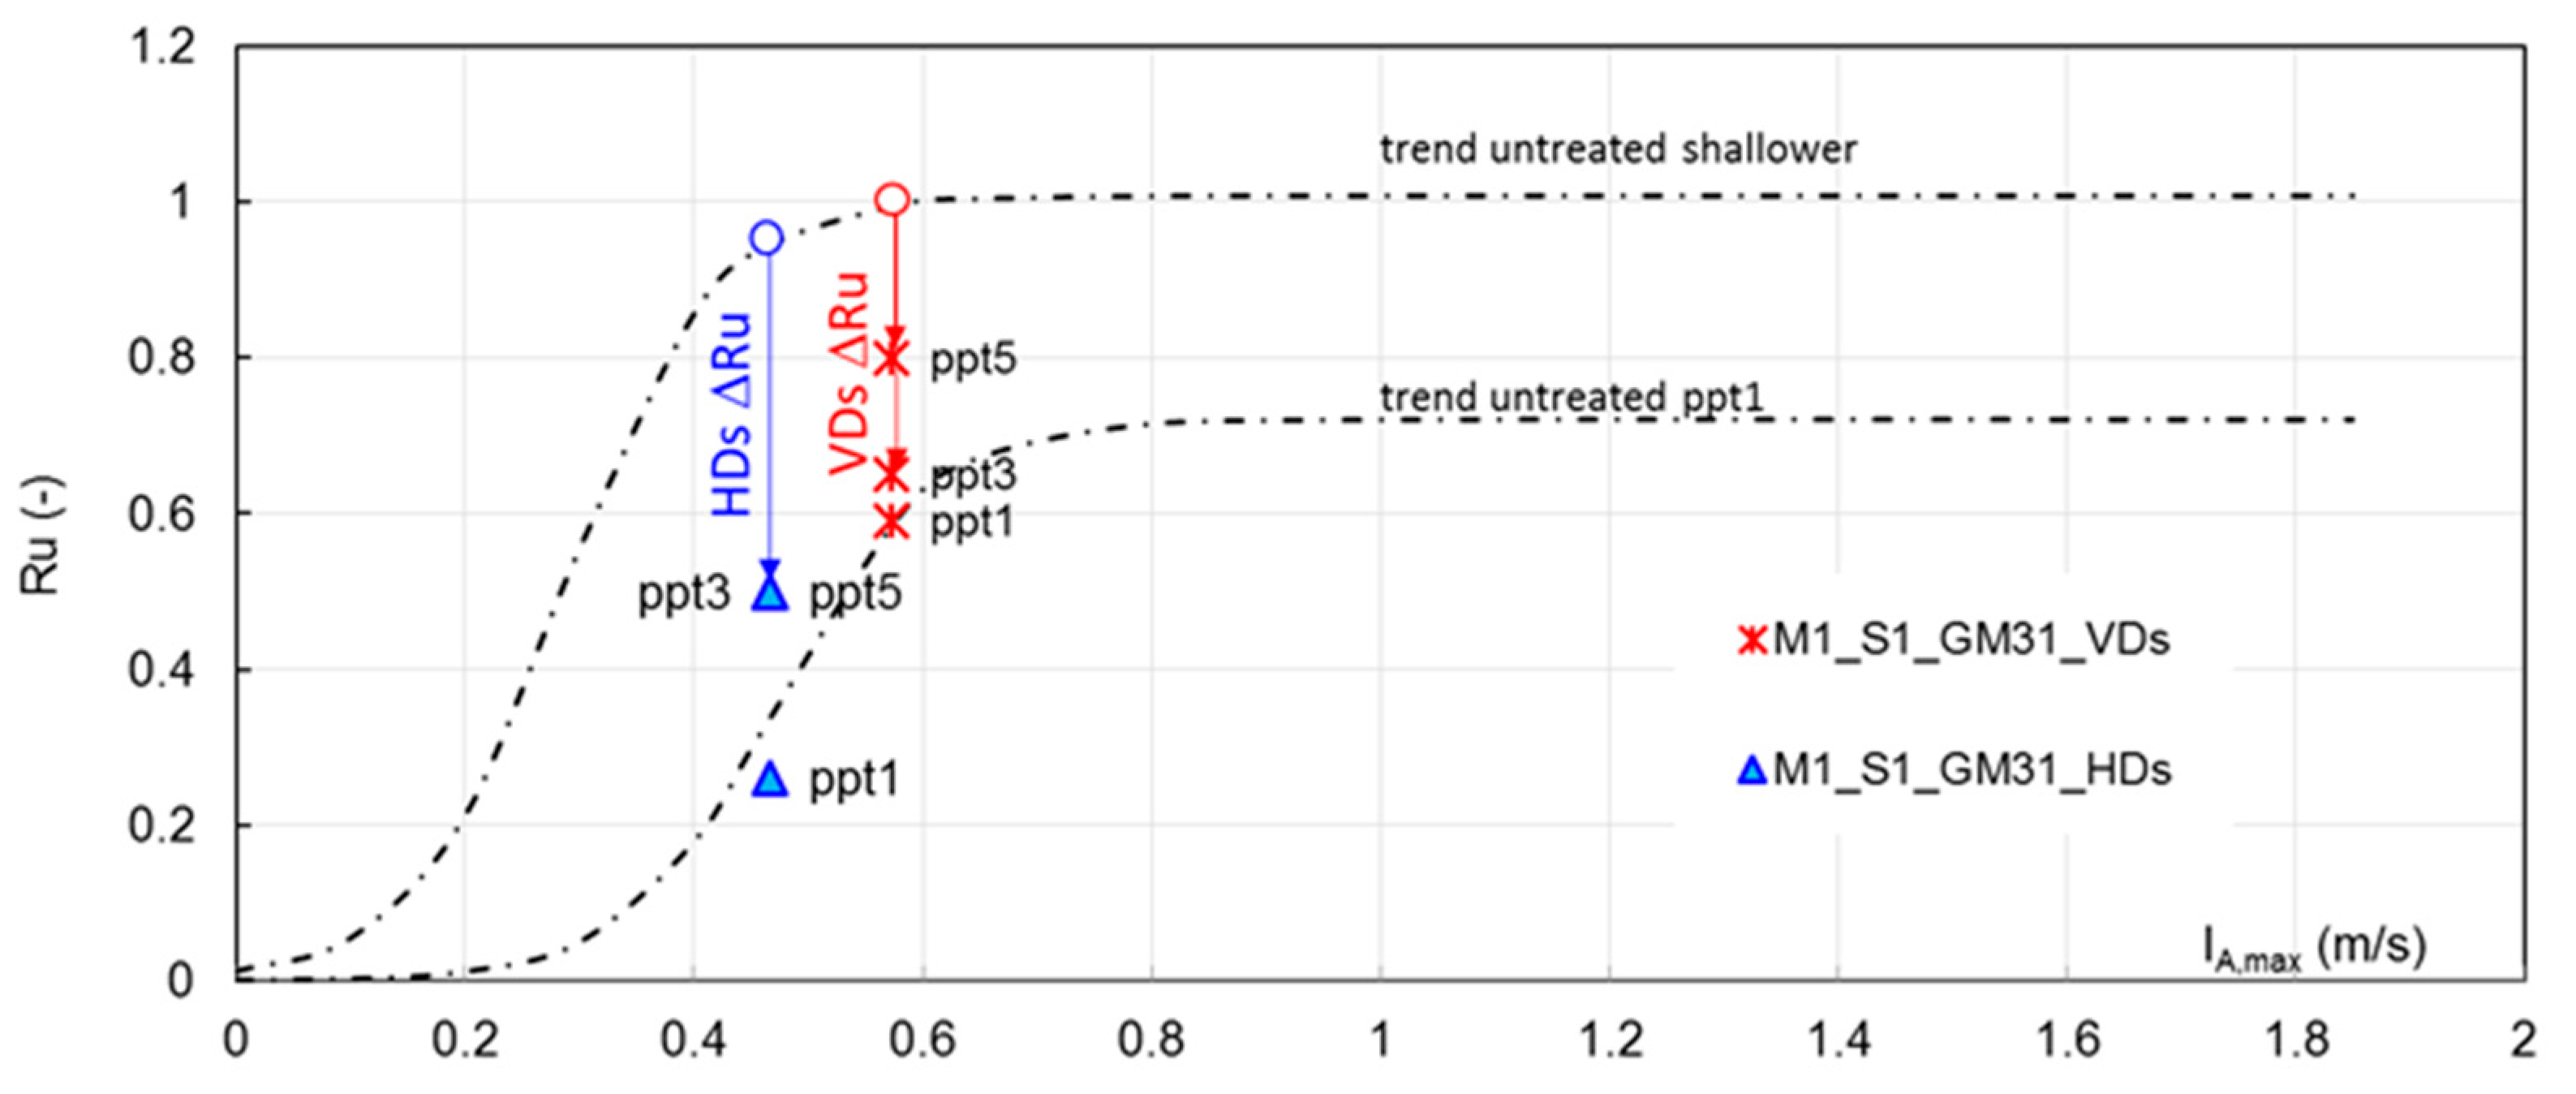
While in the untreated model M1_S1_GM31, the sand layer experienced full liquefaction from mid-depth upward, both configurations of VDs prevented liquefaction in the treated areas. As listed in
Table 4, the shallower ppts (ppt5 and ppt3 in VD2 and VD1, respectively) registered max Ru = 0.8 and 0.65, which means a reduction ΔRu of −20% and −35% in respect of the untreated model at a comparable depth (as can also be seen in
Figure 12, where ppts 1, 3 and 5 are shown and compared with the shallower Ru-Sig-function of
Figure 9). At the depth of ppt4 and ppt2, ΔRu was −40% in VD2 and −60% in VD1. The reduction is attributed to the effect of the drains, since ppt1 measures are in line with the Ru-Sig function of
Figure 9. In fact, ppt1 was located at the bottom of the container 20 diameter far from the treated area. As expected, the larger the spacing the higher the excess pore pressure.
In general, at all depths, in both VDs configurations, the max Ru was attained for a few seconds, then Δu decay started, well before the GM end, so that at the end of the dynamic excitation, more than 50% of the measured Δu was dissipated, in contrast with the untreated model where, at the end of the earthquake, half of the total height was at the fluid state. The superficial settlements (measured only by D2 as D1 did not work properly) were entirely co-seismic. In the balance between excess pore pressure generation and dissipation through fluid flow, the effect of VDs was to make the latter phenomenon prevail after just a few seconds of shaking, reducing the rate of Δu build-up, the maximum Δu measured and speeding up the rate of Δu decay. The dissipation period T
d is, in the case of VDs, equal to 10.75 s, as shown in
Figure 7, where the normalised dissipation curves measured in the treated models are shown and compared with the dissipation trend-line derived for the untreated model. The time scale of each curve is set to zero at the starting time of Δu decay.
As to the superficial settlement, D2 recorded a final settlement of 244 mm, against 265 mm measured at the end of reconsolidation in the untreated model, in line with the settlement expected for the applied intensity, on the basis of the Settlement-S-function in
Figure 10. This difference, a little less than -10%, is considered an experimental scatter.
The effect of drains is to accelerate excess pore pressure dissipation preventing its accumulation; if no densification is induced by the installation, as in the case of prefabricated drains, they have no effect on the state of the sand prior to the earthquake and on its tendency to contract and generate Δu, when vibrated. In consequence, in free field conditions, the efficacy of drains in terms of settlement reduction is limited, as drains only make Δu dissipation prevailing on generation without preventing the soil to strain. In the presence of buildings, instead, drains are also efficient in the reduction in settlements, since, avoiding soil fluidification, they prevent building sinking [
10,
19,
20], provided that they are sufficiently distributed below the whole structure print [
12].
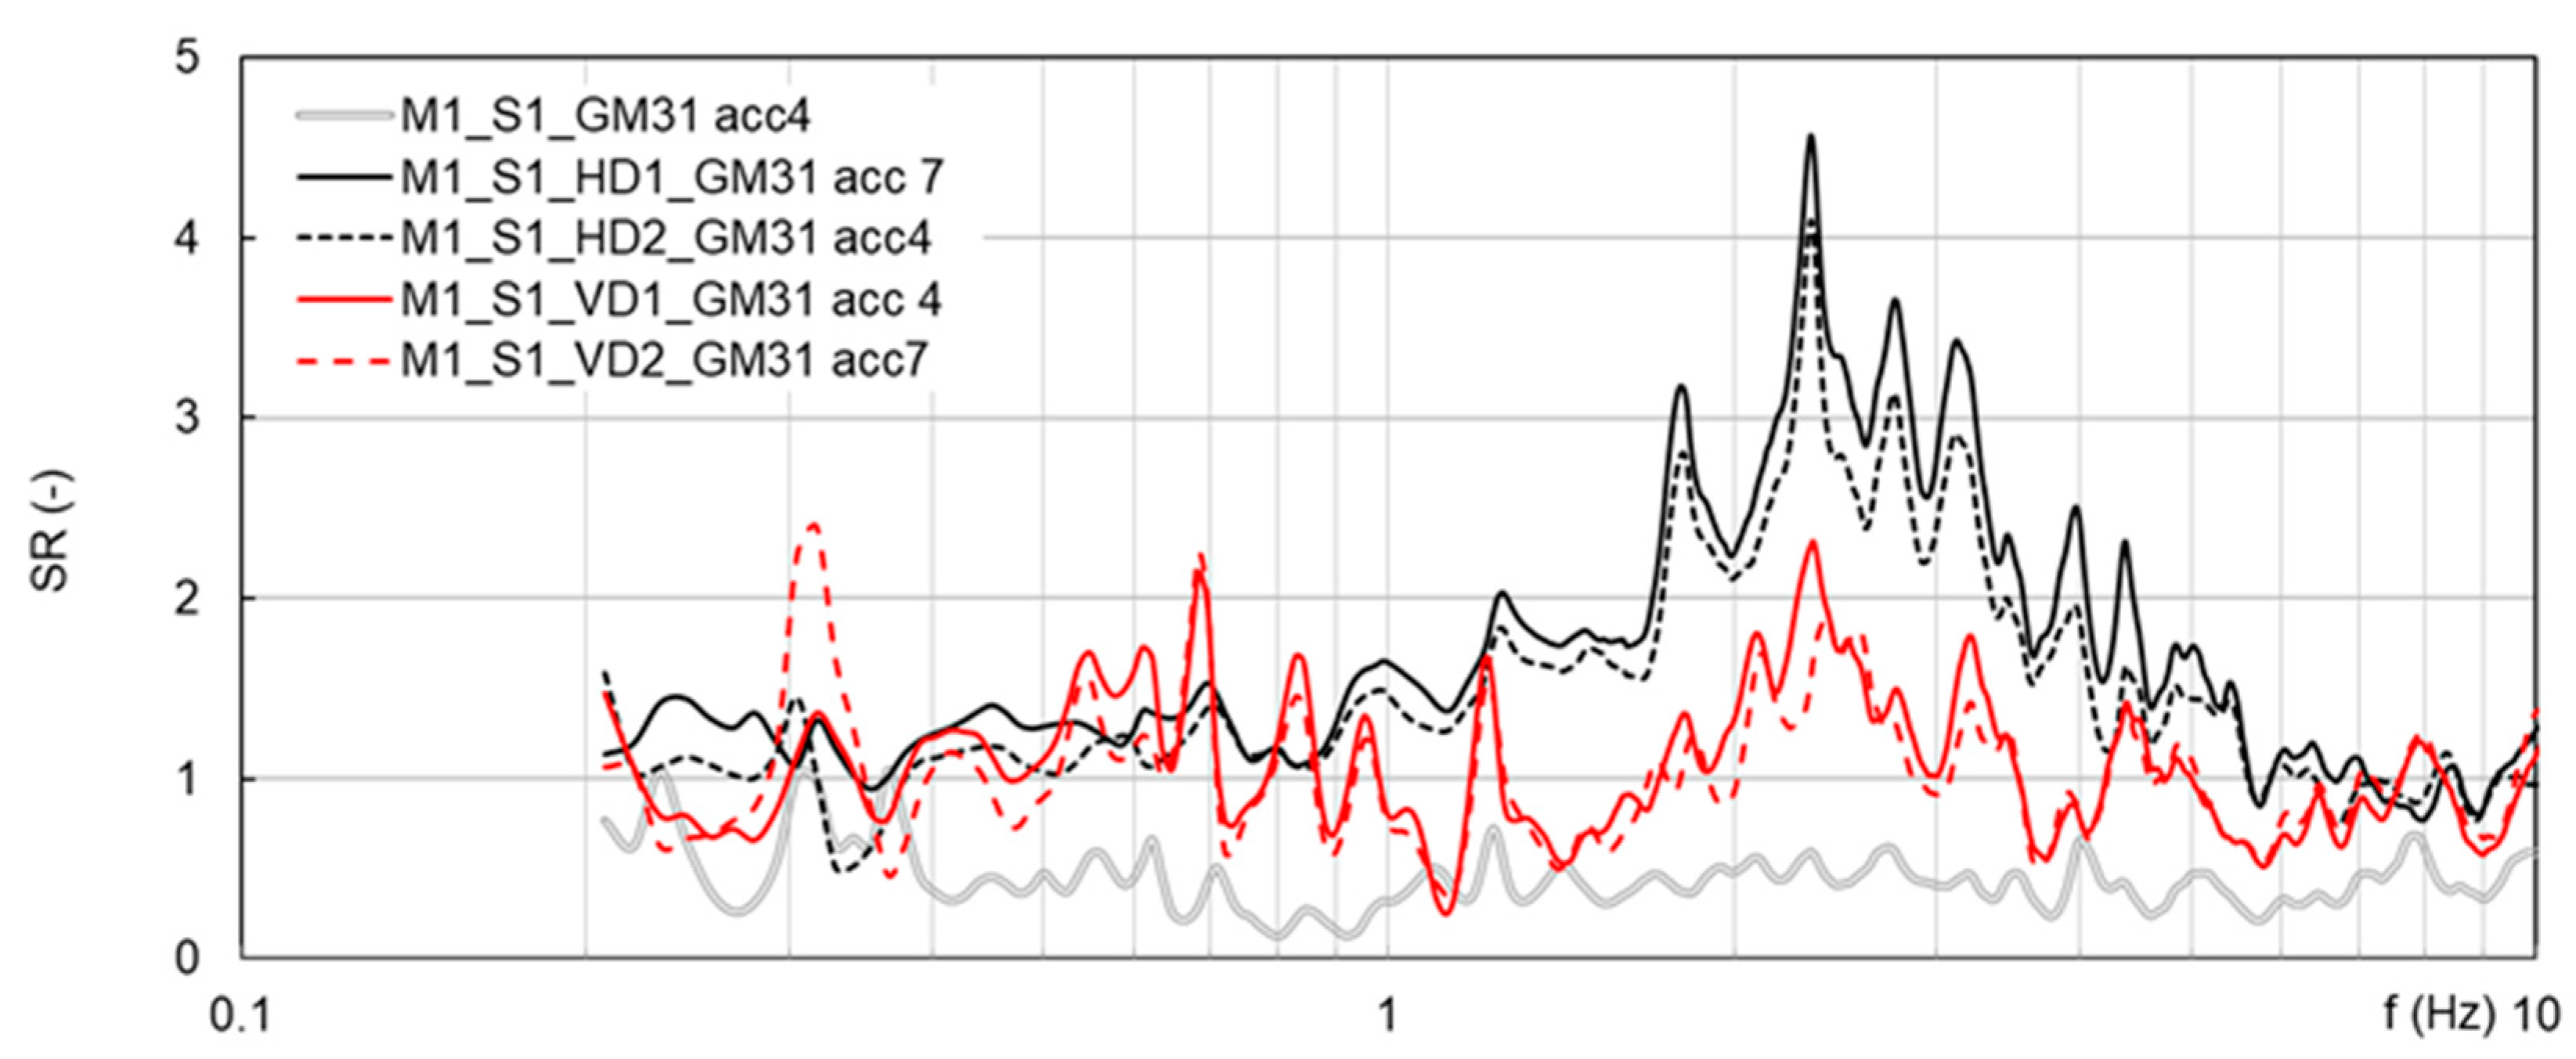
Figure 13 reports the spectral ratio SR of accs 4 and 7, obtained by dividing their FAS by that of acc1. The columns of accelerometers were located at a distance of 8D from the external row of drains, in both VD1 and VD2 configurations. In the untreated model, the measures of the shallower accelerometer (also reported in
Figure 13) indicated de-amplification at all frequencies as a consequence of liquefaction. In the presence of VDs, the principal frequencies of the applied GM (concentrated in the range 0.8–2 Hz, red line in
Figure 5) arrived near the surface mostly damped, while slight amplification effects were observed in the range 2–4 Hz, around the natural frequency of the deposit. In general, it seems likely that the influence of drains in the particular test configuration was only slightly appreciable at a distance of 8D, and probably not further.
3.4. Horizontal Drains
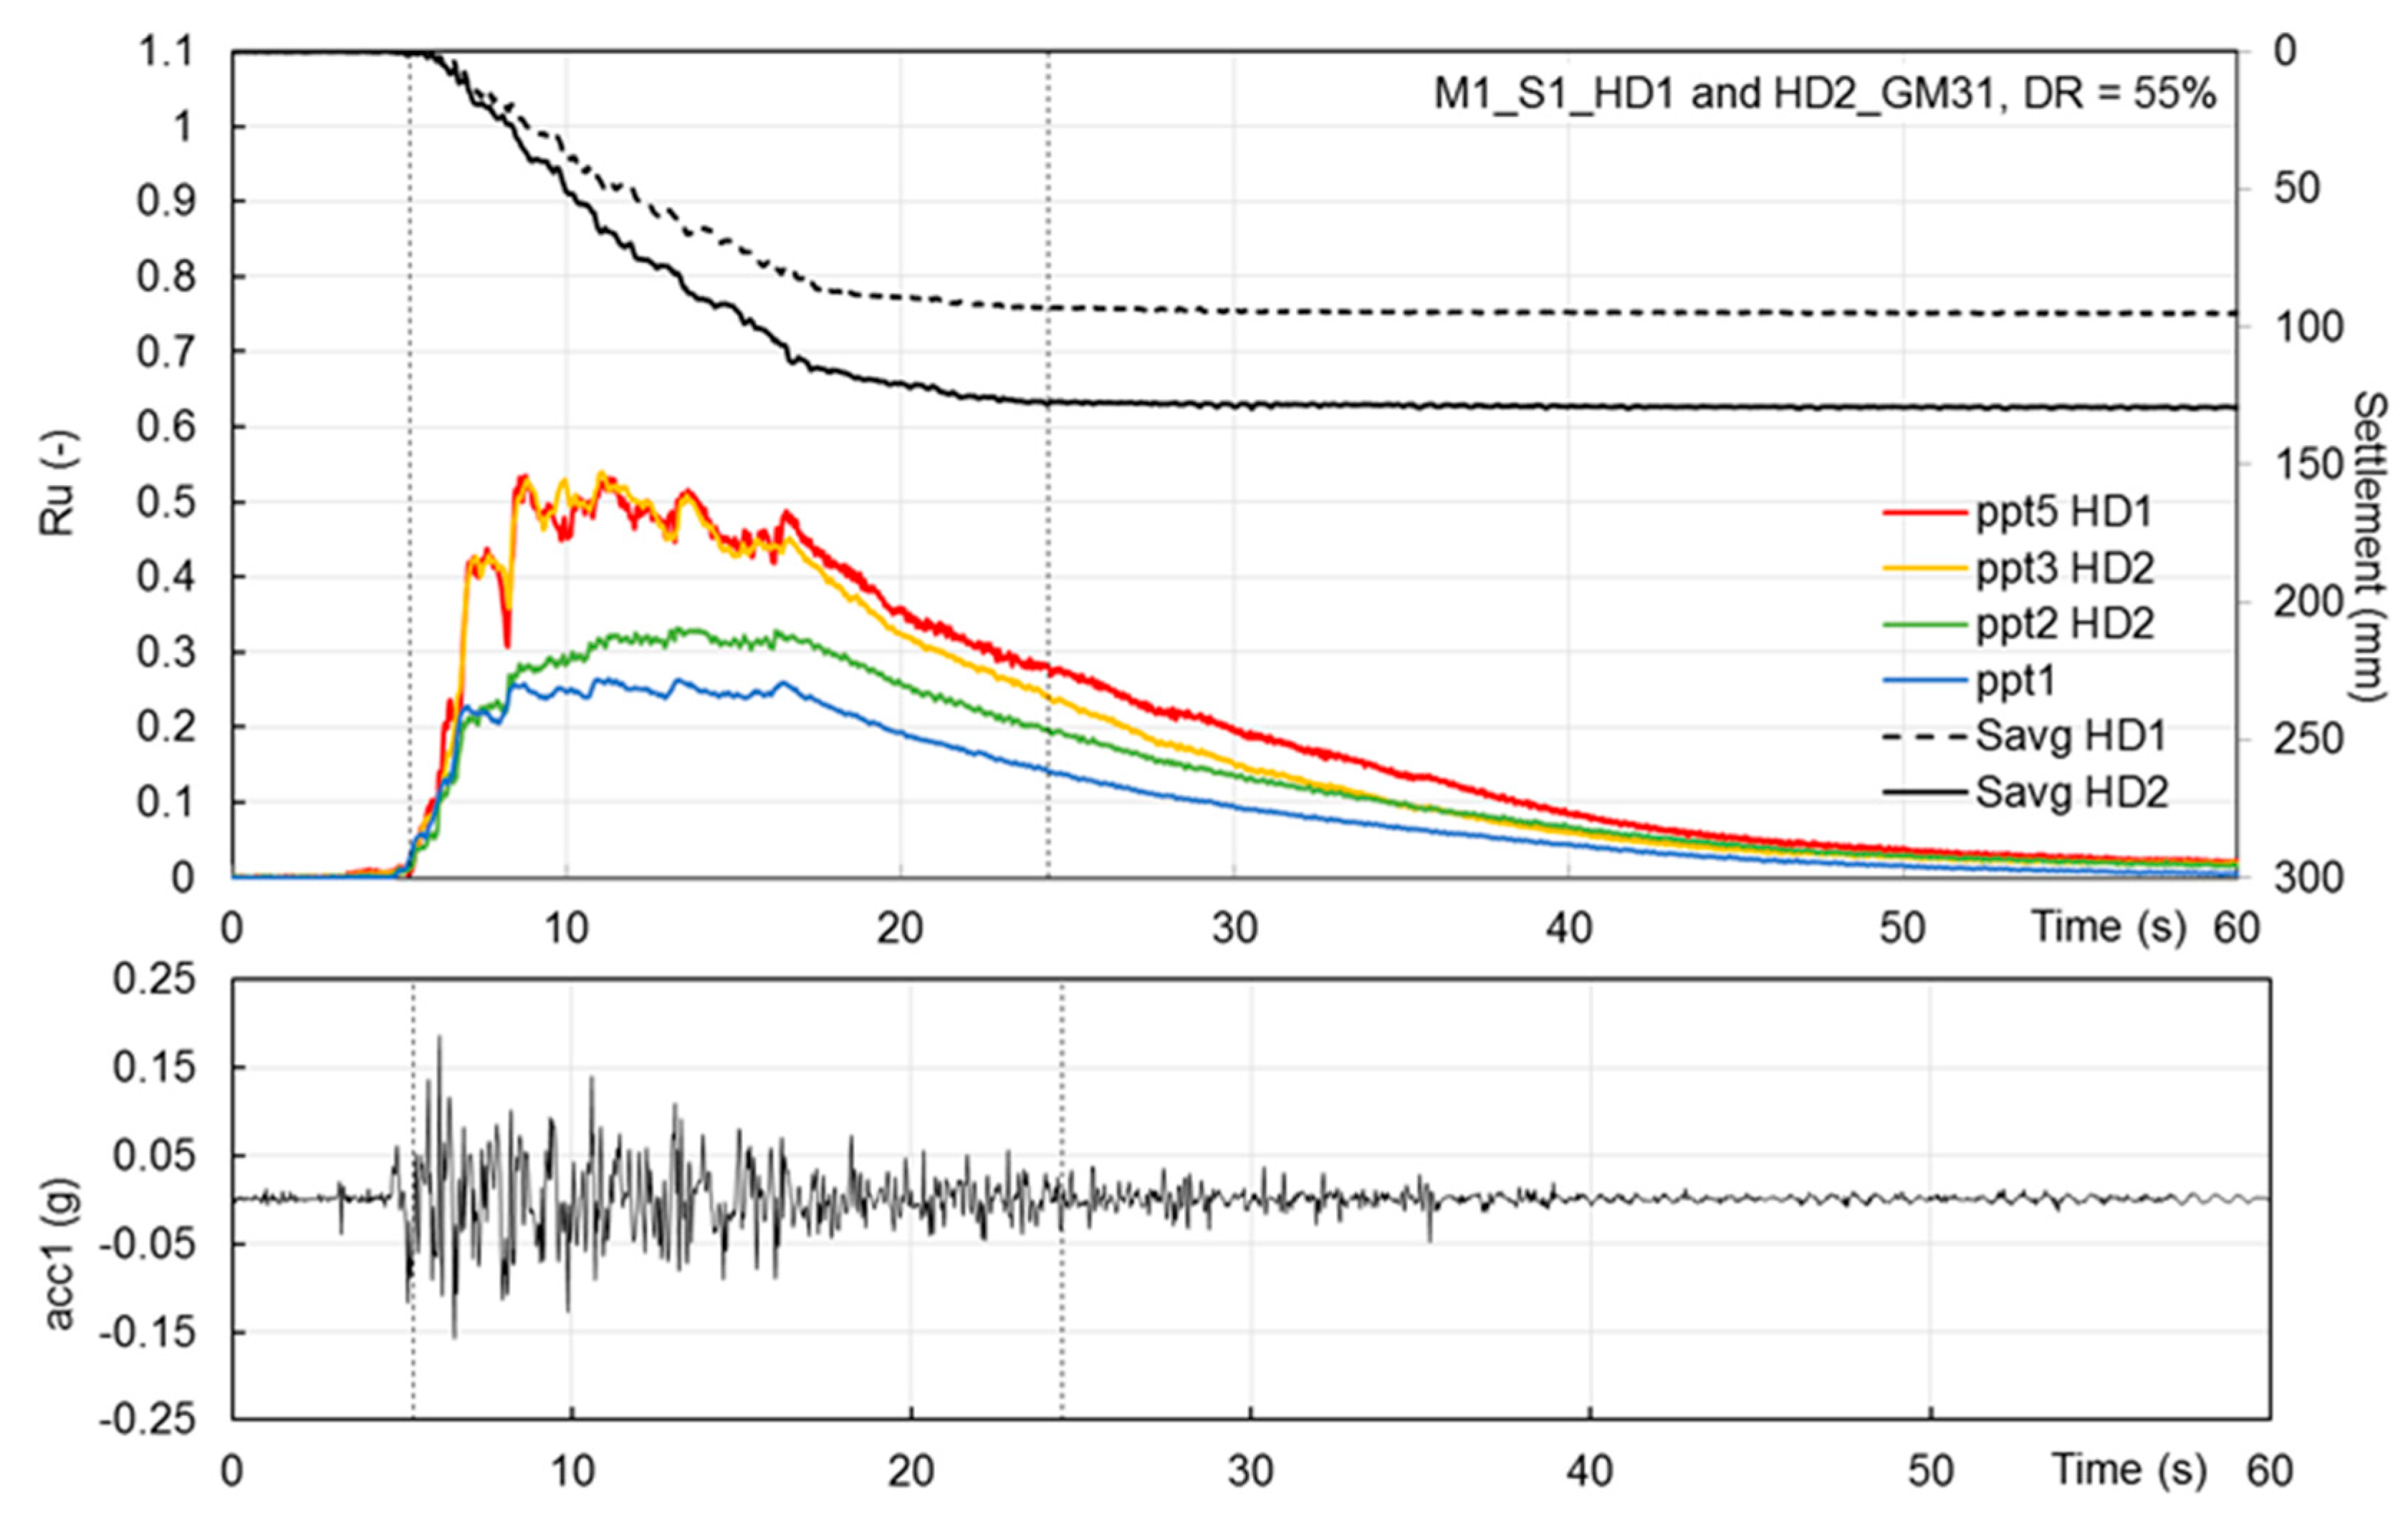
When analysing models treated with HDs, account has to be taken for the applied input motion weaker than in models N. 1, 2 and 3. As discussed above, tests on untreated models have shown that I
A,max influences both the max Ru and the superficial settlements. To quantify the effect of HDs (test results in
Figure 14) despite the weaker earthquake, the Ru-Sig functions shown in
Figure 9 can be used. The functions are re-plotted in
Figure 12. According to the trends, for I
A,max = 0.467, ppt1 and ppts 3/5 should have measured Ru equal to about 0.3 and larger than 0.9, respectively (see
Table 4). The actual measured values were 0.26 and 0.5.
Ru = 0.26 is quite similar to the expected value, and is considered an experimental scatter; Ru = 0.5 in the treated areas implies that HDs induced a Ru reduction ΔRu of around −45%, confirming the efficacy of the adopted configuration of HDs as a liquefaction countermeasure.
As to the surface settlements, HDs models developed co-seismic settlement equal to 95 mm and 130 mm in HD1 and HD2, values in line with those expected for I
A,max = 0.467 from untreated models (Settlement-S-function
Figure 10), confirming their efficacy in avoiding excess pore pressure accumulation and liquefaction, but not on Δu generation and consequent reconsolidation settlement.
As in the case of VDs, in the presence of HDs, the max Ru was attained for a few seconds and Δu decay started before the GM end, slightly slower than in the VD models (
Figure 7) and dissipation period T
d is this case was equal to 13 s.
In HDs models, the columns of accelerometers were 5D and 10D distant from the external rows of HD2 and HD1 drains, respectively. The spectral ratio of accs 4 and 7 in
Figure 13 are similar and both indicate amplification effects, all along the frequency range investigated and in particular around the natural frequency of the deposit, likely due to the weaker input motion applied at the base.


