Article

Effect of Curing Time on Lime-Stabilized Sandy Soil against Internal Erosion

by
Shaziya Ahmed Banu
and
Mousa Fayiz Attom
*
Department of Civil Engineering, American University of Sharjah, Sharjah P.O. Box 26666, United Arab Emirates
*
Author to whom correspondence should be addressed.
Geosciences 2023, 13(4), 102; https://doi.org/10.3390/geosciences13040102
Submission received: 8 February 2023 / Revised: 10 March 2023 / Accepted: 15 March 2023 / Published: 30 March 2023

Abstract

:
One of the key challenges geotechnical engineers face is the failure of embankments due to internal soil erosion. Therefore, soil stabilization against internal erosion becomes necessary to prevent embankment failure. This paper aims to use lime to stabilize sandy soil against internal erosion. Two types of sandy soil (poorly graded and well-graded) were treated with different percentages of lime (based on the dry weight of the soil) and curing times (1 day, 2 days, and 7 days). For poorly graded soil, the different lime percentages used were from 0.0% to 6.0% with an increment of 1% by dry weight of soil. While for well-graded soil, the lime percentages used were 0.0%, 1.0%, 2.0%, and 3.0% by dry weight of soil. The hole erosion test (HET) was utilized to analyze the erosion parameters of the soil samples. Results proved that lime is an effective soil stabilization agent against the internal erosion of sandy soil. Moreover, for optimum stabilization against internal erosion, poorly graded and well-graded sandy soil required about 5.0% and 3.0% of lime, respectively, with a curing time of 2 days. Significant reduction in erosion rate and improvement in the erosion rate index and critical erosion stress were observed at optimum soil stabilization. In addition, the results demonstrated that the curing time increases the erosion rate index and reduces soil erosion.

1. Introduction

Earth structures such as dams, levees, and embankments assist in modifying the natural behavior of water bodies such as rivers and lakes by intensifying their flow fall. These structures, mainly composed of sand, are used for retaining or diverting water for drinking, recreation, and irrigation purposes [1]. Hence, it is essential to use the soil in its greatest engineering condition to avoid issues related to soil–water interactions such as splash erosion, internal erosion, or collapsibility [2,3,4]. Failure of earth-fill structures can lead to the destruction of lives and property. Luthi [5] reported that about 30–50% of failures and accidents of embankment dams ensue due to piping, one of the governing types of internal soil erosion. Internal erosion of soil can be defined as the erosion of soil particles due to the passage of water flowing through the soil from the upstream side (reservoir) to the downstream side [5,6]. Due to the erosion of soil particles, a hole may be formed within the structure, resulting in the infrastructure’s failure. Hence, soil stabilization against internal erosion is vital to avoid the failure of such structures. Identifying failure signs due to piping in earth-fill dams can be difficult. So, researchers have been exploring different ways of achieving soil stabilization against internal erosion to design and construct effective dam projects with higher safety assurance. Foster et al. [7] investigated the safety of dams and found that there are many reasons behind dam failures. However, internal erosion and piping were determined to be the most significant among them. The Bureau of Reclamation by Hanneman [8] stated that 99 out of 220 projects had faced internal erosion accidents after a successful operation for many years. Moreover, Europe had experienced similar failures of small dams and ponds [9]. Wan and Fell [10] developed two test methods (the hole erosion test and the slot erosion test) to investigate the soil erosion characteristics of embankment dams. The results demonstrated that the erosion rate depends on the following factors: plasticity, fine soil and clay content, dispersivity (detachment and spread of soil particles), dry density, compaction water content, clay mineralogy, degree of saturation, and the presence of cementing materials such as iron oxides. Moreover, coarse-grained and noncohesive soils erode faster with lower critical shear stress in comparison to fine-grained soils [10]. An increase in factors such as the plastic index, clay content, dry density, and optimum moisture contents results in lower soil erodibility, whereas, an increase in the degree of saturation, cementing materials such as iron oxides, and dispersivity leads to higher soil erodibility.
Soil stabilization is performed by adding stabilization materials to soil used in earth-fill dams. Soil stabilizers enhance the soil’s strength and properties using physical or chemical means [11]. Many soil stabilizers such as cement, lime, fly ash, wheat husk, and rice husk ash have been investigated for their stabilization, shear strength, and bearing capacity properties. Additionally, the soils were examined to check their effect on stabilization against compressibility and swelling. Lime as a soil stabilizer is an intriguing option due to its availability and cost-effective nature. Moreover, lime-stabilized soils have shown a higher bearing capacity and easier excavation, compaction, leveling, and discharging properties [11].
Khemissa and Mahamedi [12] investigated the effect of cement and lime inclusion in expansive overconsolidated clay. The results demonstrated that including cement and lime increases the bearing capacity, durability, and strength of the soil. About 8% of cement and 4% of lime were required to obtain the best performance of the clay soil. Lemaire et al. [13] studied the mechanical behavior of cement and lime-treated silty soil. Results demonstrated that soil gets stabilized with 5% of cement and 1% of lime, and a significant improvement in unconfined compressive strength and microporosity filling of the structure were observed. The effects of lime stabilization on the physicochemical properties of the clay soil were investigated by Bessaim et al. [14]. Results demonstrated a reduction in plasticity and better soil workability. Additionally, the inclusion of lime improved the pH of the soil and activated pozzolanic reactions, which assists in soil stabilization due to the production of cementitious compounds [14]. Water-borne polymeric emulsions were investigated to stabilize desert sand. For this study, 2% polymer contents were added to the desert sands using mixing and spraying techniques. Soil specimens with sprayed polymer demonstrated lower hydraulic conductivity with lesser improvement in mechanical properties in comparison to the soil specimens with mixed polymer [15]. An investigation of the stabilization of compressed earth blocks (CEBs) with cement was performed, and the results demonstrated optimum soil stabilization with 4% of cement content [16]. Malkanthi, Balthazaar, and Perera [17] used a combination of cement and lime to strengthen stabilized compressed earth blocks. It was deduced that grade two block strength was achieved for blocks with 15% of clay and 10% of silt by the addition of 5% of cement and 5% of lime. However, for blocks having 5% of clay and silt contents, the addition of 7% and 3% of cement and lime, respectively, was required. Attom and Shatnawi reported that the addition of wheat husk in clayey soil led to an improvement in the shear strength of the soil [18]. Some studies [19,20] were also determined in the literature that studied the chemical stabilization of the clayey soil against internal erosion. More studies of soil stabilization include Herrier et al. [21]; Baldovino et al. [22]; Indraratna et al. [23]; Nagaraj et al. [24]; Consoli et al. [25,26,27]; Karimi et al. [28]; Mohamedzein, Taha and Aghbari [29]; Rahman et al. [30]; Maubec et al. [31]; Setra [32]; and Rosone et al. [33]. It is clear from the literature review that utilization of lime to stabilize clayey soil has been thoroughly investigated and lime has demonstrated excellent stabilization properties. This may be attributed to the fact that lime reacts significantly better with binding elements such as the clay or silt contents found in clayey soil. However, not much research has been carried out regarding the stabilization of sandy soil using lime.
So, this paper studies the lime stabilization effect on sandy soils against internal erosion. Two types of sandy soil (poorly graded and well-graded sandy soil) were mixed with different percentages of lime based on the dry weight of the soil. Lime-treated soil specimens were prepared in the standard compaction mold at a 95% compaction rate and optimum moisture content. These specimens were tested for three different curing times, namely, 1 day (24 h), 2 days (48 h), and 7 days. The hole erosion test (HET) was performed to analyze the soil erosion behavior. Experimental results demonstrated lime to be an effective stabilizer for sandy soil. A higher erosion rate index and critical erosion stress were achieved with the addition of lime. The rest of the paper has been organized as follows: research significance, methodology for the soil sample preparation and testing, the results and their detailed discussion, and the study’s conclusion.

2. Research Significance

Stabilization of soil embankment dams is crucial for their successful operation in retaining, supplying, and diverting water for various purposes. Sand being the primary material used in soil embankments requires efficient stabilization techniques for obtaining the best performance. Lime is considered an attractive option due to its merits in improving the soil strength with lower cost. The reviewed literature shows a lack of research on the lime stabilization of sandy soil. Hence, this paper examines the merits of sandy soil stabilization using lime against internal erosion with different curing times. Two types of sandy soil were mixed with lime based on the dry weight of the sand and tested at different curing times (1 day, 2 days, and 7 days) using the hole erosion test (HET). Results showed that the optimum curing time for sandy soil stabilization with lime is 2 days. This paper supports spreading awareness about the significance of internal soil erosion and paves the way for further research on this topic with other potential stabilizers.

3. Materials and Methods

This section presents the experimental program and methodology used to prepare, test, and analyze the soil specimens.

3.1. Material Properties

ASTM standard testing procedures, such as soil gradation, the specific gravity of soil (Gs), optimum moisture content (ωop), and maximum dry density (γd,max), were used to determine the initial physical properties of the sandy soil used in this study, as shown in Table 1. The specific gravity of Soil #1 and Soil #2 were 2.60 and 2.67, respectively. Their respective maximum dry densities were 1690 and 1908 kg/m3. Moreover, Soil #1 and #2 were classified as poorly graded and well-graded sandy soil, respectively. Table 2 provides the properties of quick lime added to the two soil types.

3.2. Soil Specimen Preparation

For Soil #1, soil specimens with 0% to 6% of lime and for Soil #2, soil specimens with 0% to 3% of lime were prepared with 1% lime increment. Firstly, the required amount of air-dried soil, water (based on the optimum moisture content found from the standard compaction test of poorly and well-graded sandy soils), and lime were measured and mixed. Subsequently, the soil–lime mixture was compacted in a standard proctor mold with a relative compaction of 95%. Then, a hole of 6 mm diameter was drilled (using a machine in the laboratory) through the center of the soil specimen throughout its length, to simulate piping erosion in the hole erosion test (HET). This was followed by the labeling and storing of the soil specimens for their curing period. As mentioned earlier, each soil specimen was cured for curing times of 1, 2, and 7 days. Two soil specimens were prepared for each lime percentage and curing time, and the average of the two specimen’s results was taken as the final value to improve the accuracy of the results. Figure 1a shows the top view of the final soil specimen with a 6 mm diameter hole before testing. This study adopted the hole erosion test, HET (developed by Wan and Fell [10]), to determine and analyze the different erosion indices. It is a well-known method and is considered a simple, fast, economical, and most applicable technique to simulate piping erosion behavior for all investigated cases Figure 1b,c displays the schematic diagram and apparatus of the HET.

3.3. Experimental Testing Process of the Soil Specimens

In the hole erosion test (HET) apparatus, gravel (with a 20 mm diameter particle size) was added to the upstream chamber to assist in regulating water flow and acted as a filter. Next, the cured soil specimen was placed and fixed (using O rings and bolts) between the upstream and downstream chambers (refer to Figure 1c). A constant water head was added (between 800 and 1200 mm), and the water was allowed to pass through the 6 mm diameter hole in the soil specimen. The flow rate was measured from the outlet pipe at different time intervals during the run time. The test was run for a minimum of 45 min or until complete failure of the soil specimen. After the completion of the test run time, the specimen was removed from the HET apparatus, and the final hole (inner) diameter was measured using a vernier caliper. Finally, the mold and apparatus were cleaned, and the same process was repeated for each soil specimen.

3.4. Data Analysis Procedure

The HET test assists in evaluating the soil specimen’s critical erosion stress and erosion rate index. Hydraulic shear stress, which causes erosion [10], is applied by the water flow, which is controlled by the hydraulic head. Soil #1 (poorly graded soil) specimens were tested with a constant pressure head of 800 mm. On the other hand, for Soil #2 (well-graded soil) specimens, the pressure head for 0% and 1% lime was 800 mm but the pressure head was increased to 1000 mm and 1200 mm for 2% and 3% lime, respectively. The pressure head was increased since the specimens did not erode with 800 mm pressure heads. The erosion rate index ( I ) indicates the soil’s resistance against internal erosion. A higher erosion rate index represents better soil resistance against internal erosion. Table 3 shows the qualitative terms for representative erosion rate index values.
Equations (1) and (2) are used to determine the critical erosion stress ( τ c ) and erosion rate index ( I ) values.
ε t · = C e   τ t τ c
I = l o g C e
where ε t · stands for erosion rate per unit surface area at time t for the hole/slot (kg/s/m2), C e for the soil erosion coefficient (s/m), t for hydraulic shear stress along the hole/slot at time t (N/m2), and c for critical erosion stress (N/m2) of the soil [10].
The critical erosion stress ( τ c ) in Equation (1) is derived from the graph of the erosion rate per unit surface area ( ε t · ) versus hydraulic shear stress along the hole at time t ( τ t ), which are determined using Equations (4) and (3), respectively.
τ t = ρ w g s t φ t 4
ε t · = ρ d 2 d φ t d t
where ρ w is the eroding fluid (water) density, g is the acceleration due to gravity, s t stands for the hydraulic gradient across the soil sample, φ t is the diameter of the performed hole at time t, ρ d is the dry density of the soil, and d φ t d t is the rate of change in the diameter with time.
Both Equations (3) and (4) require the diameter of the performed hole at time t ( φ t ) value, which can be calculated using Equations (5) and (6).
Turbulent   flow :   φ t = [ 64   Q t 2   f T   t π 2 ρ w g   s t ] 1 / 5  
Laminar   flow : φ t = [ 16   Q t   f L   t π ρ w g   s t ] 1 / 3
To determine the flow type, Reynold’s number ( R ) was determined using Equations (7) and (8):
V t = Q t π φ t 2 4
R = V t φ t ρ w ν
where, Qt is the rate of flow at time t (m3/s), f T   t and f L   t are the friction factors for turbulent and laminar flow, respectively, ρ w is the density of water (kg/m3), V t is the average flow velocity of water through the hole (m/s), and ν is the absolute viscosity of water (Pa.s) = 1.004 × 10⁻⁶ m2/s The flow was considered turbulent if the R value was larger than 4000, otherwise the flow is considered laminar.
Equations (5) and (6) were used for turbulent and laminar water flow, respectively. The flow rates ( Q t ) mentioned in Equations (5) and (6) were measured at different time intervals during the test. The friction factors were evaluated by measuring the hole diameter at the beginning (6 mm) and end of the test, followed by the application of these values in Equations (5) and (6). Then, the two calculated friction factors ( f T   t or f L   t ) at the start and end of the test were plotted against time to get the friction factor value at any time. Consequently, the diameter of the hole at any time t ( φ t ) was determined using the determined friction factor values and Equations (5) and (6). Determination of φ t supported in evaluating the rate of change in the diameter with time d φ t d t . Therefore, using the determined values, the hydraulic shear stress ( τ t ) and erosion rate per unit surface area ( ε t · ) were found from Equations (3) and (4). Next, the erosion rate per unit surface area ( ε t · ) versus hydraulic shear stress along the hole at time t ( τ t ) was plotted. The slope of the best-fit straight line of this plot represented the value of the coefficient of soil erosion ( C e ). Finally, using Equation (2) and the coefficient of soil erosion ( C e ), the erosion rate index ( I ) of the soil was calculated, and the type of soil erosion was described based on the details in Table 3.

4. Results and Discussion

This section presents the results of the tested soil specimens and provides detailed discussions on the effect of the curing time on the diameter of the water flow path (φf), critical erosion stress (τc), and erosion rate index (IHET). Subsequently, the type of internal soil erosion for the two soil types (Soil #1 and Soil #2) is discussed. All the required results of the soil specimens are summarized in Table 4 and Table 5. Table 4 provides the final erosion parameters and the description of soil erosion for Soil #1, having lime percentages from 1.0% to 6.0%. Lime results of 0.0% for Soil #1 are not presented in this section due to the instant failure of the specimen. So, it was deduced to be a failure point. Table 5 presents the final erosion parameters of Soil #2 with lime percentages from 0.0% to 3.0%.

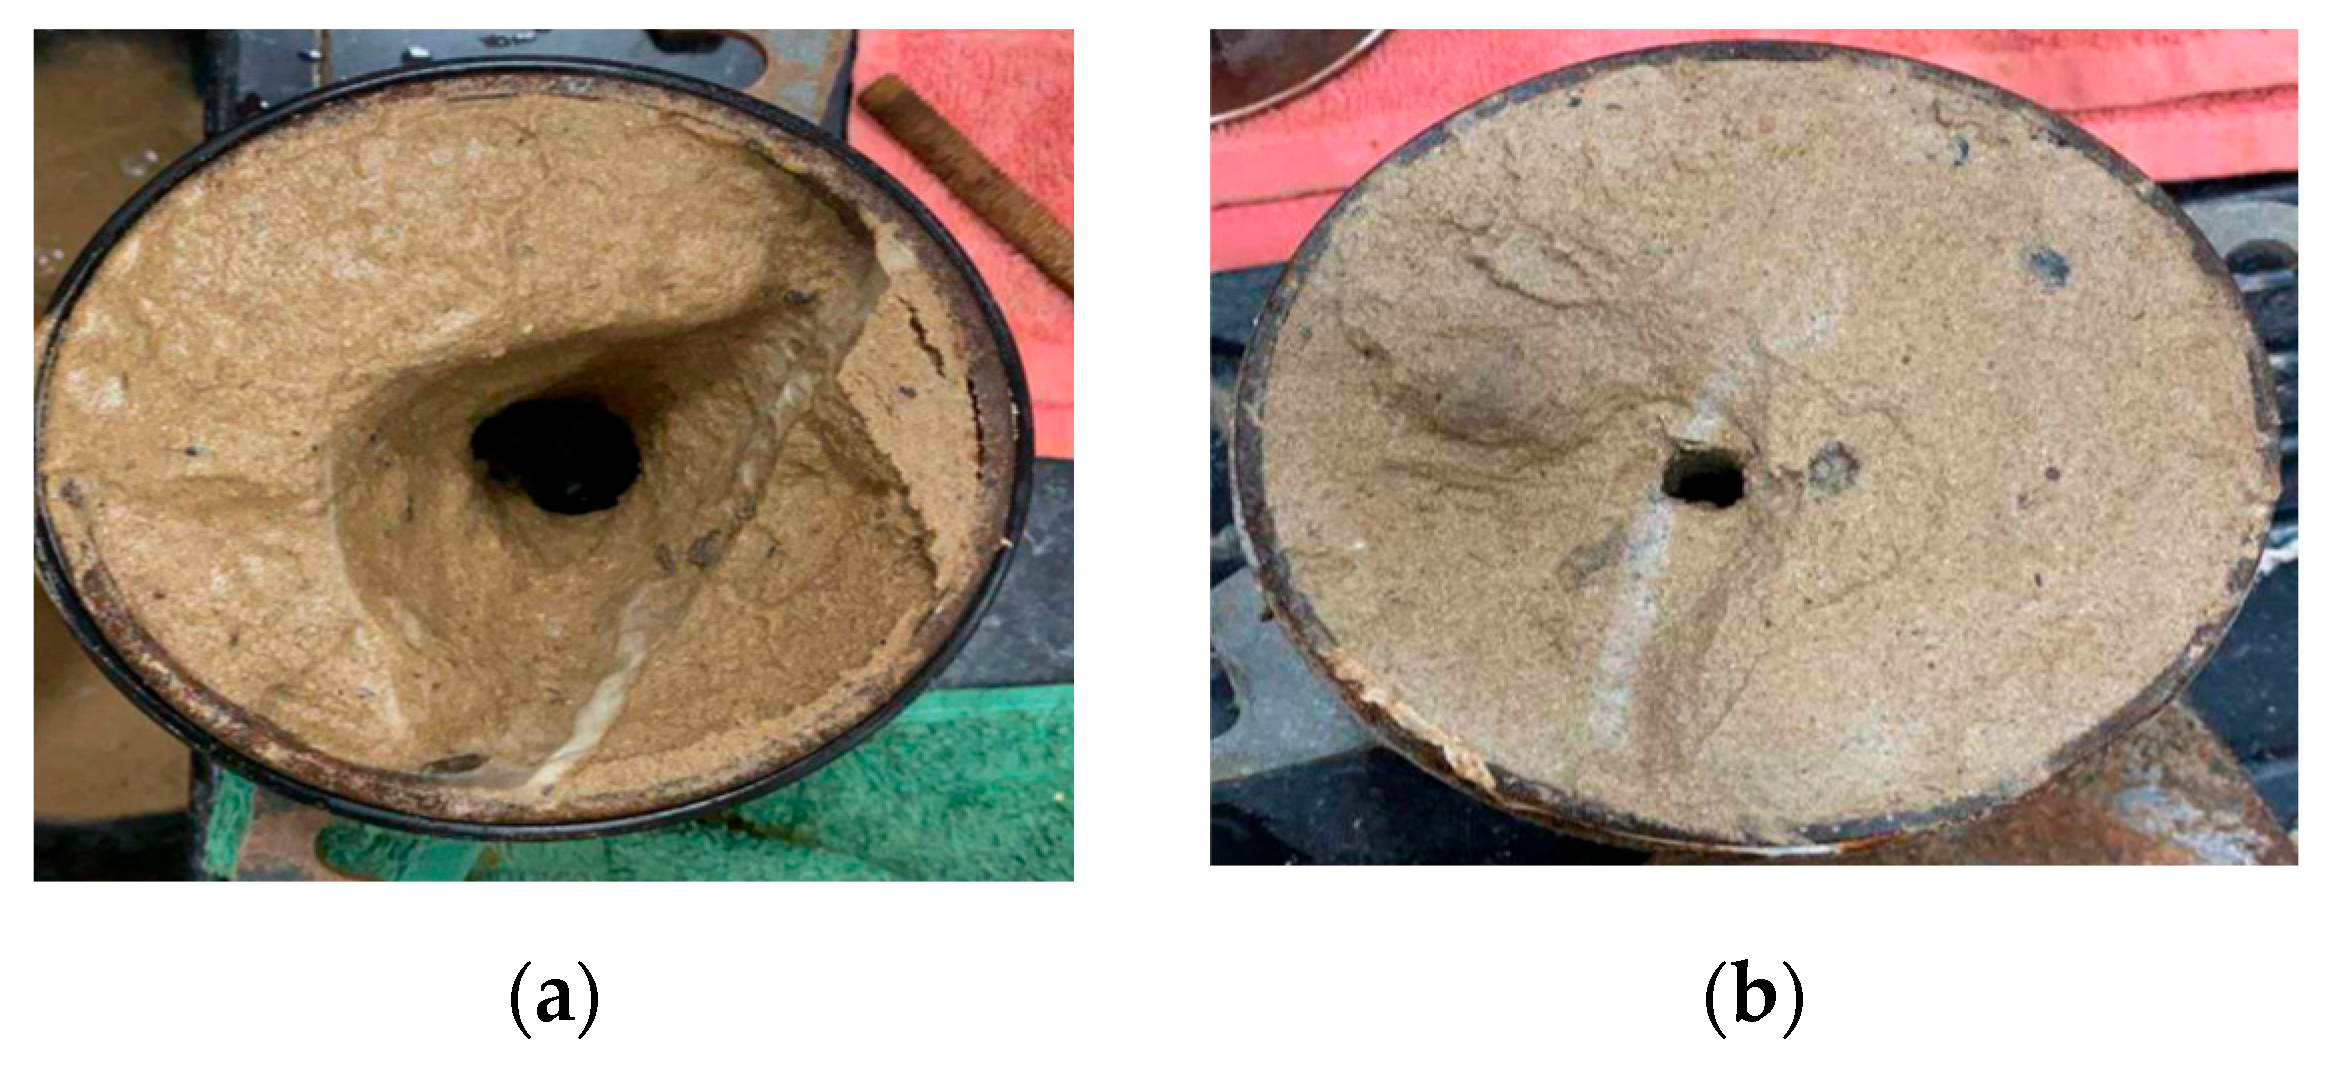
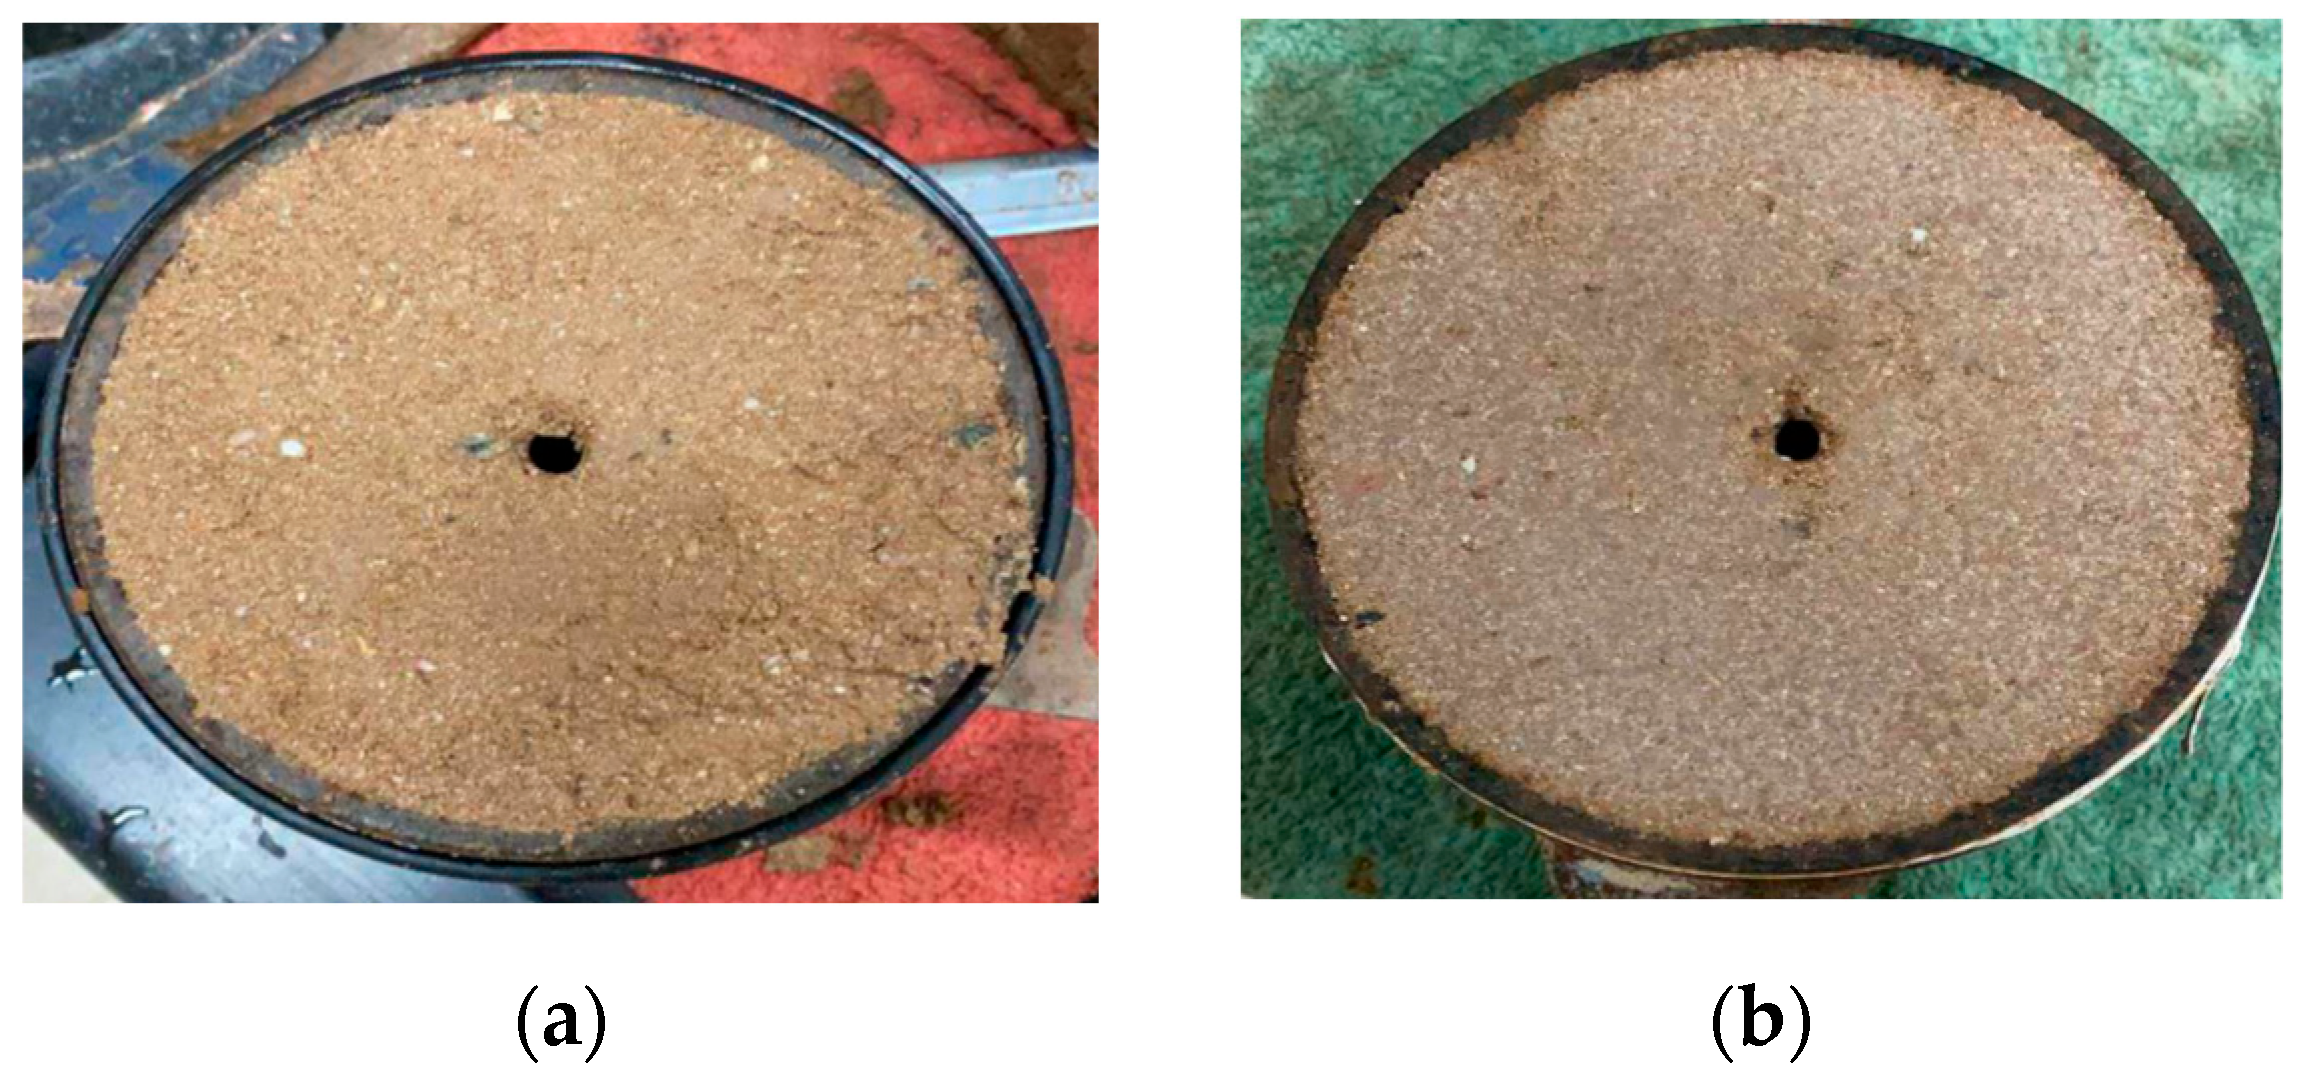
4.1. Effect of Curing Time on Diameter of Water Flow Path (Hole)

Figure 2 presents the final hole diameters for each lime percent and curing time for Soil #1 (excluding 0.0% lime) and Soil #2. According to Figure 2, the results of Table 4 and Table 5, a higher curing time reduces the final diameter of the water flow path. Both Soil #1 and Soil #2 obtained their lowest final hole diameters for curing times of 48 h (2 days) and 7 days compared to 24 h (1 day) of curing time.
A minor final hole diameter in Soil #1 was determined for 5.0% and 6.0% of lime with 48 h (2 days) and 7 days curing times. Figure 2a concludes that an increase in the percentage of lime results in better lime stabilization of soil in Soil #1. For a curing time of 24 h (1 day), the enlargement of the hole at 1.0% lime and 6.0% lime was about 27.0 and 4.3 mm, respectively. So, the change in diameter was reduced by 84.0% at 6.0% lime compared to 1.0% lime in Soil #1. However, for 48 h (2 days) of curing time, the enlargement of the hole at 1.0% lime and 6.0% lime was only about 14.0 and 2.1 mm, respectively. Therefore, 48 h (2 days) of curing time results in much lower enlargement of the hole compared to 24 h (1 day), and the change in diameter at 48 h of curing time was 85.0% with an increase in lime from 1% to 6%. It was observed that with an increase in the lime percentage and curing time, the hole’s final diameter was closer to the initial hole diameter. Moreover, for the Soil #1 specimen mixed with 5.0% lime, the change in diameter reduced by about 53.33% at 48 h of curing time compared to 24 h of curing time (refer to Figure 3a). Hence, higher curing reduces the hole’s final diameter and assists in the complete reaction of lime with soil. Therefore, an increase in curing time leads to better stabilization of soil. The effect of lime percentage and curing time was noticed till the optimum stabilization of the soil. Since in Soil #1 both 5.0% and 6.0% of lime obtained similar results, it was deduced that Soil #1 is stabilized at 5.0% of lime with a curing time of 48 h. A curing time beyond 48 h did not significantly affect the soil strength and stabilization against internal erosion (as both results for 48 h and 7 days were the same at 5.0% and 6.0% of lime). So, a curing time beyond 2 days is not required. This is because lime reacts completely with soil within 2 days (48 h) so additional curing will have a negligible effect on soil stabilization. This behavior is contradictory to the observations of Rosone et al. [33], Maubec et al. [31], and Setra [32] that longer curing times such as several months improve the soil strength further with lower lime content. Nonetheless, the sandy soil specimens at an optimum lime content of 5.0% and with a higher curing time of 7 days demonstrated negligible improvement in the soil strength and stabilization properties.
Similar to the Soil #1 results, for Soil #2 (refer to Figure 2b), the smallest final hole diameter is obtained at 2.0% and 3.0% of lime with curing times of 48 h (2 days) and 7 days. For Soil #2, the hole enlargement reduction was about 77.8% with the addition of only 3.0% of lime when compared to 0.0% lime with a curing time of 24 h (1 day). This is because at 0.0% lime, the diameter of the hole was enlarged by about 9 mm, while at 3.0% lime, it enlarged by only about 2 mm (refer to Table 5). For a curing time of 48 h, the increase in hole diameter for 0.0% lime and 3.0% lime were about 9 and 1.8 mm, respectively, as shown in Table 5. So, an 80% reduction in the hole enlargement was obtained at 3.0% lime compared with 0.0% lime. Hence, a higher amount of reduction in the hole enlargement was obtained at a higher amount of curing time. In addition, a comparison of the curing times showed that a slight reduction of 10.0% in the hole enlargement occurred at 48 h and 7 days compared with 24 h of curing time. Hence, an increased curing time led to a slight reduction in the hole enlargement. Therefore, an increase in curing time provides better soil strength and lime stabilization against internal erosion till the point of optimum stabilization of the soil. Therefore, the Soil #2 results further validate that an increased curing time and lime percentage lead to better soil stabilization using lime. In addition, it was noticed that the effect of the curing time starts with the addition of lime since the final hole diameter at 0.0% lime was found to be the same for all curing times. Additionally, a curing time beyond 48 h did not provide any additional strength or stabilization to the soil. So, Soil #2 was found to be stabilized at 3.0% of lime with a curing time of 48 h, based on the diameter of the water flow path results. So, a curing time beyond 2 days does not contribute to any further increase in soil strength.
Figure 3 presents the percent reduction in hole diameter observed with the increase in curing times for different lime percentages in Soil #1 and Soil #2, respectively. For Soil #1 (refer to Figure 3a), at 1.0% lime with an increase in curing time from 1 day (24 h) to 2 days (48 h), the percent reduction was about 48.2%, and from 1 day (24 h) to 7 days, it was about 53.6%. In comparison, an increase in curing time from 2 days (48 h) to 7 days resulted in an 8.6% reduction in hole diameter, which is significantly smaller. However, at 2.0% and 3.0% of lime, the percent reduction was about 69.2%, with an increase in curing time from 2 (48 h) to 7 days. This occurs because the soil has not yet reached optimum stabilization, so further addition of lime is required. As shown in Figure 3a, at 5.0% and 6.0% lime, there was a 0.0% percent reduction in hole diameter with an increase in curing time from 2 (48 h) to 7 days. This is due to the stabilization of the soil, so further addition of lime or curing time is not required. Since the final hole diameters at 2 (48 h) and 7 days curing time are the same, so the percent reduction with an increase in curing time from 1 day (24 h) to 2 days (48 h) and 1 day (24 h) to 7 days are the same (about 53.3% and 51.2% for 5.0% and 6.0% lime, respectively).
Figure 3b shows the curing time effect on the percent reduction in hole diameter for 1.0%, 2.0%, and 3.0% of lime in Soil #2. Lime values of 0.0% do not show any impact on the hole reduction with an increase in curing time since the effect of curing time begins with the addition of lime. At 1.0% lime, a 0.0% reduction was noticed with the increase in curing time. However, at 2.0% and 3.0% lime, a 10% reduction in hole diameter was noticed from 1 day (24 h) to 2 days (48 h) and for 1 day (24 h) to 7 days curing time increase. This shows that a curing time beyond 2 days (48 h) does not provide any additional strength and stability to soil. The percent reduction in hole diameter was found to be negligible with an increase in curing time from 2 days (48 h) to 7 days, so the results are not seen in Figure 3b.

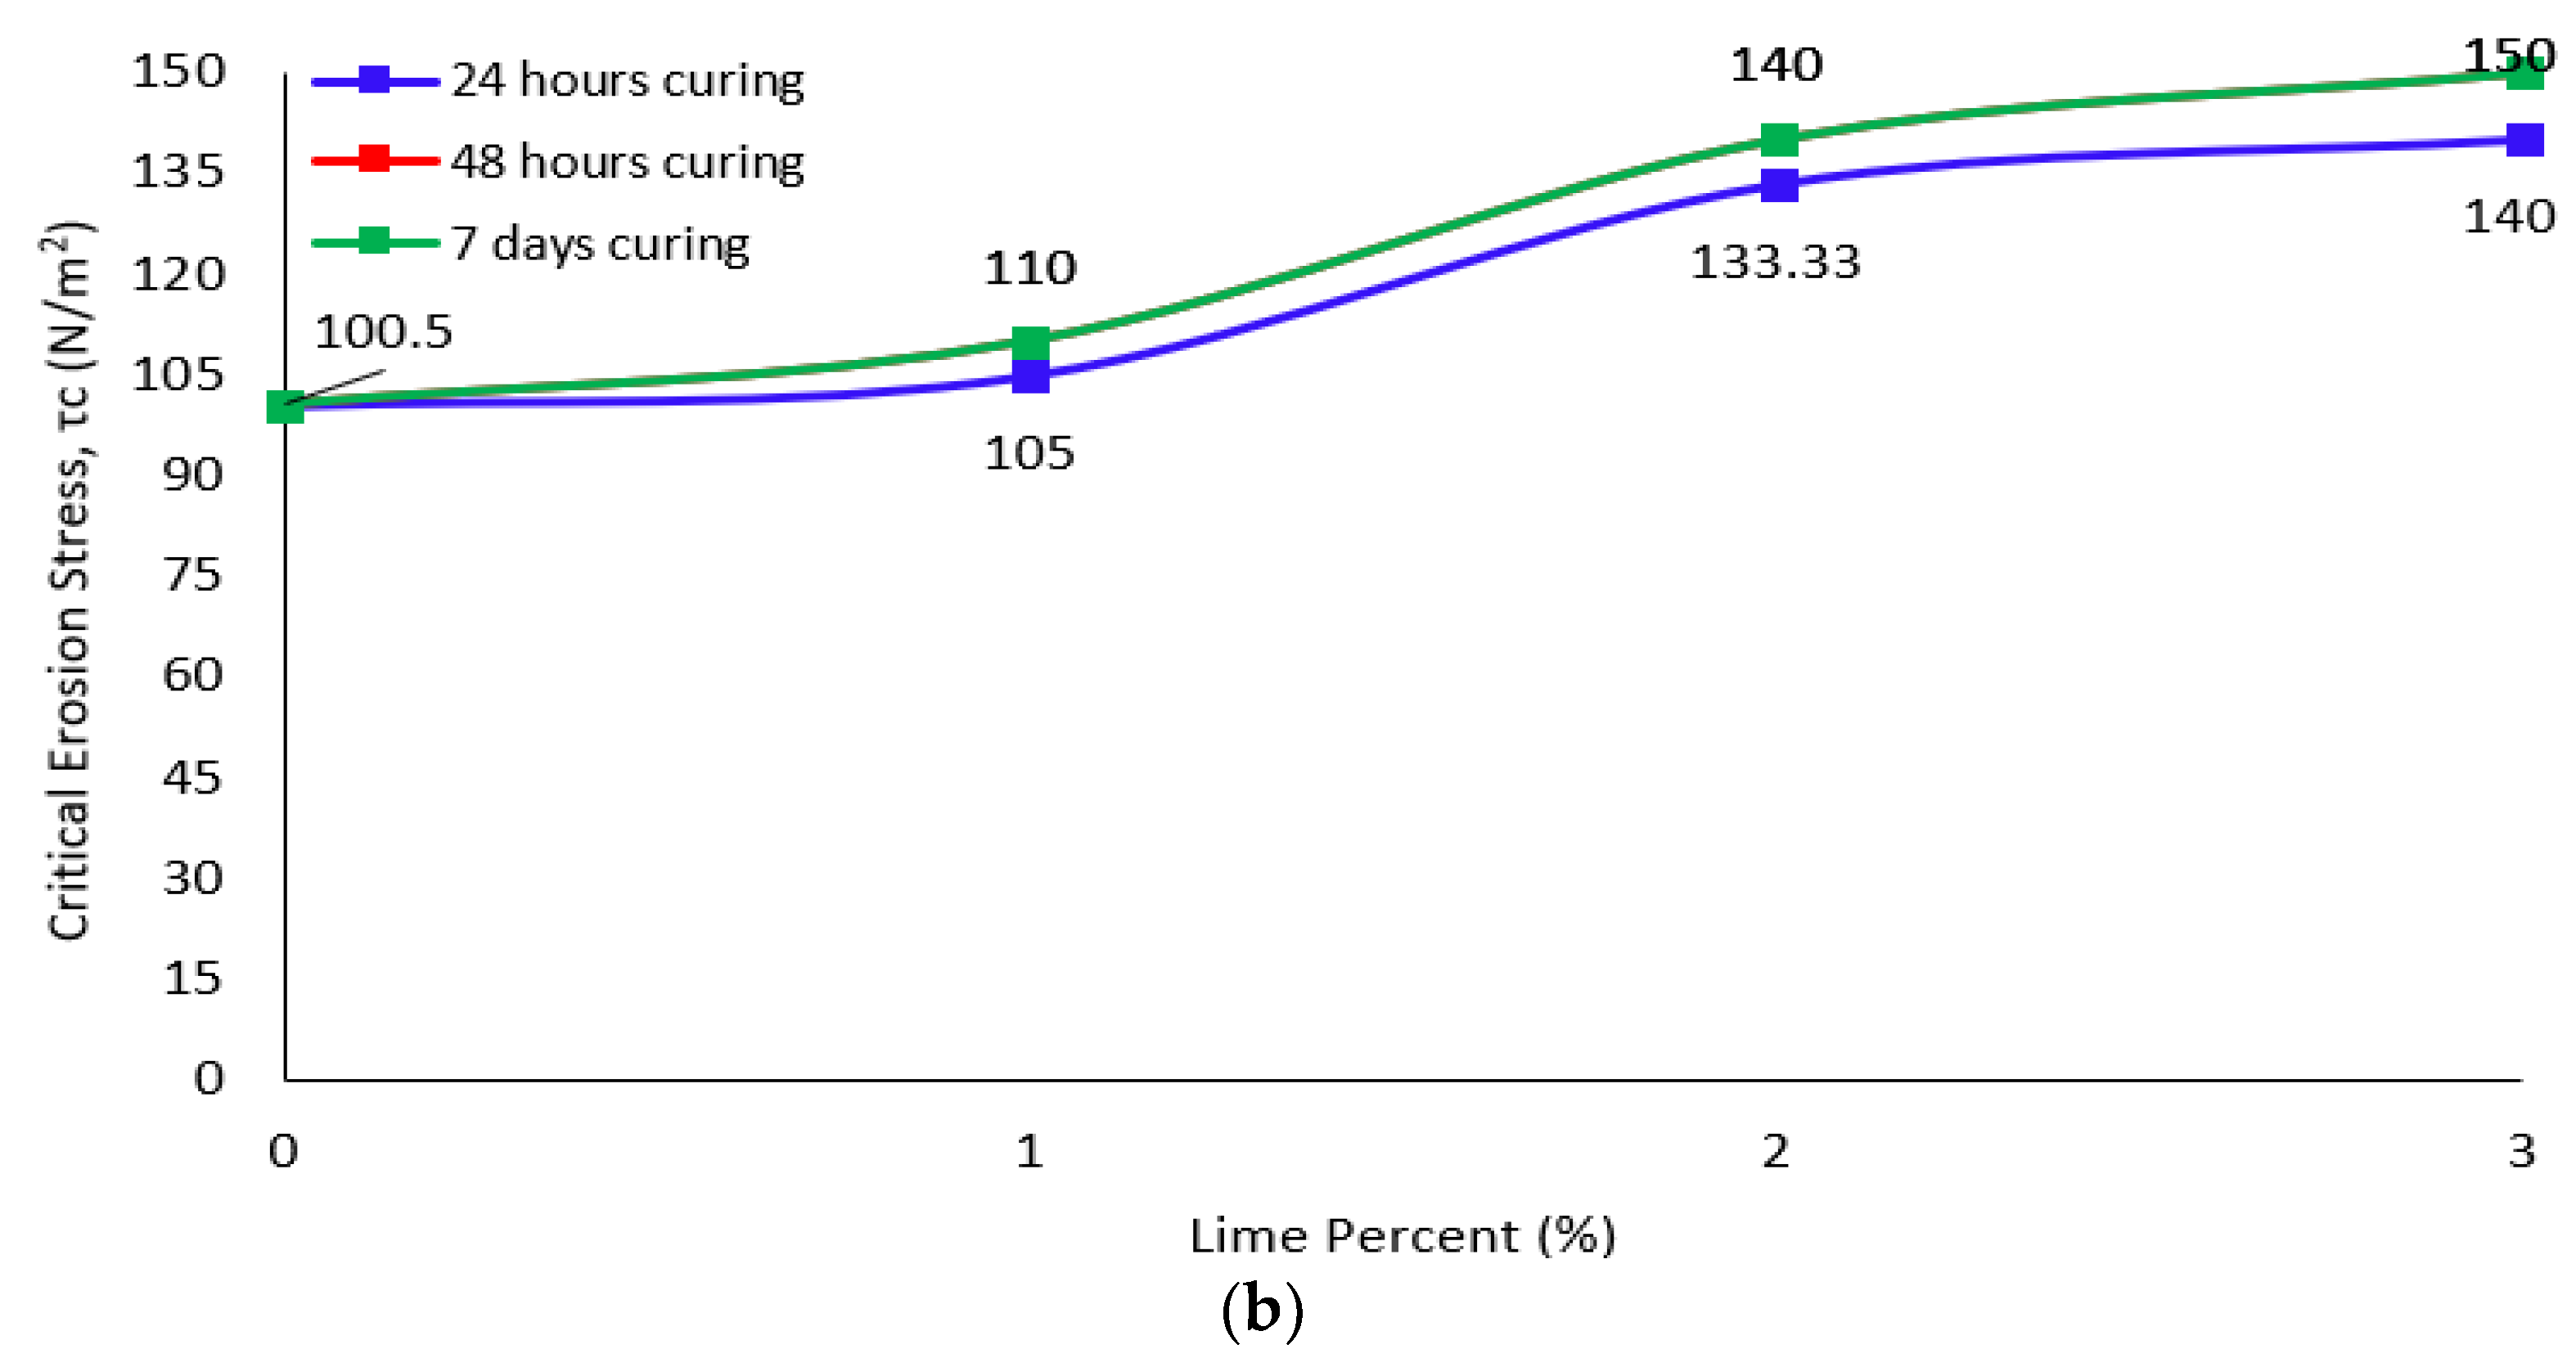
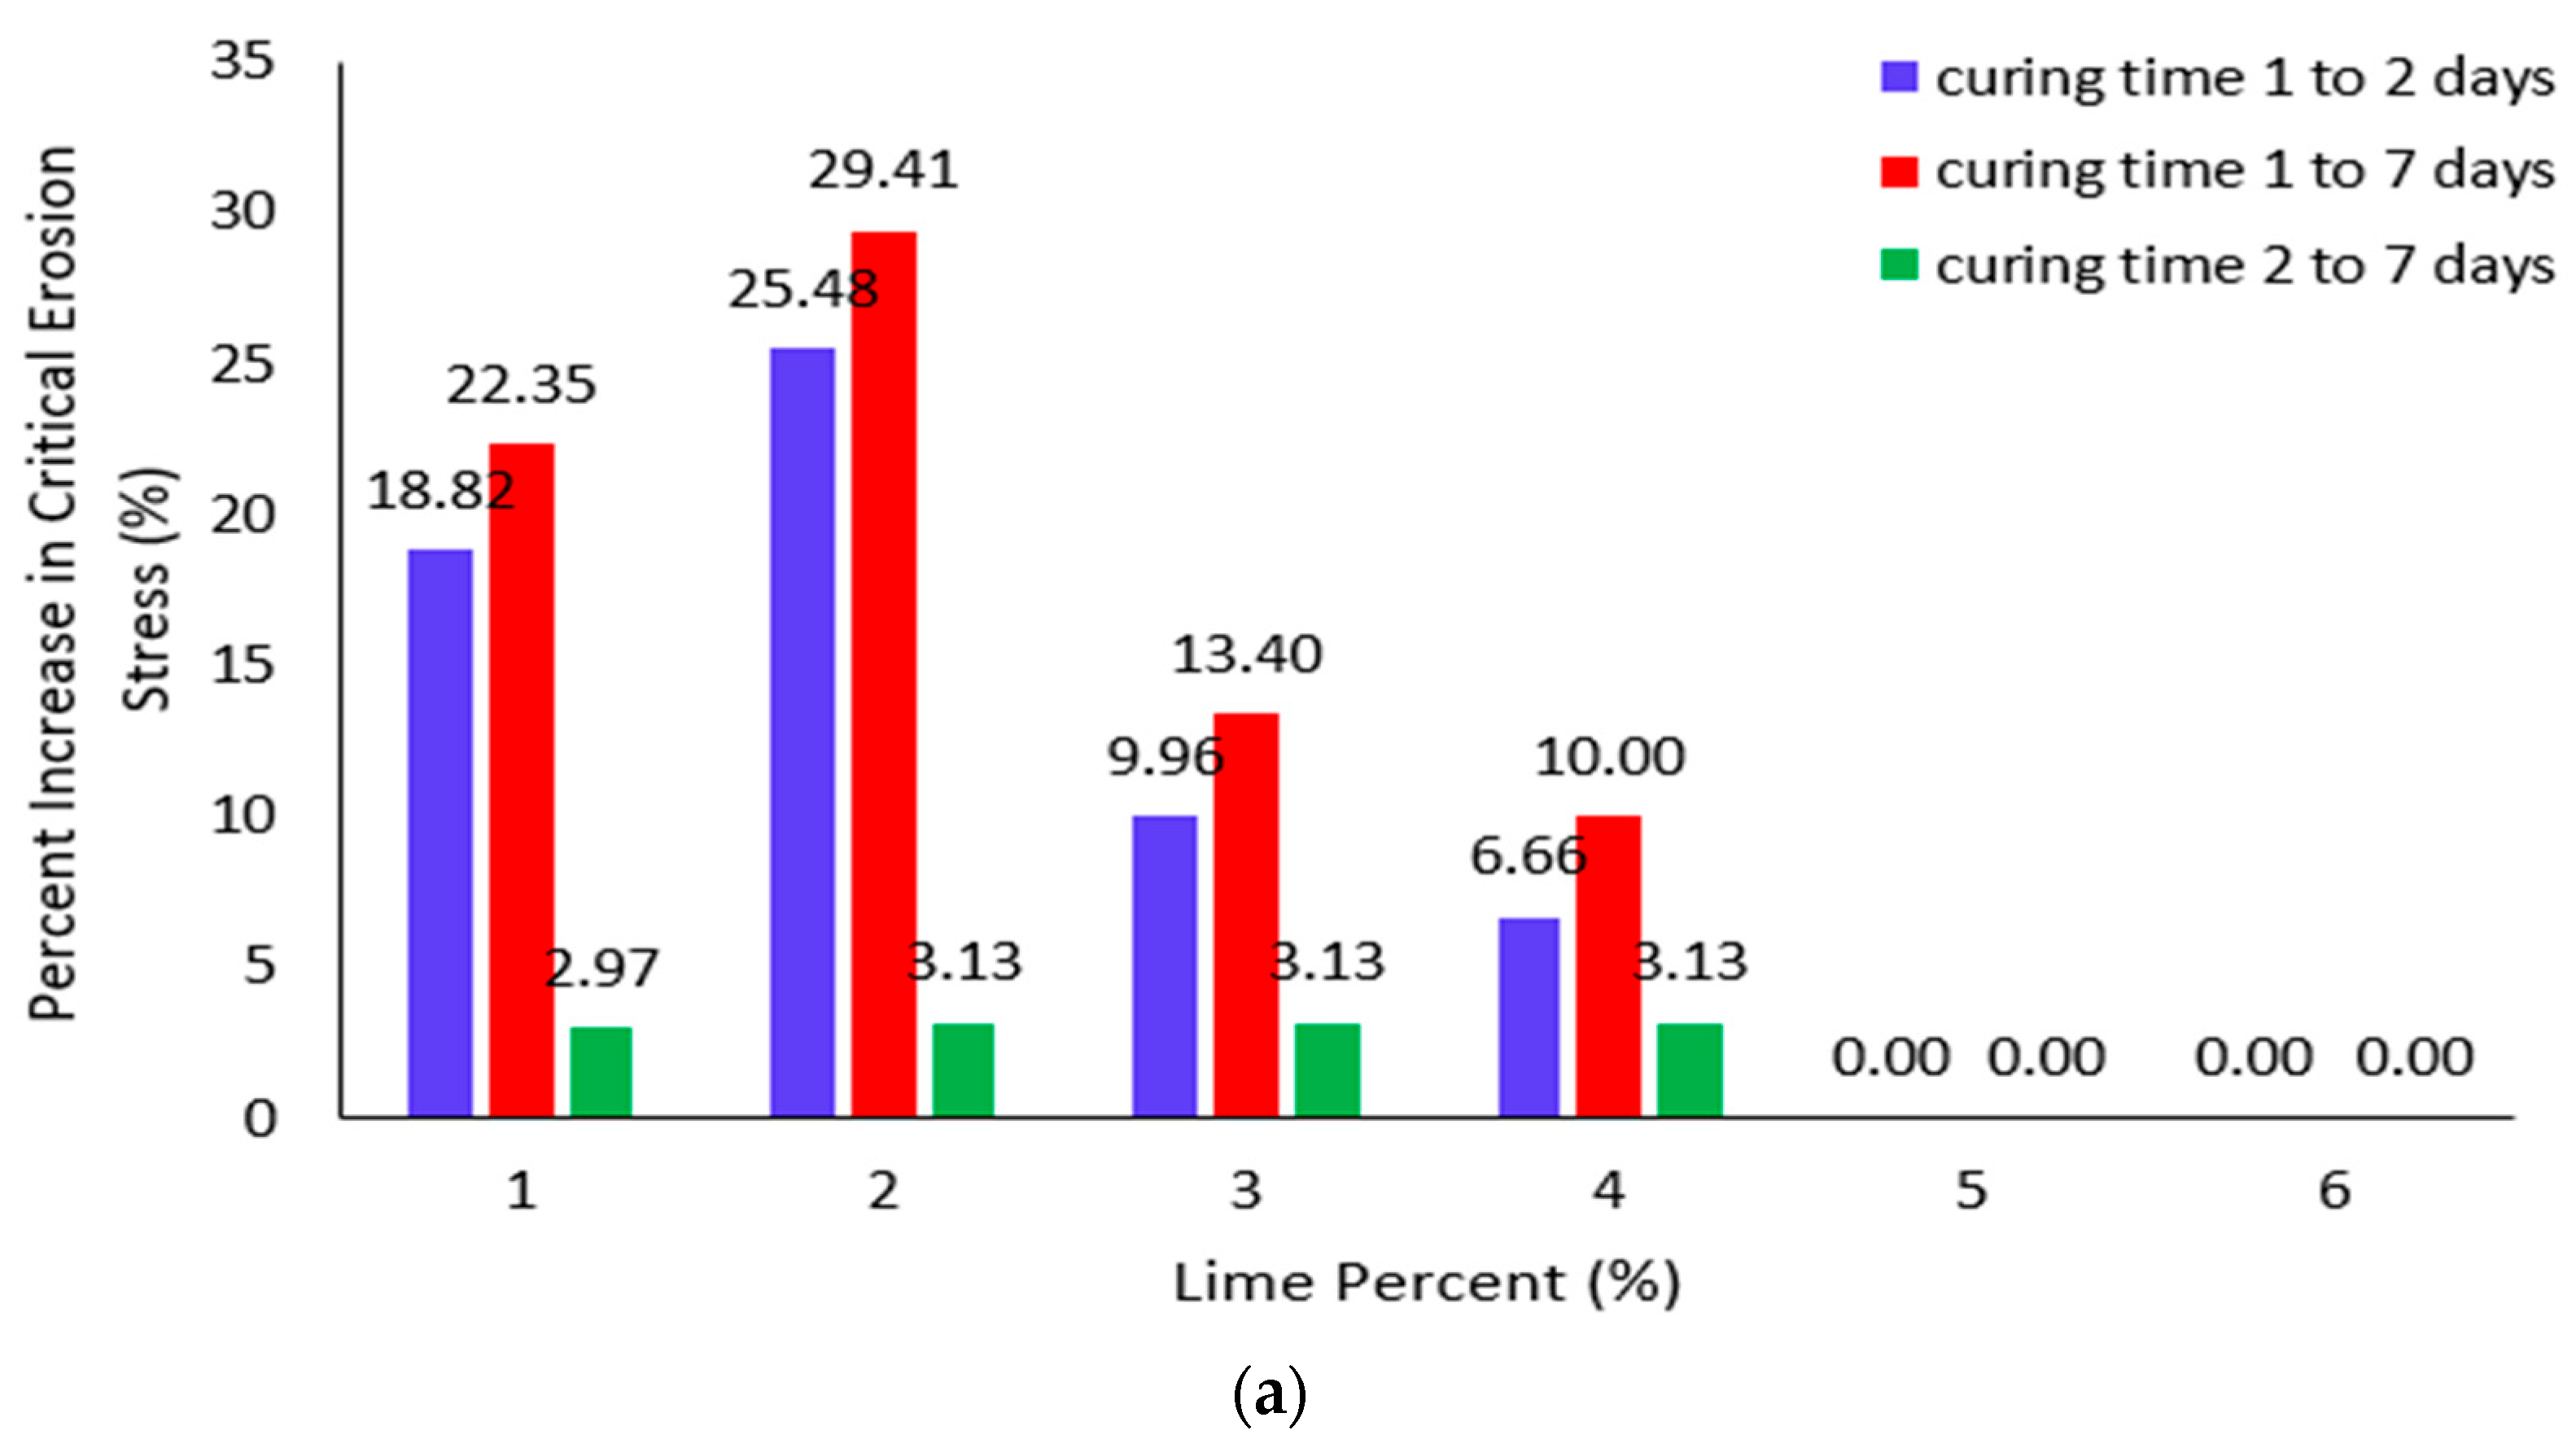
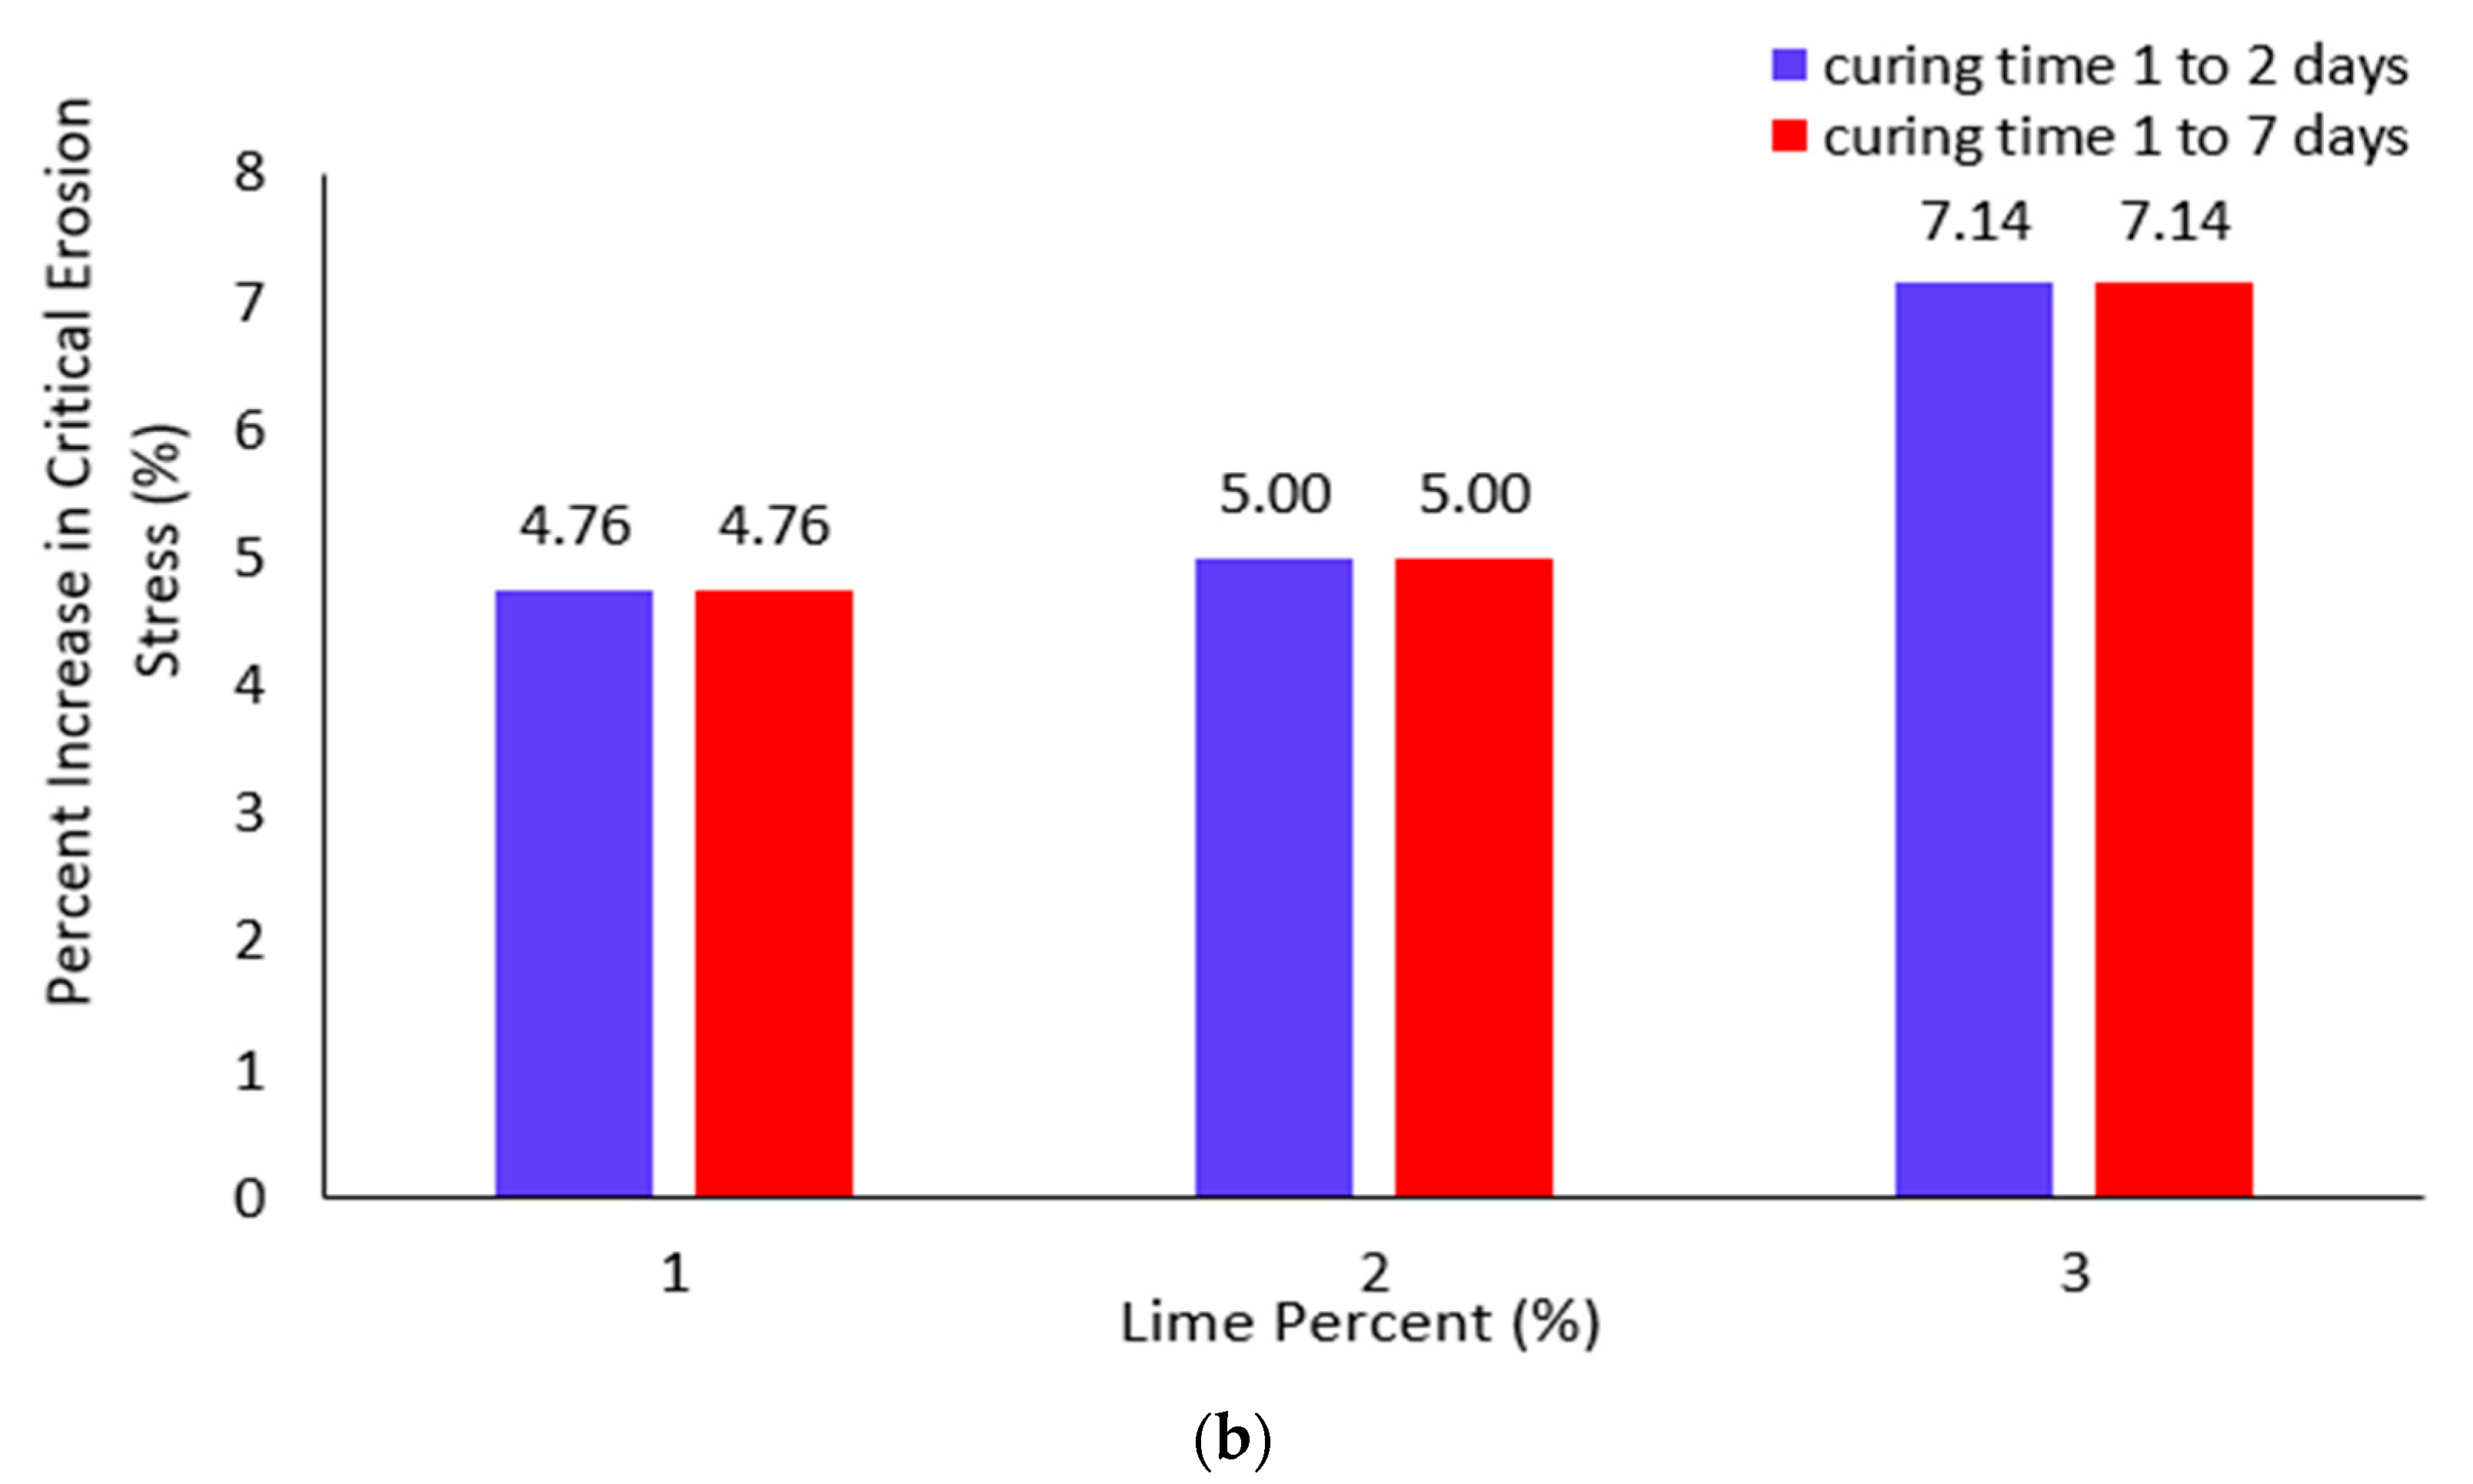
4.2. Effect of Curing Time on Critical Erosion Stress

Figure 4 presents the effect of lime and curing time on the critical erosion stress for Soil #1 and Soil #2, respectively. From Figure 4a and Figure 5a, it is clear that an increase in curing time from 24 to 48 h (1 to 2 days) improved the critical erosion stress by 18.8% for 1.0% lime in Soil #1. So, increasing the curing time strengthens the soil specimen with a higher critical erosion stress value. Moreover, Figure 4 displays that the highest critical erosion stress was obtained for the highest curing time (7 days) for all percentages of lime mixed with Soil #1. Therefore, increased curing time led to higher critical erosion stress for each percentage of lime. In addition, the figure shows that critical erosion stress increases with the percentage of lime. An increase in lime percentage from 1.0% to 5.0% resulted in a 35.3% increase in critical erosion stress at 24 h of curing time. However, the lime percentage and curing time effect were negligible at 5.0% and 6.0% lime. The highest critical erosion stress of 115 N/m2 was achieved at 5.0% and 6.0% lime for all three curing times, as shown in Table 4 and Figure 4a. Therefore, it was again observed that Soil #1 gets stabilized by adding 5.0% of lime since further addition of lime did not improve the critical erosion stress value. Hence, an increase in lime percentage and curing time leads to better stabilization of soil till the optimum stabilization of soil. Figure 4b shows the effect of lime and curing time on critical erosion stress for Soil #2. It was observed that at 0.0% lime, the effect of curing time (1, 2, and 7 days) was negligible on the critical erosion stress. So, at 0.0% lime, an increase in curing time did not change the soil strength. This is due to the earlier-mentioned fact that the curing time effect initiates with the addition of lime into the soil. Figure 4b clearly shows that the highest critical stress for each lime percent occurs at a curing time of 48 h and 7 days. Similar to earlier results, a curing time beyond 48 h did not show additional improvement in the critical erosion stress, so, Soil #2 gets stabilized at 48 h of curing time (as the soil–lime reaction completes in 48 h). Moreover, it is noticeable that the increase in lime percent improves the critical erosion stress value of Soil #2. The highest critical erosion stress value for Soil #2 was 150 N/m2, obtained with 3.0% of lime, as presented in Table 5. Hence, even the critical erosion stress values demonstrate that Soil #2 stabilizes at 3.0% lime within a curing time of 48 h.
Figure 5 shows the percentage increase in critical erosion stress obtained with increased curing time for different lime percentages. Figure 5a reports that an increase in curing time from 1 to 7 days in Soil #1 gives the maximum increase in critical erosion stress for 1.0%, 2.0%, 3.0%, and 4.0% of lime. This further validates that increased curing time leads to a higher critical erosion stress value. However, the improvement in critical erosion stress for a curing time from 2 to 7 days is relatively small. At 5.0% and 6.0% lime, there was negligible impact of curing time noticed on the soil specimens. This is because, as concluded earlier, the soil gets stabilized at 5.0% lime within 48 h of curing time, so the effect of a higher curing time will not improve the results any further. Figure 5b demonstrates that an increase in curing time from 1 to 2 days or 1 to 7 days gives exactly the same values of 4.76%, 5.00%, and 7.14% for 1.0%, 2.0%, and 3.0% of lime, respectively, for Soil #2. This advocates that lime completely reacts within 48 h, and further curing is not required as it does not provide any additional improvement to the critical erosion stress value. Lime results of 0.0% are not shown since the curing time effect starts with the addition of lime.

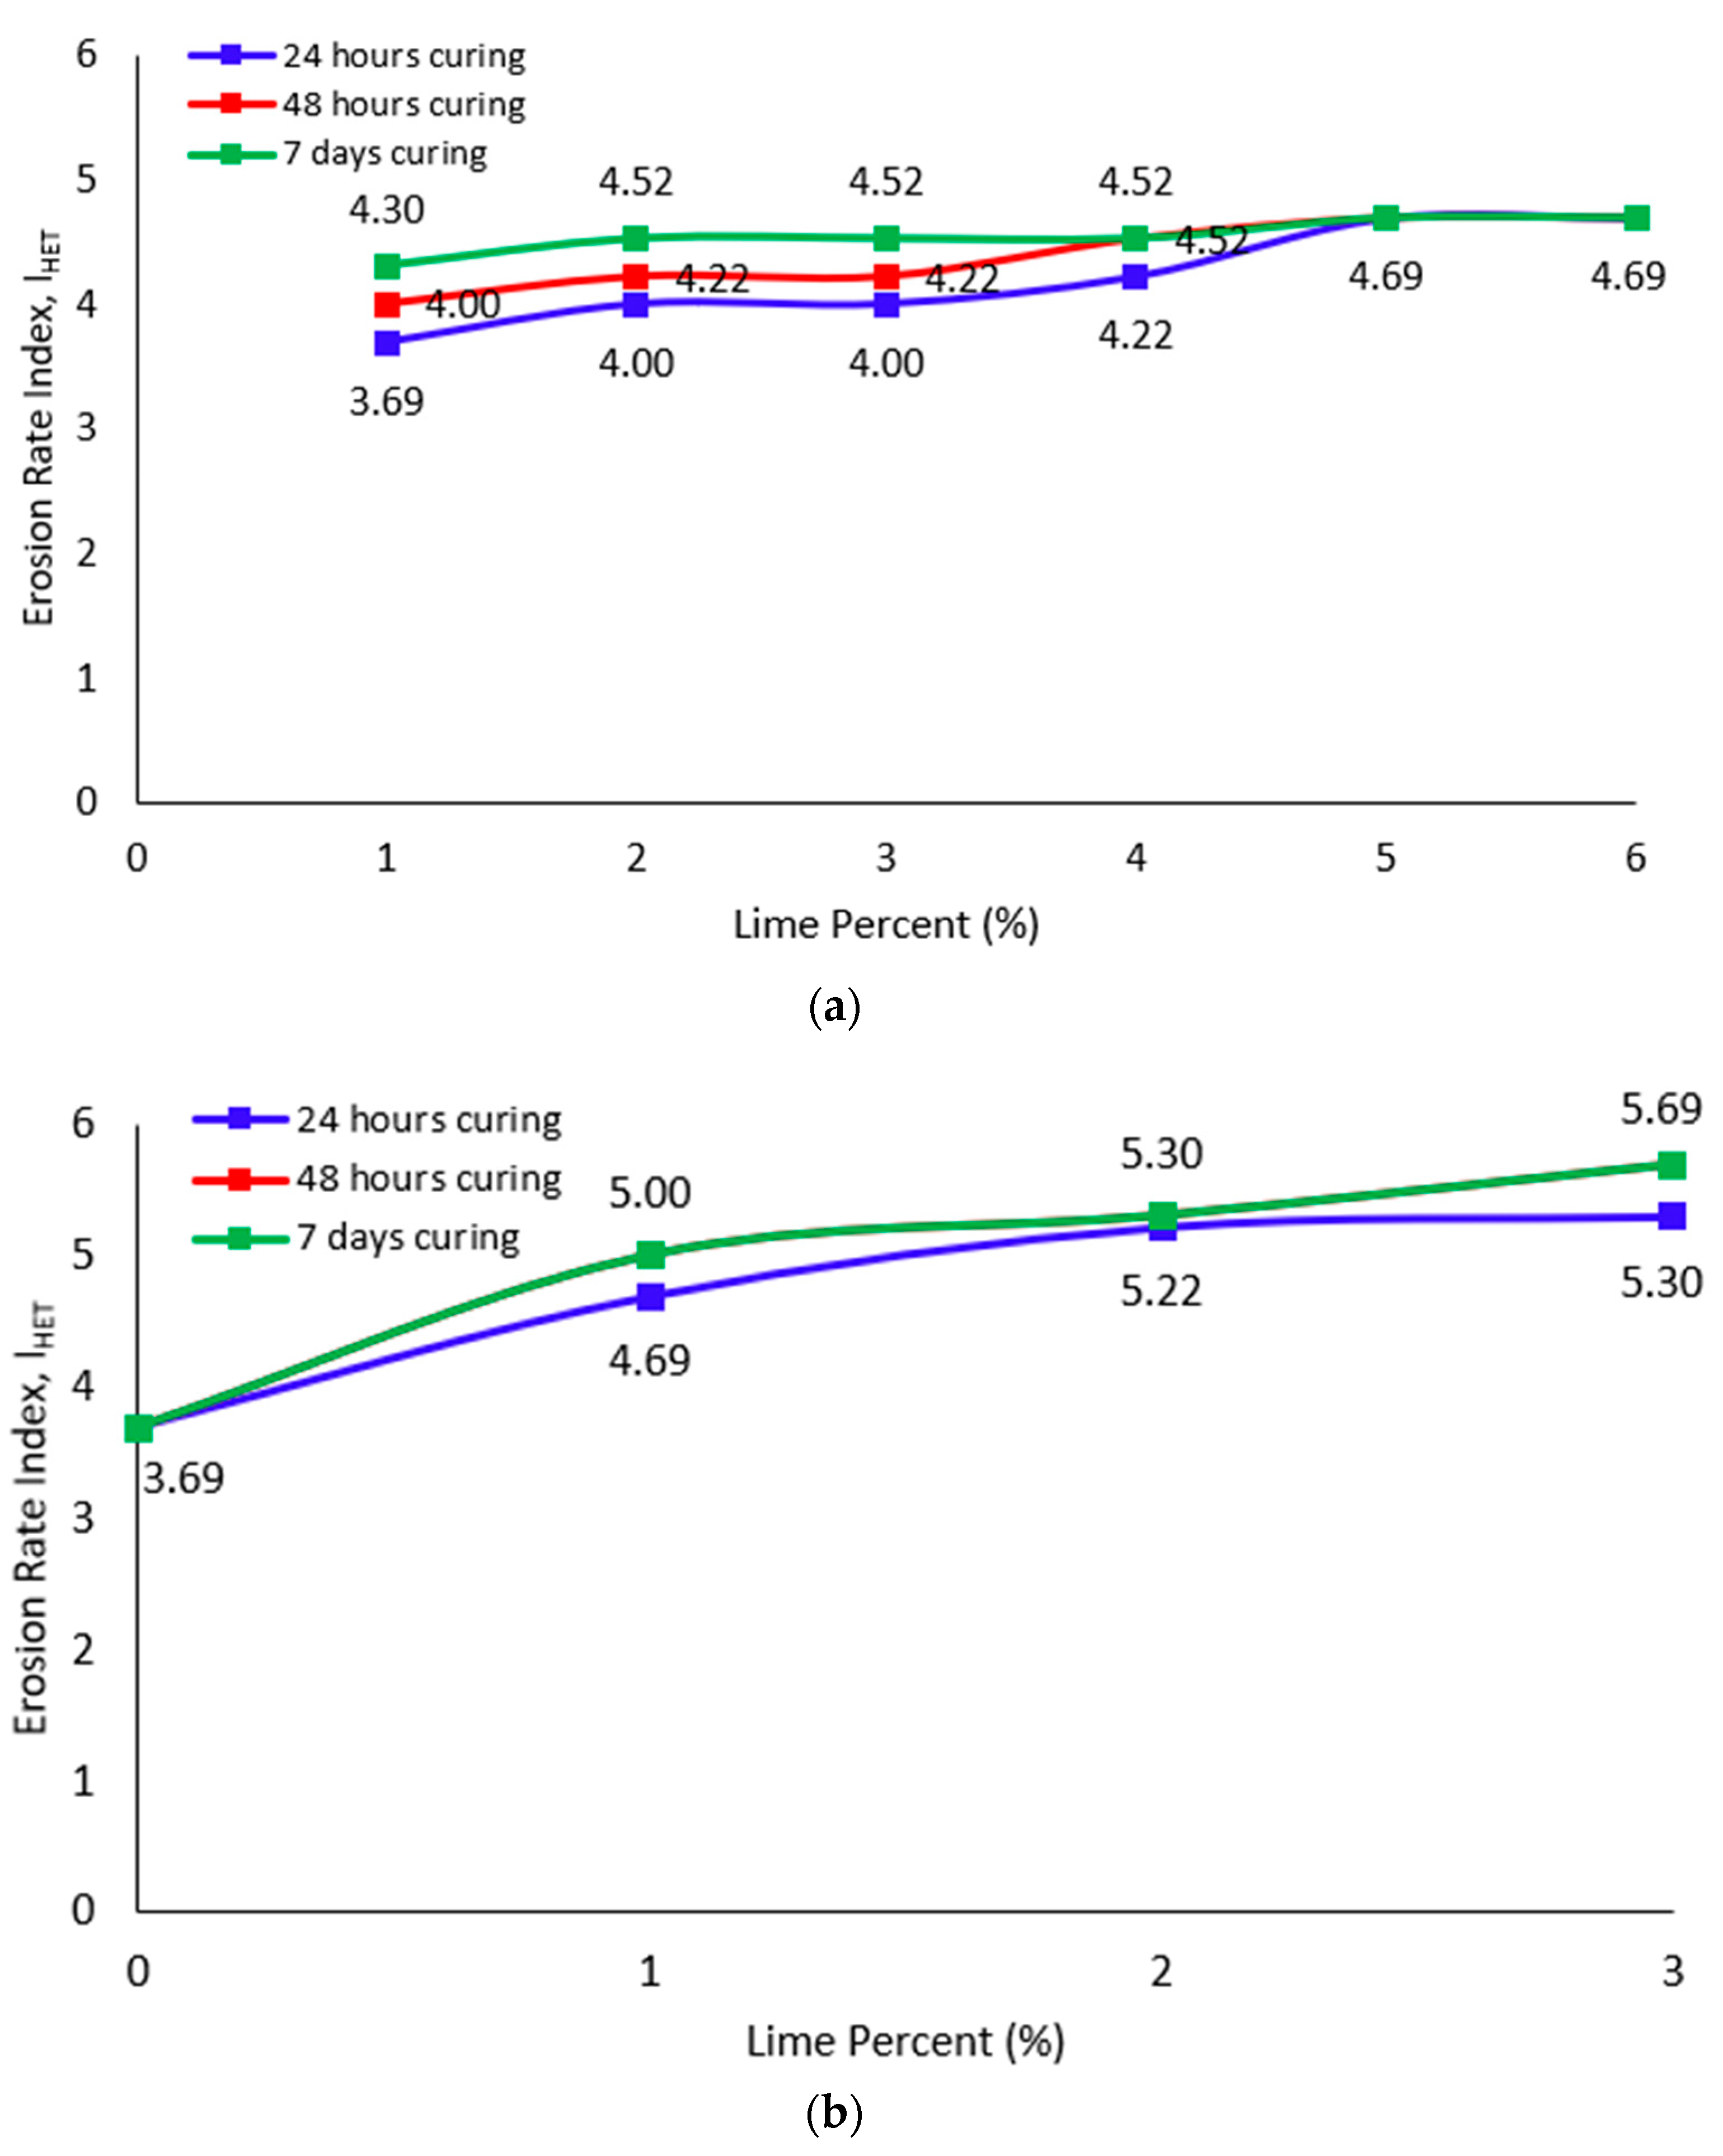
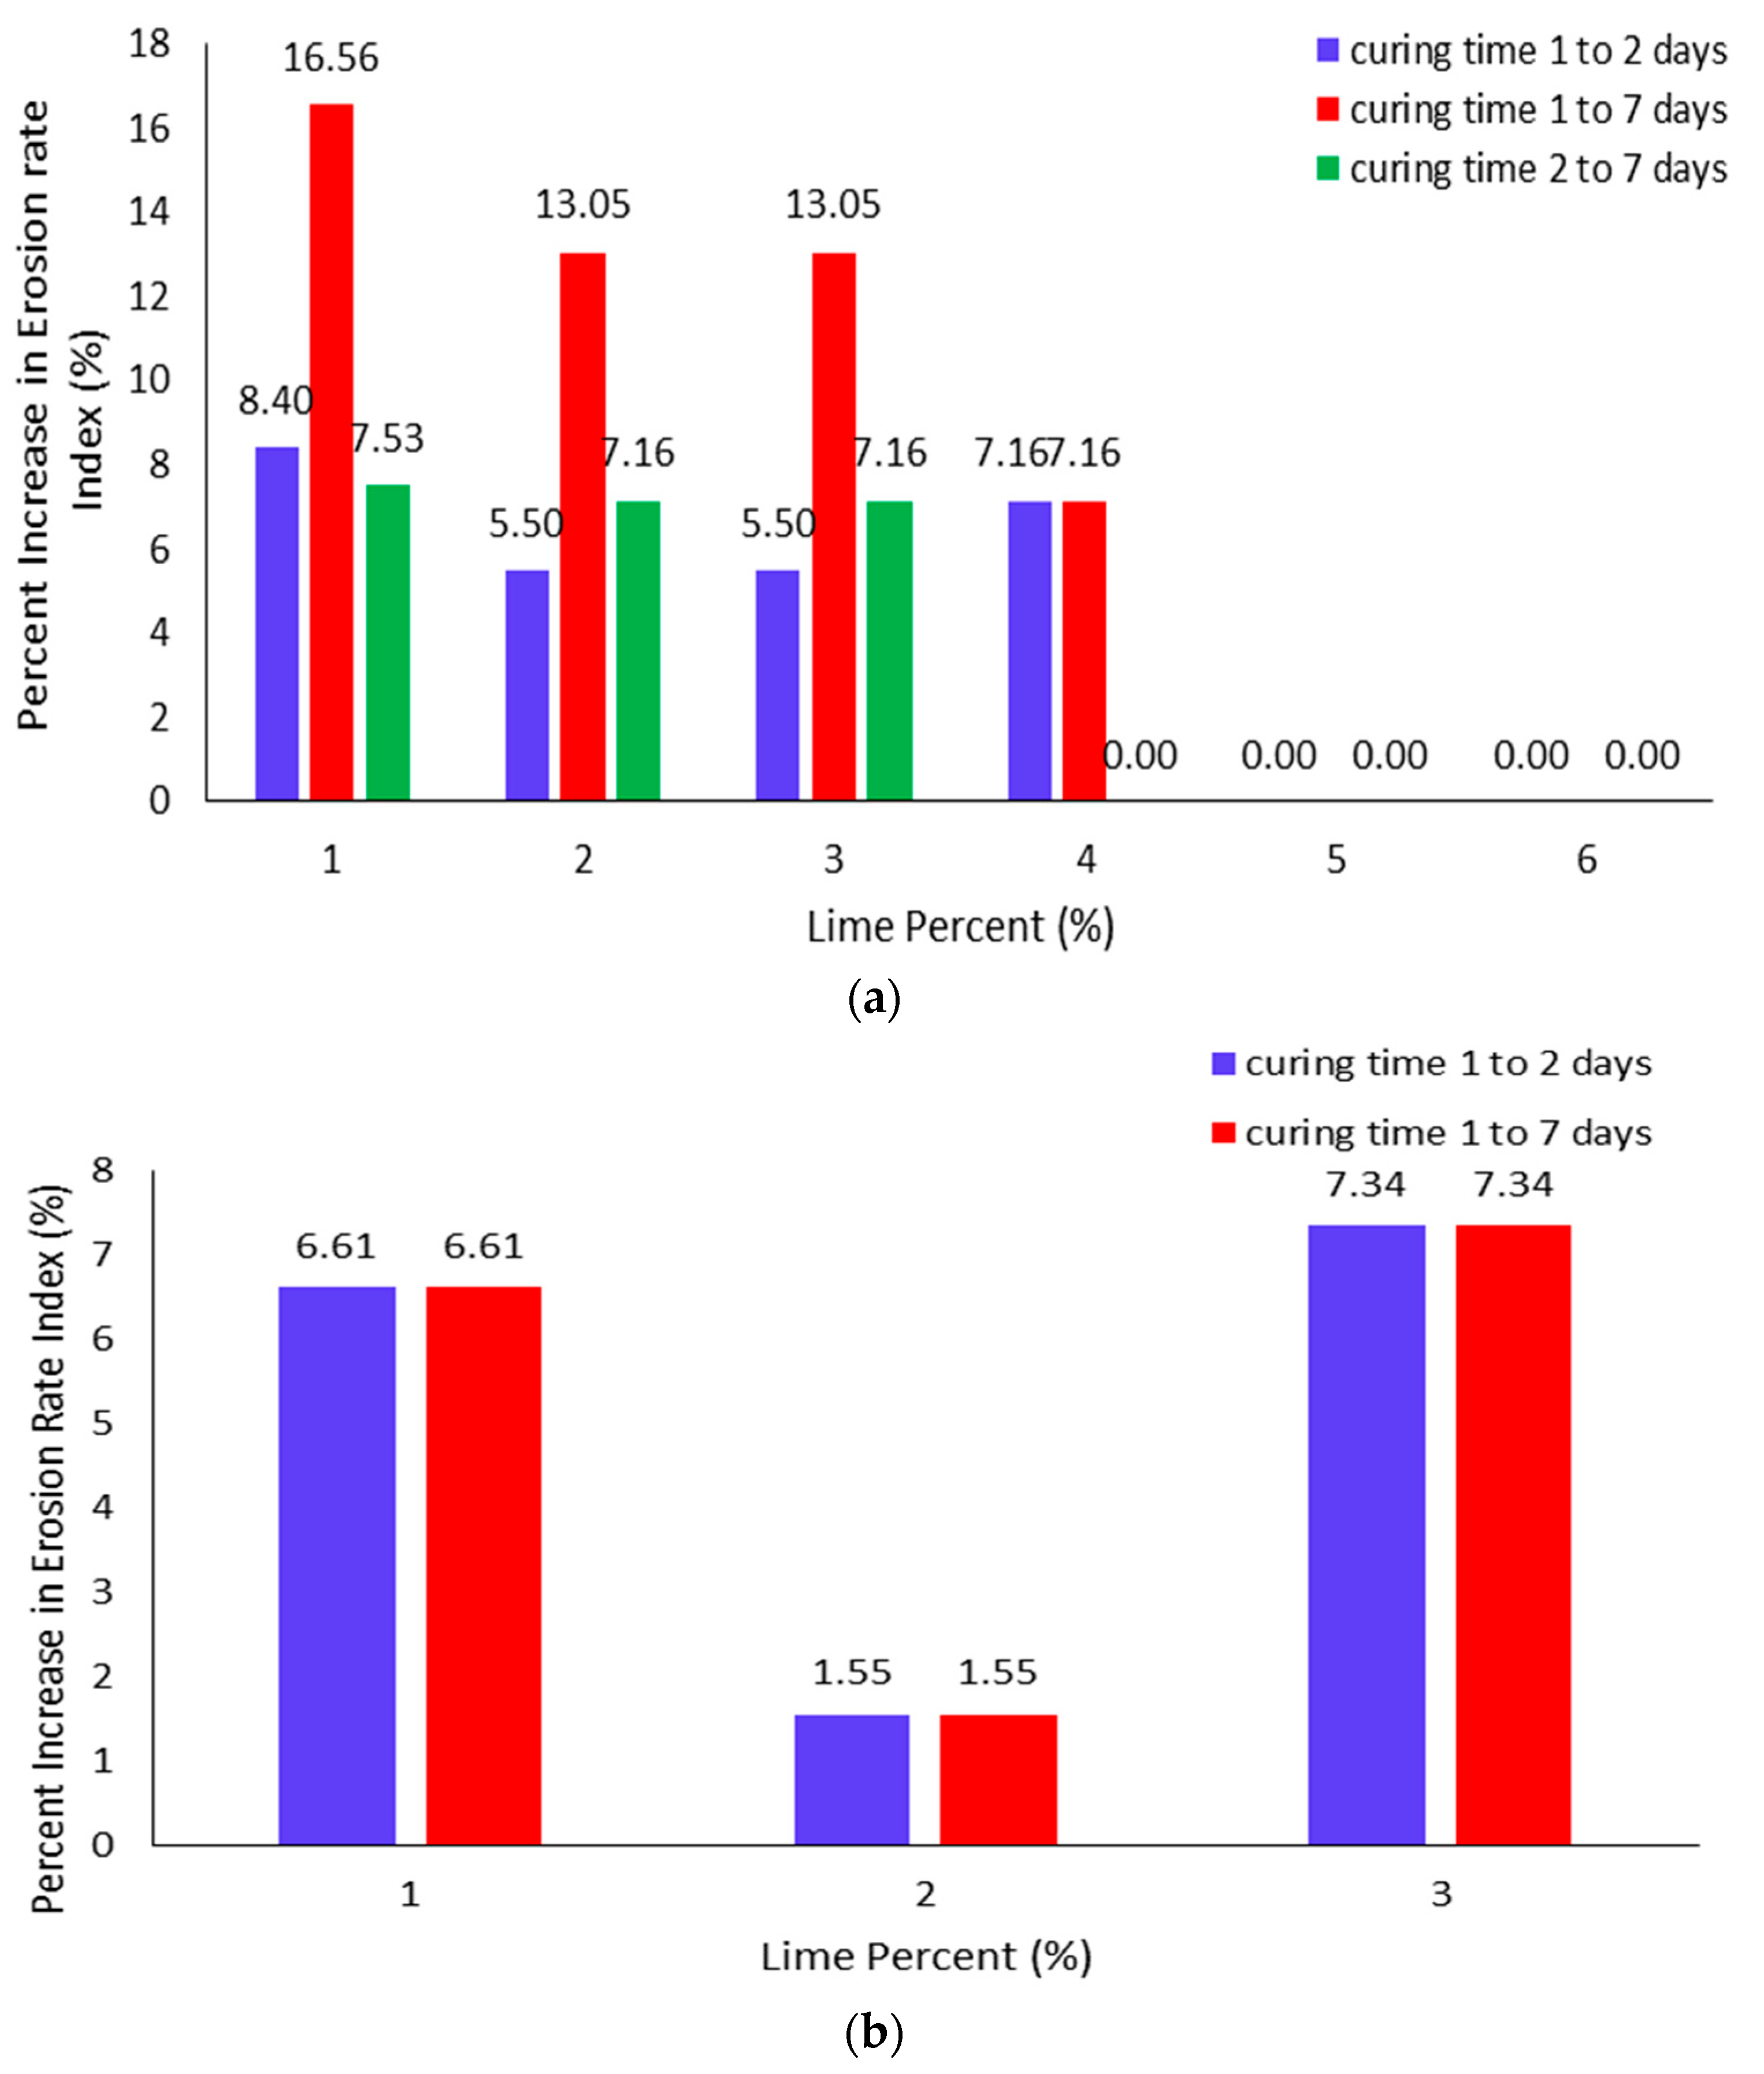
4.3. Effect of Curing Time on Erosion Rate Index (IHET)

Figure 6 presents the erosion rate index relationship with lime percentages for Soil #1 and Soil #2 with different curing times (24 h, 48 h, and 7 days). For each lime percent, the highest value of the erosion rate index is obtained for the highest curing time, which is 7 days for both Soil #1 and Soil #2. So, an increase in curing time results in a higher erosion rate index value and better soil stabilization till the point of optimum stabilization of soil. Moreover, Table 4 and Figure 6a show that for Soil #1, an increase in lime percentage results in a higher erosion rate index value. For 24 h of curing time, a 27.1% increase in the erosion rate index was determined for Soil #1, with an increase in lime percent from 1.0% to 5.0%. As per Figure 6a, 5.0% and 6.0% lime achieved the highest erosion rate index of 4.69 for all the curing times. Since the soil has been stabilized at 5.0% lime, further addition of lime or curing time did not strengthen or stabilize it further. Since lime completely reacts with a curing time of 48 h the 48 h and 7 days curing time values in Figure 6a remained constant at 5.0% lime. Hence, similar to earlier deductions, these results demonstrate that Soil #1 gets stabilized with 5.0% of lime and a curing time of 48 h. Likewise, Figure 6b and Table 5 also show that for Soil #2, an increase in curing time and lime percentage provides a better erosion rate index value. At 0.0% of lime, the effect of curing time was not seen (so the erosion rate index value was a constant value of 3.69 for all curing times) because the curing time effect starts with the inclusion of lime. As mentioned earlier, the highest erosion rate index value for each lime percentage is obtained at 48 h and 7 days of curing time. Thus, as the curing time increases, the erosion rate index value increases for any percentage of lime. Moreover, an increase in the lime percentage from 0.0% to 3.0% resulted in a 43.6% improvement in the erosion rate index with a curing time of 24 h. This demonstrates that an increase in lime percentage improved the erosion rate index of Soil #2. In addition, Figure 6b shows that the erosion rate index does not improve beyond the curing time of 48 h. Since the highest erosion rate index of 5.70 is obtained at 3.0% of lime and 48 h of curing time, so Soil #2 is concluded to be stabilized to an optimum level with 3.0% of lime and a curing time of 48 h.
Figure 7a presents the percentage increase in the erosion rate index with the increase in curing time for Soil #1 with different lime percentages. It shows a high increase in the erosion rate index with the increase of curing time from 1 to 7 days for 1.0%, 2.0%, 3.0%, and 4.0% of lime. This further validates that an increased curing time leads to a higher erosion rate index value. At 5.0% and 6.0% lime, there was a negligible impact of curing time noticed on the erosion rate index values. This is because, as determined earlier, at 5.0% lime with 48 h of curing time, the soil gets stabilized, so the effect of higher curing time will not improve the erosion rate index results any further. According to Figure 7b results, an increase in curing time from 1 to 2 days or 1 to 7 days had the same results of 6.61%, 1.55%, and 7.34% for 1.0%, 2.0%, and 3.0% of lime for Soil #2. Similar to the earlier results, 0.0% lime results were found to be insignificant since the curing time effect starts with the addition of lime. In addition, an insignificant effect was observed on the erosion rate index with increased curing time from 2 to 7 days. So, Soil #2 obtained the highest erosion rate index value at 3.0% lime with 2 days of curing time as it gets stabilized at this point.

4.4. Erosion Parameters and Type of Internal Erosion of Soil #1 and Soil #2

Table 4 and Table 5 present the final diameter of the water flow path (φf), critical erosion stress (τc), erosion rate index (IHET), and the description of soil erosion (based on Table 3). For Soil #1 in Table 4, as evaluated earlier, about 5.0% of lime (based on the dry weight of soil) with a curing time of 2 days is required for stabilization of soil against internal erosion. At 5.0% lime, the erosion rate index (IHET) was found to be about 4.69, a moderately slow type of soil erosion (as per Table 3), and the critical erosion stress value was about 115 N/m2. The final diameter of the hole remained unchanged at 5.0% and 6.0% lime, with curing times of 2 and 7 days. The final diameter of the hole was found to be nearest to the initial diameter of the hole, with only a 2.1 mm increase in the hole diameter. The test ran for about 75 min with a constant flow rate and an insignificant change in the hole diameter was determined beyond a 2.1 mm increase. So, the highest critical erosion stress and erosion rate index and the smallest increase in hole diameter were obtained at 5.0% lime and a curing time of 2 days. The additional percentage of lime and curing time seem to have a negligible impact on the strength and stabilization of soil. Hence, Soil #1 was concluded to be stabilized with 5.0% of lime and a curing time of 2 days. For Soil #2, Table 5 and the earlier results show that about 3.0% of lime (based on the dry weight of soil) with a curing time of 2 days is required for optimum soil stabilization against internal erosion. At 3.0% lime, the erosion rate index (IHET) was found to be about 5.70, which is a very slow type of soil erosion (as per Table 3), and the critical erosion stress value was about 150 N/m2. The smallest increase (=1.8mm) in hole diameter was also observed at 3.0% lime with a curing time of 2 days. The test ran for more than four h (250 min) with a high-pressure head of 1200 mm, and there was negligible change in the water flow rate and the final diameter of the water flow path. This shows that the soil specimen has stabilized. The additional curing time beyond 2 days did not significantly impact the hole diameter, critical erosion stress, and erosion rate index values. Therefore, Soil #2 has been stabilized with 3.0% lime and a curing time of 2 days. For further illustration of the final diameters of the water flow paths in Soil #1 and Soil #2, refer to Figure 8 and Figure 9, respectively.
Table 4 and Table 5 and Figure 8 and Figure 9 show that Soil #2 performs significantly better than Soil #1 due to the presence of binding elements in Soil #2, which react well with lime. Soil #1 is poorly graded sandy soil with no cohesion as it is mainly composed of sand (=99.4%), as shown in the soil properties (refer to Table 1). Sand has no cohesion, so the internal friction angle is the only source of shear strength in it. Lime reacts well with materials including binding elements such as clay or silt. Hence, Soil #1 is weaker compared to Soil #2 and requires a higher amount of lime percentage, about 5.0%, to stabilize to a moderately slow type of internal erosion (erosion rate index = 4.69). On the other hand, Soil #2 is a well-graded sandy soil with higher cohesive strength due to significant amounts of clay and silt (refer to Table 1). Therefore, Soil #2 required a lower lime percentage of only 3.0% to stabilize against internal erosion. Soil #2 obtained a much better erosion rate index of 5.70, which is considered a very slow type of internal erosion, according to Table 3. Hence, the soil type, properties, and gradation play a significant role in evaluating the lime required to stabilize the soil against internal erosion. Therefore, it is essential to study the initial physical properties of materials before using them in construction activities.

5. Conclusions

This paper studies the stabilization of sandy soil against internal erosion using quicklime. A comprehensive experimental process called the hole erosion test (HET) was utilized to perform this study. The HET was used to replicate piping erosion in embankment dams. In this study, two types of sandy soil, poorly graded sandy soil (Soil #1) and well-graded sandy soil (Soil #2), were tested with quicklime and analyzed. Different percentages of lime were added to both types of soil and tested at different curing times. The results of the HET tests of soil specimens were analyzed to determine their erosion parameters, such as the final diameter of the water flow path (φf), critical erosion stress (τc), and erosion rate index (IHET). The primary findings of this research are as follows:
  • Lime was found to be an effective stabilizing agent for sandy soil against internal erosion.
  • A higher amount of lime reduces the final diameter of the water flow path (φf) for both poorly graded and well-graded sandy soil.
  • A higher percentage of lime increases the critical erosion stress (τc) and erosion rate index (IHET) values for poorly graded and well-graded sandy soils.
  • An increase in curing time led to a substantial reduction in the final diameter of the water flow path (φf) for both types of sandy soil. For poorly graded sandy soil, about a 53.3% reduction in the final diameter of the water flow path (φf) was noticed at 5.0% lime with an increase in curing time from 1 to 2 days. While for well-graded sandy soil, about a 10.0% reduction in the final diameter of the water flow path (φf) was found at 3.0% lime with an increase in curing time from 1 to 2 days.
  • A higher curing time resulted in higher critical erosion stress (τc) and erosion rate index (IHET) values for both types of sandy soil. Therefore, a higher curing time resulted in better stabilization of sandy soil until the optimum level of stabilization of sandy soil was reached.
  • Poorly graded sandy soil (Soil #1) was determined to be stabilized against internal erosion with about 5.0% of lime (based on the dry weight of the soil) and with a curing time of 2 days. Well-graded sandy soil (Soil #2) required about 3.0% of lime (based on the dry weight of the soil) with a curing time of 2 days.
  • At the optimum lime content of 5.0% for poorly and 3.0% for well-graded sandy soil, a curing time beyond 2 days had a negligible effect on the soil stabilization against internal erosion.
  • Critical erosion stress for stabilized poorly graded and well-graded sandy soil were 115 N/m2 and 150 N/m2, respectively.
  • The erosion rate indices for stabilized poorly graded and well-graded sandy soil were 4.69 (which is a moderately slow type of erosion) and 5.70 (which is a very slow type of erosion), respectively.
  • With the increase in lime percentage and curing time, internal erosion of poorly graded sandy soil (Soil #1) improved from a moderately rapid type to a moderately slow type of erosion. On the other hand, internal erosion of well-graded sandy soil (Soil #2) changed from a moderately rapid to a very slow type of erosion with the increase in lime percentage and curing time.
Lime was highly effective in stabilizing well-graded sandy soil compared to poorly graded sandy soil. So, well-graded sandy soil required less lime to stabilize against internal erosion and obtained comparatively better erosion parameter values. This occurred due to the presence of binding elements such as clay or silt in well-graded sandy soil. Binding elements provide substantial cohesive strength and react well with quicklime.

6. Future Work

This study was conducted at the American University of Sharjah (AUS) as part of their research program to study the effect of quicklime stabilization on sandy soil against internal erosion by studying the erosion parameters such as the diameter of the water flow path (φf), critical erosion stress (τc), and erosion rate index (IHET). Further research is recommended to be performed to study the influence of other properties such as maximum dry density, optimum moisture content, cohesion, angle of internal friction, and gradation on the internal erosion of soil. Furthermore, studies may be conducted to analyze the effect of other stabilizing agents, such as oil shale, fly ash, bitumen, and some solid waste materials against internal soil erosion.

Author Contributions

Conceptualization, M.F.A.; methodology, S.A.B. and M.F.A.; software, S.A.B.; validation, S.A.B. and M.F.A.; formal analysis, S.A.B. and M.F.A.; investigation, S.A.B. and M.F.A.; resources, M.F.A.; data curation, S.A.B.; writing—original draft preparation, S.A.B.; writing—review and editing, M.F.A.; visualization, M.F.A.; supervision, M.F.A.; project administration, M.F.A.; funding acquisition, M.F.A. All authors have read and agreed to the published version of the manuscript.

Funding

This research was financially supported by the American University of Sharjah (AUS) through the Faculty Research Grant program (FRG20-M-E61) and the Open Acess Program (OAP).

Data Availability Statement

Not applicable.

Acknowledgments

The authors would like to acknowledge and show their gratitude towards the American University of Sharjah (AUS) research office and the Open Acess Program (OAP) in the university for their support. This paper represents the opinions of the authors and does not mean to represent the opinions or position of the American University of Sharjah.

Conflicts of Interest

The authors declare no conflict of interest.

References

  1. Chen, S.H. Introduction. In Hydraulic Structures; Springer: Berlin/Heidelberg, Germany, 2015; pp. 1–39. [Google Scholar]
  2. Attom, M.F.; El-Emam, M.M.; Khan, Z.H.; Vandanapu, R. Reducing the collapsibility of clay using a cement–polymeric fibre admixture. Proc. Inst. Civ. Eng. Ground Improv. 2018, 171, 38–48. [Google Scholar] [CrossRef]
  3. Vandanapu, R.; Omer, J.R.; Attom, M.F. Laboratory simulation of the influence of groundwater rise and drip irrigation on the settlement of a sample of collapsible desert soil. Int. J. Geotech. Eng. 2021, 15, 760–766. [Google Scholar] [CrossRef] [Green Version]
  4. Vandanapu, R.; Omer, J.R.; Attom, M.F. Three dimensional finite element analyses of ground settlement and structural damage caused by irrigation of desert landscapes overlying collapsible soil strata. Int. J. Geotech. Eng. 2022, 16, 90–102. [Google Scholar] [CrossRef] [Green Version]
  5. Luthi, M. A Modified Hole Erosion Test (HET-P) to Study Erosion Characteristics of Soil. Master’s Thesis, The University of British Columbia, Vancouver, BC, Canada, 2011. [Google Scholar]
  6. Robbins, B.; Griffiths, D. Internal Erosion of Embankments: A review and Appraisal. In Proceedings of the Rocky Mountain Geo-Conference 2018, Golden, CO, USA, 2 November 2018. [Google Scholar]
  7. Foster, M.; Fell, R.; Spannagle, M. A method for assessing the relative likelihood of failure of embankment dams by piping. Can. Geotech. J. 2000, 37, 1025–1038. [Google Scholar] [CrossRef]
  8. Hanneman, D. Recent examples of backward erosion piping, internal erosion along a conduit, and embankment cracking at Bureau of Reclamation dams. In Internal Erosion in Embankment Dams and Their Foundations; Routledge: Brno, Czech Republic, 2011. [Google Scholar]
  9. Hodák, J.; Žatecký, S.; Švarc, O. Failures on small dams due to internal erosion. In Internal Erosion in Embankment Dams and Their Foundations; Routledge: Brno, Czech Republic, 2011. [Google Scholar]
  10. Wan, C.F.; Fell, R. Investigation of Rate of Erosion of Soils in Embankment Dams. J. Geotech. Geoenvironmental. Eng. 2004, 130, 373–380. [Google Scholar] [CrossRef]
  11. Negi, A.S.; Faizan, M.; Siddharth, D.P.; Singh, R. Soil stabilization using lime. Int. J. Innov. Res. Sci. Eng. Technol. 2013, 2, 1–6. [Google Scholar]
  12. Khemissa, M.; Mahamedi, A. Cement and lime mixture stabilization of an expansive overconsolidated clay. Appl. Clay Sci. 2014, 95, 104–110. [Google Scholar] [CrossRef]
  13. Lemaire, K.; Deneele, D.; Bonnet, S.; Legret, M. Effects of lime and cement treatment on the physicochemical, microstructural and mechanical characteristics of a plastic silt. Eng. Geol. 2013, 166, 255–261. [Google Scholar] [CrossRef]
  14. Bessaim, M.M.; Bessaim, A.; Missoum, H.; Bendani, K. Effect of quick lime on physicochemical properties of clay soil. In Proceedings of the MATEC Web of Conferences CMSS-2017, Rabat, Morocco, 22–25 November 2017; EDP Sciences: Paris, France, 2018. [Google Scholar]
  15. Mohamed, S.W.A. Stabilization of Desert Sand Using Water-Borne Polymers; United Arab Emirates University: Abu Dhabi, United Arab Emirates, 2004. [Google Scholar]
  16. Bogas, J.A.; Silva, M.; Gomes, M.D.G. Unstabilized and stabilized compressed earth blocks with partial incorporation of recycled aggregates. Int. J. Arch. Herit. 2019, 13, 569–584. [Google Scholar] [CrossRef]
  17. Malkanthi, S.; Balthazaar, N.; Perera, A. Lime stabilization for compressed stabilized earth blocks with reduced clay and silt. Case Stud. Constr. Mater. 2020, 12, e00326. [Google Scholar] [CrossRef]
  18. Attom, M.; Shatnawi, M.Y. Stabilization of clayey soils using hay material. J. Solid Waste Technol. Manag. 2005, 31, 84–92. [Google Scholar]
  19. Vakili, A.H.; Ghasemi, J.; bin Selamat, M.R.; Salimi, M.; Farhadi, M.S. Internal erosional behaviour of dispersive clay stabilized with lignosulfonate and reinforced with polypropylene fiber. Constr. Build. Mater. 2018, 193, 405–415. [Google Scholar] [CrossRef]
  20. Vinod, J.S.; Indraratna, B.; Al Mahamud, M.A. Stabilisation of an erodible soil using a chemical admixture. Proc. Inst. Civ. Eng. Ground Improv. 2010, 163, 43–51. [Google Scholar] [CrossRef] [Green Version]
  21. Herrier, G.; Chevalier, C.; Froumentin, M.; Cuisinier, O.; Bonelli, S.; Fry, J. Lime treated soil as an erosion-resistant material for hydraulic earthen structures. In Proceedings of the International Conference on Scour and Erosion, Paris, France, 27–31 August 2012. [Google Scholar]
  22. Baldovino, J.D.J.A.; Izzo, R.L.D.S.; Moreira, E.B.; Rose, J.L. Optimizing the evolution of strength for lime-stabilized rammed soil. J. Rock Mech. Geotech. Eng. 2019, 11, 882–891. [Google Scholar] [CrossRef]
  23. Indraratna, B.; Mahamud, M.; Vinod, J.S.; Wijeyakulasuriya, V. Stabilization of an erodible soil using a chemical admixtures. In Proceedings of the 2nd International Conference on Geotechnical Engineering, Tunis, Tunisia, 25–27 October 2010. [Google Scholar]
  24. Nagaraj, H.; Sravan, M.; Arun, T.; Jagadish, K. Role of lime with cement in long-term strength of Compressed Stabilized Earth Blocks. Int. J. Sustain. Built Environ. 2014, 3, 54–61. [Google Scholar] [CrossRef] [Green Version]
  25. Consoli, N.C.; Lopes, L.D.S., Jr.; Heineck, K.S. Key Parameters for the Strength Control of Lime Stabilized Soils. J. Mater. Civ. Eng. 2009, 21, 210–216. [Google Scholar] [CrossRef]
  26. Consoli, N.C.; Da Silva, L., Jr.; Prietto, P.D.M.; Festugato, L.; Cruz, R.C. Variables Controlling Stiffness and Strength of Lime-Stabilized Soils. J. Geotech. Geoenvironmental. Eng. 2011, 137, 628–632. [Google Scholar] [CrossRef]
  27. Consoli, N.C.; Bittar Marin, E.J.; Quiñónez Samaniego, R.A.; Heineck, K.S.; Johann, A.D.R. Use of Sustainable Binders in Soil Stabilization. J. Mater. Civ. Eng. 2019, 31, 06018023. [Google Scholar] [CrossRef]
  28. Karimi, M.; Ghorbani, A.; Daghigh, Y.; Kia, S. Stabilization of Silty Sand Soils with lime and Microsilica Admixture in presence of Sulfates. In Proceedings of the 2011 Pan-Ame CGS Geotechnical Conference—14th Pan-American Conference on Soil Mechanics and Geotechnical Engineering, Toronto, ON, Canada, 2–6 October 2011. [Google Scholar]
  29. Mohamedzein, Y.E.A.; Taha, R.; Aghbari, M.A. Stabilisation of desert sands using cement and cement dust. Proc. Inst. Civ. Eng. Ground Improv. 2009, 162, 145–151. [Google Scholar]
  30. Rahman, M.; Rashiduzzaman, M.; Akhand, F.Z.; Kabir, K.B. Compressed Stabilized Earth Block: A Green Alternative for Non-load Bearing Building Block in Developing Countries like Bangladesh. Am. Chem. Sci. J. 2016, 12, 1–10. [Google Scholar] [CrossRef]
  31. Maubec, N.; Deneele, D.; Ouvrard, G. Influence of the clay type on the strength evolution of lime treated material. Appl. Clay Sci. 2017, 137, 107–114. [Google Scholar] [CrossRef]
  32. SETRA. Traitement Des Sols À La Chaux Et/ou Aux Liants Hydrauliques—Application À La Réalisation Des Assises De Chausses; Guide Technique: Bagneux, France, 2007. [Google Scholar]
  33. Rosone, M.; Megna, B.; Celauro, C. Analysis of the chemical and microstructural modifications effects on the hydro-mechanical behaviour of a lime-treated clay. Int. J. Geotech. Eng. 2019, 15, 447–460. [Google Scholar] [CrossRef]
Figure 1. (a) Top view of final soil specimen with 6 mm diameter hole before curing, (b) HET schematic diagram inspired from [10], and (c) HET laboratory apparatus.
Geosciences 13 00102 g001aGeosciences 13 00102 g001b
Figure 2. Graphical representation of final hole diameter (φf) against lime percent (%) for (a) Soil #1 and (b) Soil #2 with different curing times.
Geosciences 13 00102 g002
Figure 3. Percent reduction in hole diameter (%) due to the increase in curing times for different lime percentages in (a) Soil #1 and (b) Soil #2.
Geosciences 13 00102 g003
Figure 4. Critical erosion stress (τc) versus lime percent (%) for (a) Soil #1 and (b) Soil #2 with various curing times.
Geosciences 13 00102 g004aGeosciences 13 00102 g004b
Figure 5. Percent increase in critical erosion stress (%) due to the increase in curing times for different lime percentages in (a) Soil #1 and (b) Soil #2.
Geosciences 13 00102 g005aGeosciences 13 00102 g005b
Figure 6. Erosion rate index (IHET) versus lime percent (%) for (a) Soil #1 and (b) Soil #2 with various curing times.
Geosciences 13 00102 g006
Figure 7. Percent increase in erosion rate index (%) due to the increase in curing times for different lime percentages in (a) Soil #1 and (b) Soil #2.
Geosciences 13 00102 g007
Figure 8. Final hole diameter (φf) for some of the Soil #1 tested samples: (a) 1% lime at 1 day curing and (b) 5% lime at 2 days curing.
Geosciences 13 00102 g008
Figure 9. Final hole diameter (φf) for some of the Soil #2 tested samples: (a) 1% lime and (b) 2% lime at 1 day curing.
Geosciences 13 00102 g009
Table 1. Soil #1 and Soil #2 properties.
ParametersSoil #1Soil #2
Clay (%)04.0
Silt (%)0.68.0
Sand (%)99.488.0
Coefficient of uniformity, Cu1.611.05
Coefficient of curvature, Cc0.92.26
Specific gravity, Gs2.602.67
Maximum dry density, γd,max (kg/m3)16901908
Optimum moisture content, ωop (%)11.9513.0
ClassificationPoorly graded sandy soilWell-graded sandy soil
Table 2. Quicklime properties used in this study.
CompositionsSpecifications (% Weight)
Available lime (as calcium oxide)Min: 90.00
Total calcium oxide (CaO)Min: 92.20
Carbon dioxide (CO2)Max: 1.80
Unburnt calcium carbonate (CaCO3)Max: 4.10
Magnesium oxide (MgO)Max: 2.00
R2O3 (Aluminum oxide (Al2O3) + Iron (III) Oxide (Fe2O3))Max: 0.60
Silicon dioxide (SiO2)Max: 1.75
Acid insoluble residueMax: 0.35
Loss on ignition (L.O.I)Max: 3.50
Sulphur as SO3Max: 0.35
Initial temperature rise (degrees Celsius) at 30 s (with lime to water ratio 1:4)Max: 32
Total temperature rise (degrees Celsius)Max: 50
Total active slaking time (minutes)Max: 3.50
Table 3. Descriptions of internal soil erosion for representative erosion rate index [10].
Group NumberErosion RateDescription
1<2Extremely rapid
22–3Very rapid
33–4Moderately rapid
44–5Moderately slow
55–6Very slow
6>6Extremely slow
Table 4. Final erosion parameters of Soil #1.
Lime PercentErosion ParametersCuring Time
24 h (1 Day)48 h (2 Days)7 Days
1%φf (mm)332018.8
τc (N/m2)85101104
IHET3.6944.301
Description of soil erosionModerately rapidModerately slowModerately slow
2%φf (mm)21.51910
τc (N/m2)85106.66110
IHET44.224.522
Description of soil erosionModerately slowModerately slowModerately slow
3%φf (mm)191910
τc (N/m2)97106.66110
IHET44.224.522
Description of soil erosionModerately slowModerately slowModerately slow
4%φf (mm)12.51110
τc (N/m2)100106.66110
IHET4.224.5224.522
Description of soil erosionModerately slowModerately slowModerately slow
5%φf (mm)10.58.18.1
τc (N/m2)115115115
IHET4.694.694.69
Description of soil erosionModerately slowModerately slowModerately slow
6%φf (mm)10.38.18.1
τc (N/m2)115115115
IHET4.694.694.69
Description of soil erosionModerately slowModerately slowModerately slow
Table 5. Final erosion parameters of Soil #2.
Lime PercentErosion ParametersCuring Time
24 h (1 Day)48 h (2 Days)7 Days
0%φf (mm)151515
τc (N/m2)100.5100.5100.5
IHET3.693.693.69
Description of soil erosionModerately rapidModerately rapidModerately rapid
1%φf (mm)8.28.28.2
τc (N/m2)105110110
IHET4.6955
Description of soil erosionModerately slowVery slowVery slow
2%φf (mm)87.87.8
τc (N/m2)133.33140140
IHET5.225.3015.301
Description of soil erosionVery slowVery slowVery slow
3%φf (mm)87.87.8
τc (N/m2)140150150
IHET5.3015.75.7
Description of soil erosionVery slowVery slowVery slow
Disclaimer/Publisher’s Note: The statements, opinions and data contained in all publications are solely those of the individual author(s) and contributor(s) and not of MDPI and/or the editor(s). MDPI and/or the editor(s) disclaim responsibility for any injury to people or property resulting from any ideas, methods, instructions or products referred to in the content.

