Article

The Lower Cretaceous “Vigla” Shales Potentiality to Be Source Rocks in the Ionian Basin, Greece

1
Laboratory of Sedimentology, Department of Geology, University of Patras, 26504 Patras, Greece
2
Mineral Resources Engineering Department, Technical University of Crete, 73100 Chania, Greece
*
Author to whom correspondence should be addressed.
Geosciences 2023, 13(2), 44; https://doi.org/10.3390/geosciences13020044
Submission received: 8 December 2022 / Revised: 23 January 2023 / Accepted: 27 January 2023 / Published: 31 January 2023

Abstract

:
As Lower Cretaceous “Vigla” shales have been suggested as one of the main source rocks for the Ionian Basin in Greece, a geochemical analysis was performed for “Vigla” shales in Kastos Island and the Araxos peninsula, far from the already studied areas. Results, based on Rock-Eval VI analysis, sample fractionation, and biomarkers analysis, showed that the studied rocks could be of low production capacity, are type II/III of kerogen, and can produce liquid and gas hydrocarbons for Kastos Island. Organic matter (total organic carbon-TOC 0.02–3.45%) of the studied samples is thermally immature, in the early stages of diagenesis, and was accumulated in an anoxic environment. Additionally, the geochemical analyses confirmed the combination of marine and terrestrial origin of the organic matter. On the other hand, TOC (0.01–0.72%) from the Araxos peninsula shows fair oil potential and type IV kerogen. The results based on the Odd–Even Predominance, OEP (27–31), OEP (2), and OEP (1), valued for samples AG1, AG2, AG5, and AG6, indicated an anoxic deposition environment. As the Ionian Basin was sub-divided into three sub-basins (internal, middle, and external) during its syn-rift evolution, different depositional conditions were developed from one sub-basin to the other, with different sedimentary thicknesses within the same sub-basin or among different sub-basins and with different amounts of TOC. The fact that there is a great difference in geochemical indices between the two studied areas during the same period suggests that probable different depositional conditions could exist. It seems that the richness in Kastos Island could be related to the neighboring Apulian Platform, whereas the poorness in the Araxos peninsula could be related to the Gavrovo platform, or the differences could be related to restrictions produced regions. The comparison with previous studies indicates that different quality and quantity of organic matter could be accumulated either within the same sub-basin or from one sub-basin to the other.

1. Introduction

The development of geochemistry helped the kerogen to produce hydrocarbon or gas; this was achieved by experimental tests (e.g., Rock-Eval VI pyrolize), where models were simulated to process maturation, generation, and migration [1,2,3,4,5,6,7]. Thus, today, petrochemical geochemistry is actively involved in all phases of energy exploitation, from detection and localization to the organization and optimization of its production. All the above were achieved with analytical processes for the characterization of the chemical composition of the oil as well as with biomarkers with the SOXHLET extraction method.
The aim of this paper is to define in detail the depositional environment conditions during the accumulation of organic matter, for the Lower Cretaceous “Vigla” shales of the Ionian Basin. Detailed geochemical studies in the Kastos Island (external Ionian sub-basin) and the Araxos peninsula (internal Ionian sub-basin) were compared with previous studies from the Gotzikas area (middle Ionian sub-basin) and the Ioannina well (internal Ionian sub-basin). The above results and comparisons were used in order to improve the Ionian Basin model of evolution during the Lower Cretaceous period and to suggest new ideas concerning the possibility of “Vigla” shales to be source rocks.

2. Geological Setting of the Ionian Basin

The Mesozoic–Paleogene Ionian Basin is part of the external Hellenides orogeny, bounded westwards by the Ionian Thrust and eastwards by the Gavrovo Thrust (Figure 1). The Pre-Apulian (or Paxoi zone) to the west is regarded as the eastern margin of the Apulian platform in Albania, Croatia, and Italy, where similar rocks occur [8,9,10].
The sedimentary fill of the basin is sub-divided into pre-rift and syn-rift tectono-sedimentary sequences [10,11,12,13] (Figure 2):
The pre-rift sequence begins with evaporites (Early to Middle Triassic) at the base (more than 2000 m thick). These deposits evolved upwards into the Middle–Upper Triassic (Ladinian to Rhaetian) “Foustapidima” limestones (50–150 m thick), and the Lower Jurassic (Hettangian to Sinemurian) “Pantokrator” limestones (more than 1000 m thick).
The syn-rift sequence represents deposition during the extension and deepening of the Ionian Basin, accompanied by internal structural differentiation, into small sub-basins with half graben geometry, displaying abrupt thickness changes within each sub-basin. The syn-rift sequence is composed of Upper Jurassic to Lower Eocene deposits. At the base, it consists of the Lower Jurassic (Pliensbachian) pelagic “Siniais” limestones and their lateral equivalent, the hemipelagic “Louros” limestones (20–150 m thick). These deposits underlay the Lower to Upper Jurassic (Toarcian to Tithonian) “Ammonitico Rosso”, “Limestones with filaments”, and “Posidonia beds” (20–200 m thick). Variations in thickness and formation changes across the basin are observed very often due to the half graben geometry; thus, different basin depths are commonly observed. The Lower Cretaceous (Berriasian to Turonian) is characterized by “Vigla” limestones and the laterally equivalent “Vigla” shales, 200–600 m in total thickness. Over the latter, the Upper Cretaceous “Senonian” limestones (Coniacian to Maastrichtian) were deposited. They range from 200 to 400 m in thickness and contain both nodular and bedded chert. They are composed of the following five different lithofacies [10,12]: (A) Microclastic limestone, which may include a micritic groundmass, generally in graded beds of calciturbidites. (B) Micritic limestones deposited on top of some sand-sized calciturbidites. (C) Bioclastic limestones, often recrystallized, with abundant benthic micro-fauna. (D) Polygenic limestone breccia (rudstones) with elements of various nature and origin (referred to here as microbrecciated limestones). (E) Beds of pelagic limestones, indicating deposition at depths greater than 200 m. The Paleocene rocks have similar lithofacies to the Upper Cretaceous “Senonian” limestones, with prominent microbreccia that derived from the erosion of the Cretaceous carbonates from both the Gavrovo platform (to the east) and the Apulian platform (to the west). The Lower Eocene rocks comprise “Platy Limestones” and platy wackestones/mudstones, with Globigerinidae and nodular cherts, especially in the central area of the Ionian Basin. These deposits seem to be like the “Vigla” limestones, but they lack bedded cherts.
The predominantly Mesozoic succession of the Ionian Basin passes upwards into a terrigenous flysch (turbidite) succession, accumulated during the Late Eocene to Early Miocene as a response to the Pindos Thrust activity, uplift of the Hellenides Orogen, and development of a pro-foreland basin at the edge of the Apulian microcontinent [14,15,16]. Within the Ionian Zone, the Upper Cretaceous–Eocene resedimented carbonates (calcareous turbidites and coarser breccia) are considered one of the main reservoir successions and exploration targets in western Greece [10,12]. They correspond to the producing reservoir rocks in the Katalokon oil field and host proven prolific reservoirs in the Ionian zone of Albania [17] and in the central and southern Adriatic offshore of Italy [9,18]. However, the distribution of these resedimented carbonates (calcareous turbidites and coarser breccia) in western Greece is still poorly constrained.
NNW-SSE directed thrust faults (Pindos thrust, Gavrovo thrust, internal Ionian thrust, middle Ionian thrust, and Ionian thrust) developed in response to compression associated with the westward migration of the nappes and of the external Hellenides Orogen and have been active at least since the Late Eocene [16,19].
Triassic evaporites are exposed along the leading edges of thrust sheets and in tectonic windows above deformed Upper Eocene–Lower Miocene submarine fan successions, suggesting that they correspond to the lowest detachment level of individual thrust sheets in the external Hellenides. In addition to thrust faults, many NE-SW to E-W directed strike-slip faults influenced foreland basin evolution, sediment thickness, and depositional conditions, mostly at their junction with thrusts [19,20,21].
An equivalent example to the studied area (Pre-Apulian platform, Ionian Basin, and Gavrovo platform) occurs in the western Albanides (Sazani platform, Ionian Basin, and Kruja platform, respectively) extending in an NNE–SSW orientation. Sedimentation within the Ionian Basin in Albania was controlled by the tectonic instabilities of both shelf margins (Sazani and Kruja platforms). During the Cretaceous, the deposition in the Ionian Basin was characterized by hemipelagites at the base and by the overlying breccia and calciturbidites, produced from the eroded margins due to their strong tectonic instability [10,22,23].
Other examples could be taken from the other side of the Adriatic Sea, the Apulian platform with its margins located at the Gargano peninsula in Italy. During the studied period (Cretaceous to Early Eocene), steep submarine escarpments characterized the Apulian carbonate platform margins, presenting significant erosion. Breccia accumulated at the toe of the escarpment interbedded with clinostratified deposits and bioclastic turbidites (around the Gargano promontory, Maiella Formation). Along the platform margins, high productivity is suggested by the occurrence of rudist colonies. These colonies were subsequently eroded and redeposited as skeletal material at the toe of the slope [9,24,25,26].

3. Material and Methods

3.1. Fieldwork Sampling

Two different samplings were conducted in Kastos Island and in the Araxos peninsula, both from Lower Cretaceous “Vigla” shales, to have the opportunity to correlate them to form a better picture regarding what is happening in the Ionian Basin from one side to the other, and finally to compare results from this work with previous published works.
Therefore, forty-eight (48) samples were selected; seventeen (17) samples from Kastos (Figure 3a) and thirty-one (31) samples from the Araxos peninsula (Figure 3b) were chosen for further analysis. In Kastos Island, the sections from where the selected samples were taken are shown in Figure 4, and the samples from the Araxos peninsula were selected from the Gianiskari coast (Figure 5).

3.2. Rock-Eval Analysis

The employed experimental methodologies are described below for forty-eight (48) selected samples: Sediment samples, dried at 40 °C overnight, were crushed and sieved using a 60-mesh (250 mm) sieve. Organic geochemical analysis was conducted using the Rock-Eval pyrolysis method with a Rock-Eval VI analyzer. Through this process, parameters, such as free and pyrolyzable hydrocarbons (S1 and S2, mg HC/g rock), hydrogen index (HI, mg HC/g Corg), oxygen index (OI, mg CO2/g Corg), Tmax (°C), total organic carbon (TOC) content (wt%), hydrocarbon potential (S1 + S2, mg HC/g rock), and production index (PI, S1/(S1 + S2)), were determined. The guidelines from Tissot and Welte [27], Peters [7], Burwood et al. [28], and Dymann et al. [29] were followed for evaluating the RE experimental data. In addition, four (4) samples from Kastos Island were selected to be analyzed by Soxhlet extraction for the determination of the biomarkers.

3.3. Sample Fractionation and Biomarkers Analysis

Solvent extraction of the grounded samples was carried out by Soxhlet technique using a chloroform–methanol mixture (87:13 vol). Copper tips, dipped in the solvent during extraction, were used to capture possible present elemental sulfur. Subsequently, extracts were de-asphalted by using excess of n-pentane (40 vol) and filtered through Teflon syringe filters (0.45 μm), and the isolated maltenes were quantitatively measured. The analysis was performed using an Agilent HP 7 890/5975C system, with an HP-5 5% phenyl methylsiloxane column (60 m × 250 μm × 0.25 μm), with the initial oven temperature set at 60 °C, followed by a temperature ramp of 6 °C/min up to 300 °C. The samples (1 μL) were injected through a split–splitless injector (pulsed splitless mode, at 250 °C) diluted (1/200) in ultra-pure n-hexane (SupraSolv®, Merck). The transfer line, MS source, and quantrupole temperatures were set at 280 °C, 230 °C, and 150 °C, respectively. The analysis was carried out in full scan ion detection mode (50–500 amu). Normal alkanes’ concentrations were calculated on the basis of the peak areas from the m/z 85 fragmentograms. The quantitative calibration of the GC-MS was performed following the internal standard methodology, with n-C12-D26 and n-C16-D34 as standard components at a concentration of 58 ppm in the analyzed mixtures.

4. Results

Source rock potential was evaluated on the basis of three fundamental attributes: quantity, quality, and maturity of the organic matter. Through this process, several important Rock-Eval VI-derived parameters that are generated from the analysis are: S1 (free hydrocarbons present within the sample released during the pyrolysis stage; mg HC/g rock), S2 (heavier hydrocarbons released due to pyrolytic breakdown of kerogen released during the pyrolysis stage; mg HC/g rock), Tmax (temperature at which maximum amount of pyrolyzate is cracked under the S2 peak of Rock-Eval; °C), S3 (CO2 released from oxygenated compounds during the pyrolysis stage; mg CO2/g rock), PC (pyrolyzable carbon; calculated from S1, S2, and S3 components), S4 (residual carbon (RC) content of the sample; mg carbon/g rock), HP (hydrocarbon potential; equal to S1 + S2, mg HC/g rock), and TOC (sum of PC and RC; wt%), from which S1/TOC ratio can be calculated. The free hydrocarbons liberated under the S1 peak could be indigenous (free or adsorbed gas/oil) and/or non-indigenous (migrated or contaminated) in nature [30]. The heavier hydrocarbons generated under the S2 peak indicate the remaining hydrocarbon generation capacity of the rock [31] and is used to infer the Van Krevelen types of organic matter input by calculating hydrogen indices (e.g., HI; S2 normalized to TOC, mg HC/g TOC). Similarly, the S3 peak is used to calculate oxygen indices (e.g., OI; S3 normalized to TOC, mg CO2/g TOC; [3]. Both the HI (100*S2/TOC mg HC/g Corg) and OI (100*S3/TOC mg CO2/g Corg) have been used to define the kerogen type present in the rocks [27,30,31] through the kerogen classifying diagram [3]. Particularly, HI reflects the quality and quantity of pyrolyzable organic compounds, from S2 relative to the TOC (mg HC/g TOC), while OI is related to the quantity of terrestrial organic matter. Tmax is used as a maturity parameter for fossil organic matter [27]. Production index (PI; S1/S1 + S2) reveals the total amount of hydrocarbons (S1 + S2) that may be produced [
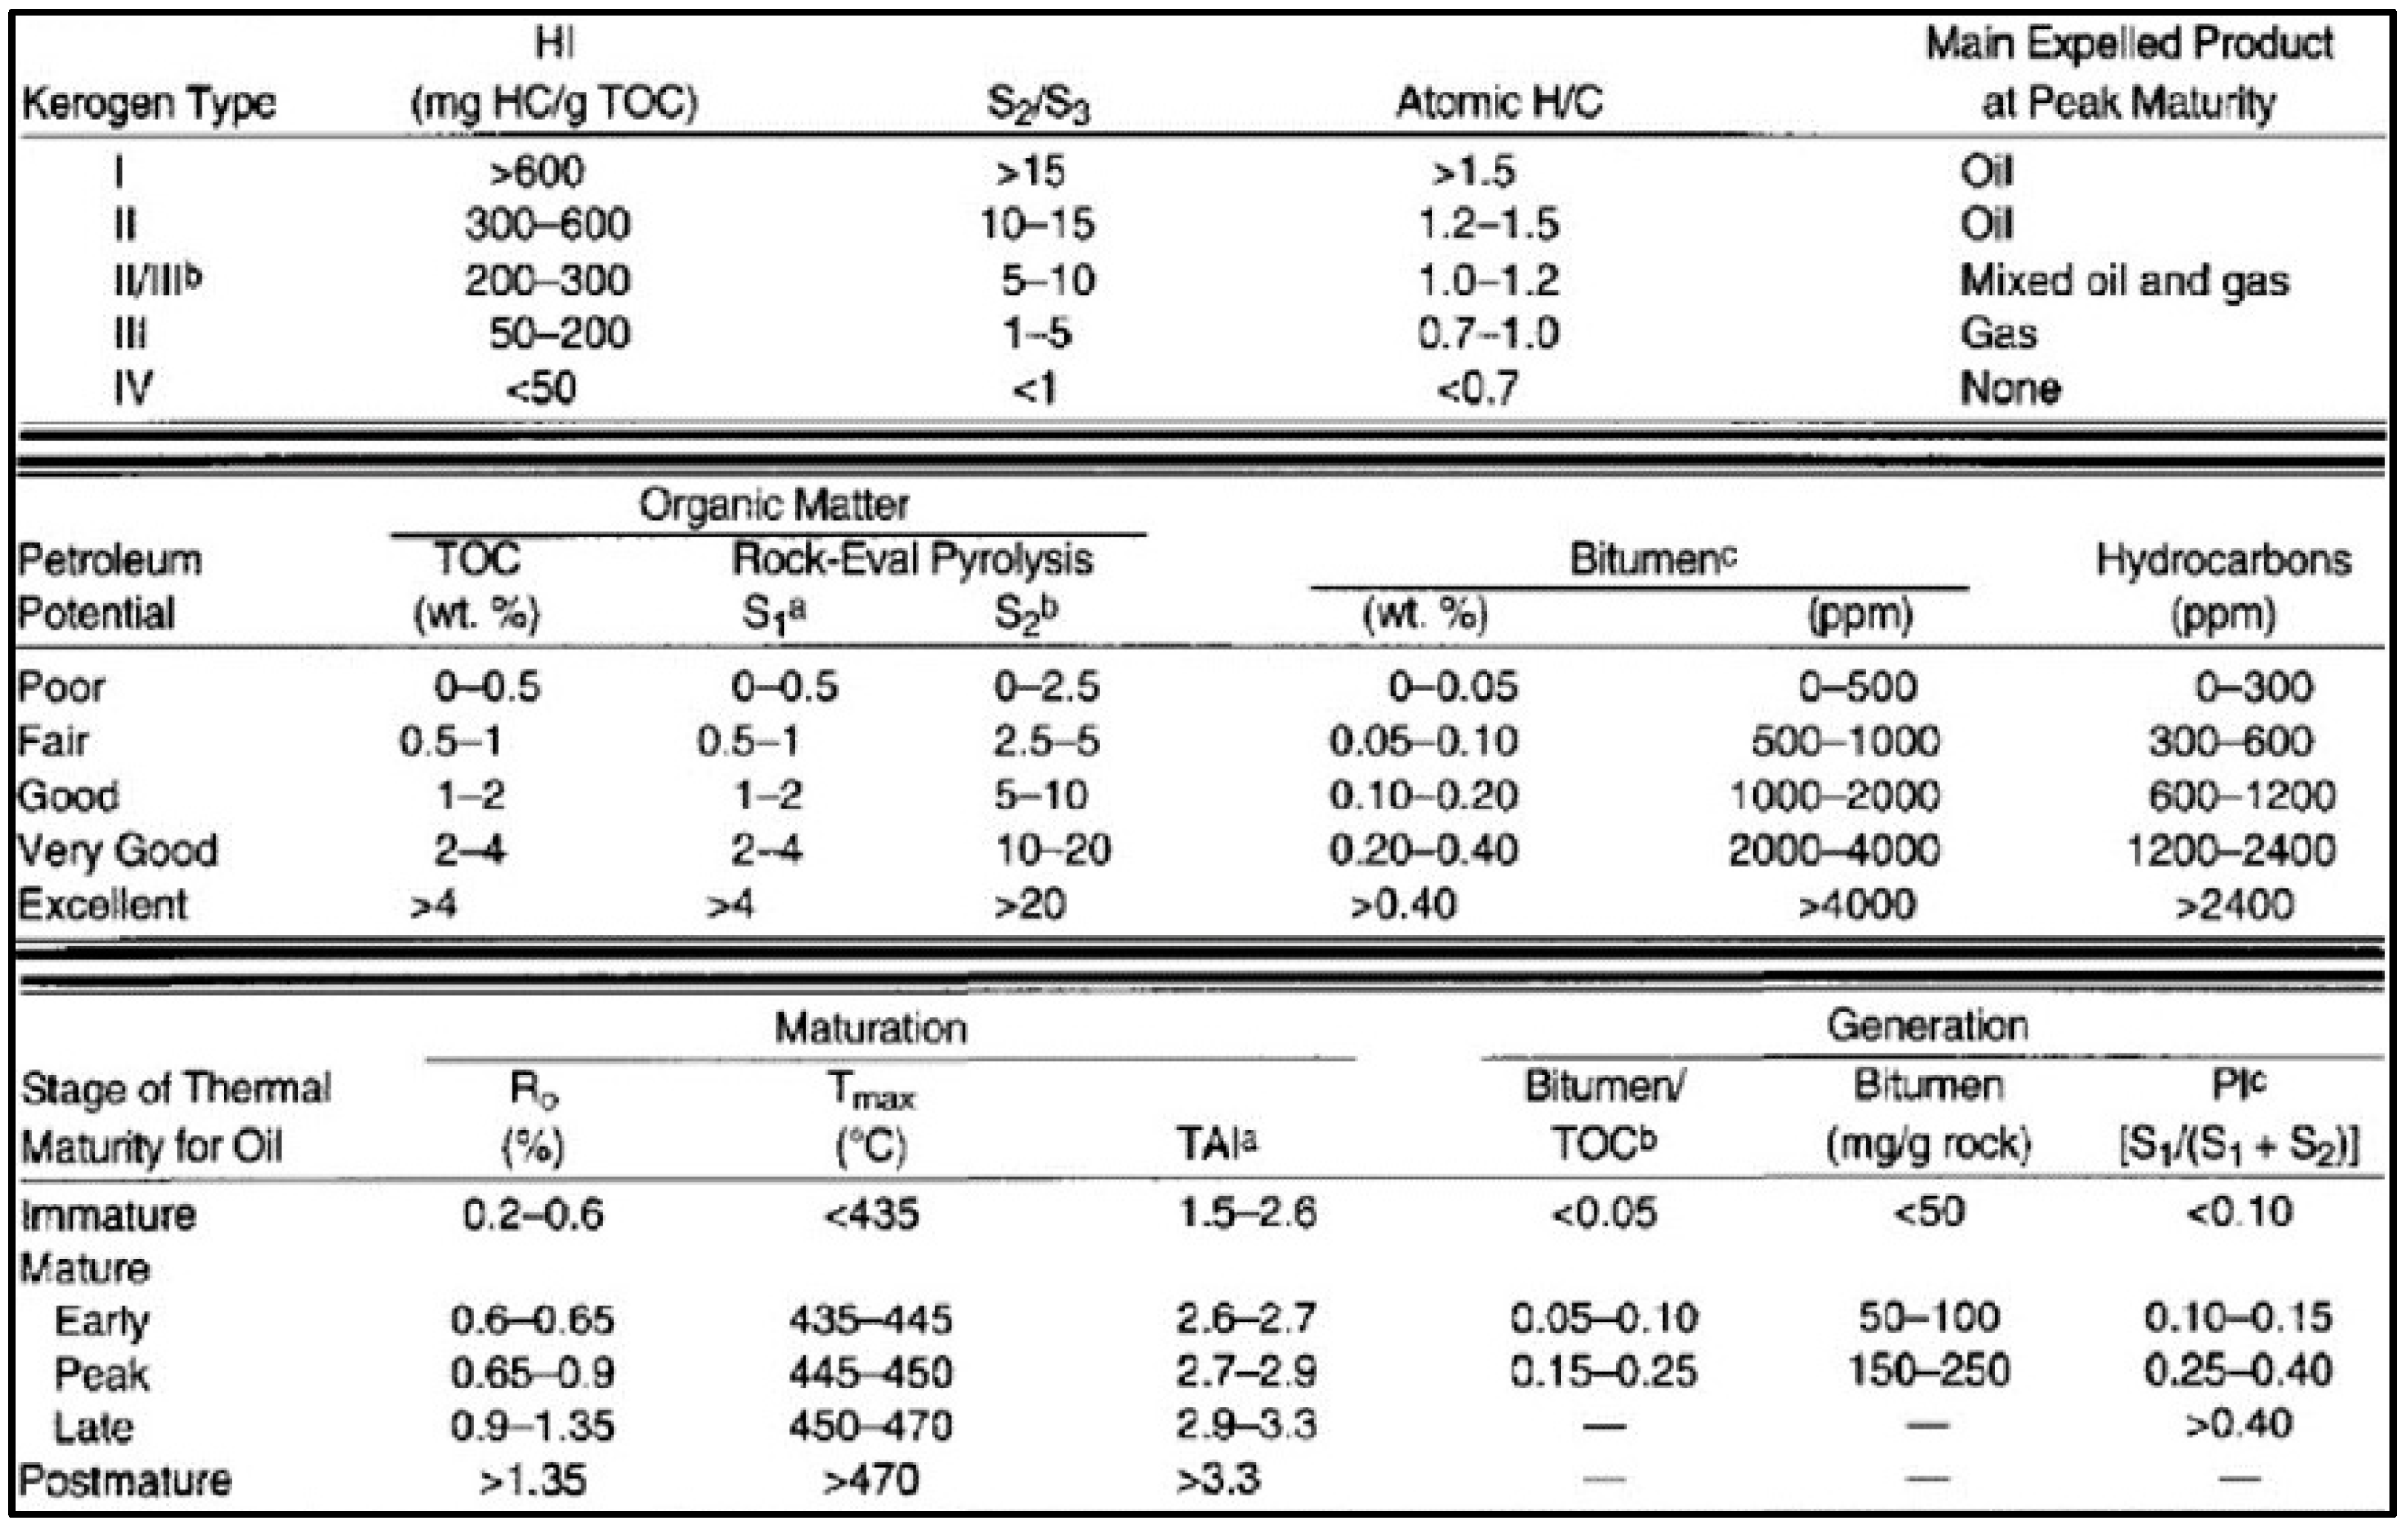
32]. For the interpretation of the RE pyrolysis data, we refer to the specific guidelines of Tissot and Welte [27], Peters and Cassa [6], Peters [7], Burwood et al. [28], and Dymann et al. [29]. Geochemical parameters (e.g., HI, S2/S3) describing the type of hydrocarbons generated were also used, as initially introduced by Peters [7].

4.1. Rock-Eval VI Analysis

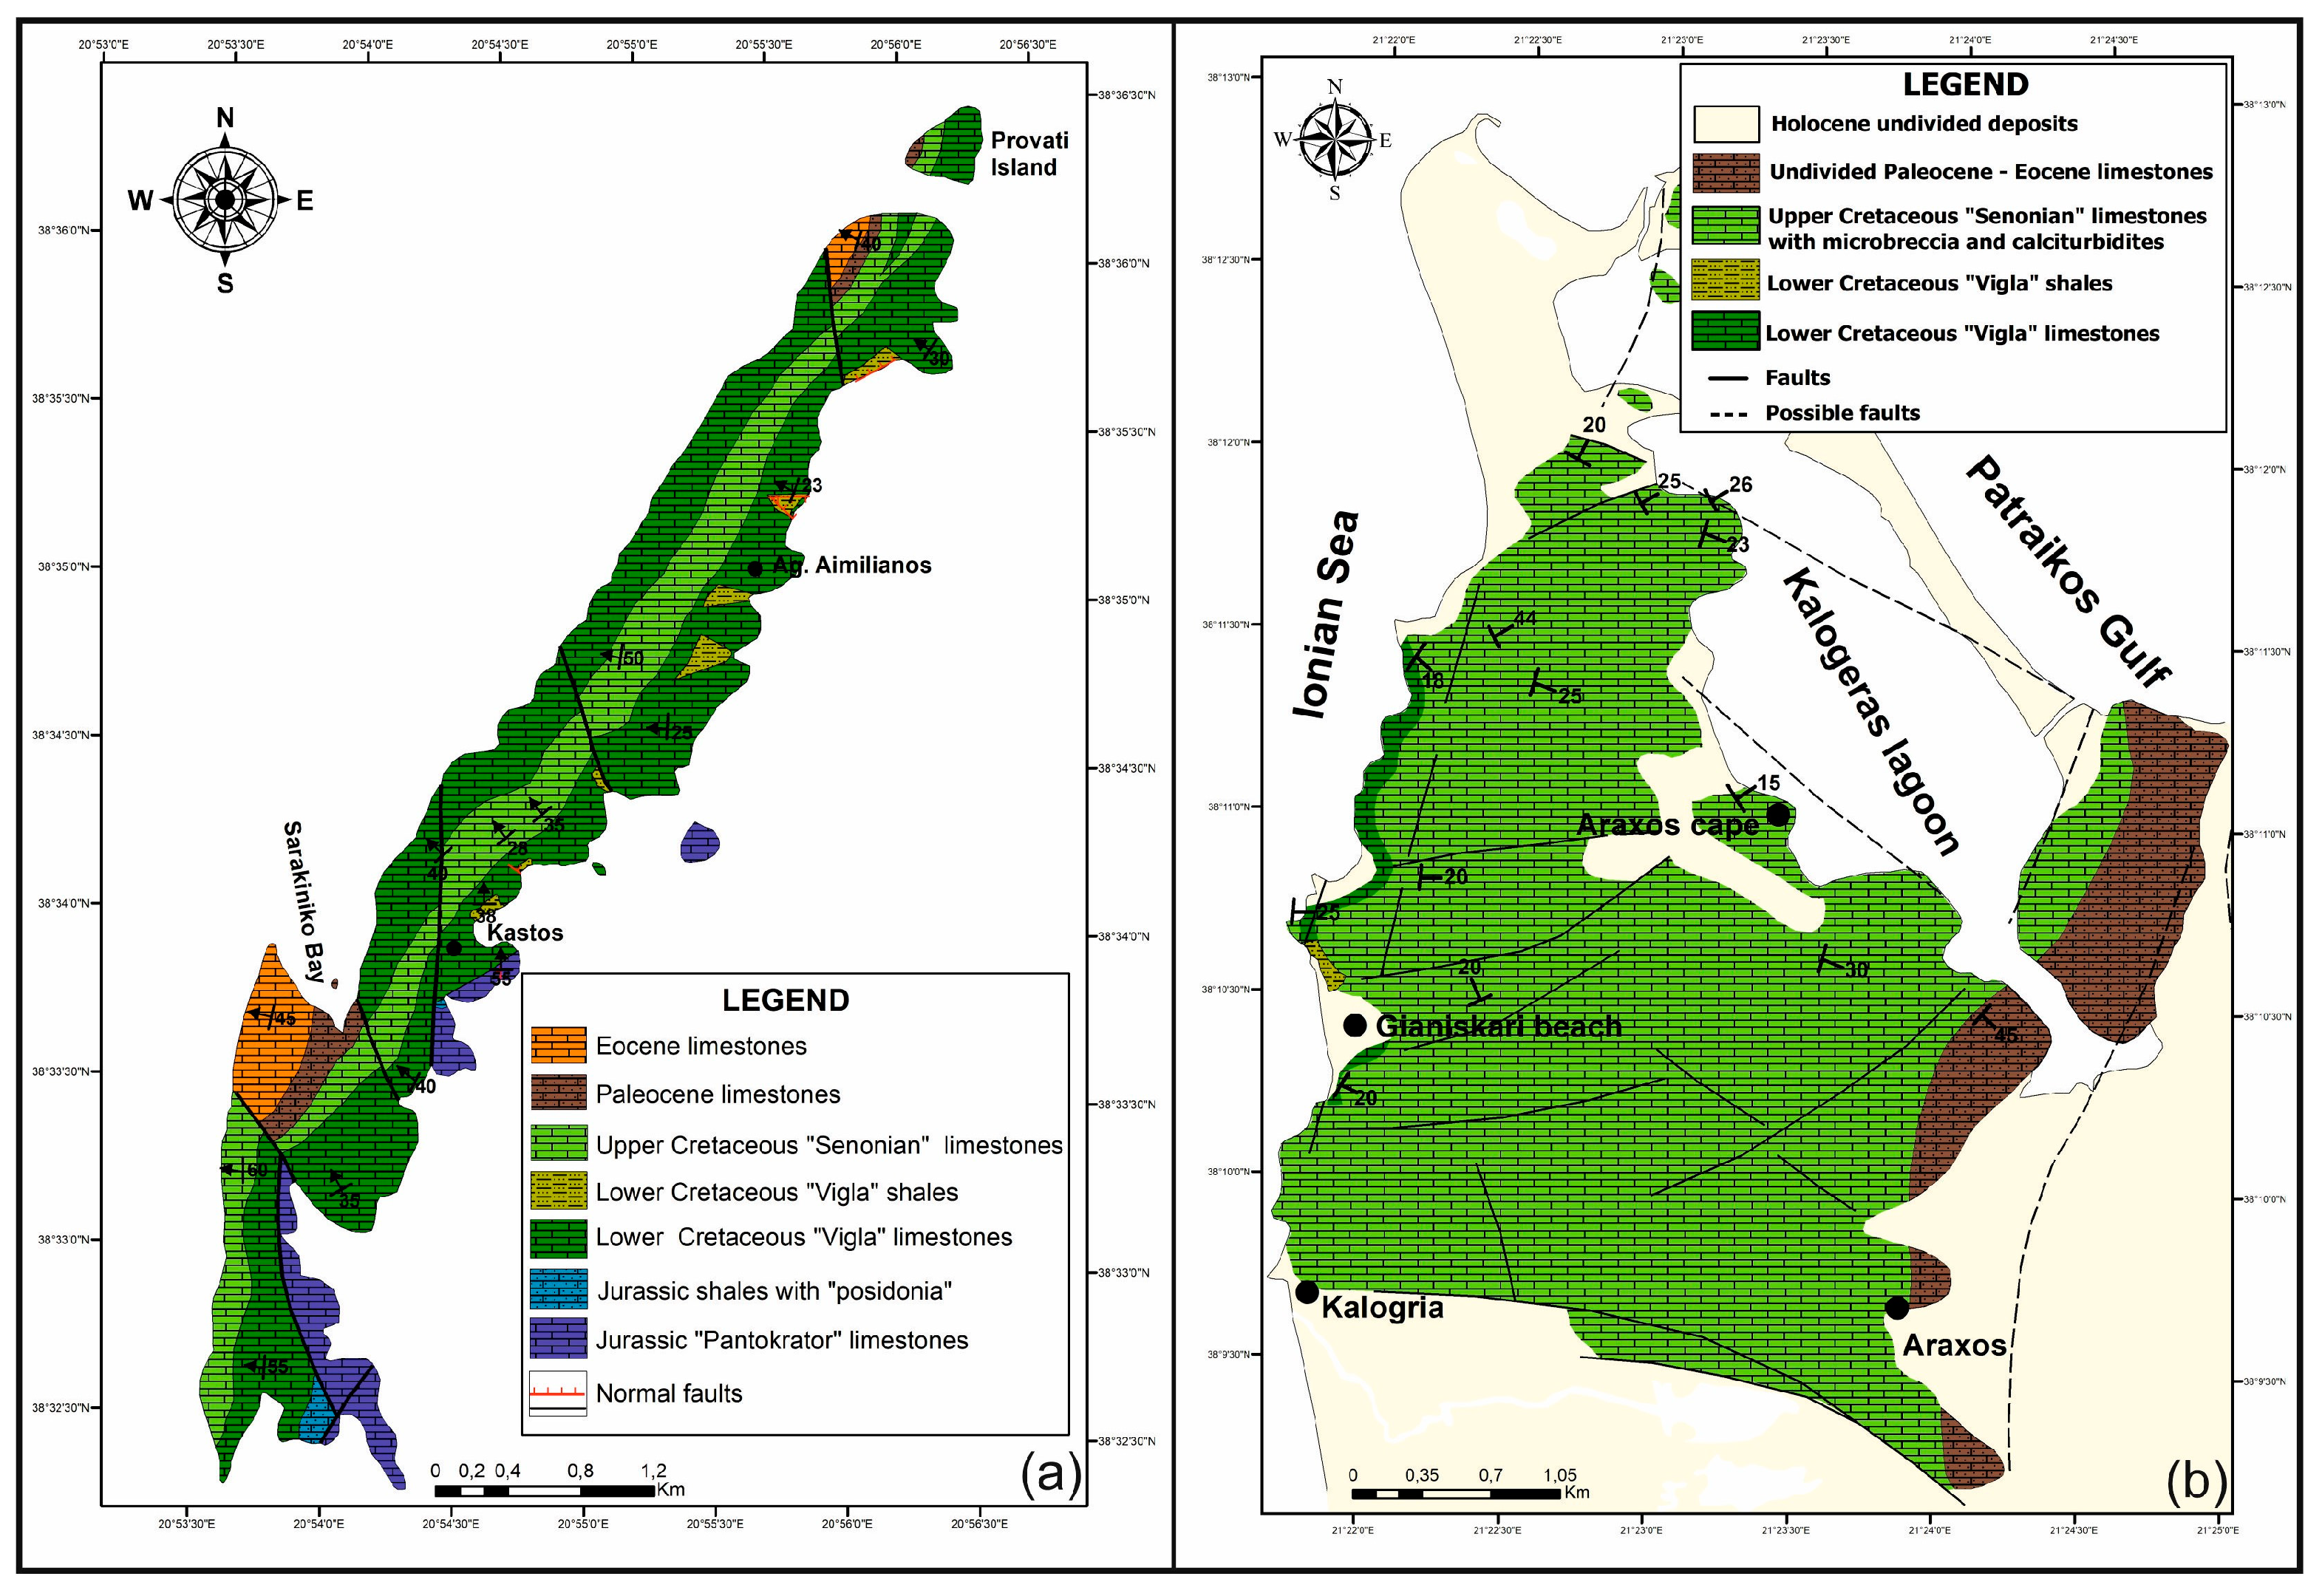
There were seventeen (17) samples of the Kastos Island and thirty-one (31) of the Araxos peninsula that were initially analyzed with the Rock-Eval VI geochemical analysis; then, those showing satisfactory total organic carbon values (TOC wt%) were selected for further analysis. The results of the analysis are presented in Table 1 and are characterized in relation to indicative values according to Peters and Cassa [
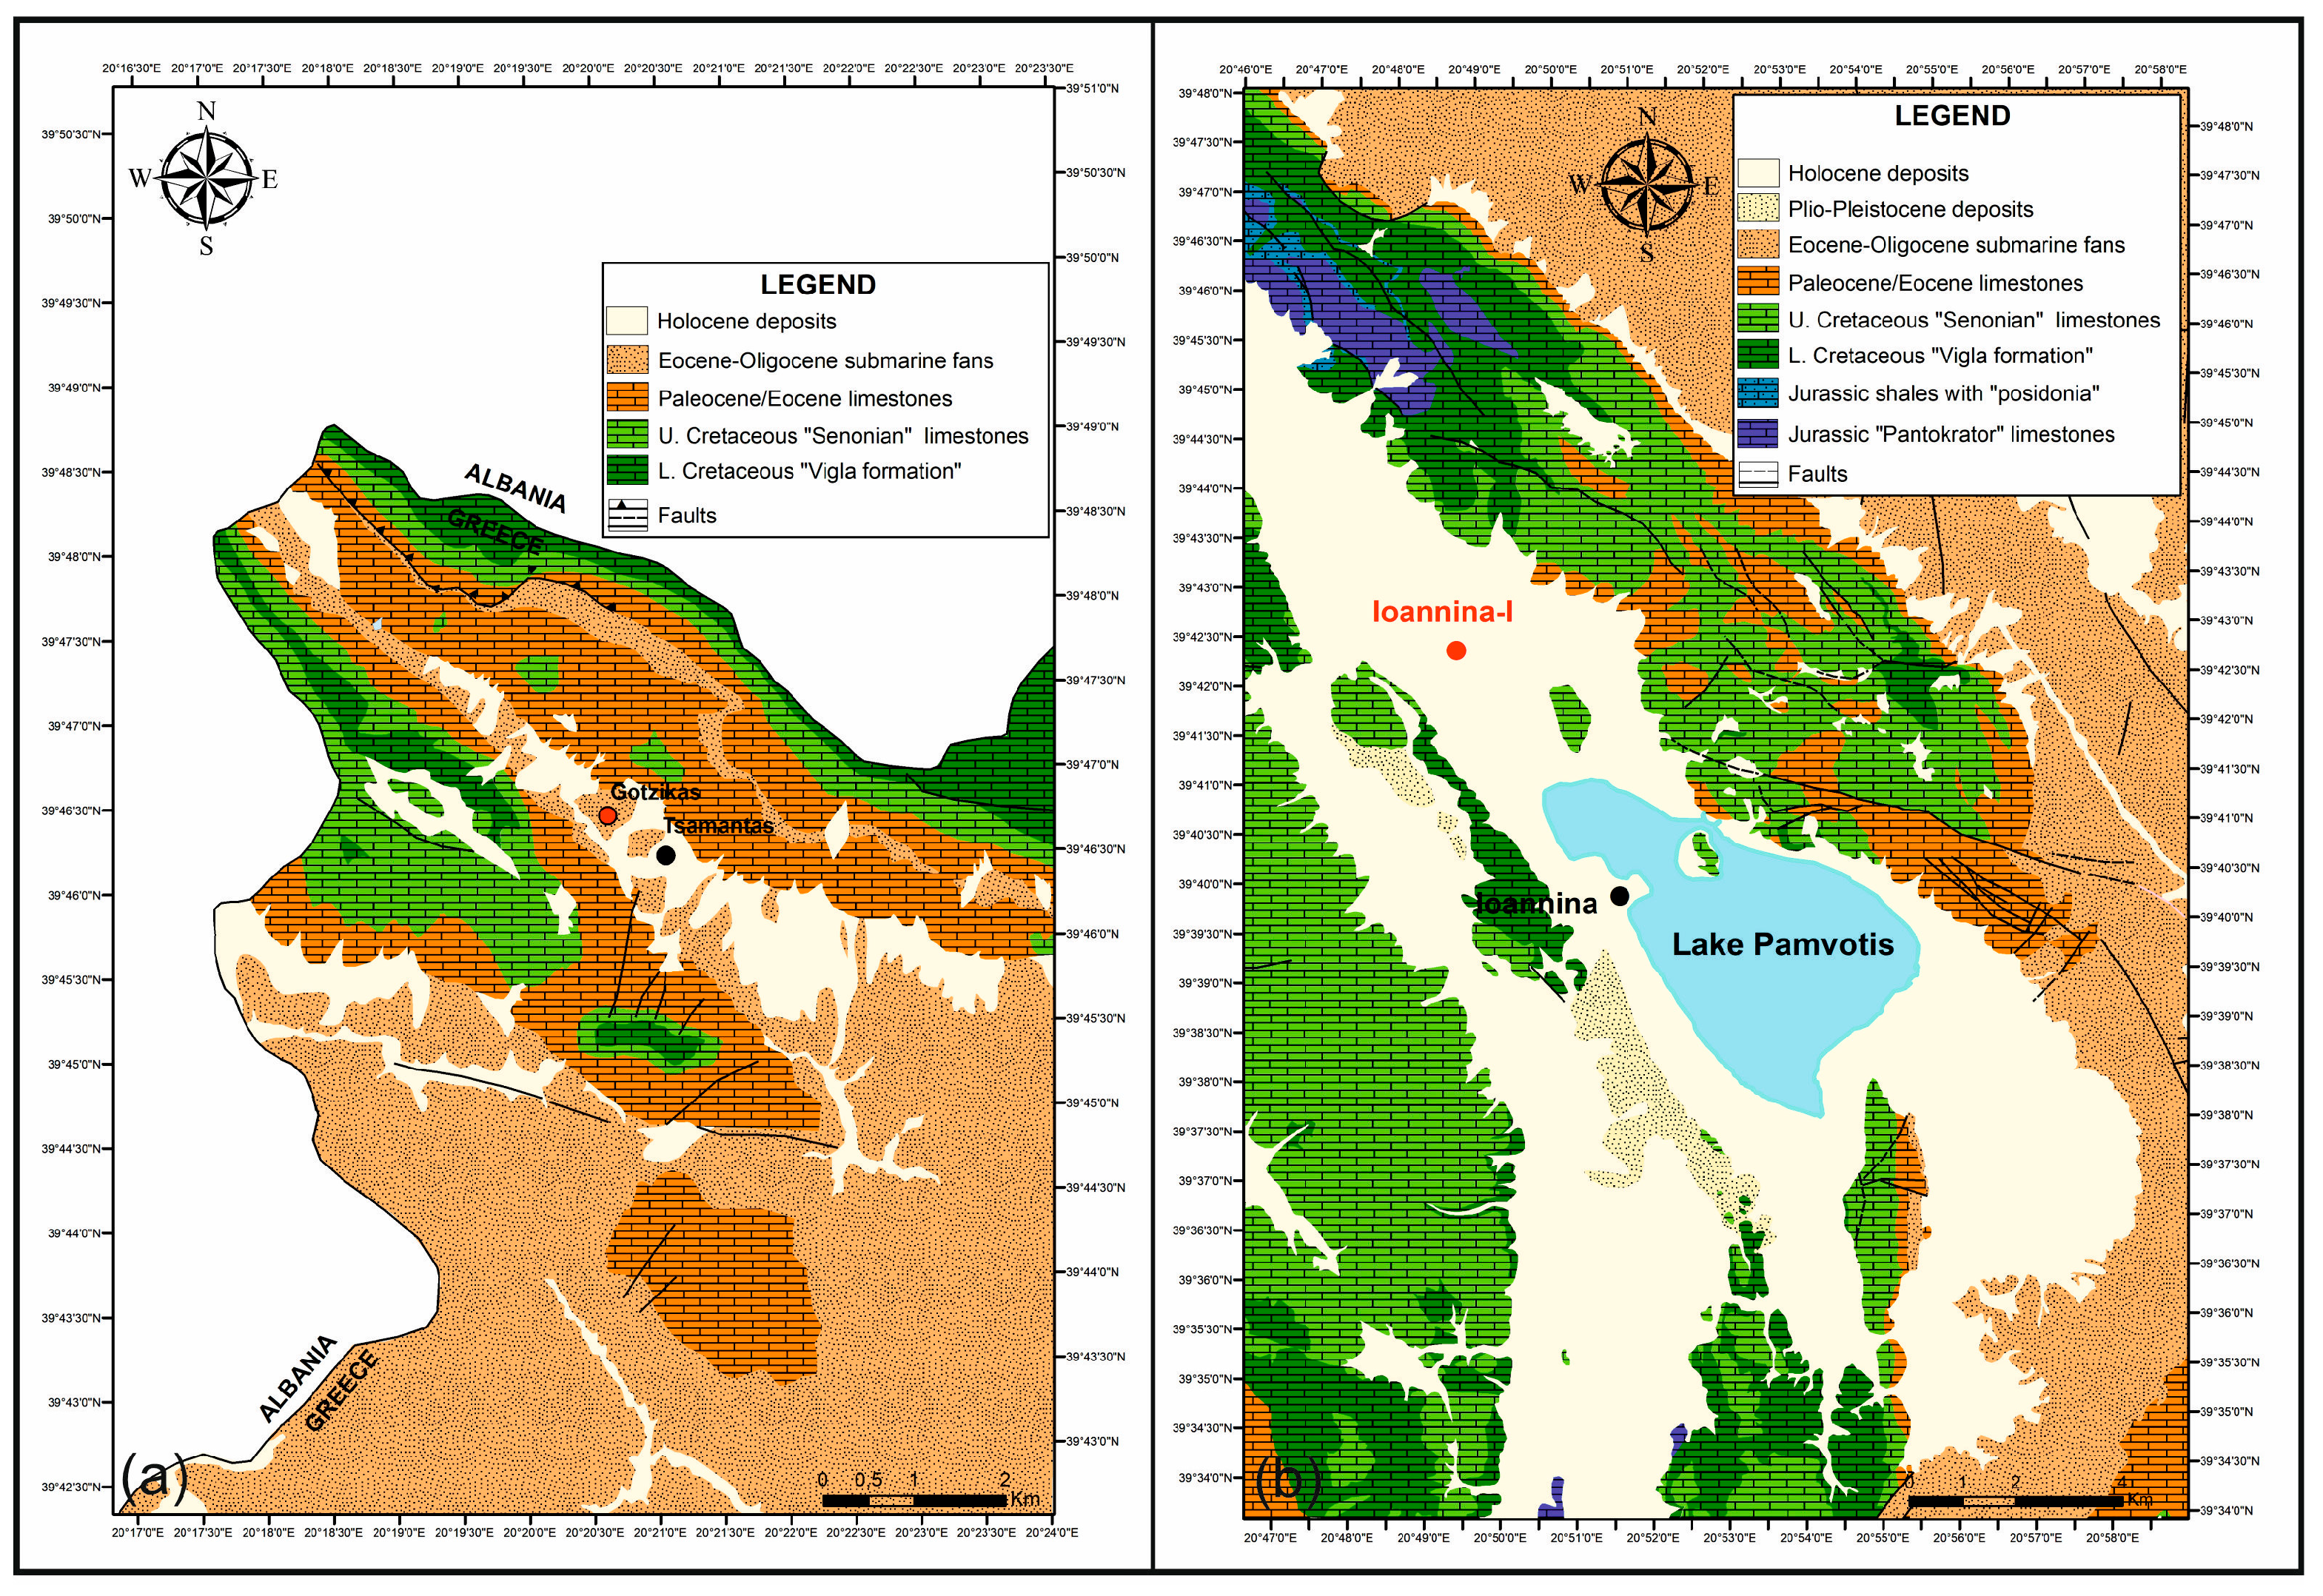
6]. In the same table, the pre-existing data were added from the Gotzikas section (Figure 6a) and the Ioannina well (Figure 6b) for comparison.
Tmax Index: For the Kastos Island, Tmax values less than 400 °C are not indicated. All other samples, as shown in Table 1, presented values less than 435 °C and, therefore, indicated thermally immature organic matter. For the Araxos peninsula, only three Tmax values were considered, and these presented values less than 372 °C and so are not indicated.
S1 Index: The samples of Kastos showed very small values of the S1 peak, smaller than the unit peaks and are, therefore, characterized as “poor” oil production potential. The sample AG1 showed the highest value (S1 = 0.08 mg/g), compared with the rest of the analyzed samples. In relation to the samples of Kastos Island, S1 values on the Araxos peninsula presented a mean less than 0.002 mg/g, and only a few of them ranged between 0.04 and 0.05 mg/g; thus, they are characterized by “poor” oil production potential.
S2 Index: In Kastos Island, according to the values of the peak S2, it seems that the samples AG1 and AG2 showed satisfactory values (5–10 mg/g), indicating “good” oil production potential. The samples AG5, AG6, and AG7 had “fair” production capacity, while the other samples showed almost zero values and are characterized as “poor”. In Araxos peninsula, all samples are characterized as “poor”, as S2 values were less than 0.12 mg/g.
S3 Index: Most samples for Kastos Island had mean values of peak S3 (1–3 mg/g), with the exception of sample AG13 (>4.5 mg/g), which showed a higher oxygen content, indicating the possible contribution of organic material of terrestrial origin. Samples in the Araxos peninsula, as in Kastos Island, presented mean values ranging between 0.2 and 0.6 mg/g of peak S3, with the exception of samples G11 and G12, which showed a higher oxygen content, indicating the possible contribution of organic material of terrestrial origin.
Total Organic Carbon (TOC): In Kastos Island, according to the values of total organic carbon, the values fluctuated from almost zero (sample AG9: TOC = 0.02 wt%) up to satisfactorily high values (sample AG1: TOC = 3.45 wt%). The samples AG1, AG2, and AG7 showed the highest values and signal “very good” oil potential. The values of samples AG5 and AG6 indicated “good” oil potential, while all the other values of the samples correspond to “poor” oil production potential. On the basis of the values of the TOC index, samples AG1, AG2, AG5, and AG6 were selected for further geochemical analysis. In the Araxos peninsula, according to the values of total organic carbon, the values fluctuated from almost zero (samples G26 and G28: TOC = 0.01 wt%) up to satisfactorily high values (sample G31: TOC = 0.72 wt%). The samples G7, G13, G15, G17, and G31 showed the highest values and signal “fair” oil potential.
S2/S3 Index: In Kastos Island, according to the values of the S2/S3 index, samples AG14, AG7, AG6, AG5, AG2, and AG1 showed values from 2 to 3.6, therefore indicating type III kerogen, capable of producing gaseous hydrocarbons. The remaining samples values were less than one, indicating type IV kerogen, which can produce neither liquid nor gaseous hydrocarbons. In the Araxos peninsula, according to the values of the S2/S3 index, all samples showed values less than 0.32, indicating type IV kerogen, which can produce neither liquid nor gaseous hydrocarbons.
Hydrogen Index (HI): Only for Kastos Island, as can be seen from the HI hydrogen index values of the analyzed samples, it is concluded that sample AG14 is characterized by type II kerogen, samples AG1, AG2, AG6, and AG7 by type II/III kerogen, and all other types of kerogen type III, producing mainly gaseous hydrocarbons. These values are in contrast to the determination of kerogen by the S2/S3 index and the Van Krevelen diagram.
Oxygen Index (OI): Only for Kastos Island, the samples showed values for the oxygen index ranging from 77 to 1126 mg CO2/g rock. The OI distribution, as the depositional depth increases, showed that there was a contribution of organic material with terrestrial origin for samples I1-AG10B and, at the same time, organic matter of marine origin for deeper samples (AG7-AG1).

4.2. Comparison of Recent Study Results with Previous Existing Results

The present work results, as described above, are compared with the pre-existing results from Rigakis and Karakitsios [33] and summarized in Table 1.
From this table, five diagrams were created showing the similarities and differences among different areas.
Diagram S2–TOC: Some samples from Kastos Island have “fair” to “good” petroleum potential and apparently contain type II/III kerogen, and they can produce liquid and gaseous hydrocarbons, while others have very low values of both indicators and are characterized by kerogen for dry gas production. Samples from the Araxos peninsula present a “poor” petroleum potential, whereas samples from Gotzikas and the Ioannina well contain type II kerogen (Figure 7a).
Diagram S1+S2–TOC: Used to characterize source rocks. As shown below, the samples of Kastos Island consist of samples that show “poor” hydrocarbon production potential as well as samples that show “good” oil potential (AG1, AG2, AG5, AG6, and AG7), whereas from Araxos peninsula, only three samples present “poor” to “fair” oil potential. Samples from Gotzikas and the Ioannina well show “good” hydrocarbon potential (Figure 7b).
Diagram HI–Tmax: Characterizes the thermal maturity of organic matter and its type. For the Kastos Island samples, shown in the following Figure 7c, the contained organic matter is thermally immature, and the type of kerogen is type II/III, whereas samples from Gotzikas and the Ioannina well are also characterized as thermally immature, but the type of kerogen is type I/II.
Diagram HI–TOC: Used for the characterization of the source rocks. Samples of Kastos island could be characterized as “poor” to “fair” in oil potential, whereas for the Araxos peninsula, they are characterized as “very poor”. Gotzikas samples range from gas and oil sources and represent an excellent oil source, whereas Ioannina samples belong mostly to good oil sources (Figure 7d).
Van Krevelen diagram (HI–OI): Used to characterize the kerogen type. As shown in Figure 7e, the samples of Kastos Island contain mainly type II/III kerogen with the ability to produce liquid and gaseous hydrocarbons. The Araxos peninsula samples contain type IV kerogen with neither liquid nor gaseous hydrocarbons. Gotzikas samples contain type I/II and Ioannina samples mostly type I kerogen, with the ability to produce liquid hydrocarbons.

4.3. Results of Extraction Soxhlet for Present Work Studied Samples

As already mentioned, according to the results of the Rock-Eval VI analysis, the samples AG1, AG2, AG5, and AG6 were selected for the continuation of the analyses and, finally, the determination of the biomarkers. These samples were then analyzed by Soxhlet extraction to calculate the bitumen (extract). The results are presented in Table 2.
According to the results of the experimental extraction process with the Soxhlet technique, the samples contain small amounts of bitumen and are characterized as “poor” in petroleum potential, according to the standard values of Peters and Cassa [6] (Figure 8).
Specifically, as shown in Figure 8, the samples contain quantities of bitumen of less than 500 ppm, so they are characterized as “poor”, which is relatively consistent with the results of peaks S1 and S2 of Rock-Eval cracking to characterize the thermal maturity of the organic matter. The following table was created with the values of the resulting bituminous to the total organic carbon.
For the characterization of the thermal maturity of the organic matter, the following Table 3 was created with the values of the resulting ratio of bitumen to total organic carbon.
All values of this ratio are less than 0.05, characterizing thermally immature organic matter, a fact that is confirmed by the results of the Rock-Eval analysis and, specifically, the Tmax index.
During the extraction process, copper sheets were introduced into the beaker to capture the elemental sulfur. The samples AG1 and AG2 seem to have a small number of sulfides, while the samples AG5 and AG6 show a greater change in the copper sheets, so they contain a larger amount of elemental sulfur, indicating a lagoonal depositional environment.
Asphalting Results: According to the results of the asphalting and their graphic representation, it appears that all the samples contain higher amounts of asphaltenes (60.26–66.38%) than maltenes (33.62–39.74%) (Table 4). This fact confirms the thermal immaturity of the organic matter of the samples, as evidenced by the results of the Rock-Eval analysis.
Results of Liquid Chromatography: The results of maltene fraction were analyzed by liquid chromatography to separate it into a saturated hydrocarbon, aromatic, and resin fraction, as shown in Table 5 below.
These results were used to construct the following diagram, which shows how all samples exhibit a predominance of the different source components fractions (resins). The high resin content of samples confirms the thermal immaturity of the organic matter, as already demonstrated by both Rock-Eval VI (Tmax) analysis and extraction (bitumen/TOC).
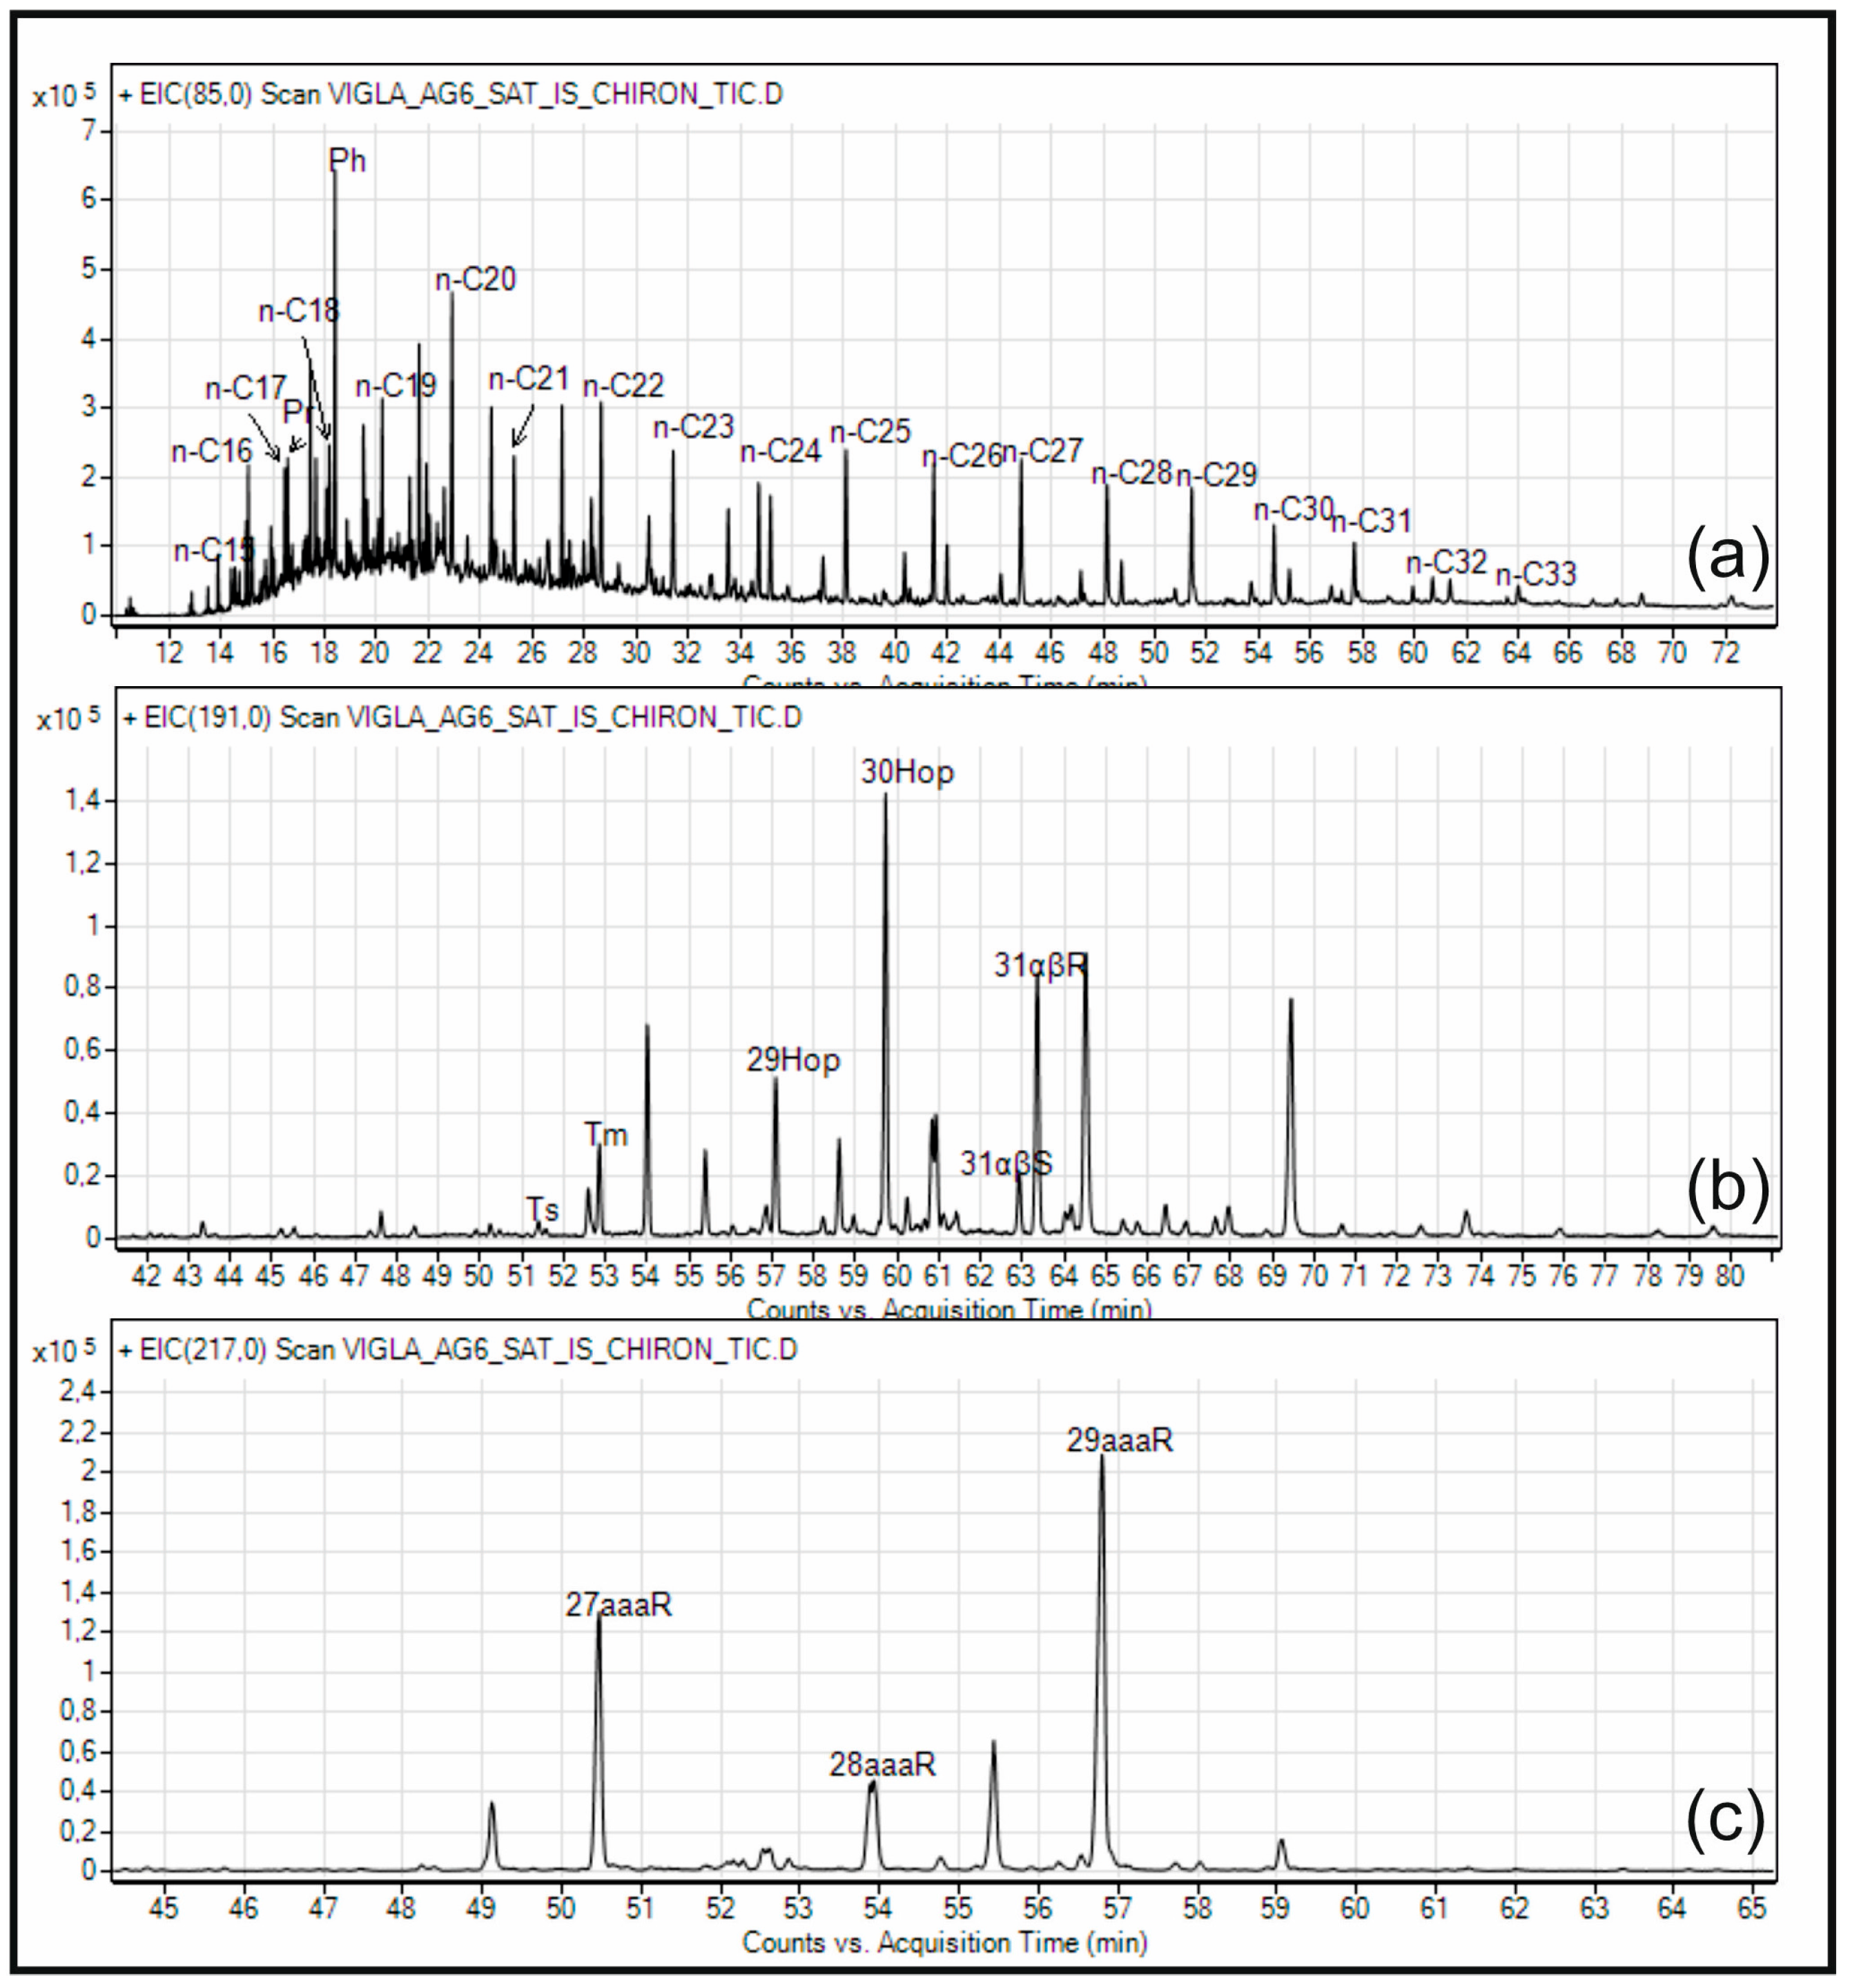
Results of Gas Chromatography–Mass Spectroscopy: Table 6 shows the concentrations of n-alkanes for all analyzed samples in ppm to calculate k-alkane geochemical indices, where it is possible, whereas Figure 9 shows a representative distribution of n-alkanes from sample AG6.
According to Table 7, diagrams were constructed showing the distributions of n-alkane concentrations for each analyzed sample (Figure 10).
According to the diagrams of the distributions of n-alkanes, the predominance of light hydrocarbons is observed mainly in the samples AG1 and AG2, (high concentrations of C16–C21), while heaviest hydrocarbons appear in the samples AG5 and AG6 (C25–C35). Therefore, the marine origin of the organic matter of the samples AG1 and AG2 is indicated, while for the other samples (AG5 and AG6), it seems that the origin is marine with land contribution. Samples showing predominance of n-alkanes with carbon atoms <C25 (samples AG1 and AG2) are attributed to bacteria or algae [27], while long-chain n-alkanes (samples AG5 and AG6) are attributed as surface of terrestrial plants [34].
In addition, a particularly high concentration of phytane is observed in all samples of the area, indicating the strong reducing character of the environment of genesis of organic matter.
In addition, there is a relative superiority in all samples of the chains, with an excessive number of carbon atoms, which signals the existence of hydrocarbons derived from terrestrial plants or from transformations of alcohols, esters, and fatty acids in the early generation. Finally, this existence of the predominance of excess carbon atoms indicates thermal immaturity of the analyzed samples, which is consistent with the results of previous analyses.
The Pr/Ph ratio takes values less than 0.8 for all samples, which leads to the conclusion that it is a reductive–anoxic deposit environment or a high salinity environment. This indicator does not indicate clay and silicate rocks, but possibly carbonate source rocks, which is consistent with the geology of the study area.
The Pr/nC17 and Ph/nC18 indices are used to determine the thermal maturity of the organic material and the deposition environment [35]. As can be seen from the diagram of the indices, the samples show values higher than one unit and, therefore, can characterize the organic material as thermally immature, with a contribution of terrestrial origin (mainly for sample AG6).
The values of CPI and CPI (1) range from 1.11 to 1.42; therefore, it is a thermally immature organic material, which could indicate the origin of coastal sediments or the existence of clayey rocks. Values close to unit value, signify organic matter contributed by marine plants (plankton) or the absence of terrestrial material [34].
The OEP (27–31), OEP (2), and OEP (1) (Odd–Even predominance) values for samples AG1, AG2 AG5, and AG6 are close to unit value and indicate an anoxic deposition environment. Thus, the conclusions of the previous geochemical analyzes are confirmed, through which an anoxic environment of deposition of organic matter is also obtained.
The index nC24+/nC24− is the ratio of heavy to light hydrocarbons, while the index nC19/nC31 is the ratio of light to heavy hydrocarbons. The AG1 sample shows higher values of light hydrocarbons, a fact that testifies to the marine origin of the organic matter [34]. Samples AG2, AG5, and AG6 show slightly higher values of heavy hydrocarbons, signaling the possible terrestrial contribution to the origin of organic material.
Hopanes Index: Table 8 presents the calculated geochemical indices of coppice of the samples of Kastos island.
Sterane Indices: The geochemical indices counted according to the results of gas chromatography (Table 9).
Almost all geochemical indicators of steranes have zero values, and, therefore, no interpretations can be drawn from them. In all the samples, high values appear in the components C27aaR, C28aaR, and CC29aaR. In the immature sediments, the stereochemistry of the precursor biological molecules (sterols) prevails, with the result that the structure 5a (H), 14a (H), 17a (H) -20R dominates in relation to the structure 5a (H), 14a (H), 17α (H) -20S. Thus, we conclude that the analyzed samples are thermally immature [36].
Finally, the structure and distribution of steranes are influenced by the process of biodegradation in sediments. The result of this process is the reduction of the 20R in relation to the 20S in normal landfills [36]. The results of this process are, therefore, not apparent in the analyzed samples, so this biological activity has not yet taken place.

5. Discussion

In the description of Lower Cretaceous “Vigla” shales and of the proposed published works [13,37], it seems that the thickness of “Vigla” shales ranges from 0 to 100 m due to the accumulation into asymmetrical subsided troughs, so it could be different organic carbon accumulation along and across the above asymmetrical troughs. In both studied areas, the thickest “Vigla” shales accumulations are very close to the meeting point between normal and transfer faults.
Yellow marly or shaly limestones and shales with chert intercalations as well as red to green or locally black clay layers compose “Vigla” shales. The latter contents could be equivalent to the anoxic events of Selli (OAE1a) during the Aptian–Albian, Paquier Evet (OAE1b) of Early Albian age in the Ionian zone and extends to Italy and Albania. Geochemical analysis of Lower Cretaceous “Vigla” shales in both studied areas, Kastos Island and the Araxos peninsula (Gianiskari coast), and the results based on the Odd–Even Predominance, OEP (27–31), OEP (2), and OEP (1), valued for samples AG1, AG2, AG5, and AG6, indicate an anoxic deposition environment.
The great difference in geochemical indices between the two studied areas during the same period indicates that it is likely that different depositional conditions existed. It seems that the richness in Kastos Island (external Ionian sub-basin) and the poorness in the Araxos peninsula (internal Ionian sub-basin) could be related to the neighboring platforms, suggesting the Apulian platform as a rich organic platform source for the Ionian Basin and the Gavrovo platform as a poor organic platform. Additionally, these two studied areas likely are not connected to each other due to the existing intrabasinal highs that developed during the syn-rift stage because there are no transfer faults to act as pathways to connect them.
Although sedimentation in “Vigla” shales has been interpreted as pelagic, and basin configuration was influenced by synthetic and antithetic normal faults, it seems that the presence of few samples in both areas showing terrestrial input during sedimentation could be related to the neighboring platforms.
In other studied areas (e.g., Epirus region, according to Karakitsios and Rigakis [38], for middle and internal Ionian sub-basins), it seems that the geochemical conditions are quite different, showing and suggesting that “Vigla” shales could be very interesting source rocks.
The above difference either within the Epirus region (internal and middle Ionian sub-basins) or between the two studied areas (internal and external Ionian sub-basins) could be related to different tectonic activity that influenced depositional conditions in these two regions, as also highlighted by Bourli et al. [37], studying the siliceous concretions in Kastos Island and the Araxos peninsula (Figure 11).
It seems that the great differences internal to the same sub-basin (Ioannina region vs. the Araxos Peninsula that belongs to the internal Ionian sub-basin) and between different sub-basins (the Araxos peninsula from internal Ionian sub-basin and Kastos Island from external Ionian sub-basin) could be related with the presence and/or activity of transfer faults. The Ionian Basin is cross-cut by several transfer faults, such as Ag. Kyriaki, Alevrada, and Amvrakikos transfer faults (see Figure 1 for the location of transfer faults), producing restrictions from one region to the other (Figure 11).

Hydrocarbon Prospectivity

Microfacies analysis in Kastos Island as well as in Ithaca Island, both situated in the external Ionian sub-basin, showed that there were stable deep-water conditions during the Cretaceous period [39]. Kastos Island is situated in the central part of the sub-basin, whereas the study of calciturbidites from Ithaca Island suggest the existence of a platform very close to the studied region. Therefore, it seems that during the compressional regime, and because the normal fault reactivated as thrust faults, sediments of the major external sub-basin moved over the pre-existing platform to the west. From the above, it seems that the best areas that could act as hydrocarbon plays are situated at or under the Ionian thrust, considering that the Mesozoic Platform is covered by Triassic evaporites, which acted as a décollement surface, and offers an excellent silling.
On the other hand, as the depositional conditions for the Araxos peninsula indicated a proximity to a platform (due to breccia, rudist fossils, and calciturbidites), the same scenario, as for Kastos Island, is also suggested for the internal Ionian sub-basin. In this case, the internal Ionian thrust produced the movement of the major internal Ionian sub-basin over the pre-existing platform to the west, offering in the same way an excellent silling condition.
The greatest question, after the above-discussed properties, has appeared around the quality of source rocks. As presented above, there is a great difference in source quality both internally to a sub-basin (Ioannina and Araxos Peninsula) and from one sub-basin to the other (Kastos Island and Gotzikas area vs. the Araxos Peninsula). It seems that the above differences could be related to their position within different sub-basins of sedimentation and the connection either between different sub-basins or internally to the same sub-basin. Therefore, and independently of the previous results or the results of the present study, oil companies must search for the source quality and quantity in the entire Ionian Basin, both internally to the same sub-basin and from one sub-basin to the other.
Moreover, in searching for “Vigla” shales maturity, we must take into account that the studied samples were never buried enough in order to be mature. In other areas, “Vigla” shales are now situated in great depths, and so they could be mature due to the compressional regime from Eocene to Miocene that produced the Pindos Foreland. The pre-existing normal faults were reactivated as thrust faults or the transfer faults as strike-slip faults, influencing basin configuration and, thus, maturity of source rocks.

6. Conclusions

Geochemical analysis performed only for “Vigla” shales, as these had been suggested in the literature as one of the main source rocks for the Ionian Basin, showed that the studied rocks could be of low production capacity, at least in the studied area. Studied samples showed that type II/III of kerogen can produce liquid and gas hydrocarbons. Organic matter of studied samples is thermally immature, in the early stages of diagenesis. Moreover, “Vigla” shales were accumulated in an anoxic environment, and the geochemical analyses confirms the combination of marine and terrestrial origin of the organic matter.
As the Ionian sub-basin was sub-divided into three sub-basins (internal, middle, and external) during its syn-rift evolution, different depositional conditions were suggested from one sub-basin to the other, with different sedimentary thicknesses within the same sub-basin or between different sub-basins, with different amounts of TOC. The recognized differences internally to the same sub-basins were related mostly to restrictions produced from the activity of transfer faults during sedimentations disconnecting the free flows between regions. Comparison with previous studies indicate that different quality and quantity of organic matter could be accumulated either within the same sub-basin or from one sub-basin to the other.
Finally, “Vigla” shales are suggested as source rocks, but further work is needed from oil companies to determine in which part of each sub-basin the accumulation of TOC was sufficient to act as source rock.

Author Contributions

Conceptualization, N.B., N.P. and A.Z.; methodology, N.P. and E.C.; software, N.B. and M.S.; formal analysis, N.B.; investigation, N.B. and A.Z.; resources, N.P. and E.C.; data curation, N.B., N.P. and M.S.; writing—original draft preparation, N.B.; writing—review and editing, N.B. and A.Z.; supervision, A.Z. All authors have read and agreed to the published version of the manuscript.

Funding

This research received no external funding.

Data Availability Statement

All used data sets in this work are enclosed in presented tables (48 samples are from this work and 14 from a previously published work [38]). There is no supplementary material. Part of the available data sets were analyzed in this study and are available in a publicly accessible repository that does not issue DOIs Publicly.

Acknowledgments

Nicolina Bourli would like to thank “Andreas Mentzelopoulos Scholarships of University of Patras” for their support. Without their support, it would be difficult to complete her doctoral thesis.

Conflicts of Interest

The authors declare no conflict of interest.

References

  1. Barker, C. Pyrolysis techniques for source rock evaluation. AAPG Bull. 1974, 58, 2349–2361. [Google Scholar] [CrossRef]
  2. Claypool, G.E.; Reed, P.R. Thermal analysis techniquefor source rock evaluation: Quantitative estimate of organicrichness and effects of lithologic variation. AAPG Bull. 1976, 60, 608–626. [Google Scholar] [CrossRef]
  3. Espitalié, J.; Laporte, J.L.; Madec, M.; Marquis, F.; Leplat, P.; Paulet, J.; Boutefeu, A. Méthode rapide de caractérisation des roches métres, de leur potentiel pétrolier et de leur degree d’évolution. Rev. Inst. Fr. Pét. 1977, 32, 23–42. [Google Scholar] [CrossRef]
  4. Clementz, D.M.; Demaison, G.J.; Daly, A.R. Well site geochemistry by programmed pyrolysis. In Proceedings of the 11th Annual Offshore Technology Conference, OTC 3410, Houston, TX, USA, 30 April–3 May 1979; Volume 3, pp. 465–469. [Google Scholar] [CrossRef]
  5. Horsfield, B. Pyrolysis studies in petroleum exploration. In Advances in Petroleum Geochemistry; Brooks, J., Welte, D., Eds.; Academic Press: New York, NY, USA, 1985; Volume 1, pp. 247–298. [Google Scholar]
  6. Peters, K.E.; Cassa, M.R. Applied source rock geochemistry. In The Petroleum System-From Source to Trap; AAPG Memoir; Magoon, L.B., Dow, W.G., Eds.; American Association of Petroleum Geologists: Tulsa, OK, USA, 1994. [Google Scholar]
  7. Peters, K.E. Guidelines for evaluating petroleum source rock using programmed pyrolysis. AAPG Bull. 1986, 70, 318–329. [Google Scholar]
  8. Colacicchi, R.; Baldanza, A. Carbonate turbidites in a Mesozoic pelagic basin: Scaglia formation, Apennines comparison with siliciclastic depositional models. Sediment. Geol. 1986, 48, 81–105. [Google Scholar] [CrossRef]
  9. Cazzini, F.; Dal Zotto, O.; Fantoni, R.; Ghielmi, M.; Ronchi, P.; Scotti, P. Oil and gas in the Adriatic foreland, Italy. J. Pet. Geol. 2015, 38, 255–279. [Google Scholar] [CrossRef]
  10. Zelilidis, A.; Maravelis, A.G.; Tserolas, P.; Konstantopoulos, P.A. An overview of the petroleum systems in the Ionian Zone, onshore NW Greece and Albania. J. Pet. Geol. 2015, 38, 331–348. [Google Scholar] [CrossRef]
  11. Karakitsios, V. The influence of pre-existing structure and halokinesis on organic matter preservation and thrust system evolution in the Ionian basin, northwestern Greece. AAPG Bull. 1995, 79, 960–980. [Google Scholar]
  12. Karakitsios, V. Western Greece and Ionian Petroleum systems. AAPG Bull. 2013, 97, 1567–1595. [Google Scholar] [CrossRef] [Green Version]
  13. Bourli, N.; Pantopoulos, G.; Maravelis, A.G.; Zoumpoulis, E.; Iliopoulos, G.; Pomoni-Papaioannou, F.; Kostopoulou, S.; Zelilidis, A. Late Cretaceous to Early Eocene geological history of the eastern Ionian Basin, southwestern Greece: An integrated sedimentological and bed thickness statistics analysis. Cretac. Res. 2019, 98, 47–71. [Google Scholar] [CrossRef]
  14. IGSR; IFP; Institute for Geology Subsurface Research of Greece and Institut Francais de Petrole. Etude geologique de l’ Epire; Technip: Paris, France, 1996; p. 306. [Google Scholar]
  15. Leigh, S.; Hartley, A.J. Mega-debris flow deposits from the Oligo-Miocene Pindos foreland basin, western mainland Greece: Implication for transport mechanisms in ancient deep marine basins. Sedimentology 1992, 39, 1003–1012. [Google Scholar] [CrossRef]
  16. Avramidis, P.; Zelilidis, A.; Vakalas, I.; Kontopoulos, N. Interaction between tectonic activity and eustatic sea-level changes in the Pindos and Mesohellenic Basins, NW Greece: Basin evolution and hydrocarbon potential. J. Pet. Geol. 2002, 25, 53–82. [Google Scholar] [CrossRef]
  17. Van Geet, M.; Swennen, R.; Durmishi, C.; Roure, F.; Muchez, P. Paragenesis of Cretaceous to Eocene carbonate reservoirs in the Ionian fold and thrust belt (Albania): Relation between tectonism and fluid flow. Sedimentology 2002, 49, 696–718. [Google Scholar] [CrossRef]
  18. Cazzola, C.; Soudet, H.J. Facies and Reservoir Characterization of Cretaceous-Eocene Turbidites in the Northern Adriatic. In Generation, Accumulation and Production of Europe’s Hydrocarbons III; Special Publication of the European Association of Petroleum Geoscientists; Spencer, A.M., Ed.; Springer: Berlin/Heidelberg, Germany, 1993. [Google Scholar] [CrossRef]
  19. Avramidis, P.; Zelilidis, A. The nature of deep-marine sedimentation and palaeocurrent trends as an evidence of Pindos foreland basin fill conditions. Episodes 2001, 24, 252–256. [Google Scholar] [CrossRef] [PubMed] [Green Version]
  20. Konstantopoulos, P.; Maravelis, A.; Zelilidis, A. The implication of transfer faults in foreland basin evolution: Application on Pindos Foreland Basin, West Peloponnesus, Greece. Terra Nova 2013, 25, 323–336. [Google Scholar] [CrossRef]
  21. Zelilidis, A.; Papatheodorou, G.; Maravelis, A.G.; Christodoulou, D.; Tserolas, P.; Fakiris, E.; Dimas, X.; Georgiou, N.; Ferentinos, G. Interplay of thrust, backthrust, strike-slip and salt tectonics in a fold and thrust belt system: An example from Zakynthos Island, Greece. Int. J. Earth Sci. 2016, 105, 2111–2132. [Google Scholar] [CrossRef]
  22. Velaj, T.; Davison, I.; Serjani, A.; Alsop, I. Thrust tectonics and the role of evaporites in the Ionian zone of the Albanides. AAPG Bull. 1999, 83, 1408–1425. [Google Scholar]
  23. Le Goff, J.; Cerepi, A.; Swennen, R.; Loisy, C.; Caron, M.; Muska, K.; El Desouky, H. Contribution to the understanding of the Ionain basin sedimentary evolution along the eastern edge of Apulia during the late Cretaceous in Albania. Sediment. Geol. 2015, 317, 87–101. [Google Scholar] [CrossRef] [Green Version]
  24. Bosellini, A.; Morsilli, M.; Neri, C. Long-term event stratigraphy of the Apulia Platform margin (Upper Jurassic to Eocene, Gargano, southern Italy). J. Sediment. Res. 1999, 69, 1241–1252. [Google Scholar] [CrossRef]
  25. Hairabian, A.; Borgomano, J.; Masse, J.P.; Nardon, S. 3-D stratigraphic architecture, sedimentary processes and controlling factors of Cretaceous deepwater resedimented carbonates (Gargano Peninsula, SE Italy). Sediment. Geol. 2017, 317, 116–136. [Google Scholar] [CrossRef]
  26. Morsilli, M.; Hairabian, A.; Borgomano, J.; Nardon, S.; Adams, E.; Branco Gartner, G. The Apulia carbonate Platform-Gargano promontory, Italy (upper Jurassic-Eocene). AAPG Bull. 2017, 101, 523–531. [Google Scholar] [CrossRef]
  27. Tissot, B.P.; Welte, D.H. Petroleum Formation and Occurence, 2nd ed.; Springer: Berlin, Germnay, 1984. [Google Scholar]
  28. Burwood, R.; De Witte, S.M.; Mycke, B.; Paulet, J. Petroleum geochemical characterization of the lower Congo Coastal Basin Bucomazi formation. In Petroleum Source Rocks; Katz, B.J., Ed.; Springer: Berlin, Germnay, 1995; pp. 235–263. [Google Scholar] [CrossRef]
  29. Dymann, T.S.; Palacas, J.G.; Tysdal, R.G.; Perry, W.J., Jr.; Pawlewicz, M.J. Source rock potential of middle cretaceous rocks in southwestern Montana. AAPG Bull. 1996, 80, 1177–1183. [Google Scholar] [CrossRef]
  30. Hunt, J.M. Petroleum Geochemistry and Geology; W.H. Freeman and Company: New York, NY, USA, 1996; p. 332. [Google Scholar]
  31. Tyson, R.V. Sedimentary Organic Matter: Organic Facies and Palynofacies; Chapman and Hall: London, UK, 1995; p. 615. [Google Scholar] [CrossRef]
  32. Jones, R.W. Comparison of carbonate and shale source rocks. AAPG Bull. 1984, 68, 163–180. [Google Scholar]
  33. Rigakis, N.; Karakitsios, V. The source rock horizons of the Ionian Basin (NW Greece). Mar. Pet. Geol. 1998, 15, 593–617. [Google Scholar] [CrossRef]
  34. Peters, K.E.; Walters, C.C.; Moldowan, J.M. Biomarkers and Isotopes in the Environment and Human History and Biomarkers and Isotopes in Petroleum Exploration and Earth History. In The Biomarker Guide, 2nd ed.; Cambridge University Press: New York, NY, USA, 2005; Volumes 1–2. [Google Scholar] [CrossRef]
  35. Hunt, M. Petroleum Geochemistry and Geology, 2nd ed.; W.H. Freeman: New York, NY, USA, 1995; p. 743. [Google Scholar]
  36. Pasadakis, N. Petroleum Geochemistry; Publication Tziola: Thessaloniki, Greece, 2015. [Google Scholar]
  37. Bourli, N.; Kokkaliari, M.; Iliopoulos, I.; Pe-Piper, G.; Piper, D.J.W.; Maravelis, A.G.; Zelilidis, A. Mineralogy of siliceous concretions, Cretaceous of Ionian zone, western Greece: Implication for diagenesis and porosity. Mar. Pet. Geol. 2019, 105, 45–63. [Google Scholar] [CrossRef]
  38. Karakitsios, V.; Rigakis, N. Evolution and petroleum potential of Western Greece. J. Pet. Geol. 2007, 30, 197–218. [Google Scholar] [CrossRef]
  39. Bourli, N.; Iliopoulos, G.; Paparopoulou, P.; Zelilidis, A. Microfacies and Depositional conditions of Jurassic to Eocene Carbonates: Implication on Ionian Basin Evolution. Geosciences 2021, 11, 288. [Google Scholar] [CrossRef]
Figure 1. Geological map of the external Hellenides in NW Greece illustrating the principal tectonostratigraphic zones: Pindos, Gavrovo, Ionian, and Pre-Apulian Zones (modified from [10]). Red boxes show the studied areas of Kastos Island, in the external Ionian zone, and Araxos peninsula (NW Peloponnesus), in the internal Ionian zone, as well as previously studied areas in the Gotzikas area, in the middle Ionian zone, and Ioannina areas, in the internal Ionian zone.
Geosciences 13 00044 g001
Figure 2. Detailed synthetic lithostratigraphic columns from Kastos Island and Araxos peninsula, in relation to the synthetic stratigraphic column of Ionian zone (modified from [10]).
Geosciences 13 00044 g002
Figure 3. In both areas, the sampling took place in the Lower Cretacous “Vigla” shales with the green light colour in the restricted outcrops. (a) Geological map of Kastos Island, showing “Vigla” shales outcropping in the eastern side of the Island in restricted areas. (b) Geological map of Araxos peninsula, showing a small outcrop along the Gianiskari coast.
Geosciences 13 00044 g003
Figure 4. (a) Representative section in Kastos Island of Lower Cretaceous “Vigla” shales from where most of the samples were selected. Red box marks the position of (b).
Geosciences 13 00044 g004
Figure 5. (a) The studied outcrop along the Araxos peninsula (Gianiskari coast) with the Lower Cretaceous “Vigla” shales overlying Lower Cretaceous “Vigla” limestones and underlying the Upper Cretaceous “Senonian” limestones (white dashed lines mark the two boundaries). Many normal faults cross-cut the sedimentary association of “Vigla” shales (red dashed lines) during sedimentation, producing synsedimentary slumps (white circle). Red box marks the position of (b).
Geosciences 13 00044 g005
Figure 6. (a) Geological map of the area around the Gotzikas section. Red circle marks the position of the studied section. (b) Geological map of region around Ioannina area. Red circle marks the position of Ioannina well.
Geosciences 13 00044 g006
Figure 7. (a) S2–TOC and kerogen characterization of samples, (b) Diagram S1+S2–TOC, (c) Diagram HI–Tmax, (d) Diagram HI–TOC, and (e) Van Krevelen diagram for HI–OI.
Geosciences 13 00044 g007
Figure 8. Categorization of organic matter in terms of quantity, quality, and thermal maturity [6].
Geosciences 13 00044 g008
Figure 9. (a) N-alkanes (n-C), phytania (Ph), (b) Hopanes, and (c) Steranes for sample AG6.
Geosciences 13 00044 g009
Figure 10. n-alkane distribution of the four samples (AG1, AG2, AG5, and AG6).
Geosciences 13 00044 g010
Figure 11. Schematic block diagram (not to scale) showing the influence of synsedimentary normal and transfer faults activity on basin configuration during Lower Cretaceous accumulation of “Vigla” shales. Stars with numbers inside show the positions of studied areas. Number 1—Araxos peninsula, 2—Kastos island, 3—Ithaca Island, 4—Gotzikas section, and 5—Ioannina well.
Geosciences 13 00044 g011
Table 1. Geochemical indices based on Rock-Eval VI analysis from samples of Kastos Island (17 samples), Araxos peninsula (Gianiskari coast (31 samples)), Gotzikas section (8 samples), and Ioannina well (6 samples).
S/NSampleAreaTmax (oC)S1 (mg/g)S2 (mg)S3 (mg/g)TOC (wt%)S1 + S2 (mg/g)S2/S3HIOIPI
1I1Kastos
Island
0.010.040.90.150.050.04276000.2
2AG14 0.050.110.050.020.162.25502500.31
3 AG13 0.040.094.730.420.130.022111260.31
4AG12 001.110.230004830
5AG11 0.010.010.390.040.020.03259750.5
6AG10B 0.030.020.390.040.050.05509750.6
7AG10A 0.050.030.120.070.080.25431710.63
8AG9 0.040.020.030.020.060.671001500.67
9AG8B 002.690.450005980
10AG8A 002.450.390006280
11AG74250.045.292.462.55.332.15212980.01
12AG64260.055.082.192.065.132.322471060.01
13AG54290.042.991.481.573.032.02190940.01
14AG44240.010.140.70.320.150.2442190.07
15AG34140.010.020.580.180.030.03113220.33
16AG24230.058.972.413.129.023.72288770.01
17AG14280.088.543.033.458.622.82248880.01
18G1RGianiskari coast3700.010.040.550.040.050.07
19G2 0.000.000.000.200.000.00
20G3 0.020.030.330.070.050.09
21G43700.010.120.620.380.130.19
22G53720.010.070.280.160.080.25
23G6 0.000.030.310.450.030.10
24G7 0.000.010.340.590.010.03
25G8 0.000.020.530.220.020.04
26G9 0.020.040.240.030.060.17
27G10 0.000.040.410.070.040.10
28G11 0.020.061.900.130.080.03
29G12 0.040.071.480.140.110.05
30G13 0.010.030.430.560.040.07
31G14 0.010.000.210.280.010.00
32G15 0.020.060.590.530.080.10
33G16 0.000.030.390.290.030.08
34G17 0.050.070.550.520.120.13
35G18 0.040.120.380.160.160.32
36G19 0.020.050.430.330.070.12
37G20 0.020.080.780.030.100.10
38G21 0.010.030.340.090.040.09
39G22 0.000.010.660.120.010.02
40G23 0.010.020.860.130.030.02
41G24 0.000.010.640.120.010.02
42G25 0.000.001.080.240.000.00
43G26 0.000.000.510.010.000.00
44G27 0.000.010.230.080.010.04
45G28 0.000.000.230.010.000.00
46G29 0.000.000.710.190.000.00
47G30 0.010.090.650.130.100.14
48G31 0.010.020.600.720.030.03
49IN1Ioannina4180.248.280.171.628.5248.7151110
50IN24180.2511.560.242.0711.8148.1755811
51IN34170.117.620.251.517.7330.4850416
52IN44160.2013.280.302.2413.5844.6059713
53IN54230.197.200.291.517.3924.8347619
54IN64170.137.160.291.447.2924.6949720
55GT1Gotzikas41113.27165.3221.1521.61178.597.8276598
56GT24208.46174.113.9319.10182.5744.3091221
57GT34230.184.671.070.944.854.36497114
58GT44230.229.300.880.021.8210.5751148
59GT54220.2811.410.661.8311.6917.2962336
60GT64190.208.391.061.508.597.9255971
61GT74240.197.991.071.568.187.4751269
62GT84210.209.581.552.549.786.1837761
Table 2. Results of Soxhlet extraction for the four rich selected samples of Kastos Island.
SamplesExtraction (g)Extraction (mg/g)
AG10.0230.199
AG20.0240.183
AG50.0120.102
AG60.0170.133
Table 3. The ratio of Bitumen/TOC.
SamplesBituminous/TOC
AG10.007
AG20.008
AG50.007
AG60.008
Table 4. Maltene and asphaltene content in the four analyzed samples.
SamplesMaltenes (%)Asphaltenes (%)
AG139.7460.26
AG237.0460.49
AG533.6266.38
AG635.1564.85
Table 5. Values of liquid chromatography.
SamplesSaturated (%)Aromatic (%)Resin (%)
AG117.5821.9860.44
AG223.3321.1155.56
AG528.2130.7741.03
AG610.3427.5962.07
Table 6. Concentrations of n-alkanes (ppm) through the GC-MS analysis for samples.
CompoundAG1AG2AG5AG6
C100000
C110000
C120000
C130000
C141.030.4700
C157.345.5300.97
C1619.615.9404.82
C1719.6216.111.075.71
Pr28.7323.962.498.97
C1819.2515.085.416.19
Ph36.635.7610.4119.99
C1919.1314.036.018.39
C2011.457.625.015.44
C2120.2417.719.0610.63
C2210.737.433.646.61
C2314.5910.476.3613.04
C2413.677.684.1511.35
C2517.538.936.2715.95
C2613.557.314.315.46
C2717.1110.757.4918.39
C2813.79.465.1916.32
C2915.2312.75.414.25
C3011.1610.895.213.06
C3115.217.277.6410.06
C326.8612.233.985.91
C338.2415.235.355.47
C344.6711.873.753.66
C3513.7618.495.155.98
Table 7. Geochemical indices for n-alkanes.
Saturate IndicesAG1AG2AG5AG6
Pr/Ph0.780.670.240.45
Pr/nC171.461.492.331.57
Ph/nC181.92.371.933.23
CPI1.361.311.421.11
CPI (1)1.241.281.411.16
OEP (1)1.281.481.721.46
OEP (2)0.460.480.50.38
OEP 27–311.241.281.140.97
nC24+/nC24−0.961.211.341.76
TAR1.031.142.92.84
nC19/nC311.260.810.790.83
R220.620.530.470.56
ACL 25–3328.4629.5329.0528.57
TAR = (nC27 + nC29 + nC31)/(nC15 + nC17 + nC19); Parameters of GS-MC data: n-alkanes and isoprenoids indices and ratios for the examined rock samples. Pr: pristane; Ph: phytane; n-Cx: Normal alkane with x carbon numbers; Pr/n-C17: Pristane/n-C17; Ph/n-C18: Phytane/n-C18; CPI: Carbon preference index, measured as (2[n-C23 + n-C25 + n-C27 + n-C29]/[n-C22 + 2{n-C24 + n-C26 + n-C28} + n-C30]); ACL: Average chain length; OEP: the ratio of odd- to even-numbered n-alkanes in a given range, measured as (n-C25 + 6*n-C27 + n-C29)/(4*n-C26 + 4*n-C28); nC19/nC31: n-alkane ratio; nC24+/nC24: n-alkane ratio; TAR: Terrigenous-to-aquatic ratio; Sat: Saturated hydrocarbons, measured as 2*n-C22/(n-C21 + n-C23); Arom: Aromatic hydrocarbons; NSO: Nitrogen-, sulfide-, and oxygen-rich compounds; OEP1: C21 + 6*C23 + C25/(4*C22 + 4*C24). OEP2: C25 + 6*C27 + C29/(4*C22 + 4*C24). OEP3: C27 + 6*C29 + C31/(4*C22 + 4*C24).
Table 8. Hopanes geochemical indices.
Hopanes RatioAG1AG2AG5AG6
(28+29)tri/C30Hop0.040.030.060.06
24tet/C30Hop0.10.10.040.04
Tricyclics/Hopanes0.070.080.050.04
24tet/26tri0.990.991.010.98
Tm/C30Hop0.240.190.170.19
C29nor/C30Hop0.460.470.340.36
C31R/C30Hop0.480.40.620.71
C31 S/S + R0.190.210.180.17
C33/C32 homo0.420.490.360.38
Moretane/C30Hop0.180.160.210.23
Gammacerane/C30Hop0.070.060.040.06
Table 9. Geochemical sterane indices.
Sterane IndexAG1AG2AG5AG6
C27 abbS0000
C28 abbS0000
C29 abbS0000
C27 aaaR25.7524.4728.1928.34
C28 aaaR22.4323.715.7616.19
C29 aaaR51.8251.8456.0755.47
S/R (C29 aaa)0000
S/(S + R) (C29 aaa)0000
bbS/(aaR + bbS) (C29)0.310.30.210.21
bb/(aa + bb) (C29)0000
abbS/aaaR(C29)0000
(C21 + C22)/(C27 + C28 + C29)0.010.010.010.01
C27/C29 (abbS)0000
C28/C29 (abbS)0000
C29/C27 (abbS)0000
Diaster/aa aster (C27)0000
C30 abbS 0000
C30 S + R 92.6693.0190.3290.03
Disclaimer/Publisher’s Note: The statements, opinions and data contained in all publications are solely those of the individual author(s) and contributor(s) and not of MDPI and/or the editor(s). MDPI and/or the editor(s) disclaim responsibility for any injury to people or property resulting from any ideas, methods, instructions or products referred to in the content.

