Article

Platform-to-Basin Evolution of a Tectonically Indistinct Part of a Multiple Foreland—Analysis of a 3D Seismic Block in the Northern Adriatic Sea (Croatian Offshore)

Department of Geology, Croatian Geological Survey, Sachsova 2, 10000 Zagreb, Croatia
*
Author to whom correspondence should be addressed.
Geosciences 2023, 13(11), 323; https://doi.org/10.3390/geosciences13110323
Submission received: 12 September 2023 / Revised: 10 October 2023 / Accepted: 23 October 2023 / Published: 25 October 2023
(This article belongs to the Topic Basin Analysis and Modelling)

Abstract

:
The Aiza research area covers over 650 km2 of the northern Adriatic offshore, a common Adriatic foreland of the older Dinarides on the NE, and the younger Apennines on the SW. High-quality 3D reflection seismic data were used to investigate the area’s Mesozoic to Cenozoic tectono-stratigraphic evolution. Four main seismo-stratigraphical horizons were recognized: Base of Carbonate Platform (BCP), Top of Carbonate Platform (TCP), Messinian Erosional Surface (MES), and a Plio-Quaternary horizon (PlQh), as well as the dominant faults. The results depict the geological setting and tectonic evolution of the area. A long-lasting (Jurassic to Cretaceous) stable NW-SE striking platform margin evolved probably along the inherited Triassic normal fault. The marginal belt of the platform was affected during the Late Cretaceous to Palaeogene by extension and opening of the intra-platform basin, probably on the southern limb of the then developing Dinaric forebulge. The transverse fault system (Kvarner fault) was probably reactivated as a strike-slip zone during the late Miocene tectonic reorganization. The area was tilted to the SW during the Pliocene, in the distal foreland of the progressively northward propagating Northern Apennines. Sub-horizontal late Quaternary cover of Dinaric and Apenninic structures could imply active subsidence of the foreland in between nowadays sub-vertically exhuming neighboring orogenic belts.

1. Introduction

The Kvarner and Istria offshore in the northern Adriatic Sea is characterized by polphase tectonic and stratigraphical development within the common but diachronic Adriatic foreland, situated between the northwestern Dinarides and the Northern Apennines (Figure 1a). The Triassic to Palaeogene carbonate platform-to-basin system is buried by Neogene to Quaternary predominantly clastic deposits. This paper’s main objective is to reconstruct the evolution of the carbonate platform and the geometry of its margin in the area. It also aims to define the structural-tectonic setting of the research area, with a particular focus on investigating the possible continuation of inferred transverse structures (oriented obliquely or perpendicularly to the platform margin and the orogenic belts). Similar structures have been previously identified onshore, such as Učka Mt. [1], and between SE Istria and the Kvarner islands ([2]; Figure 1a). These structures could potentially be related to the supposed transverse Kvarner Fault System, which is argued to dissect the thrust front of the External Dinarides [3,4]. However, there are interpretations of intriguing compressional structures within this part of the Adriatic foreland, as indicated by Del Ben [5] and Špelić et al. [2]. If it were so, the Dinaric front would be further south than the conventionally accepted position along the offshore edge of the outer (southernmost) Kvarner islands (Figure 1a). The discrepancy in interpretations of major geological structures in the Kvarner area underscores the need for further research in this crucial part of the Adriatic foreland, particularly in areas covered by high-quality seismic data. To address this, we have conducted an analysis of high-quality 3D reflection seismic data from the Aiza exploration Block, situated within the Adriatic foreland, offshore southern Istria, and the Kvarner islands.
Our approach involves revising existing geological data and conducting a comprehensive re-analysis of the structural-tectonic framework in the southern offshore area of the Kvarner region. This research integrates advanced seismic interpretation, 3D geological modelling, and a correlation between geological data from surrounding wells and the high-resolution 3D reflection seismic data within the study area. The creation of detailed maps has proven indispensable in providing a clearer understanding of the geological structures that mark the transition from the Mesozoic Adriatic Carbonate Platform (ACP) to the Adriatic Basin (AB), which is overlain by Cenozoic sediments of the Adriatic foreland (as previously discussed by Grandić et al. and Saftić et al. [3,6]; Figure 1a).
However, our primary emphasis centers on identifying tectonic structures, particularly the potential reactivation of older Triassic extensional faults during the period of Alpine compression, and their potential neotectonic reactivation. This research highlights the substantial impact of high-resolution data collected from local research areas in enhancing our ability to achieve a more thorough understanding of regional geological structures.

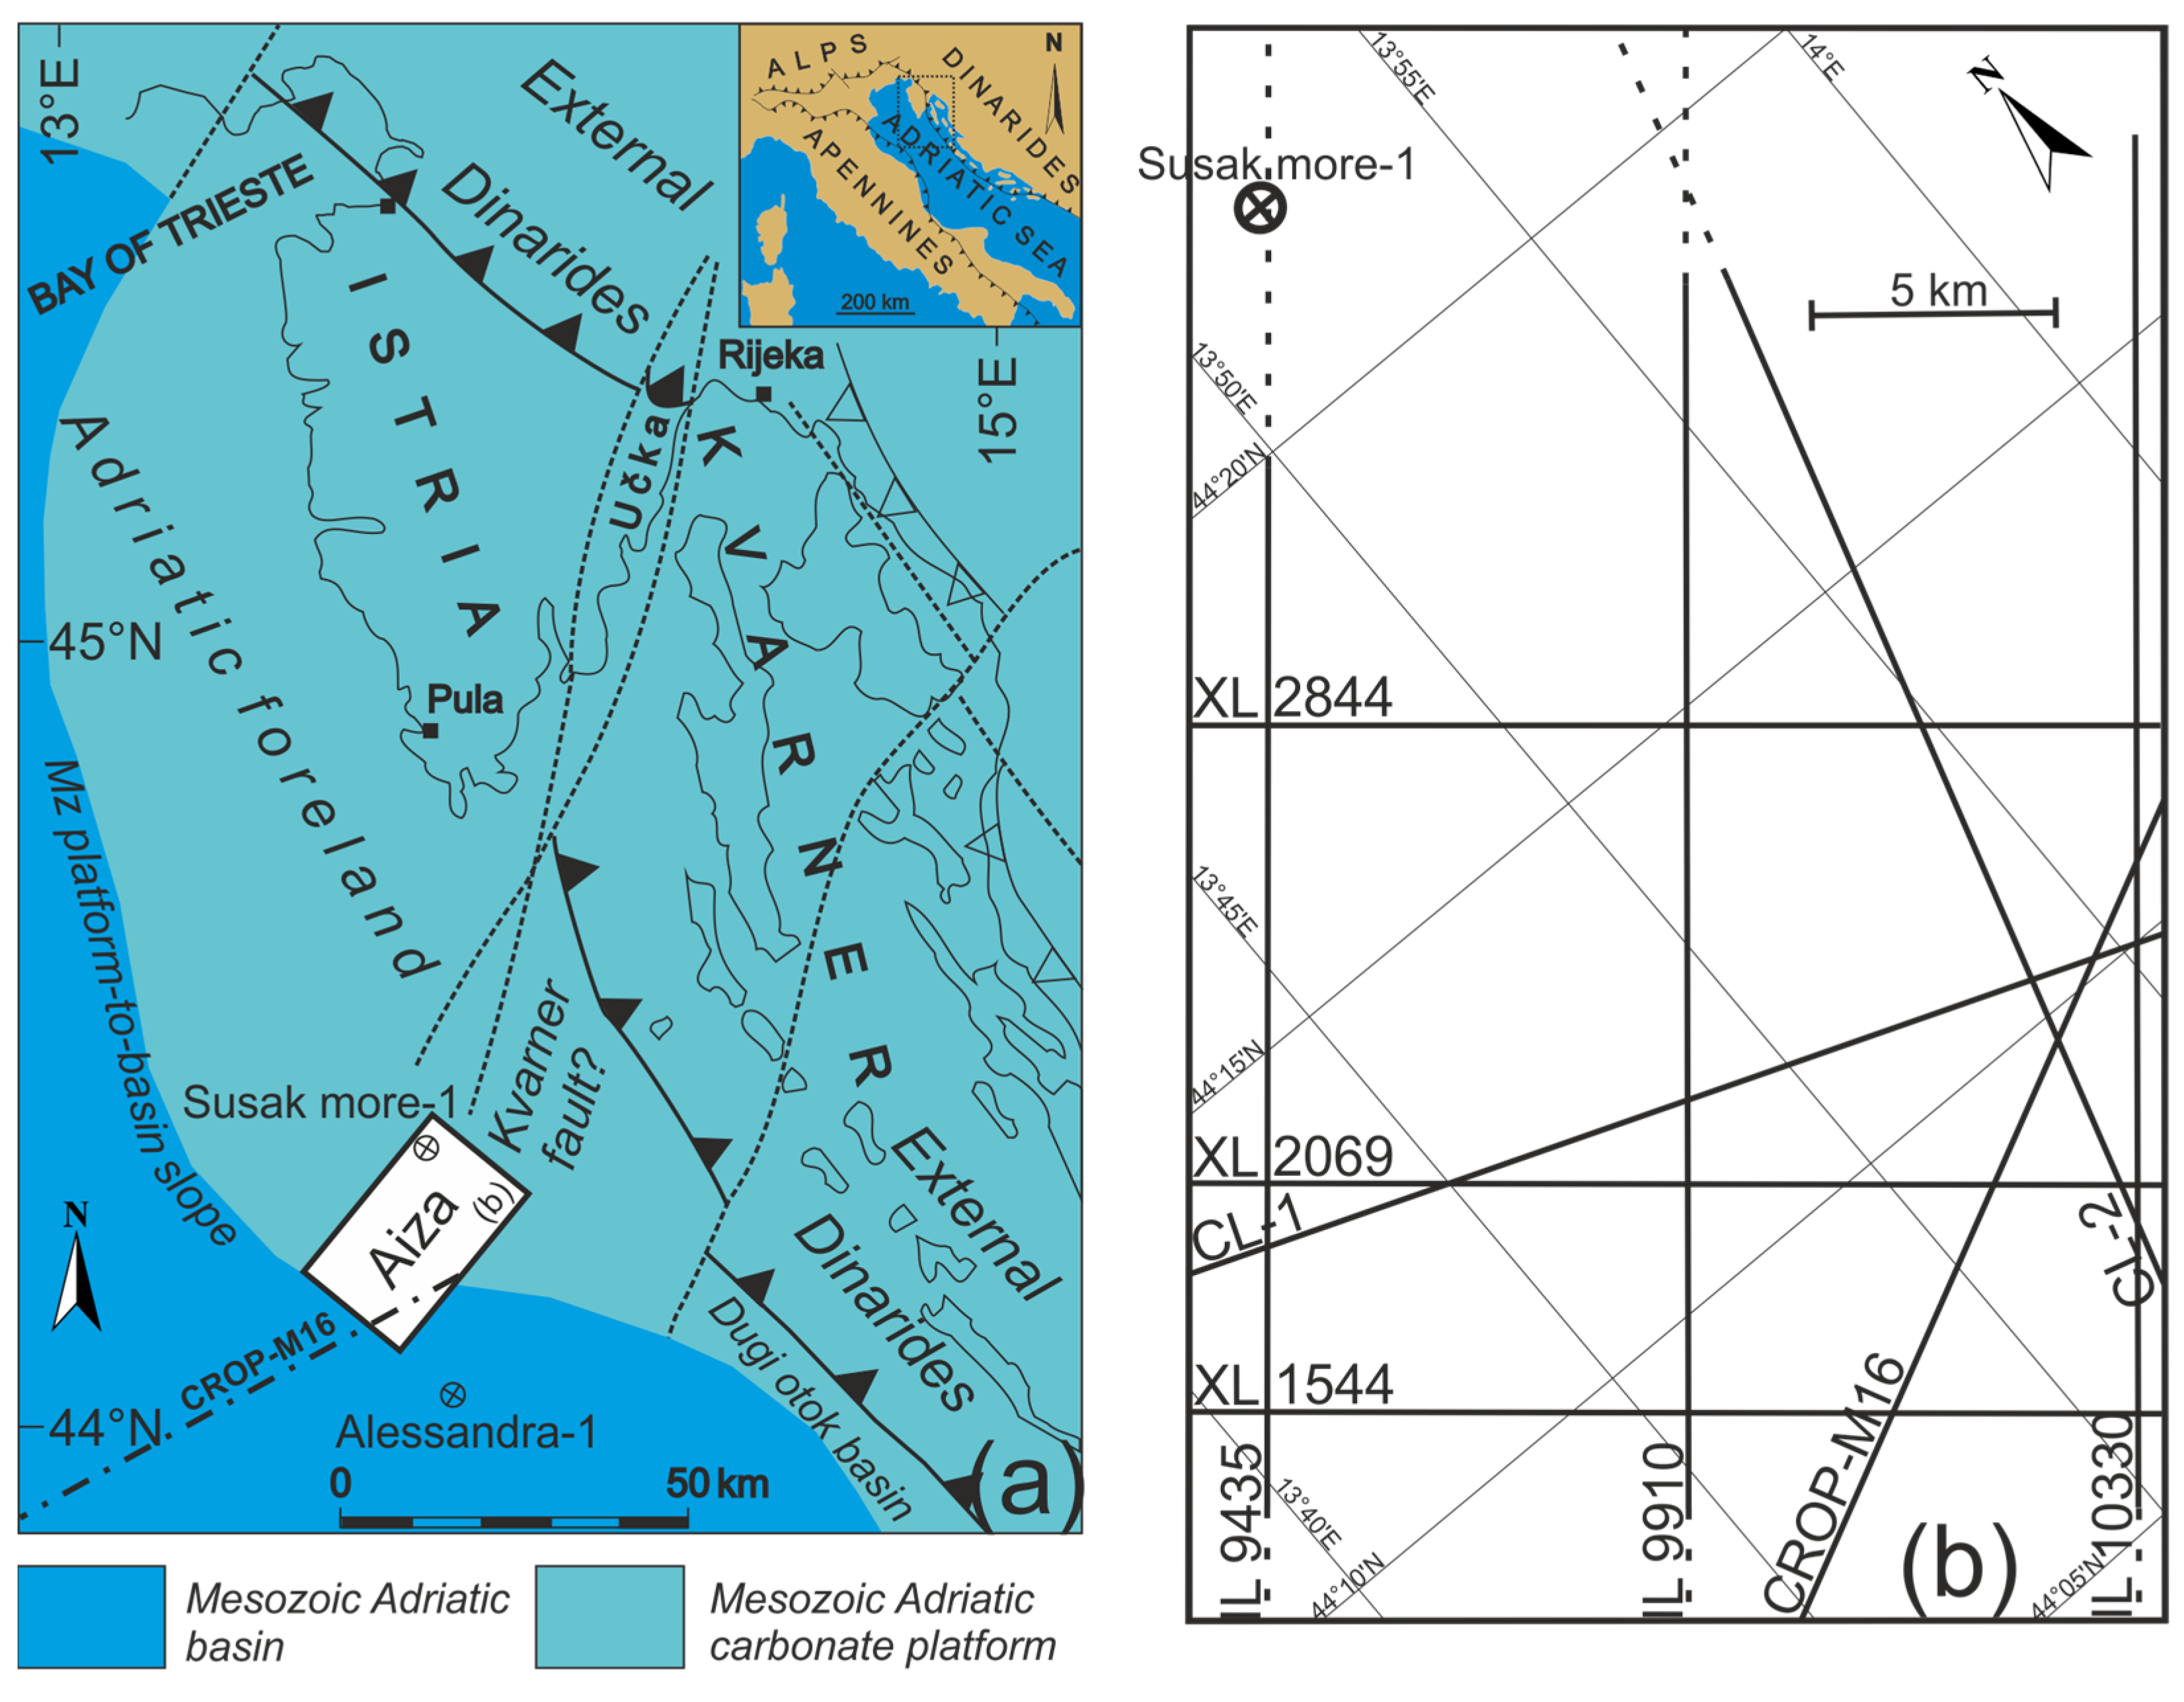
2. Geological Setting and Stratigraphy

The Adriatic region is situated within the Adratic microplate (Adria), which interacts with the surrounding Alpine orogenic belts (Figure 1a): the Apennines to the SW, the Southern Alps to the NW, and the Dinarides to the NE [7]. Following the initial (aborted) rifting and individualization of Adria during the middle Triassic period [8,9], the Adriatic Basin (AB) and the Adriatic Carbonate Platform (ACP) developed during the Early Jurassic, atop a vast Upper Triassic western Tethyan megaplatform (the Main Dolomites or the Dolomia Principale sequence). This megaplatform overlies the Permian to Middle Triassic basement, represented mainly by clastic deposits ([10]; Figure 2).
In terms of regional geodynamics, this area has been characterized by a compressive regime since the onset of the Alpine orogenesis in the region [11,12]. The Kvarner offshore and southern Istria (Northern Adriatic) are part of the NW portion of Adria, specifically the Adriatic foreland [4]. The neighbouring Kvarner islands belongs to the External Dinarides, which are seismically active. However, seismic activity in the southern part of the Kvarner area and offshore is notably lower than in the northern part [13], suggesting that the faults in this region are either aseismic or currently inactive. Nevertheless, the research area still belongs to the distal foreland of both the Dinarides, formed during the Palaeogene, and the Apennines, formed during the Neogene (Figure 1a), although in front of the latter the deformations continue today [14].
Previous seismotectonic 2D models of the Kvarner region [15] were constructed using geological maps and profiles that were published over the last decades. Current active fault maps are also based on older data [16]. However, recent geological structural data has revealed the complexity of the contact zone between the External Dinarides and the Adriatic foreland [17]. Limited-quality seismic data have allowed interpretations onshore and between the Kvarner islands [2,3,5].
The complex geological setting of the Kvarner area is closely tied to the multiphase orogenic evolution of the External Dinarides, which appear to be fragmented by the transverse Kvarner Fault System ([4]; Figure 1a). Transverse faults are observable onshore along Učka Mt. ([1,18]; Figure 1a) and continue offshore between Istria and the Kvarner islands [2]. Further to the south, similar structures are detected on the deep seismic profile CROP-M16 [5], though they have been interpreted as frontal compressional structures, despite their fault configurations resembling those of a transverse strike-slip Kvarner Fault System [4].
Stratigraphic correlation was carried out between the two closest available wells, Susak more-1 (SM-1) and Alessandra-1 (Figure 2). These wells are located 37.2 km from each other and are situated outside the seismic survey area (Figure 1 and Figure 2). Despite being outside the seismic coverage, both wells offer valuable insights into distinct stratigraphic facies and the thickness of platform and basin deposits, which are explored in this paper. Furthermore, onshore data from the Kvarner region have indicated the presence of short-lasting Late Cretaceous intra-platform basins [19,20,21].
Susak more-1 well (SM-1) drilled through the succession of the ACP and reached the middle Triassic clastic sequence [22], which developed during the initial rifting in the region along the precursor fault network [8]. In contrast, the stratigraphy of the Alessandra-1 well (Figure 2) reveals the presence of a Jurassic to Palaeogene carbonate pelagic sequence of the AB, followed by overlying Miocene neritic shelf carbonates.
One of the most prominent unconformities in the research area is the Messinian Erosional Surface (MES; Figure 2). According to Hsü et al. [23], variations in the Atlantic-Mediterranean connection during the Late Miocene led to the Messinian Salinity Crisis—a significant event that impacted the palaeogeographic and environmental evolution of the Mediterranean region, including the Neogene Adriatic (clastic) Basin. On the ACP area, the Top of the Carbonate Platform (TCP) often coincides with the Messinian Erosional Surface (MES), primarily due to the absence or limited thickness of Neogene Adriatic shelf deposits [2]. However, this is not the case within the analysed 3D seismic Block (Figure 3).
Following the development of the Apennine foredeep, thick Neogene synorogenic clastic sequences were deposited in the Po Plain—Adriatic Basin area [24]. The alternation of hemipelagic facies is a characteristic feature of sedimentary Palaeocene-Pleistocene sequences, even within the Croatian part of the Po Depression [25]. Pliocene deposits are predominantly composed of silt, while loosely compacted sandstones dominate during the Pleistocene age. These sandstones resulted from deposition in the delta and pro-delta facies of the Po River catchment area, as evidenced in the Alessandra-1 well (Figure 2). Throughout the Pliocene and Pleistocene, the Po Plain and the Northern AB experienced significant subsidence rates due to the eastward rollback of the Apennine subduction hinge [26,27]. This led to the propagation of the Apennine thrusts and subsidence of the Adriatic foreland in the central part of the Northern Adriatic [28]. The active Northern Apennine thrust system is buried beneath the southern margin of the Po Plain and the Adriatic Sea, making this area seismically active [29], with the potential to propagate further to the NE [30].
In the Croatian part, delta and pro-delta sediments of the Po River depression first appeared in the Pleistocene, when eastward shift of the Adriatic Sea coastline was driven by the eastward Apennine migration. Simultaneously, temporal fluctuations in sea-level during the ice ages moved the coastline north-south several times [25]. The Po Plain—Adriatic Sea foreland region allowed for the development of a large, superimposed delta system, significantly impacting hydrocarbon storage. Hydrocarbon reserves in the Po Plain have been known since 19th and 20th centuries, although in relatively small volumes due to tectonic activity. Biogenic gas reservoirs are found in the Pliocene-Pleistocene Po Plain [31,32,33]. Hydrocarbon traces in the Croatian offshore are situated on the margin of the ACP and within the AB, although their occurrence is sporadic, primarily within the Susak Formation [25]. Đurasek et al. [34] suggested that gas-filled limestones are located in the hanging wall of the platform margin, trapped by Pliocene clay marls acting as barriers to fluid migration. Despite numerous stratigraphic studies on different sections of the Po Plain—Adriatic system [25,33,35,36], there is still no comprehensive sequential-stratigraphic framework for the Croatian offshore region.

3. Data and Methods

This study is based on the analysis of a 3D seismic volume from the Aiza exploration Block, located offshore Croatia in the northeastern part of the Adriatic Sea. The 3D seismic data, covering an area of ≈ 650 km2 (Table 1), were acquired during the hydrocarbon exploration activities conducted by INAGIP, a Croatian–Italian company. To enhance the geological understanding of the research area, we also utilised published data and available logs from the Susak More-1 exploration well. Additionally, Italian public data sources were consulted, including the CROP-M16 seismic profile [5,28] and the Alessandra-1 well [37], situated near the Aiza Block on the Italian side of the Adriatic Sea. The analysis and interpretation of geophysical data in this offshore environment were carried out using Schlumberger’s Petrel 2020.5 E&P software.
Well Susak more-1 (SM-1) is located within the northern corner of the Aiza Block, approximately 5.8 km beyond the seismic coverage. The Alessandra-1 well, while located 6 km south of the Aiza research area, was still in proximity to the recorded data and therefore considered in this study.
Transformation of the well data to the two-way time (TWT) enabled the estimation of horizon depths and sedimentary unit thicknesses. To achieve a comprehensive interpretation, we generated 42 inline and 102 crossline sections with an intermediate distance of 25 ms. Therefore, the distance between two interpreted inlines was set to 468.63 m and 312.40 m for crosslines. Additionally, we created composite sections (CL-1 and CL-2; Figure 1b) to analyse specific segments discussed in previous literature [2,5].
Mapping of significant horizons such as the BCP, TCP, MES, and PlQh involved manual picking and initially employed a classic seismic view. However, for poorly distinguishable horizons, we performed an analysis of seismic attributes to enhance interpretation accuracy. Seismic attributes provide valuable information extracted from seismic data that may not be readily observable [38]. In the context of geological studies, these attributes have applications in defining regional formations, evaluating deposits, determining structural-tectonic settings, and more [39]. Their significant role has also been evidenced in recent studies, where they are used with innovative methodologies [40,41].
Analysis of seismic facies is fundamental in identifying sediment sequences based on seismic patterns [42]. The investigated horizons served as lithological boundaries and were related to unit contacts in the Susak more-1 and Alessandra-1 wells. Additionally, sharp offsets in amplitude seismic sections were utilised for fault identification. While numerous minor faults were present in the research area, we systematically mapped six dominant faults that extended across a significant portion of the region.
Isochron maps, which depict differences in TWT between two seismic reflectors (seismic events), were used to interpret thickness variations [42]. These maps provide valuable information about the palaeostructure and thickness variations in the lower horizon during the deposition of the upper horizon [43]. Isochron maps served as an additional method for extracting geological information from available data. The map configuration utilised the convergent interpolation method with a grid increment of 50 × 50 m. This approach was chosen to maintain data trends and prevent over-smoothing. This method is a fast, general-purpose algorithm, and it adapts well to various data densities by iteratively refining grid resolutions. To prevent over-smoothing, the trend extrapolation method was specifically applied, as it has a tendency to preserve data trends in extrapolated regions. Additionally, a multi-resolution technique was employed to ensure surface smoothness and an accurate representation of subsurface structures, varying the level of detail in different parts of the surface based on the perspective.
To reveal evidence of possible tectonic activity of the subsurface offshore environment, a 3D data display was predominantly used because it provides an analysis of the entire investigated area via horizontal time-slices. To visualize the carbonate platform setup, a 3D model was developed using a lattice construction process and contoured horizons. The geometric parameters of the model are detailed in Table 2.
This study conducted a highly detailed interpretation of seismic sections, focusing on four prominent chronostratigraphic horizons and six dominant faults within the Aiza Block. Deposits in the research area are in the stratigraphic range from the Lower Triassic to Quaternary (Figure 2). Particular emphasis was on platform carbonate facies evolution (Late Triassic-Palaeogene) and Plio-Quaternary seismic facies. Detailed 3D structures and sediment distribution were used to constrain fault system evolution and potential accompanying structures. The results are visualized through seismic profiles, 2D maps, and a 3D model.

4. Results

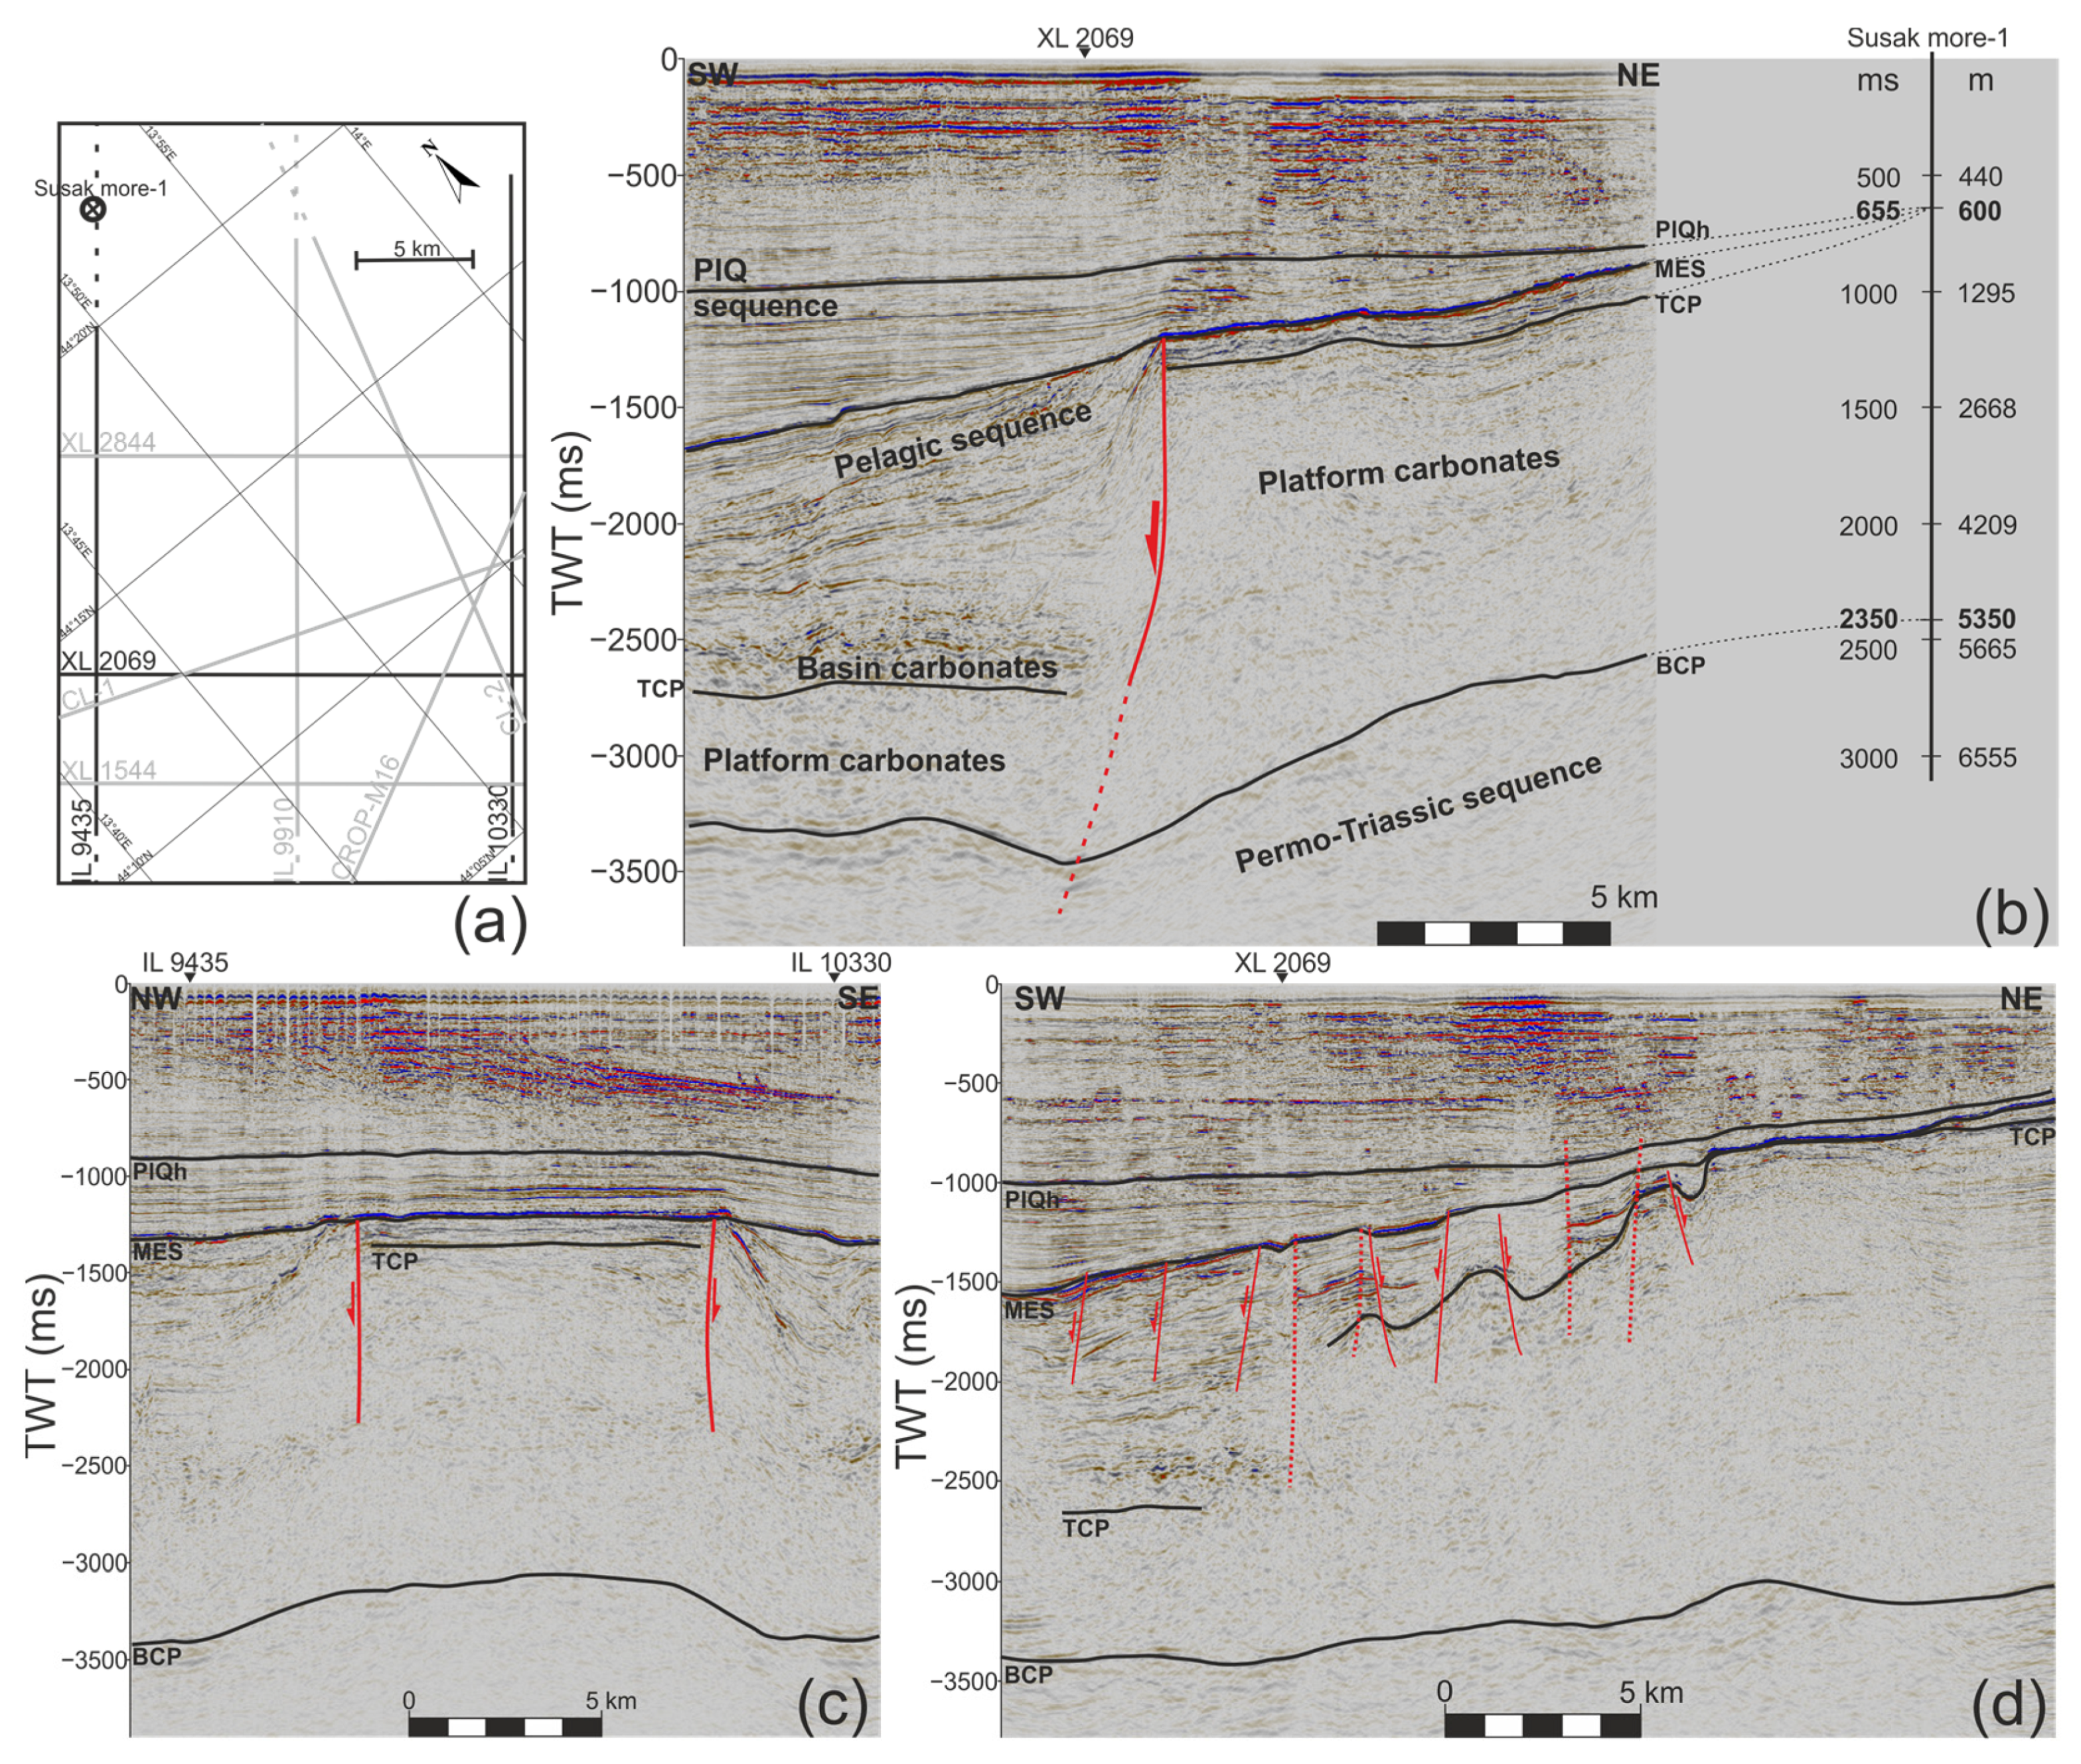
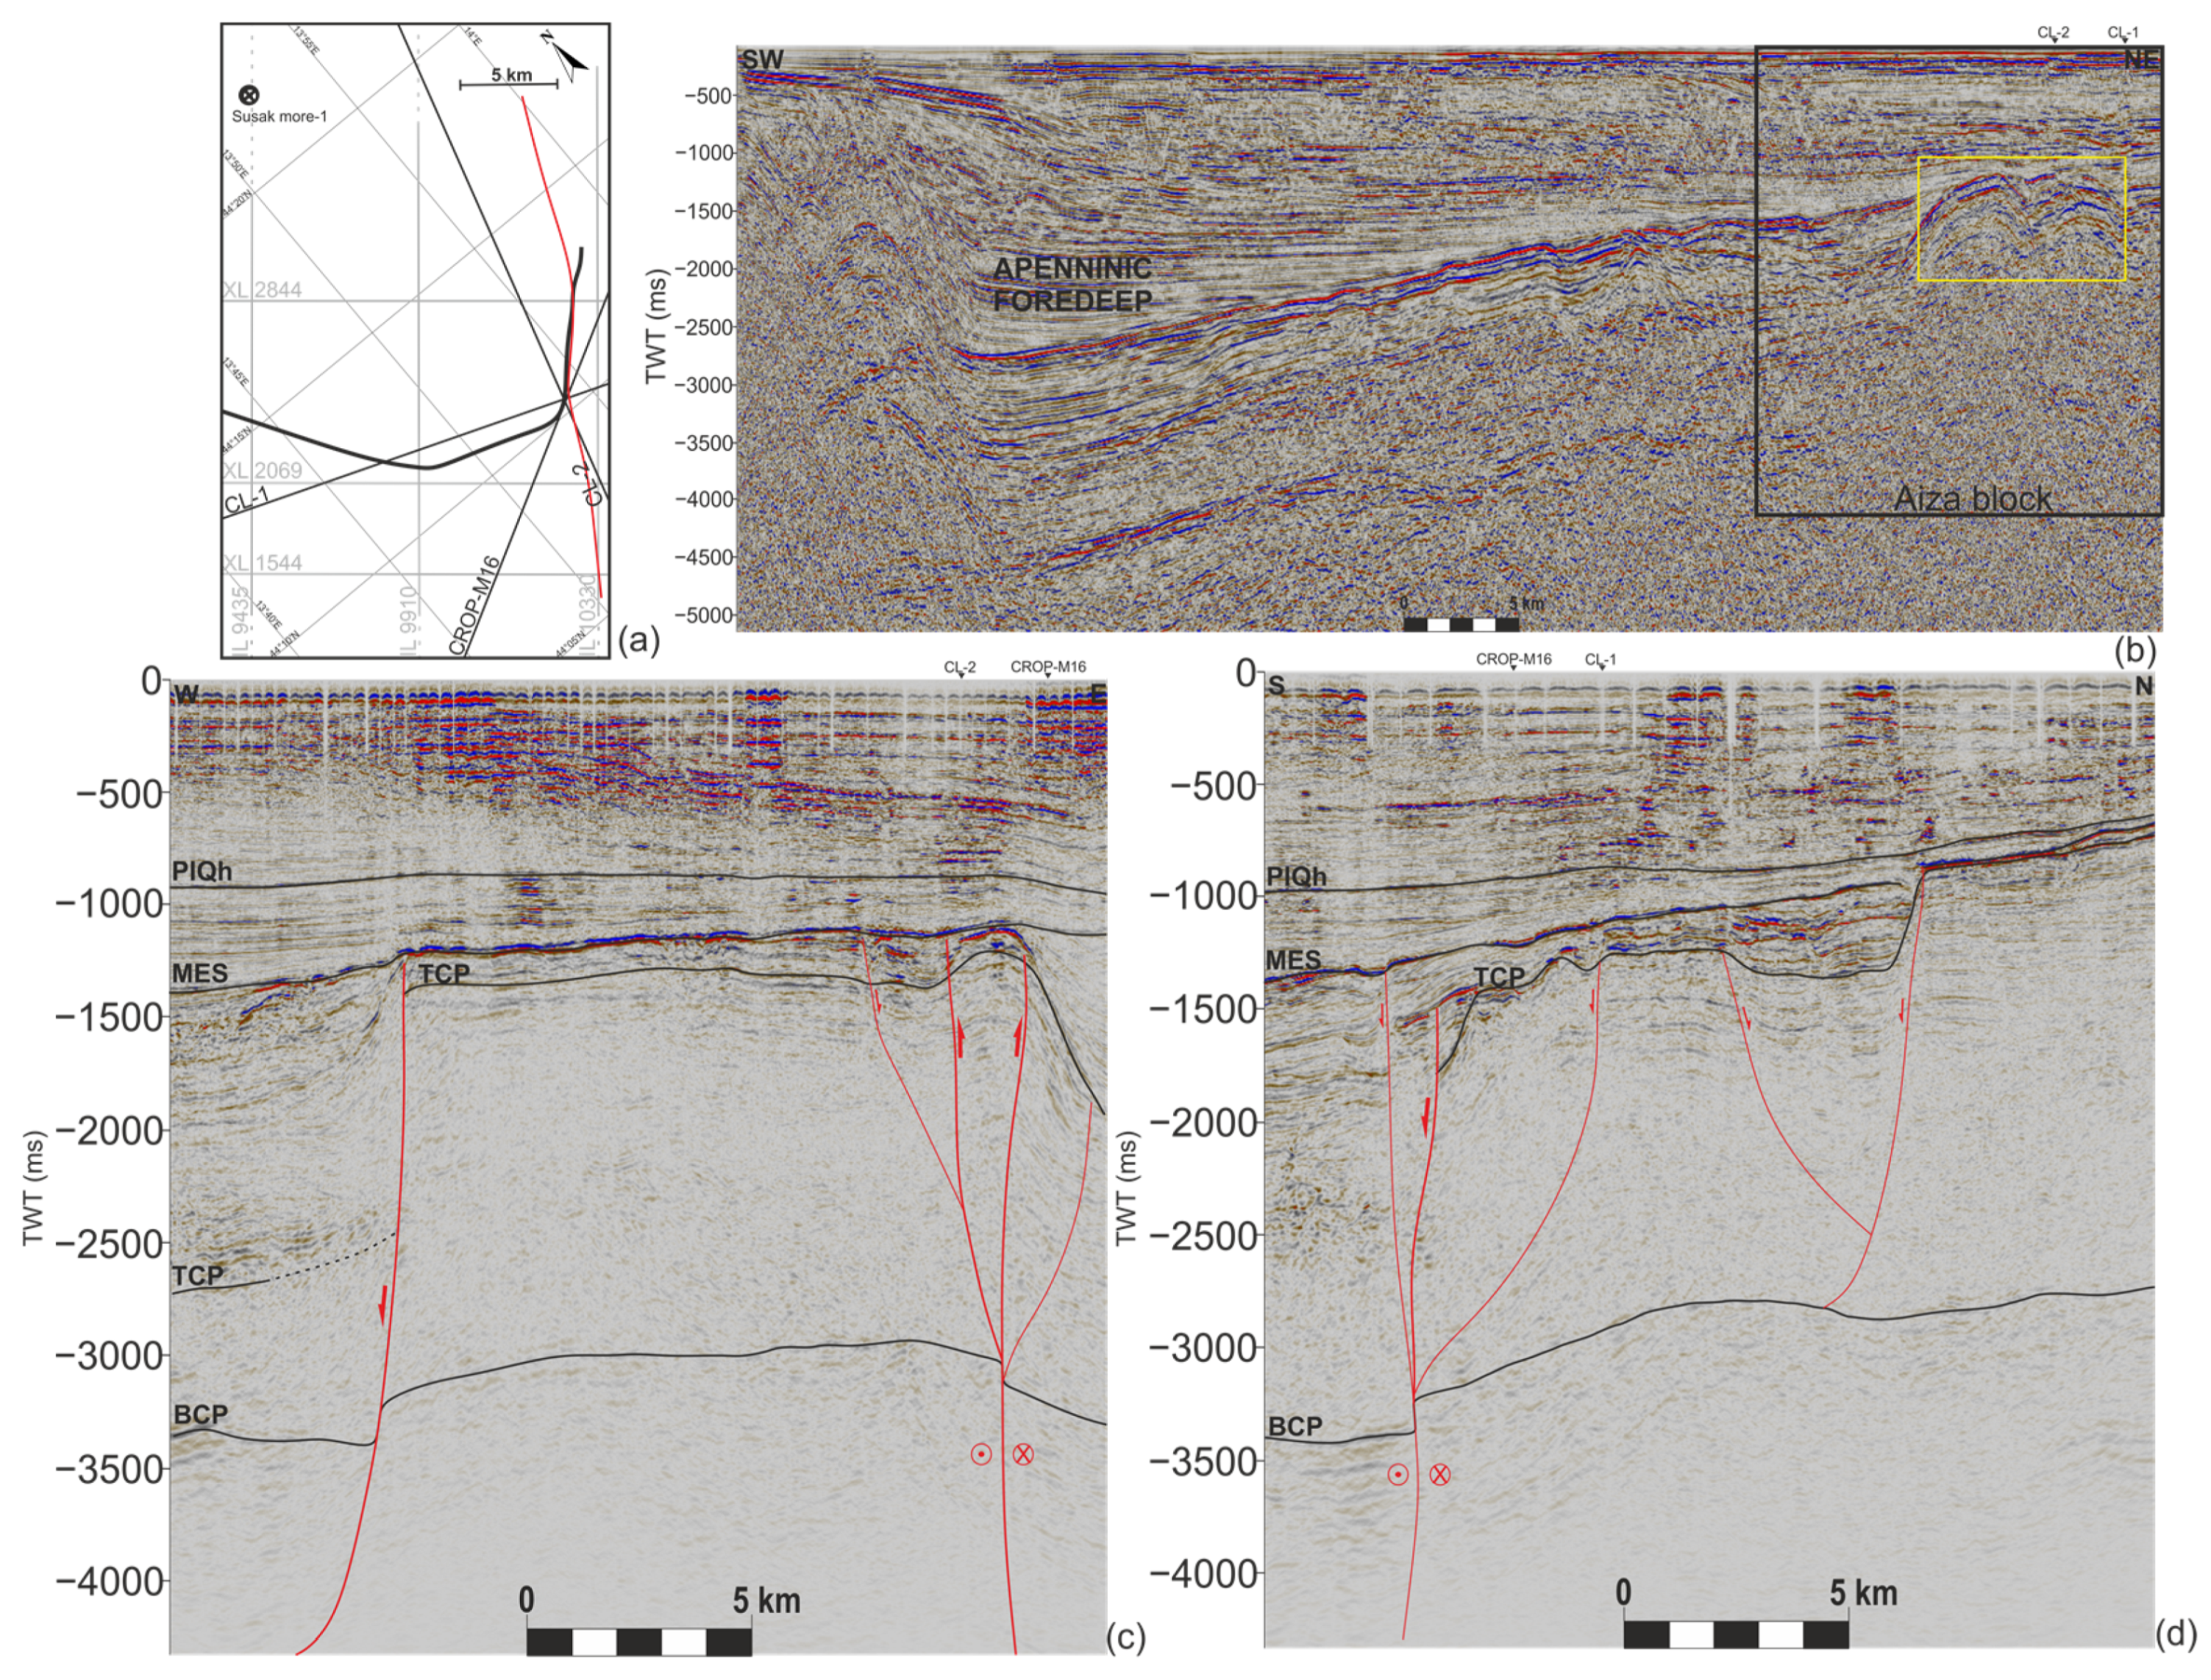
4.1. Seismic Sections

The seismic reflection profiles (Figure 1b) were primarily utilised to delineate the structural features of the carbonate platform and the regional basin. Among the various seismic sections analysed, those that are presented most effectively illustrate the palaeomorphology and structural-tectonic framework, which will be discussed in detail below.
With respect to Mean Sea Level, the water bottom was identified at approximately −100 ms, equivalent to a depth of 75 m (Figure 3b). The seabed reflector and the shallowest parts of the seismic profiles were muted, resulting in a lack of consistency and well-resolved reflection geometry in the upper part of the initial depth.
By comparing with previous findings and well data (Figure 2), four major reflectors were identified and interpreted as the main horizons. From top to bottom, these horizons are the Plio-Quaternary horizon (PlQh), Messinian Erosional Surface (MES), Top of Carbonate Platform (TCP), and Base of Carbonate Platform (BCP), in stratigraphic order as shown in Figure 3b. The BCP seismic horizon represents the boundary between the clastic sediments of the Permo-Triassic (below) and the onset of shallow-water carbonate deposition (above). The Adriatic Basin (AB) formed during Lower Jurassic, and the TCP horizon, deeply buried in the basinal domain, is clearly visible on seismic sections, marking the boundary between the Adriatic Carbonate Platform (ACP) to the NE and the AB to the SW.
Between the TCP horizon and the MES unconformity within the Aiza Block, carbonates appear to have been deposited on a distal ramp (formerly part of the ACP) of the emerging Dinaric foreland basin from the NE. In the Susak more-1 well (Figure 2), this sequence is represented by Palaeogene neritic carbonates unconformably overlain by a thin layer of predominantly Early Neogene biogenic carbonates, deposited on the Adriatic shelf in the distal foreland of the evolving Apennines from the SW. The top of this carbonate succession is truncated by the MES horizon, reflecting a regional Messinian erosional event.
The horizon within the PlQ succession was selected for mapping due to its prominent positive seismic reflection with high lateral continuity, marked by stratal terminations below and significant changes in seismic facies (Figure 3b–d). Furthermore, this horizon was chosen because it represents the most apparent reflector within the PlQ sequence, characterized by high amplitude, enabling successful chronostratigraphic correlation.
The margin of the ACP is distinguishable in most profiles, clearly depicting the southwestern platform-to-basin margin. On many interpreted seismic sections, a sharp slope at the platform edge is readily apparent (Figure 3b,c). The northwestern and southeastern boundaries of the carbonate platform were also captured by a cross-section perpendicular to the platform spreading (Figure 3c). However, at the southeastern end of the study area, the platform margin exhibits a gradually steep slope, characterized by a quite deformed rugged edge (Figure 3d).
Beneath the MES horizon, in the southwestern part of the upper slope (Palaeogene-Miocene valley), pelagic slump deposits (probably allodapic carbonates) are dislocated and segmented by several nearly vertical extensional faults (short red solid lines), forming part of the primary extensional system (Figure 3d). One major sinistral transpressional strike-slip was identified, with its trajectory intersecting the seismic section at multiple points (indicated by red dashed lines) due to its winding path relative to the IL 10330.
The most challenging horizon to interpret was the Base of Carbonate Platform (BCP) horizon, primarily due to diminishing resolution with depth. This horizon is often regionally mapped with uncertainty, and its extent is typically estimated [2,5]. Nevertheless, the 3D seismic data analysed in this study enabled us to successfully map the BCP horizon, especially utilising several seismic attributes such as Variance (Edge method), Local flatness, Iso-frequency component, Instantaneous phase, Instantaneous frequency, Dominant frequency, Cosine of phase, and 3D edge enhancement. These attributes also proved valuable in mapping less distinct sections of the Top of Carbonate Platform (TCP) horizon.
Among these attributes, Cosine of phase emerged as the most effective in delineating the BCP within the study area. A comparison between an uninterpreted classic seismic view and an interpreted section of Cosine of phase attribute is depicted in Figure 4b,c. The classic view exhibits poor visibility, whereas the section derived from the seismic attribute Cosine of phase provides significantly improved clarity. For mapping other horizons such as TCP and Plio-Quaternary horizon (PlQh), the most successful seismic attributes were found to be Instantaneous phase, Variance, and 3D edge enhancement (Figure 4d).
On seismic section IL 9910, a structural-stratigraphic interpretation revealed the presence of a simple intra-platform basin (Figure 5a, located in the NE part of the section). The NE boundary of this intra-platform basin can be considered a prominent structural feature (i.e., major branch line). This boundary could reasonably be extended towards the BCP horizon, as a deeper antiform structure has been identified beneath the BCP horizon. The platform’s edge extends perpendicular to the slope deposits’ dip (Figure 5a, in the SW part of the section), which exhibits dense fracturing caused by accompanying extensional faults. The origin of the major branch line may be traced to the probable continuation of a significant regional extensional fault within the study area. The NE fault of the intra-platform basin likely formed due to the reactivation of a secondary Middle Triassic fault as an extensional detachment. Consequently, the intra-platform basin exhibits a close association with footwall elevation lows along the ACP margin. Additionally, the extensional fault might extend upwards into the PlQ sediments.
The NW-SE striking intra-platform basin is evident in both crossline and inline seismic sections. It likely developed atop a late Cretaceous to Palaeogene extensional detachment (Figure 5a). This detachment probably underwent reshaping into a hybrid flower structure during the late Miocene (Figure 5b; [44]). Due to the structural complexity in this area, a hybrid flower structure was identified within regions characterized by a releasing bend of the listric fault and a restraining bend of the strike-slip fault (depicted as thick red lines in Figure 5b). The lateral variations in thickness indicate deposition during active subsidence, which may have contributed to the development of intra-basinal sediment deformations. The intra-platform basin has a degraded footwall, as evidenced by the visible anticlinal structures (indicated by black arrows), which have been preserved due to fault reactivation along former extensional faults (Figure 5b).
The Plio-Quaternary seismic facies are most effectively observed along cross-lines sections, parallel to the depositional dip. An illustrative example can be seen in XL 1544 (Figure 6). The thickest, undeformed Pliocene deposits, probably formed in a protected shelf environment (deep neritic facies or shallow marine setting), are depicted in Figure 6a. Seismic facies interpretation for the PlQ-age deposits is based on a diversity of characteristics derived from reflection shape, amplitude, frequency, and continuity within the specific sequence (Figure 6b).
Several distinct seismic facies have been identified (Figure 6c). The dominant seismic facies observed in this study are described as parallel (indicating minimal deformation during deposition, denoted as SEQ1-SEQ3, SEQ6-SEQ7), divergent (reflecting differential subsidence rates, SEQ4), and clinoform reflectors (SEQ5). The SEQ5 corresponds to a coastal to inner neritic depositional environment, likely associated with Po River deposits. From the NW, delta progradation is evident, with recognizable topset, foreset, and bottomset deposits. However, the SE part of the XL 1544 does not display topsets within the parallel-oblique clinoform patterns of SEQ5. In the SE propagation, the transport of accumulated fluvial deposits results in multiple reflectors and areas with no reflection (caused by fault discontinuities). Some of these features could potentially pose geological hazards. Notably, gas chimneys are also visible in this section (indicated by black arrows). They are characterized by vertical zones of low amplitude and chaotic data, probably resulting from velocity discontinuities such as the termination of a “bright spot”.
Z-scale maps in TWT were created, facilitating a clear and comprehensive structural interpretation. Seismic time slice views were predominantly utilised to enhance the structural-stratigraphic interpretation of inline (IL) and cross-line (XL) seismic sections. Six illustrative examples of these maps are provided in Figure 7d–i. Structural elevations are distinctly depicted as abrupt transition from high positive and negative amplitudes to lower amplitudes.
Two sets of fault systems are discernible within this study area. The tectonic framework of the regionally dominant Dinaric structures, typically striking NW-SE, has been identified. Additionally, NE-SW faults are notably prominent and exhibit a considerable stratigraphic range, extending up to the Plio-Quaternary age (highlighted by red polygons and lines in Figure 7). The delineated boundaries of the platform edge (represented by black polygons and lines) and the southern boundary of the intra-platform basin (illustrated by white polygons and lines) are the most conspicuous geological features identified in the study area (Figure 7a–i). It is noteworthy that the white lines are nearly perpendicular to the dominant red fault lines.
Given the necessity to investigate more recent faults, the structural-tectonic framework of primarily shallower Plio-Quaternary deposits is also presented on a 2D time-slice map (Figure 7h,i). The emergence of left-lateral strike-slip faults during the active deposition of Plio-Quaternary sediments suggests a potential slight counterclockwise rotation.

4.2. Subsurface Maps and 3D Models
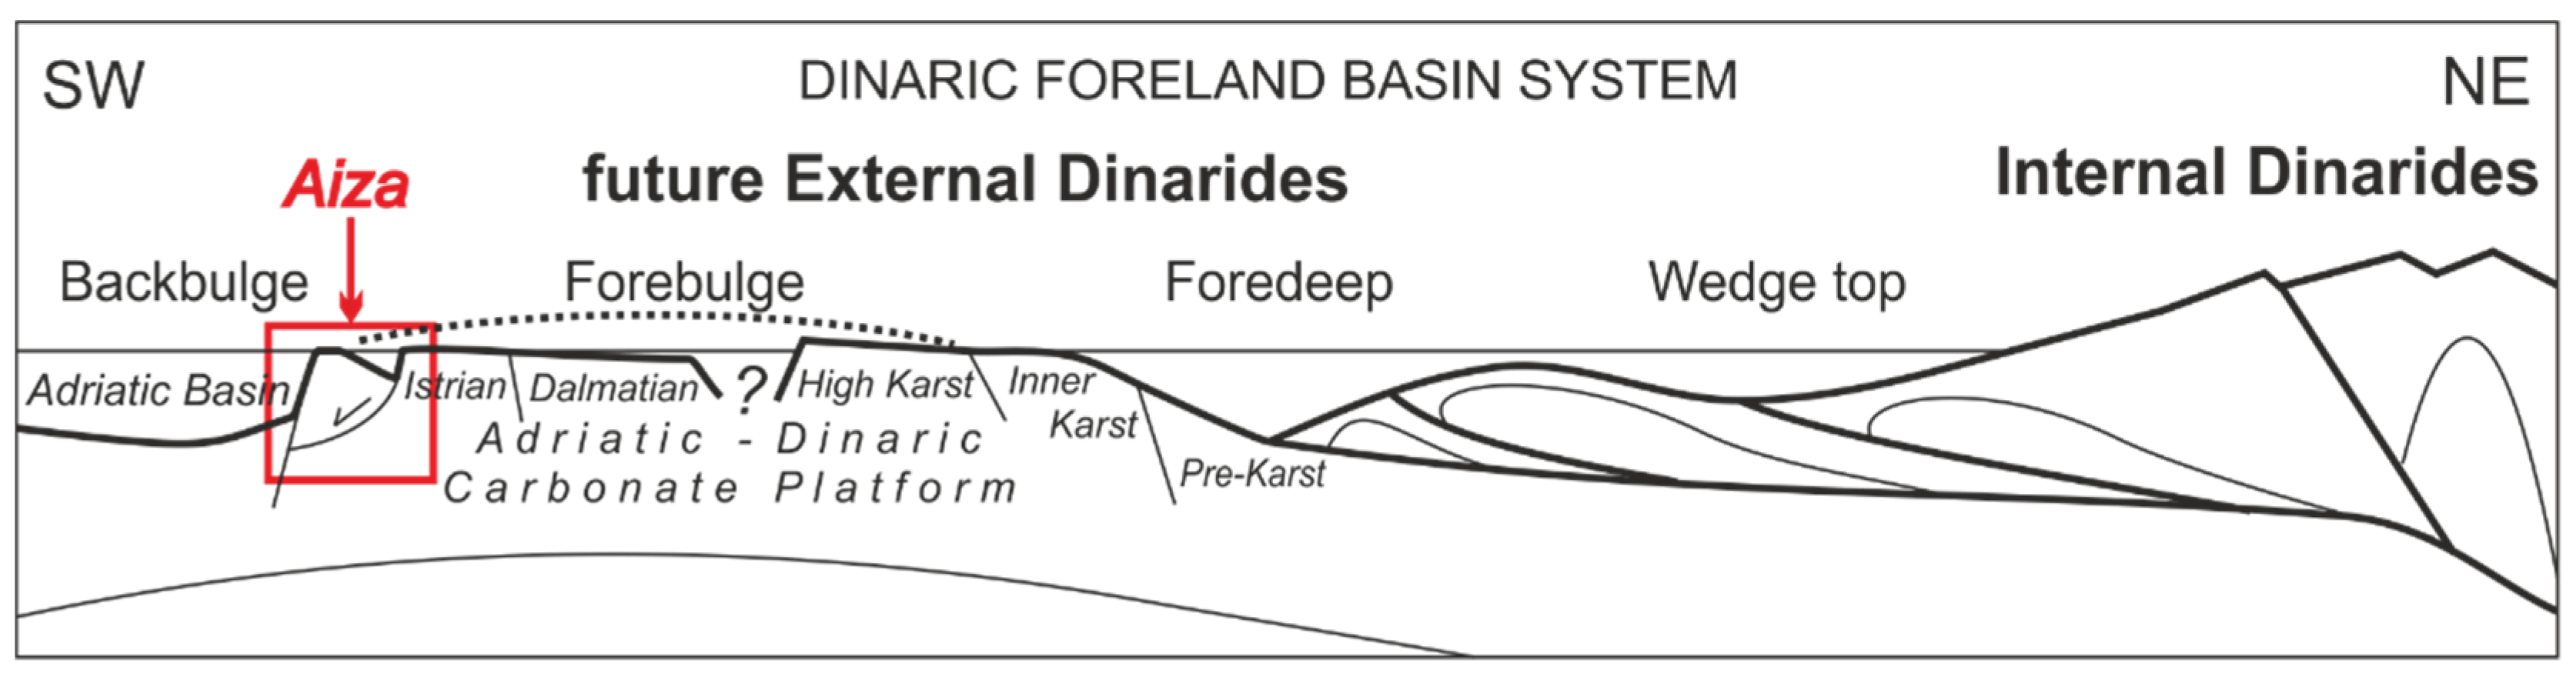
The interpretation of these horizons enabled creation of 2D contour maps representing their depths in two-way time (TWT). These isochron maps provide insight into the geometry of each horizon and reveal the positions of the main slope and faults. Surface maps have been generated for four horizons: BCP, TCP, MES, and PlQh (Figure 8). The parameters used for all these surface maps are consistent and include high resolution, an enhanced contouring method with increments of three for smoothing and one for refinement. The isochron interval on the BCP, TCP, and MES maps is 25 ms TWT, while on the PlQh map, it is 10 ms TWT.
In the BCP map (Figure 8a), the Susak more antiform structure is predominantly expressed with a north-south strike, covering an area of 63.6 km2. Previous INA reports [45] estimated the top of this structure at 2576 m and a surface area of 80 km2, with nearly 80% located within the Aiza Block. Our study confirms these estimates regarding the depth and size of the structure. The BCP horizon represents the boundary between clastic to carbonate successions. In the structure (Figure 7d,e and Figure 8a), a listric detachment fault with an NE-SW strike is observed, as well as another significant fault (potentially of the Kvarner Fault System) with a similar strike that borders the structure on its SE side. The pre-existing Middle-Late Triassic fault network played a role in shaping the steep geometry of these major strike-slip faults, leading to the separation of the Adriatic Basin from the Adriatic Carbonate Platform (AB-ACP segregation; [8]).
The TCP structure map retains a similar arrangement (Figure 8b). Large NW-SE striking geomorphological carbonate ridges mark the boundary between the carbonate platform and the basin (see also sections on Figure 5). A prograding carbonate platform margin is identified in the SE portion of the area.
Multiple tectonic events have influenced and altered the basin, resulting in its division into two domains. The distinct, well-defined boundary of the ACP margin, observable on the TCP surface map (Figure 8b), separates Mesozoic platform carbonates of the ACP from carbonates to the SW in the AB. The clearly defined boundary between the basin (light blue and blue colours) and platform (green to purple colours) carbonate domains separates the AB in the SW part of the Aiza Block from the carbonate platform. An elongated NW-SE depression, i.e., an intra-platform basin, can be observed within the platform, open to the SE. As such, the Aiza intra-platform basin can be characterized as an embayment (Figure 9).
The map corresponding to the MES horizon (Figure 8c) represents an unconformity between the underlying carbonate sequence, primarily of Mesozoic age, and the overlying Pliocene-Pleistocene clastic sequence. The MES surface shows a slightly inclined ramp that descends towards the SW.
Above these horizons (BCP, TCP, and MES), the shallowest interpreted horizon is presented in the map shown in Figure 8d. Evident incised valleys align with the locations of synthetic extensional zones. This suggests that during the initial stages of fault growth, the progradation of the Po River drainage system exploited topographically low areas that developed between fault segments.
The 3D seismic data encompassing the Aiza area have been instrumental in generating a comprehensive 3D model specific to the study region (Figure 9).
The contour lines were created with a 25 ms TWT increment, using a smoothing increment of three and a refinement of one. Additional recorded parameters, including elevation time, are shown in Table 3.
This study incorporated a 2D regional seismic profile CROP-M16, obtained from the ViDEPI [37]. This profile has been included because its northeastern part intersects with the Aiza area (as shown in Figure 10a). Previous papers have suggested the presence of an apparent Dinaric frontal structure (i.e., structural antiform of unknown origin, marked with a yellow square in Figure 10b) and proposed that the southern Istrian offshore region is part of the External Dinarides (e.g., [5]). Figure 10a illustrates the position of this structure within the Aiza Block, along with other structural assumptions made in this paper.
The 3D perspective sheds light on the apparent relationship and spatial alignment of the structure, as well as on the transpressional-transtensional fault zone. Figure 10a highlights the position of composite seismic lines (CL-1 and CL-2) generated across the supposed Dinaric frontal structure [5]. However, Figure 10c,d clarifies the interpreted antiform that obviously has a distinctly different structural arrangement from what was initially perceived in Figure 10b. It is apparent that the subsurface “anticline” structure observed on CROP-M16 does not appear in its real shape due to its proximity to a major fault (Figure 10c). Moreover, this structure is situated within the slope of the carbonate platform (Figure 10d). The distortion observed can be attributed to subsurface discontinuities and insufficient resolution. Relying solely on the 2D seismic profile of CROP-M16, achieving accurate interpretations is challenging, given the presence of diffractions and events caused by nearby geologic structures. In this study, the recognition of these structures, including a major fault and the carbonate platform margin, was made possible through the analysis of 3D seismic data.

5. Discussion

The Aiza research area (Figure 1) is characterized by Permian to Middle Triassic sedimentation of predominantly clastic deposits ([3,8,22]; Figure 2). The onset of deposition of neritic carbonates all over the research area began with the upper Triassic Main Dolomite and continued throughout the Mesozoic and early Cenozoic in the Adriatic Carbonate Platform (ACP) domain. The Early Jurassic opening of the Adriatic Basin and separation of the ACP in Toarcian [10] was probably related to the reactivation of an inherited longitudinal Triassic normal fault of a Dinaric strike (NW-SE) in the southern part of the research area (Figure 3, Figure 5 and Figure 10).
During the Late Cretaceous to Palaeogene, the previously stable NW-SE striking platform margin was affected by normal faulting and south-directed extension. This was likely driven by a large-scale detachment, possibly occurring on the southern limb (backbulge) of the emerging Dinaric forebulge (Figure 11). The backbulge intra-platform basin, displaying a Dinaric orientation, is thought to originate from the reactivation of the Triassic fault network (Figure 5a). Similar but probably older intra-platform basins are reported also from the southern part of neighbouring tectonostratigraphic unit that belongs to the External Dinarides (Premuda and Lošinj islands, Figure 12), the area that was probably part of the southern (distal) limb of a wide Dinaric forebulge during the Late Cretaceous to Palaeogene ([4] and reference therein). Synsedimentary normal faulting is reported also along the northern (proximal) limb of the forebulge that during the Palaeogene evolved into a foredeep characterized by deposition of flysch [46].
This study utilised interactive interpretation techniques involving 3D visualisation to overcome limitations posed by 2D seismic data [39], particularly in addressing the ambiguously interpreted compressional structure mentioned by Del Ben [5]. As a result, longitudinal compressional structures parallel to the Dinaric orogenic front were not identified in the investigated Aiza research area, which thus remained part of the Adriatic foreland. The normal faults of Dinaric strike (NW-SE) were obviously not reactivated in the area during Palaeogene shortening when the External Dinarides were formed on the NE, and the frontal thrust is located close to the outer Kvarner islands ([2,4]; Figure 12).
However, transverse structures recognized along the eastern margin of the Aiza research area (Figure 5) play a crucial role in understanding the geological features of the wider Kvarner area. To contextualize the interpretation of the platform margin and other structural insights obtained by this research, a regional tectonic map was amended (Figure 12).
The interpretation of the carbonate platform margin in this study differs slightly from that presented by Grandić et al. [48]. This study suggests the continuity of regional transverse strike-slip faults and the assumed dissection of the once-linear carbonate platform margin. The NW-SE striking intra-platform basin is evident within the Aiza research area (Figure 9) and could be developed on top of Late Cretaceous to Paleogene extensional detachment (Figure 5a) that was probably reshaped as a hybrid flower structure during late Miocene (Figure 5b; [44]).
Strike-slip late Neogene faults recognized on seismic sections between Kvarner islands and Istria [2] are here extrapolated (thick black dashed line; Figure 12) and connected with the major sinistral transverse Kvarner fault identified within the Aiza research area (black solid line). The transverse fault was mapped onshore, along the eastern coast of Istria, and interpreted as a steep (subvertical) fault [18], rather than a thrust fault, as considered by Špelić et al. [2]. This complex transpressional-transtensional zone with an NNE-SSW strike, previously recognized as the Kvarner Fault System ([4], and references therein), may have been (re)activated during the Miocene transpression, resulting in the uplift of the Učka Mt. ridge. These fault displacements could have caused the left-lateral shift of the previously linear platform margin (Figure 12) along a reactivated transverse Triassic lineament ([8]; see Figure 8) during late Miocene (Messinian) tectonic reorganization. The transverse NNE-SSW striking Kvarner fault is oblique to the Dinaric strike (NW-SE) and does not dissect the NW-SE striking Pliocene normal faults (Figure 12). The later were probably (re)activated during SW crustal tilting in the distal foreland of the Northern Apennines. Subhorizontal late Quaternary cover of Dinaridic and Apenninic structures could imply recent subvertical subsidence of the foreland in between nowadays sub-vertically exhuming neighbouring orogenic belts, as illustrated in Figure 11 of [17]. The geometry of the related seismo-stratigraphical sequences presented in this paper depicts the multiple evolution of the common Adriatic foreland of the north-western Dinarides and Northern Apennines.
The structural complexity in this region could be attributed to the differential retreat of the Adriatic plate, leading to the segmentation of the Apennine thrust front [27]. This, in turn, resulted in different tectonic styles in the Southern and Northern Apennines [49,50]. The regional transverse (oblique) N-S oriented lineament across the Adriatic Sea [4] is inferred also from the N-S oriented structures in the central Adriatic that continue onshore in the central Apennines [27]. Thus, the differential retreat of the Adria related to the Late Neogene formation of the Apenninic structures could strongly affect the common Adriatic foreland. The activity of retreat-related transfer faults may have rotated and dissected the frontal Dinaric structures in the Kvarner area that were previously assumed to be continuous in front of the NW-SE striking External Dinarides.
The structural-tectonic framework in this area is highly intricate and sometimes inconsistent with the proven geological relationships in the Mesozoic to Cenozoic deposits on the Kvarner islands and Istria, as shown in Figure 12. It was very demanding to determine the entire stratigraphic development of the deposits present in the area covered by this study with sufficient certainty in its interpretation. It is strongly recommended that future studies in this area include a complete palinspastic analysis in order to obtain the age of regional events. Therefore, there is a pressing need for additional cross-sections to gain a more comprehensive understanding of the stratigraphic development in the studied area.

6. Conclusions

Geophysical data employed in this study have shed light on the deep structural and stratigraphic setting within the investigated part of the Kvarner and Istria offshore regions. The Mesozoic Adriatic Carbonate Platform to the Adriatic Basin transition developed during the Early Jurassic is characterised by a notably steep slope since its formation.
Geometry of identified Late Cretaceous to Palaeogene intra-platform basin suggests that it probably originated due to synsedimentary normal faulting, driven by an extensional detachment situated atop clastic Permo-Triassic sedimentary sequences. This fault system is situated along the SW margin of the Adriatic Carbonate Platform that was during the Late Cretaceous to Palaeogene situated on the southern limb of the then developing Dinaric forebulge.
The eastern margin of the investigated area has been significantly influenced by the Miocene activity of a transverse strike-slip fault, which is presumably a pivotal component of the broader Kvarner Fault System. This fault effectively separates the Dugi otok Basin to the east from the Istrian shelf on the western side. The geological (tectonic) characterisation of the Kvarner subsurface, as observed offshore, suggests that this system experienced its main phase of activity during the late Neogene, possibly during the Messinian age.
In contrast to prior interpretations, which regarded the antiformal structures observed on a CROP image partially intersecting the investigated part of the foreland as the outermost frontal structures of the Dinarides, this paper reinterprets them as transpressional structures that developed along the transverse strike-slip fault, known as the Kvarner fault.
Further research is needed to provide a more detailed characterisation of the faults that exhibit substantial displacement attributed to Quaternary tectonics. These results, obtained in this study, can serve as a valuable foundation for further interdisciplinary investigations. Integration of more detailed geophysical data, such as shallow seismic surveys, and geological information from wells is a prerequisite for the development of a more relevant geodynamic model for the Kvarner offshore area.
The findings presented here represent a significant advancement in our current comprehension of depositional systems, structural geometry, the tectonic significance of faults, and deformation processes within the Northern Adriatic foreland.

Author Contributions

Conceptualization, A.K. and T.K.; methodology, A.K.; software, A.K.; formal analysis, A.K.; investigation, A.K. and T.K.; resources, A.K.; writing—original draft preparation, A.K. and T.K.; writing—review and editing, A.K. and T.K.; visualization, A.K. and T.K.; supervision, T.K. All authors have read and agreed to the published version of the manuscript.

Funding

This research was funded by CROATIAN SCIENCE FOUNDATION (HRZZ IP-06-2016-1854): Geological and seismological aspects of geodynamics in Kvarner area–unveiling of the Kvarner fault (GEOSEKVA).

Data Availability Statement

The dataset used for this research can be used by the permission of the Croatian Hydrocarbon Agency (https://www.azu.hr/en).

Acknowledgments

The research was carried out as a part of the research project founded by the Croatian Science Foundation (HRZZ IP-06-2016-1854): Geological and seismological aspects of geodynamics in Kvarner area–unveiling of the Kvarner fault (GEOSEKVA). The authors would like to thank the Schlumberger company for donation of the Petrel academic software license and the Croatian Hydrocarbon Agency for the data permission without which the analysis presented in this work could not be conducted. The authors would also like to thank to the all reviewers for constructive suggestions that improved an earlier version of this paper.

Conflicts of Interest

The authors declare no conflict of interest. The funders had no role in the design of the study; in the collection, analyses, or interpretation of data; in the writing of the manuscript; or in the decision to publish the results.

References

  1. Hrvatski Geološki Institute—Croatian Geological Survey (HGI-CGS). Geological Map of the Republic of Croatia in Scale 1:300,000. Hrvatski Geološki Institut—Croatian Geological Survey, Zagreb. 2009. Available online: http://webgis.hgi-cgs.hr/gk300/default.aspx (accessed on 11 September 2022).
  2. Špelić, M.; del Ben, A.; Petrinjak, K. Structural setting and geodynamics of the Kvarner area (Northern Adriatic). Mar. Petrol. Geol. 2021, 125, 104857. [Google Scholar] [CrossRef]
  3. Grandić, S.; Kratković, I.; Rusan, I. Hydrocarbon potential assesment of the slope deposits along the SW Dinarides carbonate platform edge. Nafta 2010, 61, 325–338. [Google Scholar]
  4. Korbar, T. Orogenic evolution of the External Dinarides in the NE Adriatic region: A model constrained by tectonostratigraphy of Upper Cretaceous to Paleogene carbonates. Earth-Sci. Rev. 2009, 96, 296–312. [Google Scholar] [CrossRef]
  5. Del Ben, A. Interpretation of the CROP M-16 seismic section in the Central Adriatic Sea. Mem. Soc. Geol. Ital. 2002, 57, 327–333. [Google Scholar]
  6. Saftić, B.; Kolenković Močilac, I.; Cvetković, M.; Vulin, D.; Velić, J.; Tomljenović, B. Potential for the Geological Storage of CO2 in the Croatian Part of the Adriatic Offshore. Minerals 2019, 9, 577. [Google Scholar] [CrossRef]
  7. Anderson, H.; Jackson, J. Active tectonics of the Adriatic Region. Geophys. J. R. Astron. Soc. 1987, 91, 937–983. [Google Scholar] [CrossRef]
  8. Grandić, S.; Biancone, M.; Samaržija, J. Geophysical and Stratigraphic Evidence of the Adriatic Triassic Rift Structures. Mem. Soc. Geol. Ital. 2002, 57, 315–325. [Google Scholar]
  9. van Hinsbergen, D.J.J.; Torsvik, T.H.; Schmid, S.M.; Maţenco, L.C.; Maffione, M.; Vissers, R.L.M.; Gürer, D.; Spakman, W. Orogenic architecture of the Mediterranean region and kinematic reconstruction of its tectonic evolution since the Triassic. Gondwana Res. 2020, 81, 79–229. [Google Scholar] [CrossRef]
  10. Vlahović, I.; Tišljar, J.; Velić, I.; Matičec, D. Evolution of the Adriatic Carbonate Platform: Palaeogeography, main events and depositional dynamics. Palaeogeogr. Palaeoclimatol. Palaeoecol. 2005, 220, 333–360. [Google Scholar] [CrossRef]
  11. Picha, F.J. Late orogenic strike-slip faulting and escape tectonics in frontal Dinarides-Hellenides, Croatia, Yugoslavia, Albania and Greece. AAPG Bull. 2002, 86, 1659–1671. [Google Scholar]
  12. Schmid, S.M.; Bernoulli, D.; Fügenschuh, B.; Matenco, L.; Schefer, S.; Schuster, R.; Tischler, M.; Ustaszewski, K. The Alpine-Carpathian-Dinaridic orogenic system: Correlation and evolution of tectonic units. Swiss J. Geosci. 2008, 101, 139–183. [Google Scholar] [CrossRef]
  13. Markušić, S.; Stanko, D.; Korbar, T.; Sović, I. Estimation of near-surface attenuation in the tectonically complex contact area of the northwestern External Dinarides and the Adriatic foreland. Nat. Hazards Earth Syst. Sci. 2019, 19, 2701–2714. [Google Scholar] [CrossRef]
  14. Maesano, F.E.; Buttinelli, M.; Maffucci, R.; Toscani, G.; Basili, R.; Bonini, L.; Burrato, P.; Fedorik, J.; Fracassi, U.; Panara, Y.; et al. Buried alive: Imaging the 9 November 2022, Mw 5.5 earthquake source on the offshore Adriatic blind thrust front of the Northern Apennines (Italy). Geophys. Res. Lett. 2023, 50, e2022GL102299. [Google Scholar] [CrossRef]
  15. Prelogović, E.; Kuk, V.; Jamičić, D.; Aljinović, B.; Marić, K. Seizmotektonska aktivnost Kvarnerskog područja. In Proceedings of the First Croatian Geological Congress, Croatian Geological Society and Institute of Geology, Opatija, Croatia, 18–21 October 1995; pp. 487–490. [Google Scholar]
  16. Kastelic, V.; Carafa, M.M.C. Fault slip rates for the active External Dinarides thrust-and-fold belt. Tectonics 2012, 31, TC3019. [Google Scholar] [CrossRef]
  17. Korbar, T.; Markušić, S.; Hasan, O.; Fuček, L.; Brunović, D.; Belić, N.; Palenik, D.; Kastelic, V. Active Tectonics in the Kvarner Region (External Dinarides, Croatia)—An Alternative Approach Based on Focused Geological Mapping, 3D Seismological, and Shallow Seismic Imaging Data. Front. Earth Sci. 2020, 8, 582797. [Google Scholar] [CrossRef]
  18. Petrinjak, K. Sedimentološke Karakteristike Južnog Dijela Istarskog Fliškog Bazena (Sedimentological Characteristics of the Southern Part of the Istrian Flysch Basin). Ph.D. Thesis, University of Zagreb, Zagreb, Croatia, 14 July 2021. [Google Scholar]
  19. Korbar, T.; Fuček, L.; Husinec, A.; Vlahović, I.; Oštrić, N.; Matičec, D.; Jelaska, V. Cenomanian Carbonate Facies and Rudists along Shallow Intraplatform Basin Margin-the Island of Cres (Adriatic Sea, Croatia). Facies 2001, 45, 39–58. [Google Scholar] [CrossRef]
  20. Moro, A.; Ćocović, V. Upper Turonian-Santonian slope limestones of the Islands of Premuda, Ist and Silba (Adriatic Coast, Croatia). Geol. Croat. 2013, 66, 1–13. [Google Scholar] [CrossRef]
  21. Fuček, L.; Matičec, D.; Vlahović, I.; Oštrić, N.; Prtoljan, B.; Korolija, B.; Korbar, T.; Husinec, A.; Palenik, D. Basic Geologic Map of the Republic of Croatia 1:50,000; Hrvatski Geološki Institute—Croatian Geological Survey, Zavod za Geologiju—Department of Geology: Zagreb, Croatia, 2015. [Google Scholar]
  22. Jerinić, G.; Jelen, B. Palynological and Stratigraphical Problems of Middle Triassic Siliciclatics from Croatian Off-shore Well Susak More-1 (Adriatic Sea) and NW Slovenia. Geol. Croat. 1994, 47, 1–24. [Google Scholar]
  23. Hsü, K.J.; Montadert, L.; Bernoulli, D.; Bianca Cita, M.; Erickson, A.; Garrison, R.E.; Kidd, R.B.; Mèlierés, F.; Müller, C.; Wright, R. History of the Mediterranean salinity crisis. Nature 1977, 267, 399–403. [Google Scholar] [CrossRef]
  24. Doglioni, C.; Prosser, G. Fold uplift versus regional subsidence and sedimentation rate. Mar. Petrol. Geol. 1997, 14, 179–190. [Google Scholar] [CrossRef]
  25. Velić, J.; Malvić, T. Depositional conditions during Pliocene and Pleistocene in Northern Adriatic and possible lithostratigraphic division of these rocks. Nafta 2011, 62, 25–32. [Google Scholar]
  26. Royden, L.; Patacca, E.; Scandone, P. Segmentation and configuration of subducted lithosphere in Italy: An important control on thrust-belt and foredeep-basin evolution. Geology 1987, 15, 714. [Google Scholar] [CrossRef]
  27. Scrocca, D. Thrust front segmentation induced by differential slab retreat in the Apennines (Italy). Terra Nova 2006, 18, 154–161. [Google Scholar] [CrossRef]
  28. Finetti, I.R.; Boccaletti, M.; Bonini, M.; del Ben, A.; Geletti, R.; Pipan, M.; Sani, F. Crustal section based on CROP seismic data across the North Tyrrhenian–Northern Apennines–Adriatic Sea. Tectonophysics 2001, 343, 135–163. [Google Scholar] [CrossRef]
  29. Amorosi, A.; Maselli, V.; Trincardi, F. Onshore to offshore anatomy of a late Quaternary source-to-sink system (Po Plain-Adriatic Sea, Italy). Earth-Sci. Rev. 2016, 153, 212–237. [Google Scholar] [CrossRef]
  30. Pezzo, G.; Petracchini, L.; Devoti, R.; Maffucci, R.; Anderlini, L.; Antoncecchi, I.; Billi, A.; Carminati, E.; Ciccone, F.; Cuffaro, M.; et al. Active Fold-Thrust Belt to Foreland Transition in Northern Adria, Italy, Tracked by Seismic Reflection Profiles and GPS Offshore Data. Tectonics 2020, 39, e2020TC006425. [Google Scholar] [CrossRef]
  31. Mattavelli, L.; Novelli, L.; Anelli, L. Occurrence of hydrocarbons in the Adriatic basin. Spec. Publ. Eur. Assoc. Pet. Geosci. Eng. 1991, 1, 369–380. [Google Scholar]
  32. Malvić, T.; Đureković, M.; Šikonja, Ž.; Čogelja, Z.; Ilijaš, T.; Kruljac, I. Exploration and production activities in northern Adriatic Sea (Croatia), successful joint venture INA (Croatia) and ENI (Italy). Nafta 2011, 62, 287–292. [Google Scholar]
  33. Velić, J.; Malvić, T.; Cvetković, M.; Velić, I. Stratigraphy and petroleum geology of the Croatian part of the Adriatic Basin. J. Pet. Geol. 2015, 38, 281–300. [Google Scholar] [CrossRef]
  34. Đurasek, N.; Frank, G.; Jenko, K.; Kužina, A.; Tončić-Gregl, R. Contribution to the Understanding of Oil-Geological Relations in NW Adriatic Area; INA-Naftaplin: Zagreb, Croatia, 1981. [Google Scholar]
  35. Malvić, T.; Velić, J.; Cvetković, M.; Vekić, M.; Šapina, M. Definition of new Pliocene, Pleistocene and Holocene lithostratigraphic units in the Croatian part of the Adriatic Sea (shallow offshore). Geoadria 2015, 20, 85–108. [Google Scholar]
  36. Šapina, M.; Vekić, M. New lithostratigraphic units in the Croatian offshore and their definition in the “R” programming language. Rudarsko-Geološko-Naftni Zbornik 2015, 30, 13–24. [Google Scholar] [CrossRef]
  37. ViDEPI. Available online: https://www.videpi.com/videpi/videpi.asp (accessed on 9 October 2022).
  38. Taner, M.T.; Koehler, F.; Sheriff, R.E. Complex seismic trace analysis. Geophysics 1979, 44, 1041–1063. [Google Scholar] [CrossRef]
  39. Byørlykke, K.; Avseth, P.; Faleide, J.I.; Gabrielsen, P.T.; Gabrielsen, R.H.; Hanken, N.M.; Hellevang, H.; Høeg, K.; Jahren, J.; Johansen, S.E.; et al. Petroleum Geoscience—From Sedimentary Environments to Rock Physics, 2nd ed.; Byørlykke, K., Ed.; Springer: Berlin/Heidelberg, Germany, 2015. [Google Scholar] [CrossRef]
  40. Bello, S.; Lavecchia, G.; Andrenacci, C.; Ercoli, M.; Cirillo, D.; Carboni, F.; Barchi, M.R.; Brozzetti, F. Complex trans-ridge normal faults controlling large earthquakes. Sci. Rep. 2022, 12, 10676. [Google Scholar] [CrossRef] [PubMed]
  41. Ercoli, M.; Carboni, F.; Akimbekova, A.; Carbonell, R.B.; Rinaldo, M. Evidencing subtle faults in deep seismic reflection profiles: Data pre-conditioning and seismic attribute analysis of the legacy CROP-04 profile. Front. Earth Sci. 2023, 11, 1119554. [Google Scholar] [CrossRef]
  42. Al-Masgari, A.A.-S.; Elsaadany, M.; Abdul Latiff, A.H.; Hermana, M.; bin Hamzah, U.; Babikir, I.A.; Adeleke, T.; Sohail Imran, Q.; Al-Bared, M.A.M. Seismic Sequence Stratigraphic Sub-Division Using Well Logs and Seismic Data of Taranaki Basin, New Zealand. Appl. Sci. 2021, 11, 1226. [Google Scholar] [CrossRef]
  43. Coffeen, J.A. Interpreting Seismic Data, 1st ed.; Pennwell Corp.: Tulsa, OK, USA, 1984. [Google Scholar]
  44. Huang, L.; Liu, C.-Y. Three types of Flower Structures in a Divergent-Wrench Fault Zone. J. Geophys. Res. Solid Earth 2017, 122, 10478–10497. [Google Scholar] [CrossRef]
  45. Kužina, A. Project Assignment for the Offshore Exploration Well Susak More-1 (SM-1) (Projektni Zadatak za Off Shore Istražnu Bušotinu SUSAK More-1 (SM-1)); INA-Naftaplin: Zagreb, Croatia, 1986. [Google Scholar]
  46. Petrinjak, K.; Budić, M.; Bergant, S.; Korbar, T. Megabeds in Istrian Flysch as markers of synsedimentary tectonics within the Dinaric foredeep (Croatia). Geol. Croat. 2021, 74, 99–120. [Google Scholar] [CrossRef]
  47. DeCelles, G.P.; Giles, A.K. Foreland basin systems. Basin Res. 1996, 8, 105–123. [Google Scholar] [CrossRef]
  48. Grandić, S.; Kratković, I.; Balić, D. Peri-Adriatic platforms Proximal Talus reservoir potential (part 1). Nafta 2013, 64, 147–160. [Google Scholar]
  49. Butler, R.W.H.; Mazzoli, S.; Corrado, S.; de Donatis, M.; di Bucci, D.; Gambini, R.; Naso, G.; Nicolai, C.; Scrocca, D.; Shiner, P.; et al. Applying thick-skinned tectonic models to the Apennine thrust belt of Italy—Limitations and implications. AAPG Memoir. 2004, 82, 647–667. [Google Scholar]
  50. Lavecchia, G.; de Nardis, R.; Ferrarini, F.; Cirillo, D.; Bello, S.; Brozzetti, F. Regional Seismotectonic Zonation of Hydrocarbon Fields in Active Thrust Belts: A Case Study from Italy. In Building Knowledge for Geohazard Assessment and Management in the Caucasus and Other Orogenic Regions; NATO Science for Peace and Security Series C: Environmental Security; Bonali, F.L., Pasquaré Mariotto, F., Tsereteli, N., Eds.; Springer: Dordrecht, The Netherlands, 2021. [Google Scholar] [CrossRef]
Figure 1. (a) Location, palaeoenvironmental after Grandić et al. [3], and tectonic map after Korbar [4] of the study area, including the position of the Aiza research area, locations of the two exploration wells, Susak more-1 and Alessandra-1, situated offshore Kvarner and southern Istria. Contours delineate the shorelines of the mainland and the Kvarner islands. A dashed-dotted line indicates position of the 2D regional seismic profile CROP-M16. Inset shows map’s location in the Northern Adriatic area and the thrust fronts of the surrounding orogenic belts. (b) The frame of the Aiza 3D Block depicts placement of the seismic sections, including inlines, crosslines, composite lines, and 2D seismic lines. These sections have been selected to provide a clear and representative reflection of the subsurface relationships within the exploration area covered by seismic data.
Geosciences 13 00323 g001
Figure 2. Stratigraphic correlation of Alessandra-1 and Susak more-1 wells with main prominent horizons, adapted from Špelić et al. [2]. These horizons include BCP (Base Carbonate Platform), TCP (Top Carbonate Platform), MES (Messinian Erosional Surface), and PlQh (Plio-Quaternary horizon). Well positions are depicted in relation to the investigated Aiza Block and the 3D seismic area available for this research.
Geosciences 13 00323 g002
Figure 3. (a) Location of seismic profiles. (b) Seismic profile IL 9435 with interpreted horizons tentatively calibrated using data from the remote Susak more-1 well. The position of the carbonate platform margin is indicated by the red solid line, extrapolated by the red dashed line. (c) Seismic section XL 2069 illustrates the platform escarpment on both the NW and SE sides. (d) Seismic section IL 10330 reveals the SE slope of the platform, along with the presence of extensional faults (short red solid lines) and indications (red dashed lines) of strike-slip faulting intersecting the profile.
Geosciences 13 00323 g003
Figure 4. Horizon mapping on seismic section XL 2844: (a) Location of seismic profile; (b) the uninterpreted classic seismic view with highlighted position of four main horizons (yellow arrows); (c) the seismic attribute Cosine of phase view with the interpreted BCP horizon; (d) the seismic attribute 3D edge enhancement view with the interpreted PlQh and TCP horizons.
Geosciences 13 00323 g004
Figure 5. Structural-stratigraphic interpretation of seismic sections IL 9910 and XL 2844: (a) On seismic section IL 9910, the major structural features include a pronounced platform margin marked by a steep slope (indicated by the thick red line on the left) and a relatively simple intra-platform basin (represented by the two thick red lines on the right). Thin red lines depict extensional faults. Abbreviations used: Adratic Basin (AB), Adriatic Carbonate Platform (ACP), and Tethyan Mega Platform (TMP). (b) Seismic section XL 2844 reveals a more complex intra-platform basin within a releasing bend (listric fault, thick red line on the left) and a restraining bend (strike-slip fault, middle thick red line). Some faults within the hybrid flower structure exhibit signs of reactivation (double arrows). Additionally, preserved anticlinal structures formed as a result of fault reactivation with an opposite character are indicated by black arrows. Multiple reflectors are marked by “m”. (c) Location of the seismic sections is shown for reference.
Geosciences 13 00323 g005
Figure 6. (a) Uninterpreted and (b) interpreted XL 1544 seismic section. This section depicts chronostatigraphic Plio-Quaternary sequences of the study area. The grey rectangles represent cropped areas displayed in (c) and the black arrows highlight the presence of gas chimneys. (c) Seismic sequences, denoted as SEQ1 to SEQ7, are described here along with their defining characteristics. (d) Inset displays the location of the section for reference.
Geosciences 13 00323 g006
Figure 7. Acquired tectonic configuration based on the interpretation of seismic sections. The fault polygons are represented in a 3D view from three different perspectives: (a) from the south; (b) from the southwest; and (c) from the top. Time-slice maps have been selected at six distinct depths: (d) −3000 ms, (e) −2500 ms, (f) −2000 ms, (g) −1500 ms, (h) −1000 ms, and (i) −500 ms. The sharp transitions from high to low amplitudes on these maps represent significant variations in elevation. Red lines delineate the primary faults within the study area, while black lines indicate the platform’s margin and white lines delineate the edges of the intra-platform basin.
Geosciences 13 00323 g007aGeosciences 13 00323 g007b
Figure 8. Time-structural maps for the: (a) BCP; (b) TCP; (c) MES; and (d) PlQh horizons. Isochron intervals are set at 25 ms TWT for (a), (b), and (c), while (d) has a 10 ms TWT isochron interval. The grey outlines represent all seismic sections referenced in this paper.
Geosciences 13 00323 g008
Figure 9. The 3D model illustrates the configuration of platform carbonates within the Aiza exploration Block. The upper image of TCP surface depicts the Adriatic carbonate platform margin and the intra-platform basin, while the lower image of the BCP surface depicts the dome-shaped geometry of the basement. To enhance visibility, a vertical exaggeration factor of five has been applied to the Z-scale. The contour interval is 25 ms TWT.
Geosciences 13 00323 g009
Figure 10. (a) Location of the sections, with highlighted interpretation of the carbonate platform margin (thick black line) and the major Kvarner Fault System marked by red line; (b) seismic section CROP-M16, with a black rectangle indicating the Aiza area and a yellow rectangle indicating the apparent structure previously recognized by [5]; (c) composite section CL-1; (d) composite section CL-2. Both sections include interpreted regional horizons and the Kvarner Fault System; the Z-scale in these figures has a vertical exaggeration factor of five.
Geosciences 13 00323 g010
Figure 11. Schematic cross-section of the Dinaric Foreland Basin system from the late Cretaceous to Palaeogene (modified after [4,47]), with the proposed position of the Aiza area (red rectangle). Not to scale.
Geosciences 13 00323 g011
Figure 12. Geological map of the Istria and Kvarner region (adopted and modified after Špelić et al. [2] and references therein), integrated with findings from Grandić et al. [48]. This map encompasses the significant structural insights obtained by this research, such as the delineation of the Mesozoic Adriatic carbonate platform margin and the interpretation of major faults, including their extrapolation towards the fault system identified by Špelić et al. [2].
Geosciences 13 00323 g012
Table 1. Spatial framework of the Aiza Block and position of Susak more-1 and Alessandra-1 wells.
Coordinate Reference SystemEPSG: 32633—WGS 84/UTM Zone 33N
Aiza BlockLatitudeMin: 44°04′7.4065″ NMax: 44°24′16.1728” N
LongitudeMin: 13°37′41.3080″ EMax: 14°04′35.2727” E
Time (ms)Min: −4498.50Max: 1.50
Susak more-1 wellLatitude44°22′10.8875″ N
Longitude13°52′11.0064″ E
Alessandra-1 wellLatitude44°02′6.2100″ N
Longitude13°53′38.3200″ E
Table 2. Geometric parameters of the 3D model.
Grid cells (nIxnJxnK)672 × 503 × 1
Grid nodes (nIxnJxnK)673 × 504 × 2
Total number of grid cells1,014,048
Total number of grid nodes1,356,768
Total number of 2D cells338,016
Total number of 2D nodes339,192
Total number of defined 2D nodes194,040
Average X increment50
Average Y increment50
Average Z increment (along pillar)1373.632
Table 3. Model parameters for 3D platform carbonate facies.
AxisMinMaxDelta
X391,447.35425,047.3533,600.00
Y4,883,952.894,909,102.8925,150.00
Time−3485.86−646.262839.60
Lat44°06′2.5600″ N44°19′52.7607″ N0°13′50.2007″
Long13°38′18.7450″ E14°03′48.7450″ E0°25′29.7682″
Disclaimer/Publisher’s Note: The statements, opinions and data contained in all publications are solely those of the individual author(s) and contributor(s) and not of MDPI and/or the editor(s). MDPI and/or the editor(s) disclaim responsibility for any injury to people or property resulting from any ideas, methods, instructions or products referred to in the content.

