Review

Cost–Benefit Analysis and Risk Assessment for Mining Activities in Terms of Circular Economy and Their Environmental Impact

by
Evangelos Machairas
and
Emmanouil A. Varouchakis
*
School of Mineral Resources Engineering, Technical University of Crete, 73100 Chania, Greece
*
Author to whom correspondence should be addressed.
Geosciences 2023, 13(10), 318; https://doi.org/10.3390/geosciences13100318
Submission received: 26 May 2023 / Revised: 26 September 2023 / Accepted: 29 September 2023 / Published: 23 October 2023

Abstract

:
Mining activities are prolific worldwide in light of the perpetual production of metal. The high need for metal materials in human life necessitates the development of mining operations, especially in places characterized as being highly enriched in metal ions. After the separation of beneficial and non-beneficial materials, industrial enrichment mechanisms take place to increase metal output. These mechanisms, known as metallurgical procedures, produce a vast volume of mining/metallurgical waste (MMW) at final disposal sites. MMW’s composition usually includes metal filings in low-pH site conditions. Thus, the environmental pollution hazard is high unless sustainable methods are implemented to reduce both heavy and toxic metals’ concentration in MMW at every disposal site. The scope of this review is to determine how cost–benefit analysis (CBA) and risk assessment (RA) could contribute positively to (a) the environmental effect of MMW reduction, (b) decreasing the environmental rehabilitation cost, and (c) research into economically sustainable methods of recovering metal from MMW.

1. Introduction

Cost–benefit analysis should be applied to evaluate a business decision or operational activity before implementation [1]. The main advantage is the provision of required economic assessment while taking into account scientific evidence about each decision’s correctness translated into monetary terms. CBA enhances the objective assessment by describing each technical project’s needs with numerical index values [2].
Thus, the separation of beneficial from costly decisions is easy to accomplish. On the other hand, this modeled system would not be suitable for all project types because of their varied natures. However, this could already be seen in microeconomic estimations (MEs) and incremental assessments (IAs) [1]. In waste management of mining activities, CBA is used to provide a comparison between a possible scenario’s costs and benefits (in terms of circular economy) and environmental safety [3,4]. The first scenario is described by the benefits and cost of rare earth elements (REEs), strategic metals (SMs), or other precious metal (PM) recovery methods. The second scenario is described by the acceptance of configured penalty costs for non-compliance with environmental legislative requirements [5,6]. The scope of this methodology is the extraction of sustainable engineering solutions for mining waste management through implementing environmental safety requirements.
For this reason, this scientific study involves an industrial mode of work activities, which prevents the free disposal of mining wastes in the ground area. This contributes positively to hazard elimination for metal and acidic ion distribution in the downstream area. Exported results from CBA enhance the adoption of such an industrial mode as an environmental and geoscientific prerequisite.
CBA is suitable for two scenarios, including applicable mathematic models to complete all their required tasks. The main disadvantages of each business decision are the higher productivity cost of recovery methods in the first scenario and the lack of probable financial gains combined with high economic charge in the second scenario. Thus, tasks of CBA could evaluate the sustainability of each scenario based on indicators of economic rate of return (ERR), and long-term perspective (LTP).
ERR refers to the ratio between total beneficial monetary value by the annual metal prices’ configuration and economic net present value. ERR examines the economic sustainability of each project, focusing on immediate financial gains on the metal market, not including potential penalty costs due to environmental non-conformances, and total weighted investment cost of the recovery process. It has to be mentioned that ERR is inextricably combined with microeconomic estimation (ME). The ME provides information based on the supply and demand of the metal marketplace. Values of metals’ supply and demand are determined by the requirements of industrial applications [7,8,9,10]. As a result, there is a need for methodologies that could determine future industrial needs with great precision [11].
The long-term perspective provides the economic risk assessment according to two possible scenarios: the first scenario contains the implementation of environmental protection mechanisms and the second scenario involves acceptance of the total expected annual penalty cost. This economic risk assessment could be accurate for a short time period (such as 10 years), due to possible future environmental legislative updates or other parameters that could not be predicted at the present time. This risk assessment estimates the economic comparison between the 10-year sum price of the annual weighted investment cost and the sum price of the annual accepted penalty cost [1,2].
CBA is an economic assessment tool which depends on the nature of work activities and is tailored for their cost and probable benefit determination [1].
This review paper contains the following: (a) a description of environmental pollution mechanism–situation analysis (Section 2); (b) a suggested engineering methodology for metal recovery which is based on scientific experimental conditions (Section 3 and Section 4); (c) an overview of the CBA and the objectives that should be determined (Section 5 and Section 6); (d) the implementation of CBA tailored to the suggested case scenario and its aims (Section 7); (e) a discussion of the extracted results (Section 8 and Section 9).

2. Environmental Pollution Mechanism—Situation Analysis

Heavy metal ions (HMIs) (Cd, Cr, Pb, As, Ni, Cu, Zn), precious metal ions (PMIs) (Au, Ag, Pt), base metal ions (BMIs) (Fe, Al), and strategic metal ions (SMIs) (Li, Co, Ta, Pd, Nb, and rare earth elements (REEs)) exist in acid mining tailings (AMTs) [12,13,14]. These ions are dissolved in the final disposal site’s aqua environment. The wastewater in this disposal area is extracted by mineral enrichment activities, as shown in Figure 1. As a result, it already contains low amounts of chemical acids. By the addition of metal ions, chemical redox processes begin. So, the overall pH becomes lower [15,16,17].
The dissolved base metal ions (BMIs) in acid mine tailings (AMTs) are Fe2+, Fe3+, Al2+, Al3+, Mn2+, Cu+, Ni+, and Ni2+. Dissolved precious metal ions (PMIs) in AMTs are Ag−2–+3, Au−3–+5, and Pt−3–+6 [18]. Major strategic metal ions (SMIs) in AMTs are Li+, Co−3–+5, Ta−3–+5, Pd 0–+4, Nb−3–+5, etc. SMIs consist of rare earth elements (REEs) such as La, Ce, Pr, Nd, Pm, Sm, Eu, Gd, Tb, Dy, Ho, Er, Th, Yb, Lu, Y, and Sc. Most of them are present as chemical oxides downstream of AMTs [18].
Plenty of BMIs and PMIs exist near acid mine drainage (AMD) as native diluted ions. Lower concentrations of them, as chemical salts, are found in downstream places [19]. Metal ions’ different ranges of concentration depend on their specific weight and their ability to form chemical bonds with non-metallic elements. The presence of low pH in tailings has a catalytic impact on ionic disintegration procedures. Positive metal ions, which exist in high concentrations, make chemical bonds with acidic roots such as (SO3)2−, (SO4)2−, (CO3)2−, and (NO3). Thus, the produced chemical salts precipitate in the downstream area of the final deposit place, as shown in Figure 2.
The cost of adverse environmental impact treatment is proportional to the concentration of metal ions in mining tailings [17,20,21]. The removal processes of these metal ions are required to minimize environmental pollution hazards [3,19,22,23,24].
Conversely, there is a high industrial operational cost of treatment units for mining tailings. The productivity cost consists of installation and operational activities for metal ions removal [25,26,27,28].
Figure 2. Distribution of metal ions as a function of pH of water samples collected near mining sites and from downstream rivers (based on [21]).
Geosciences 13 00318 g002
CBA methodology could compare this productivity cost with possible financial gains by recovering raw material economic utilization and reducing environmental treatment costs [2,29,30,31]. Furthermore, CBA would also provide a comparative economic assessment between primary metal mining productivity cost and recovery metal industrial units’ installation and operation [20,32].

3. Methodology of Metal Recovery by Mining Tailings

Recovery is one of the most essential mechanisms in mining waste management. Ensuring high amounts of metals are recovered from abandoned mining tailings contributes positively to environmental protection and the reuse of wastes, enabling a move toward a circular economy, and meeting the requirements of relevant international and European legislation.
Operation costs comprise one of the most significant factors which inhibit the implementation of recovery activities. Therefore, it is scientifically important to explore engineering techniques to increase the efficiency of the whole procedure [33,34]. As a result of such research, there is potential for metal recovery to be more sustainable on an industrial scale.
The efficiency of metal recovery is determined by the calibration of pH, temperature, concentration in acids (metal’s ability to form stronger chemical bonds by producing symplex chemical salts), and the gravity force of metals (due to their specific weight, while precipitating in the downstream area) [35,36,37].
According to scientific studies, recovery efficiency is proportional to the addition of acids, catalytic organic–inorganic compounds, and microbes [38,39,40,41,42,43]. Aside from the chemical reagents and microbes’ presence, an important role is the optimal residence time in which plenty of metals create symplex ionic structures and precipitate downstream.
A metal recovery efficiency of up to 95% is achieved by the four stages of oxidation, using H2SO4 and HCL (in 1st step), HCL and H3PO4 (in 2nd, 3rd, and 4th steps). The procedure is carried out in a temperature range of under 18–22 °C [39].
The catalysts’ role could be replaced by the action of microbes/bacteria [39] or other organic compounds [39,44]. The presence of microbes and bacteria reduces the costs of chemical mass flow in large amounts [42].
In other experimental studies, an 80–95% efficiency of REEs and other metals recovery is achieved by combining chemical (organic compounds, catalysts, acids) and biological reagents mix and nanomembranes NF [44,45]. NF is used in recovery procedures to filtrate clear metal ions or acidic roots and separate each other by the chemical salts’ symplex ions. In the following step, the use of extra chemical and biological reagents increases the ionic separation of metals and non-metals, making the creation of a nanomembrane more efficient.
The optimal combination mechanism of the parameters (chemical and biological reagents, temperature, time of residence, etc.), except the recovery efficiency increment, ensures reduced energy consumption in the process. Sustainability of the whole recovery operation assumes the optimization of the following factors [45,46,47,48]:
Chemical and microbial/bacterial reagents mass–flow ratio;
Energy consumption and required equipment.
On an industrial scale, recovery mechanisms are implemented in three or four stages. Each stage involves pH reduction downstream of chemical salts, filtration, and drying of sunk material. The floated material from stage one is input to the second enrichment stage. The following diagram presents the whole flow scheme of the recovery operation.

4. Case Study Scenario on Metal Recovery by Mining Tailings

This section examines a case scenario: metal recovery using gold mining tailings. The two base parameters that need to be determined to evaluate the economic sustainability of this operation are (a) the costs of the chemical compounds and (b) the energy mass flow.
The flow scheme for the case scenario of metal recovery is shown in Figure 3. This refers to the mining waste management procedure for an average mass of tailings of 150,000,000 kg annually [49,50]. Considering the number of working days per year, 300, the daily average mass of waste that needs to be treated, in terms of recovery procedures, is 500,000 kg/day.
The case flow scheme of metal recovery involves three stages per step. Reactors, which are used per step, must be able to extract metal materials by adding chemical or microbial compound catalysts. At the same time, a blender machine provides the required rpm to accelerate the precipitation of produced chemical salts [51]. After each step, sunk material is filtrated, and the floated material is input to the next stage of recovery.
The working nature of such a project involves a circular system process, which requires an excellently organized schedule plan. As a result, autonomous machinery equipment is preferable due to its ability to carry out well-modeled process activities.
Figure 3 shows the input volume of waste per stage, estimated at 83 m3. The required residence time of each stage is two hours. So, after a residence time of 2 h for the 1st volume part of the tailings in the 1st stage and its filtration, the 2nd volume part of the tailings is input to the reactor of stage 1, while the floated material of the treated tailing part is input into the reactor in the 2nd stage.
The duration of beneficial metals’ recovery for each part of mining tailings is estimated to be 18 h.
Thus, total metal recovery by the daily volume of mining tailings is achieved after 20 working hours. Figure 4 shows this project type’s daily schedule plan to consider the work’s nature.
This hypothetic schedule plan implements the ratio of chemical acids and catalysts mentioned in the experimental scientific study [39] to achieve the expected efficiency of metal extraction >95%.
The reported concentration of hydrochloric acid (HCL) has a range between 0.5 and 1 M. In the case study scenario, the provided concentration of HCL is equal to 0.5 M for both stages 1 and 2.
The total mass of hydrochloric acid in each stage of recovery is estimated to be 568 kg.
The next stage of recovery is achieved through catalysts’ actions in low-pH conditions. Due to its efficiency in metal recovery, the catalysts used for this are D2EHPA (extraction of base metals) or Cyanex 923 (extraction of REE’s). The P2O5/(Dissolution)aq ratio is 1566 mg/Lt, and the corresponding ratio for Cyanex 923 is about 0.3 M.

5. Overview of CBA

The scope of CBA is to analyze, assess, and identify an operational project’s cost and its benefits. CBA evaluates each business decision’s economic sustainability or non-sustainability according to each project’s schedule plan. CBA’s framework comprises seven main steps and five major study subjects [1].

5.1. Main Steps of CBA

  • Description of the Context: This step describes the social, economic, and political background of the local country where the project will occur. So, it is necessary to mention the socioeconomic situation (e.g., GDP growth/degrowth, demographic conditions, etc.), the existing economic policy, the operation activities development, and the flexibility of the legislation policy.
  • Objectives Definition: By the “Description of the Context”, the effects of the project on the local society, economy, and environment are identified for analysis. Furthermore, evidence of the project’s benefits to local society is mandatory. These benefits have to meet the requirements of current legislation.
  • Project Identification: The project identification consists of (a) physical equipment (human resources, machinery, etc.) that is going to be used and (b) the organization that will be responsible for quality control in the project. These factors ensure the operation’s efficiency in an environmentally friendly mode.
  • Technical and Environmental Sustainability: This step includes the following components: (a) a strategic analysis in which the reasons for approving each business decision are mentioned; (b) required job positions for implementing the project’s phases; (c) human resources and responsibilities; (d) environmental protection plan during work activities; (e) total project management chronodiagram (considering milestones, significant tasks, critical pathways, etc.); (f) a whole cost estimation based on the previous schedule.
  • Financial Analysis: Financial analysis includes the following components: (a) the project’s profitability to its owner and administration; (b) financial sustainability projections, according to positive economic balance maintenance, considering productivity and procurement costs (e.g., cost of used equipment, job salaries, cost of possible mistakes, etc.).
  • Economic Analysis: The results from the financial analysis are evaluated, and more sustainable mechanisms are implemented to reduce projected financial losses. Based on the previous financial assessment, this step reduces indirect taxes and general financial burdens by alternative operational procedures.
  • Risk Assessment: Risk assessment considers a combination of the project’s probabilistic analysis, quality control analysis, and hazard analysis. Thus, it contributes positively to identifying the critical tasks that may negatively impact a project’s development and a risk prevention plan (RPP) is formulated accordingly.

5.2. Major CBA’s Subjects of Study

1.
Cost of Opportunities: Opportunity cost (CO) invests the loss of potential gain from other alternative solutions when one is characterized as the ideal solution. Often, approved business decisions—which have been chosen according to the financial growth rationale—may negatively impact the whole business plan because of other parameters that have not been considered. The ideal project solution has to adopt the Q-C-T (quality–cost–time) pattern.
2.
Long-Term Perspective: Long-term perspective (LTP) comprises 10–30 years of project work activities. In this task of the CBA, the value of future costs and benefits is estimated, taking into consideration all of the possible effects of hazards on the project’s life. So, the identification of hazards is mandatory. Thus, the CBA evaluates the hazards and marks them as approved or unapproved; by this evaluation, the project’s critical pathway is extracted.
3.
Economic Performance Calculation: Project objectives have monetary value (positive for benefits and negative for costs). The CBA is based on these values, assessing the effectiveness of each objective, respectively. This assessment characterizes the total project’s performance as beneficial or not, in accordance with economic net present value (ENPV) and economic rate of return (ERR) indicators.
4.
Microeconomic Estimation: Each project, in addition to its environmental or financial impact, has a social impact. As a pre-operation microeconomic study, the CBA has to determine and calculate economic performance factors on this path. Direct environmental and financial effects are taken into consideration by the ENPV; otherwise, indirect effects, such as social effects (e.g., operation approval or disapproval for the whole area population, problems in human resources, etc.), have to be reduced to the lowest amount. Through the elimination of indirect effects for the future, a better-modeled analysis is achieved.
5.
Incremental Assessment: Incremental assessment (IA) compares two possible scenarios according to the project’s activities. The first scenario includes implementing mechanisms, procedures, or environmental safety measures (e.g., equipment to be used, job positions, etc.) according to the legislation and their costs/benefits. The second scenario is described through risk approval and its possible penalty cost. Thus, each scenario is assessed by ENPV, ERR, and total CBA. In this comparison, mathematical models are applied to obtain each scenario’s efficiency determination. According to the IA, a cash-flow analysis can be yielded for each applicable scenario, especially when perpetual mechanisms (recovery/recycling mechanisms in circular economy) show low ERR indicators.

6. Methodology and Process of CBA

The methodology of the CBA provides a socioeconomic assessment of each current project. The tasks of the CBA vary for every technical project, but the methodology tasks remain constant as a standard. So, the CBA should fulfill the seven steps mentioned in Section 5.1.
The CBA process chain consists of the following targets, which should be determined accounting for pre-operation strategic management [1,4,29]:
  • Objective definition;
  • Scope definition;
  • Project impacts/monetary evaluation;
  • Identification and responsibilities/work sharing among involved stakeholders;
  • Financial assessment based on project impacts evaluation;
  • Approval or non-approval of operational activities;
  • Total sensitivity analysis.
By this methodology, infrastructure activities of each project type are characterized as socioeconomically and environmentally feasible [29,51].
Infrastructures consist of recycling mechanisms, equipment used, human work teams, costs of plant installations required, chemical reagents, etc. These factors are determined by mathematical formulas to describe their economic impact on the project’s total cost. These formulas are specific to each target of the CBA. The entire chain of the CBA enables optimal solution identification which considers each target’s equation results.

7. Implementation of the CBA in Industrial-Scale Mining Waste Management

The CBA is based on the benefit/productivity cost ratio (B/C). As has been discussed, the CBA’s criteria are extracted from each project’s main operational works [2,52,53].
This is a technical economic tool which could be used to determine operational strategy and which takes into account the real needs of each project. The criteria for decision analysis/assessment can be customized. As a result, the total exported guideline would apply to specific industrial work activities [53].
This is why this method was chosen as the most effective instead of other conventional approaches such as the multi-criteria decision analysis (MCDA), the analytic hierarchy process (AHP), etc. The suitability of the use of the CBA in terms of implementing a circular economy, especially in mining waste management, should self-evident to readers familiar with the topic [1,52,54].
CBA’s structure, tailored to the mining waste management project’s requirements in terms of circular economy, is shown in Figure 5.
Considering the axioms of the CBA, mining waste management activities must be identified. Through this, a hierarchy of control is extracted. Thus, the need for environmental cost minimization would be presented more definitionally. Minimizing negative environmental impact involves metal removal and acidic character reduction in the final waste disposal site [19,54,55].
The business decision derived from the implementation of the CBA is based on the total beneficial scenario, which, apart from environmental pollution and its rehabilitation cost, evaluates the possible case of reusing the recovered metal product as raw material in the global financial marketplace. According to this, a model of a scientific database in which all of the required parameters are converted to monetary units needs to be implemented. This database consists of the criteria that are presented in Figure 3.
These criteria’s evaluation ensures the validity of each operational strategy. Based on this, criteria data are necessary for the implementation of CBA. Each criterion’s elements are described below.

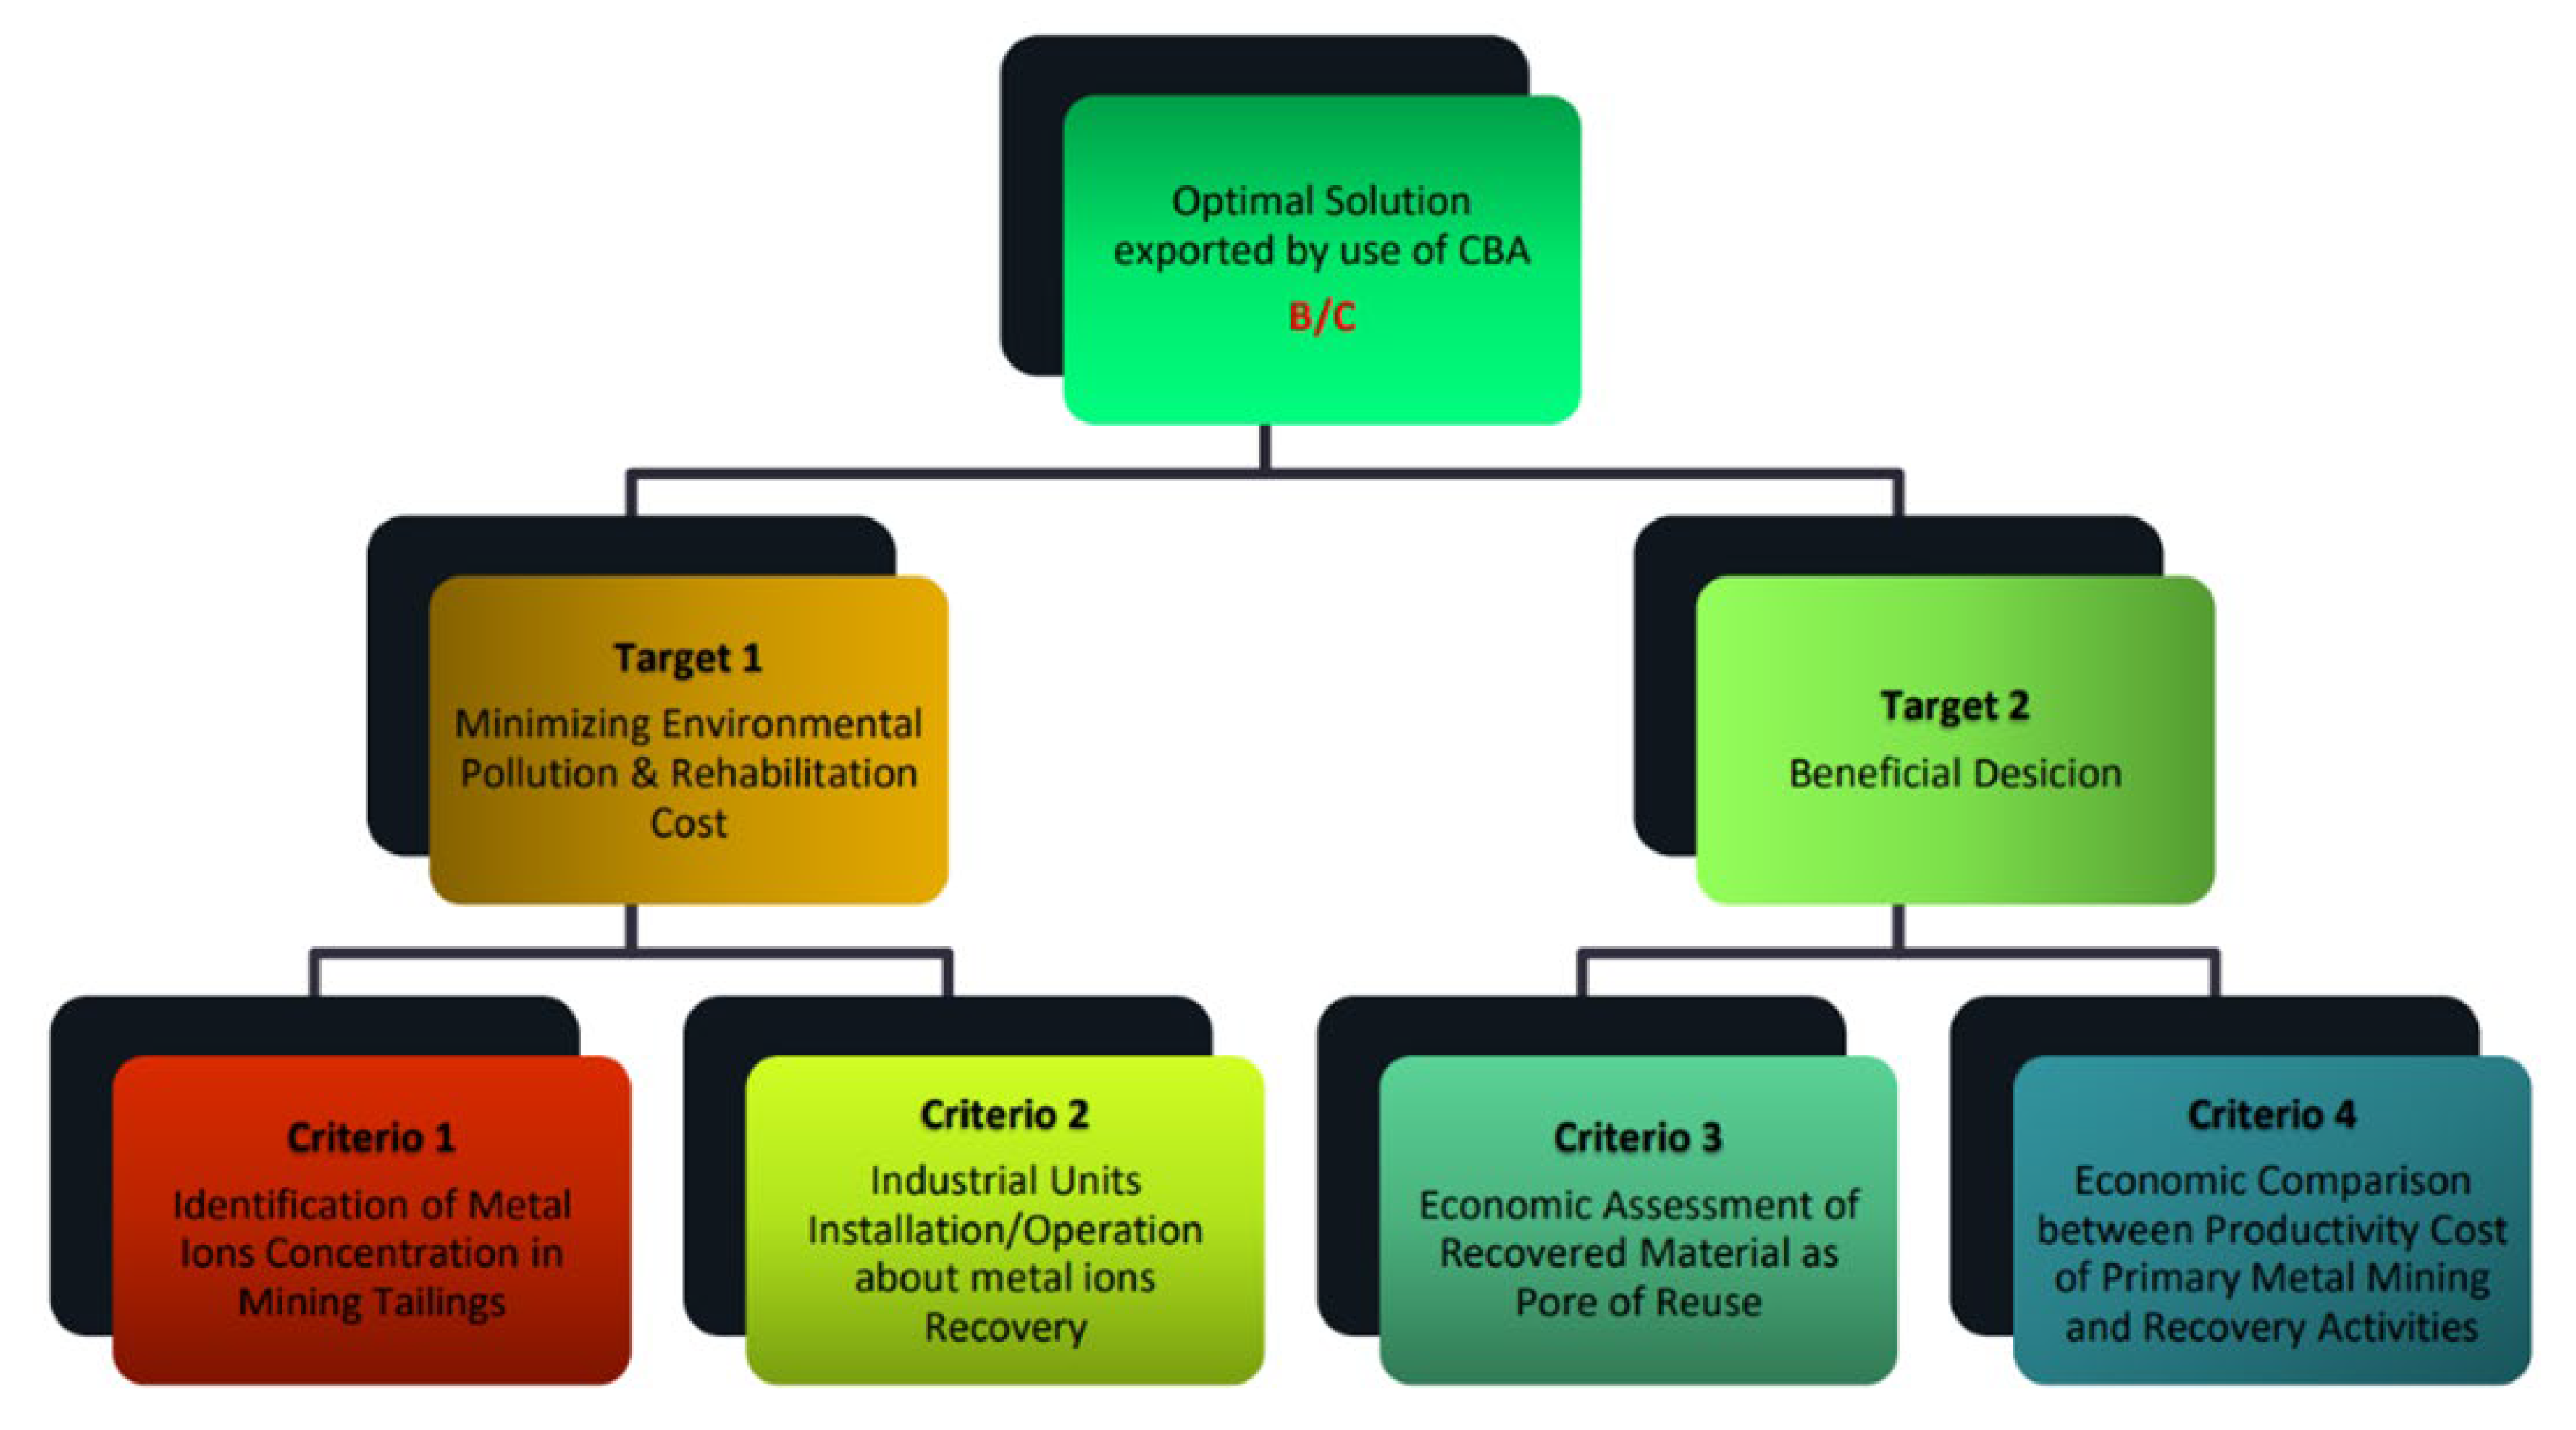
7.1. Data Criterions

Criterion 1. Identification of metal ions concentration in mining tailings.
Identification of metal ions concentration in mining tailings has significant importance in the evaluation of environmental rehabilitation costs. Sampling test results from scientific studies to determine the mineral ores’ chemical composition in metal ions should be considered. The concentrations of the metal ions are calculated in mg/kg, ppm, or %wt. According to the annual production volume of each mining industry’s wastes combined with their chemical composition analysis, a reliable estimation of the total metal product content can be obtained.
Criterion 2. Recover industrial units installation/operation.
Considering the scientific evidence of the total estimated metal product content, industrial unit installation and operation capacity could be calculated for the implementation of recovery procedures.
The capacity/technical specs of industrial recovery units are proportional to their installation and annual productivity costs.
Criterion 3. Economic assessment of recovered materials to determine reusability.
After the existing situation analysis, an economic assessment of the utilization of recovered and primary extracted metal materials is presented based on their global financial prices. This data assessment will economically evaluate whether the total volume of recovered metal material is reusable.
Criterion 4. Economic comparison between productivity cost of primary metal mining and recovery activities.
An economic assessment of recovery and primary extraction operations of metal materials is presented. This data assessment will economically compare the productivity costs of primary metal mining and its metal recovery operations. This assessment takes into account the environmental rehabilitation costs in both cases.

7.2. Parts of the CBA’s Database

According to the data criteria, a new database with four significant parts will be created to enable the CBA to be applied to each familiar kind of project.
The first part of the database will be enriched by adding data criterion 1 (annual volume of wastes, chemical composition of mining tailings, metal ions identification, etc.).
The second part of the database will be enriched by adding data criterion 2 to assess the optimal capacity of industrial units. This assessment ensures the estimation of treatment units’ installation and operational costs according to the annual volume of wastes, which is described numerically in the discussion of data criterion 1. As a result, the weighting of recovery procedures costs (to minimize negative environmental impacts) and environmental rehabilitation cost will be extracted more simply.
The third part of the database provides an economic comparison of primary extracted and recovered metal materials. This part presents conventional metal materials’ prices reported in the metal stock market. So, considering the recovery operation and the enrichment cost of the metal degrees, the optimal selling price of the extracted metal material for reuse in the global marketplace would be estimated.
The final part of the database offers an economic assessment that evaluates the cost of primary ore mining and its recovery operations from mining tailings.
The hierarchy of CBA’s control parts and their requirements, according to its main targets, are shown in Figure 6.
This comparative evaluation analyzes and assesses the following parameters.
  • A volume of recovered metals is produced from mining and is left at waste disposal sites. This will be compared with the corresponding volume of ore produced from primary extraction.
  • The recovered product’s chemical composition (strategy metals, precious metals, rare earth elements concentration, etc.) will be compared with its primary metal extractive product.
  • The recovered product’s metal degrees will be compared with those of primary metal extracted raw material.

7.3. Variables of CBA

The data criteria analyzed in previous chapters provide the following: (a) an economic risk assessment according to the implementation of environmental protection measures through metal recovery or acceptance penalty cost of non-compliance with environmental legislative requirements; (b) a determination of LTP risk and ERR through metal recovery during future periods in terms of implementing a circular economy; (c) an economic comparison between primary mining and metal recovery. The whole data analysis is based on each industrial condition (data criterion 1), while the total investment cost of recovery is inextricably linked to the designed schedule plan.
The implementation of a cost–benefit analysis on mining waste management should be tailored to the requirements of individual projects. The CBA evaluates the sustainability of each project through a costs–benefits ratio. The variables of the CBA evaluation of metal recovery engineering projects are as follows.
Total investment cost (TIC): TIC includes (1) the consumption and costs of chemical reagents; (2) the cost and consumption of energy; (3) the costs of equipment installation; (4) the maintenance costs of equipment. All these parameters have been calculated, including taxes.
Total mining tailings capacity and beneficial materials: Information is given by data criterion 1.
Selling price of recovered materials (SP) and ENPV indicator: SP and ENPV have been combined into the ERR indicator.
Long-term perspective risk: The LTP indicator evaluates the benefits (through the minimization of (a) environmental pollution hazards, (b) environmental legislation non-conformity penalty costs, and (c) environmental rehabilitation cost) to the total investment cost of recovery.
The CBA mathematical formula obtains a benefit-to-cost ratio projection for coming years. The CBA indicator for annual calculations is described by the following function:
CBA = Benefit Value/Cost Value
CBA = f(LTP, ERR)
CBAn = 0.5 ∗ (LTPn + ERRn), n: Year (1 − n)
The average of annual CBA indicators provides the total CBA:
Total CBA = Avg{Σ(CBA1 + CBA2 + … + CBAn)}
  • Long-Term Perspective Risk
The ratio of the sum-weighted investment cost to the sum-averaged cost of non-compliance per year allows the calculation of the annual LTP indicator. The LTP indicator includes the total investment cost per year. For the first year, the total investment cost, excluding the total operational cost, accounts for the equipment installation cost. For the subsequent years, the annual investment cost involves the equipment’s total operating and maintenance costs. In addition, it must be mentioned that both the sum-weighted investment cost and the sum-averaged cost of non-compliance are negative costs, so the beneficial cost is characterized as the one with the lowest absolute value. Annual-total-weighted investment costs are lower than the annual average costs of non-compliance. Thus, LTP’s mathematical formula is as follows:
LTP = [Total Weighted Investment Cost]/[Total Average Cost of non-compliance]
  • Economic Rate of Return (ERR)
The calculation of the annual ERR is achieved through the ratio of the total beneficial value to the total economic net present value for extracted metal mass (kg). Both of these values are specific for each type of metal. The total beneficial value is the sum of the selling price of each metal multiplied by the corresponding mass of the metal. The economic net present value is the sum of the current selling price per metal multiplied by the related mass of metal. Thus, ERR’s mathematical formula is as follows:
ERR = [Beneficial Value]/[Economic Net Present Value]
The variables, including those calculated through LTP, are detailed next.
  • Chemical reagents’ consumption and their cost (CRC): The CRC can be obtained through multiplying the number of working days per year (N) by the total daily cost. The total daily cost (TDC) is equal to the sum of the daily costs per stage for each reagent. The daily cost of reagents per stage is calculated by the total reagents’ mass (TRM), multiplied by its cost. Reagents mass is proportional to the daily capacity of wastes per stage and the required concentration of acid/catalyst in the dissolution.
For example, based on scientific studies, the proportion of acid to dissolved mining tailings, to achieve metal recovery over 98%, is equal to 0.5 M. This means that dissolution’s volume of wastes per stage (DVW), 83 m3 = 166.000 kg, requires 1660 kg of HCLaq acid (1% w/w). Due to the HCLaq concentration, estimated at 35% of clear HCL, 568 kg of clear HCL is required per stage. So, the total mass needed for acid reagent per stage is 568 kg daily. The corresponding daily chemical reagents’ masses for all processing stages have been calculated similarly.
TDCR = TRM ∗ TRMCOST per kg,
TRM = [(Clear Concentration Acid-Catalyst) ∗ (MrReagent’s) ∗ DVW] ∗ [% ratio of Acidaq-atalystaq],
TDCR = (TRMCOST per kg) ∗ [(Clear Concentration Acid-Catalyst) ∗ (MrReagent’s) ∗ DVW] ∗ [% ratio of Acidaq-Catalystaq],
The total annual cost of reagents is calculated using the following mathematical formula:
TACR = N ∗ TRMCOST per kg ∗ [(Clear Concentration Acid-Catalyst) ∗ (MrReagent’s) ∗ DVW] ∗ [% ratio of Acidaq-Catalystaq],
2.
Energy consumption and its cost: According to European Union reports, the required energy consumption (EC) per mining tailing ton is estimated to be 0.06 MWh/t [48]. Due to the higher price of electricity than natural gas, energy consumption should be covered 40% by primary electrical energy and 60% by secondary electrical energy provided by multipliers, which transitions natural gas energy to electrical energy.
The total primary electrical energy consumption (TEEC1) per mining tailing ton is equal to 0.4 ∗ (EC), and the total secondary electrical energy consumption (TEEC2) per mining tailing ton is equal to 0.6 ∗ (EC).
The cost of primary electrical consumption per mining tailing ton is equal to the electrical cost price (ECP) (EUR/MWh) multiplied by the 0.4 ∗ (EC) factor.
The cost of secondary electrical consumption per mining tailing ton is equal to the natural gas cost price (NGCP) (EUR/MWh) multiplied by the 0.6 ∗ (EC) factor.
The total annual energy consumption cost (TAEC) is equal to the sum of [(ECP) ∗ 0.4 ∗ (EC)] and [(NGCP) ∗ 0.6 ∗ (EC)] multiplied by the annual mass of tailings, AMT.
(TAEC) = {[(ECP) ∗ 0.4 ∗ (EC)] + [(NGCP) ∗ 0.6 ∗ (EC)]} × AMT,
3.
Cost of equipment primary installation: According to [55,56], the total cost of installation per chemical reactor with a ratio of diameter/height = 0.5. Its electrical–mechanical equipment is estimated to have a standard price of EUR 170.000. This price is multiplied by the number of reactors to obtain the total installation cost (TCI).
TCI = (Cost per Reactor) ∗ (Number of Reactors),
4.
Maintenance Cost of Equipment: According to [54,56], the maintenance cost of the used equipment (MCE) is proportional to the annual treated tailings mass. In addition, this cost price is also relevant to the total installation cost. There is a variety of equipment maintenance cost–primary installation cost ratios. This ratio has a range between 17 and 23%. Therefore, it is taken into account that the estimated maintenance cost would be approximately equal to 20% of the installation cost.
(MCE) = 0.2 × TCI,
The total investment cost per year is calculated by the sum of Equations (6), (7), and (9). The total investment cost of the first year is calculated by the sum of Equations (6)–(8).
Total investment cost per year has been weighted by adding 20% plus cost as a safety factor. Thus, the total weighted investment cost (TWIC) equals 120% of TIC. The mathematical formula of TWIC is as follows.
(TWIC)1 = 120% ∗ {N ∗ TRMCOST/kg ∗ [(Clear Concentration Acid-Catalyst) ∗ (MrReagent’s) ∗ DVW] ∗ [% ratio of Acidaq-Catalystaq] + {[(ECP) ∗ 0.4 ∗ (EC)] + [(NGCP) ∗ 0.6 ∗ (EC)]} ∗ AMT + (Cost per Reactor) ∗ (Number of Reactors)} (EUR) (For the first year of operation.)
(TWIC)n+1 = 120% ∗ {N ∗ TRMCOST/kg ∗ [(Clear Concentration Acid-Catalyst) ∗ (MrReagent’s) ∗ DVW] ∗ [% ratio of Acidaq-Catalystaq] + {[(ECP) ∗ 0.4 ∗ (EC)] + [(NGCP) ∗ 0.6 ∗ (EC)]} ∗ AMT + 0.2 ∗ TCI} (EUR) (For all years of operation except from the first one.)
The LTP indicator is extracted by the ratio of TWIC to the annual average penalty cost of non-compliance (AACNC). Thus, the LTP is described by the following mathematical equations:
(LTP)1 = 120% ∗ {N ∗ TRMCOST/kg ∗ [(Clear Concentration Acid-Catalyst) ∗ (MrReagent’s) ∗ DVW] ∗ [% ratioAcidaqCatalystaq] + {[(ECP) ∗ 0.4 ∗ (EC)] + [(NGCP) ∗ 0.6 ∗ (EC)]} ∗ AMT + (Cost/Reactor) ∗ (Number of Reactors)} ∗ (AACNC)−1, (For the first year of operation.)
(LTP)n+1 = 120% ∗ {N ∗ TRMCOST/kg ∗ [(Clear Concentration Acid-Catalyst) ∗ (MrReagent’s) ∗ DVW] ∗ [% ratio of Acidaq-Catalystaq] + {[(ECP) ∗ 0.4 ∗ (EC)] + [(NGCP) ∗ 0.6 ∗ (EC)]} ∗ AMT + 0.2 ∗ TCI}(AACNC)−1, (For all operating years except from the first one.)
The variables, including those using ERR, are as follows:
  • Beneficial value: The total beneficial value is the sum of the selling price of each metal multiplied by the corresponding mass of the metal. The following mathematical type describes the beneficial value.
( TBV ) = A Z Type   of   Metal [ S.P.     Metal   Mass ]   per year .
2.
Economic net present value: The ENPV is the sum of the selling price of each metal multiplied by the corresponding mass of the metal. The following mathematical type describes ENPV.
( ENPV ) = A Z Type   of   Metal [ S.P.     Metal   Mass ]   present year .
The CBA mathematical formula is extracted in accordance with Equation (1). This includes all of the required parameters mentioned in this chapter. CBA’s complete equation is tailored to the recovery engineering project’s requirements.
CBAn = 0.5 ∗ 120% ∗ N ∗ Σ(i=1–9){TRMCOST/kg ∗ [(CA–C) ∗ (MrReagent) ∗ DVW] ∗ [%RAcid-Catalyst]} + {[(ECP) ∗ 0.4 ∗ (EC)] + [(NGCP) ∗ 0.6 ∗ (EC)]} ∗ AMT + (CPR) ∗ (NR)} ∗ (AACNC)−1] + 0.5 ENPV, n = 1st Year)
CBA m   = 0.5     120 %     N     Σ ( i = 1 9 ) { TRM COS T / kg     [ C A C     ( Mr Reagent )     DVW ]     [ % R Acid - Catalyst ] } + { [ ( ECP )     0.4     ( EC ) ] + [ ( NGCP )     0.6     ( EC ) ] }     AMT + 0.2     TCI }     ( AACNC ) 1 ] + 0.5     [ A Z Type   of   Metal [ S.P.     Metal Mass ]     ENPV 1 , n   =   1 , m   = n   +   1   Years

8. Discussion

When considering the following factors, it is clear that it is necessary to implement sustainable mechanisms in mining waste management: (a) the sources of environmental pollution hazard from mining wastes: (b) the “Conservation and Management of Resources for Development” tasks which are mentioned in the Sustainable Development Plans [6]; (c) the measures adopted by the European Parliament and Council of the European Union [5]. These mechanisms aim to reduce the environmental pollution rate by recovering metal materials and treating acidic drainage. The recovered valuable metal products are expected to be enriched in Rees, precious, and other strategic metal units.
CBA is an economic tool that provides (a) existing situation analysis, (b) analysis of the installation and operational costs of industrial treatment units, (c) economic comparative assessment between recovered and primary extracted metal materials’ utilization, and (d) economic assessment between recovery operations and primary extraction operations of metal materials. As a result, use of the CBA, a frequent practice in traditional feasibility studies, allows researchers to determine the nature of the costs and benefits of a project in monetary terms, making it easier to understand and greatly assisting in decision making.
The optimal solution is characterized by environmental rehabilitation cost reduction and more effective recovered product utilization. Thus, an objective evaluation database is required. This database should emphasize the benefits from exploitation possibilities of specific metal categories, such as Rees and precious metals.
Implementing CBA for mining waste management activities on an industrial scale requires an evaluation of the criteria mentioned in Section 5.1; these must be converted into monetary values, allowing the most beneficial business strategy to be objectively provided.
Table 1 shows the total exported CBA index which was configured when both LTP and ERR were given the same importance for a mining company.
Table 2 shows a summary of the information for the partial costs of implementing a CBA in mining waste management. All the direct costs impact the long-term perspective index, while indirect costs affect the economic rate of return. Despite implementing waste management procedures at closed-system industrial units, the potential probability of incomplete compliance with environmental protection legislative requirements is considered. This potential negative cost provides an additional safety factor to the final configuration of the total CBA index. The weighting factors of CBA’s partial indexes (a, b, c, …) are determined according to each business strategy’s preferences.
Thus, according to the mining waste management plan, the final business solution provided using the cost–benefit analysis approach is primarily informed by the guidance expressed among the weighting factors (a, b, c, …) of each CBA’s index. The CBA is a useful techno-economic tool; however, its final output is determined by general policies and preferences.

9. Conclusions

Risk analysis engineering is one of the most significant pre-operation sectors that must be analyzed and assessed before active operations are carried out.
In the context of environmental pollution, mining/metallurgical industries and environmental companies need to explore alternative procedures to implement the European environmental model of the three Rs (reduce, recover, and reuse wastes). Furthermore, considering legislative, social, and environmental parameters, the CBA exports a sustainable engineering solution for mining waste management. The goal of the CBA is to avoid the free disposal of mining tailings; accordingly, all the parameters (legislative, social, environmental, and geoscientific) are converted into monetary terms to identify the risk of each case scenario (scenario A (0)—non-implementation of metal recovery procedures; scenario A (1)—implementation of metal recovery procedures according to the three Rs; implementation of a circular economy). The CBA’s results support case scenario A (1), providing improvements in environmental safety and protection from ground soil pollution. The scientific proposal of this study is based on experimental studies of metal recovery engineering, financial management techniques, and environmental legislative requirements, which provide benefits for human health.
In financial management, case scenario A (1) is supported because CBA enhances the incremental economic rate of return (ERR). There are substantial data on the optimal scientific and engineering mechanisms. These data enable researchers to (1) evaluate the ratios od precious, strategic, and base metals and rare earth elements in mining wastes; (2) update recovery methods; (3) assess alternative procedures for reduction in financial losses; (4) implement effective economic methods that ensure business growth.
According to scientific impact studies, all the above parameters contribute positively to financial management by offering sustainable waste management solutions.
It is necessary to emphasize that most wastes are reusable resources. It has been mentioned that mining/metallurgical wastes comprise plenty of rare earth elements and precious metals in low ratios. Thus, the recovery and enrichment of those metals would provide both green growth and financial benefits.
Through converting all project parameters into monetary terms, the implementation of the CBA has a definite impact on our understanding of potential sustainable developments. The final business decision provided by the CBA is beneficial for each mining industry due to the combination of environmental rehabilitation cost reduction and possible financial gains through the economic utilization of recovered products.
This scientific paper shows an economic assessment that is provided through a cost–benefit analysis, which accounts for an evaluation of the sustainability of mining waste management projects. Therefore, it is necessary to determine the critical parameters which should be analyzed to extract the optimal business decision.
The first scenario, “Case Scenario A(0)”, refers to non-conformance with legislative environmental protection requirements. In this case, the output benefit is equal to the lack of total investment costs on mining waste management in terms of the three Rs. This case’s cost is equal to the total penalty cost for non-compliance with environmental protection measures.
The second scenario, “Case Scenario A(1)”, refers to full compliance with the three Rs policy through the provision of the total investment cost for mining waste management. The potential output benefit, in this case, is expressed by the ERR index combined with the lack of penalty cost for non-compliance with environmental protection policy. This “Penalty Cost for non-compliance” is exported through the LTP index. The cost of this case is equal to the total investment cost. This “Total Investment Cost” is a key indicator of the efficiency of the whole project.
This scientific research provides a CBA mathematical formula which is tailored to the industrial needs of mining waste management projects. The main achievement of this specific research is the determination of the required parameters, according to the “Guide to Cost–benefit Analysis of Investment Projects for Cohesion Policy 2014-2020” [1], and their correlation with the CBA’s application to the project needs on an industrial scale.
The output CBA form presented in Table 1 involves plenty of technical specifications for all the parameters that could impact the configuration for the cost and potential benefit of Case Scenario A(1), converted into monetary terms.
Thus, a mathematical formula is obtained that is adaptable to each mining waste management project, according to the following factors:
(1)
The nature of chemicals that could be used;
(2)
The layout of the energy provision system;
(3)
The cost of maintenance;
(4)
The cost for the primary installation of the industrial equipment.
In conclusion, it is very important to mention that, for the implementation of the cost–benefit analysis approach for mining waste management—based on the terms of the circular economy and considering environmental impacts—the following factors must be identified:
(1)
Technical parameters (tailings mass, the operational cost of recovery, the chemical process of the tailings, efficiency of the chemical reagents that will be used, operating cost, etc.);
(2)
The costs of these parameters;
(3)
The negative costs for non-compliance with environmental legislative requirements through the LTP index;
(4)
The potential benefit for Case Scenario A(1) through the ERR index.
The transition of those parameters into monetary terms is supported by the CBA framework for mining waste management, as analyzed in this paper. This CBA framework could be tailored to individual projects while providing a more realistic cost estimation.
Finally, the is plenty of interest in implementing such a work on metal recovery in terms of the pilot industrial mode. In addition, the correlation between the potential sustainability of this pilot project through the presented CBA assessment and its overview sensitivity analysis could certify the efficiency of this suggested Case Scenario A(1) on an industrial scale.

Author Contributions

Conceptualization, E.M. and E.A.V.; methodology, E.M. and E.A.V.; formal analysis, E.M. and E.A.V.; investigation, E.M. and E.A.V.; writing—original draft preparation, E.M. and E.A.V.; writing—review and editing, E.M. and E.A.V.; supervision, E.A.V. All authors have read and agreed to the published version of the manuscript.

Funding

This research received no external funding.

Data Availability Statement

The data that support the findings of this study are available from the first author upon request.

Conflicts of Interest

The authors declare no conflict of interest.

References

  1. European Commission. Guide to Cost Benefit Analysis of Investment Projects. Economic Appraisal Tool for Cohesion Policy 2014–2020; European Commission: Brussels, Belgium, 2014.
  2. Gigli, S.; Landi, D.; Germani, M. Cost-benefit analysis of a circular economy project: A study on a recycling system for end-of-life tyres. J. Clean. 2019, 229, 680–694. [Google Scholar] [CrossRef]
  3. Singh, S.; Sukla, L.B.; Goyal, S.K. Mine waste & circular economy. Mater. Today Proc. 2020, 30, 332–339. [Google Scholar]
  4. Seguı, L.; Alfranca, O.; Garcı, J. Techno-economical evaluation of water reuse for wetland restoration: A case study in a natural park in Catalonia, Northeastern Spain. Desalination 2009, 246, 179–189. [Google Scholar] [CrossRef]
  5. Directive 2008/98/EC; The European Parliament and the Council of the Europena Union. Official Journal of the European Union: Luxembourg, 2008.
  6. UN. Agenda 21. In Proceedings of the United Nations Conference on Environment & Development, Rio de Janerio, Brazil, 3–14 June 1992; Available online: https://sustainabledevelopment.un.org/outcomedocuments/agenda21 (accessed on 24 May 2023).
  7. European Commission. Critical Raw Materials for Strategic Technologies and Sectors in the EU. A Foresight Study; European Commission: Brussels, Belgium, 2020.
  8. European Union. Climate-KIC EIT.2020.Preserving Value in EU Industrial Materials. A Value Perspective on the Use of Steel, Plastics, and Aluminium; European Commission: Brussels, Belgium, 2020. [Google Scholar]
  9. Adewuyi, A.O.; Wahab, B.A.; Adeboye, O.S. Stationarity of prices of precious and industrial metals using recent unit root methods: Implications for markets’ efficiency. Resour. Policy 2020, 65, 101560. [Google Scholar] [CrossRef]
  10. Cox, C.; Kynicky, J. The rapid evolution of speculative investment in the REE market before, during, and after the rare earth crisis of 2010–2012. Extr. Ind. Soc. 2018, 5, 8–17. [Google Scholar] [CrossRef]
  11. Deng, S.; Prodius, D.; Nlebedim, I.C.; Huang, A.; Yih, Y.; Sutherland, J.W. A dynamic price model based on supply and demand with application to techno-economic assessments of rare earth element recovery technologies. Sustain. Prod. Consum. 2021, 27, 1718–1727. [Google Scholar] [CrossRef]
  12. Dinis, M.d.L.; Fiúza, A.; Futuro, A.; Leite, A.; Martins, D.; Figueiredo, J.; Góis, J.; Vila, M.C. Characterization of a mine legacy site: An approach for environmental management and metals recovery. Environ. Sci. Pollut. Res. 2020, 27, 10103–10114. [Google Scholar] [CrossRef] [PubMed]
  13. Guerrón, D.B.; Capa, J.; Flores, L.C. Retention of heavy metals from mine tailings using Technosols prepared with native soils and nanoparticles. Heliyon 2021, 7, e07631. [Google Scholar] [CrossRef]
  14. Mehta, N.; Dino, G.A.; Passarella, I.; Ajmone-Marsan, F.; Rossetti, P.; De Luca, D.A. Assessment of the Possible Reuse of Extractive Waste Coming from Abandoned Mine Sites: Case Study in Gorno, Italy. Sustainability 2020, 12, 2471. [Google Scholar] [CrossRef]
  15. Lim, B.; Alorro, R.D. Technospheric Mining of Mine Wastes: A Review of Applications and Challenges. Sustain. Chem. 2021, 2, 686–706. [Google Scholar] [CrossRef]
  16. Bevandic, S.; Blannin, R.; Auwera, J.V.; Delmelle, N.; Caterina, D.; Nguyen, F.; Muchez, P. Geochemical and Mineralogical Characterisation of Historic Zn–Pb Mine Waste, Plombières, East Belgium. Minerals 2020, 11, 28. [Google Scholar] [CrossRef]
  17. Tang, H.; Wang, X.; Shuai, W.; Liu, Y. Immobilization of Rare Earth Elements of the Mine Tailings Using Phosphates and Lime. Procedia Environ. Sci. 2016, 31, 255–263. [Google Scholar] [CrossRef]
  18. Hao, J.; Wang, Y.; Wu, Y.; Guo, F. Metal recovery from waste printed circuit boards: A review for current status and perspectives. Resour. Conserv. Recycl. 2020, 157, 104787. [Google Scholar] [CrossRef]
  19. Yıldız, T.D. Waste management costs (WMC) of mining companies in Turkey: Can waste recovery help meeting these costs? Resour. Policy 2020, 68, 101706. [Google Scholar] [CrossRef]
  20. Wang, M.; Tan, Q.; Chiang, J.F.; Li, J. Recovery of rare and precious metals from urban mines—A review. Front. Environ. Sci. Eng. 2017, 11, 1–17. [Google Scholar] [CrossRef]
  21. Naidu, G.; Ryu, S.; Thiruvenkatachari, R.; Choi, Y.; Jeong, S.; Vigneswarana, S. A critical review on remediation, reuse, and resource recovery from acid mine drainage. Environ. Pollut. 2019, 247, 1110–1124. [Google Scholar] [CrossRef] [PubMed]
  22. Bellenfant, G.; Guezennec, A.G.; Bodenan, F.; D’Hugues, P.; Cassard, D. Reprocessing of mining waste: Combining environmental management and metal recovery? In Proceedings of the Mine Closure 2013: Proceedings of the Eighth International Seminar on Mine Closure, Australian Centre for Geomechanics, Cornwall, Australia, 18–20 September 2013.
  23. Rodríguez-Galán, M.; Baena-Moreno, F.M.; Vázquez, S.; Arroyo-Torralvo, F.; Vilches, L.F.; Zhang, Z. Remediation of acid mine drainage. Environ. Chem. Lett. 2019, 17, 1529–1538. [Google Scholar] [CrossRef]
  24. Macías-Macías, K.Y.; Ceniceros-Gómez, A.E.; Gutiérrez-Ruiz, M.E.; González-Chávez, J.L.; Martínez-Jardines, L.G. Extraction and recovery of the strategic element gallium from an iron mine tailing. J. Environ. Chem. Eng. 2019, 7, 102964. [Google Scholar] [CrossRef]
  25. Tunsu, C.; Menard, Y.; Eriksen, D.; Ekberg, C.; Petranikova, M. Recovery of critical materials from mine tailings: A comparative study of the solvent extraction of rare earths using acidic, solvating and mixed extractant systems. J. Clean. Prod. 2019, 218, 425–437. [Google Scholar] [CrossRef]
  26. Araya, N.; Kraslawski, A.; Cisternas, L.A. Towards mine tailings valorization: Recovery of critical materials from Chilean mine tailings. J. Clean. Prod. 2020, 263, 121555. [Google Scholar] [CrossRef]
  27. Kesieme, U.; Chrysanthou, A.; Catulli, M.; Cheng, C.Y. A review of acid recovery from acidic mining waste solutions using solvent extraction. J. Chem. Technol. Biotechnol. 2018, 93, 3374–3385. [Google Scholar] [CrossRef]
  28. Ilankoon, I.; Ghorbani, Y.; Chong, M.N.; Herath, G.; Moyo, T.; Petersen, J. E-waste in the international context—A review of trade flows, regulations, hazards, waste management strategies and technologies for value recovery. Waste Manag. 2018, 82, 258–275. [Google Scholar] [CrossRef] [PubMed]
  29. Medina-Mijangos, R.; De Andrés, A.; Guerrero-Garcia-Rojas, H.; Seguí-Amórtegui, L. A methodology for the technical-economic analysis of municipal solid waste systems based on social cost-benefit analysis with a valuation of externalities. Environ. Sci. Pollut. Res. 2020, 28, 18807–18825. [Google Scholar] [CrossRef] [PubMed]
  30. Shahba, S.; Arjmandi, R.; Monavari, M.; Ghodusi, J. Application of multi-attribute decision-making methods in SWOT analysis of mine waste management (case study: Sirjan’s Golgohar iron mine, Iran). Resour. Policy 2017, 51, 67–76. [Google Scholar] [CrossRef]
  31. Ghomi, A.G.; Asasian-Kolur, N.; Sharifian, S.; Golnaraghi, A. Biosorpion for sustainable recovery of precious metals from wastewater. J. Environ. Chem. Eng. 2020, 8, 103996. [Google Scholar] [CrossRef]
  32. Žibret, G.; Lemiere, B.; Mendez, A.-M.; Cormio, C.; Sinnett, D.; Cleall, P.; Szabó, K.; Carvalho, M.T. National Mineral Waste Databases as an Information Source for Assessing Material Recovery Potential from Mine Waste, Tailings and Metallurgical Waste. Minerals 2020, 10, 446. [Google Scholar] [CrossRef]
  33. Marín, O.A.; Kraslawski, A.; Cisternas, L.A. Estimating processing cost for the recovery of valuable elements from mine tailings using dimensional analysis. Miner. Eng. 2022, 184, 107629. [Google Scholar] [CrossRef]
  34. Michailidis, N.; Efstratiadis, V.S. Sustainable Recovery, Recycle of Critical Metals and Rare Earth Elements from Waste Electric and Electronic Equipment (Circuits, Solar, Wind) and Their Reusability in Additive Manufacturing Applications: A Review. Metals 2022, 12, 794. [Google Scholar]
  35. Balaram, V. Rare earth elements: A review of applications, occurrence, exploration, analysis, recycling, and environmental impact. Geosci. Front. 2019, 10, 1285–1303. [Google Scholar] [CrossRef]
  36. Schaider, L.A.; Senn, D.B.; Estes, E.R.; Brabander, D.J.; Shine, J.P. Sources and fates of heavy metals in a mining-impacted stream: Temporal variability and the role of iron oxides. Sci. Total. Environ. 2014, 490, 456–466. [Google Scholar] [CrossRef]
  37. Yuksekdag, A.; Kose-Mutlu, B.; Kaya, B.; Kumral, M.; Wiesner, M.R.; Koyuncu, I. Comprehensive characterization of secondary sources originating from Turkey in terms of rare earth elements and scandium. Sci. Total. Environ. 2021, 777, 146033. [Google Scholar] [CrossRef]
  38. Pavón, S.; Haneklaus, N.; Meerbach, K.; Bertau, M. Iron(III) removal and rare earth element recovery from a synthetic wet phosphoric acid solution using solvent extraction. Miner. Eng. 2022, 182, 107569. [Google Scholar] [CrossRef]
  39. Apollon, W.; Rusyn, I.; González-Gamboa, N.; Kuleshova, T.; Luna-Maldonado, A.I.; Vidales-Contreras, J.A.; Kamaraj, S.-K. Improvement of zero waste sustainable recovery using microbial energy generation systems: A comprehensive review. Sci. Total. Environ. 2022, 817, 153055. [Google Scholar] [CrossRef] [PubMed]
  40. Belkin, S.; Doran, P.M.; Endo, I.; Gu, M.B.; Hu, W.S.; Mattiasson, B.; Nielsen, J.; Stephanopoulos, G.N.; Ulber, R.; Zeng, A.-P.; et al. Geobiotechnology I. Metal Related Issues; Scheper, T., Ed.; Springer: Hannover, Germany, 2014. [Google Scholar]
  41. Foucher, S.; Battaglia-Brunet, F.; Ignatiadis, I.; Morin, D. Treatment by sulfate-reducing bacteria of Chessy acid-mine drainage and metals recovery. Chem. Eng. Sci. 2001, 56, 1639–1645. [Google Scholar] [CrossRef]
  42. Mukaba, J.-L.; Eze, C.P.; Pereao, O.; Petrik, L.F. Rare Earths’ Recovery from Phosphogypsum: An Overview on Direct and Indirect Leaching Techniques. Minerals 2021, 11, 1051. [Google Scholar] [CrossRef]
  43. Salman, A.D.; Juzsakova, T.; Mohsen, S.; Abdullah, T.A.; Le, P.-C.; Sebestyen, V.; Sluser, B.; Cretescu, I. Scandium Recovery Methods from Mining, Metallurgical Extractive Industries, and Industrial Wastes. Materials 2022, 15, 2376. [Google Scholar] [CrossRef] [PubMed]
  44. Elbashier, E.; Mussa, A.; Hafiz, M.; Hawari, A.H. Recovery of rare earth elements from waste streams using membrane processes: An overview. Hydrometallurgy 2021, 204, 105706. [Google Scholar] [CrossRef]
  45. Blanco, H.; Nijs, W.; Ruf, J.; Faaij, A. Potential of Power-to-Methane in the EU energy transition to a low carbon system using cost optimization. Appl. Energy 2018, 232, 323–340. [Google Scholar] [CrossRef]
  46. Hu, Y.; Zhang, L.; Lv, H.; Lu, S.; Xu, G.; Xu, C. A low energy consumption de-carbonization natural gas combined cycle power generation system based on LiBr/H2O absorption heat transformer. Int. J. Greenh. Gas Control 2021, 109, 103389. [Google Scholar] [CrossRef]
  47. Sarker, S.K.; Haque, N.; Bhuiyan, M.; Bruckard, W.; Pramanik, B.K. Recovery of strategically important critical minerals from mine tailings. J. Environ. Chem. Eng. 2022, 10, 107622. [Google Scholar] [CrossRef]
  48. European Commission. Management of Tailings and Waste-Rock in Mining; European Commission: Brussels, Belgium, 2009.
  49. Yilmaz, T.; Yucel, A.; Cakmak, Y.; Uyanik, S.; Yurtsever, A.; Ucar, D. Treatment of acidic mine drainage in up-flow sulfidogenic reactor: Metal recovery and the pH neutralization. J. Water Process. Eng. 2019, 32, 100916. [Google Scholar] [CrossRef]
  50. Tseng, M.-L.; Jeng, S.-Y.; Lin, C.-W.; Lim, M.K. Recycled construction and demolition waste material: A cost–benefit analysis under uncertainty. Manag. Environ. Qual. Int. J. 2021, 32, 665–680. [Google Scholar] [CrossRef]
  51. Gallardo, R.S.; Elevado, K.J.T. Cost Benefit Analysis of concrete mixed with waste ceramic tiles and fly ash. In Proceedings of the 5th Seminar on Utilization of Waste Materials, Manila, PH, USA, 7–8 September 2017; Available online: https://www.researchgate.net/publication/326439758_Cost-Benefit_Analysis_of_Concrete_Mixed_with_Waste_Ceramic_Tiles_and_Fly_Ash (accessed on 24 May 2023).
  52. Geng, X.; Song, N.; Zhao, Y.; Zhou, T. Waste plastic resource recovery from landfilled refuse: A novel waterless cleaning method and its cost-benefit analysis. J. Environ. Manag. 2022, 306, 114462. [Google Scholar] [CrossRef]
  53. Blengini, G.A.; Mathieux, F.; Mancini, L.; Nyberg, M.; Viegas, H.M. Recovery of Critical and Other Raw Materials from Mining Waste and Landfills. European Commision. JRC Science for Policy Report. State of Play on Existing Practices; European Commission: Brussels, Belgium, 2019. [Google Scholar]
  54. Kesieme, U.K.; Aral, H. Application of membrane distillation and solvent extraction for water and acid recovery from acidic mining waste and process solutions. J. Environ. Chem. Eng. 2015, 3, 2050–2056. [Google Scholar] [CrossRef]
  55. Raoufi, K.; Haapala, K.R.; Etheridge, T.; Manoharan, S.; Paul, B.K. Cost and environmental impact assessment of stainless steel microscale chemical reactor components using conventional and additive manufacturing processes. J. Manuf. Syst. 2022, 62, 202–217. [Google Scholar] [CrossRef]
  56. Humbird, D.; Davis, R.; McMillan, J. Aeration costs in stirred-tank and bubble column bioreactors. Biochem. Eng. J. 2017, 127, 161–166. [Google Scholar] [CrossRef]
Figure 1. Origin of environmental and financial hazards.
Geosciences 13 00318 g001
Figure 3. Flow scheme for case scenario of metal recovery using gold mining waste.
Geosciences 13 00318 g003
Figure 4. Daily metal recovery chronodiagram of the case study scenario.
Geosciences 13 00318 g004
Figure 5. Hierarchy of targets and criteria included in the implementation of the CBA to export the optimal business decision according to the B/C ratio.
Geosciences 13 00318 g005
Figure 6. Hierarchy of database’s control parts.
Geosciences 13 00318 g006
Table 1. Codification of cost–benefit analysis mathematical formula’s symbols.
SymbolismsDescriptionUnits
TRMCost/kgTotal reagent’s mass costEUR/kg
CA-CConcentration of acid or catalystM
MrReagent’s Mr-
DVWDaily volume of wastes per stagem3
%R% Ration of clear reagent in aqua dissolution%
ECPElectrical cost pricekg
ECEnergy consumption per ton of tailingsEUR/MWh
NGCPNatural gas cost priceEUR/MWh
AMTAnnual mass of tailingskg
CPRTotal cost of installation per reactorEUR
NRNumber of reactors-
AACNCAnnual average cost of non-complianceEUR
TCITotal cost of installationEUR
SPSelling price for each type of metalEUR/kg
ENPVEconomic net present value for the total mass of metals (present year)EUR
CBAn0.5 ∗ 120% ∗ N ∗ Σ(i=1–9){TRMCOST/kg ∗ [(CA-C) ∗ (MrReagent) ∗ DVW] ∗ [%RAcid-Catalyst]}+{[(ECP) ∗ 0.4 ∗ (EC)]+[(NGCP) ∗ 0.6 ∗ (EC)]} ∗ AMT+(CPR) ∗ (NR)} ∗ (AACNC)−1] + 0.5 ∗ ENPVIndex (1st Year)
CBAm0.5 ∗ 120% ∗ N ∗ Σ(i=1–9){TRMCOST/kg ∗ [(CA-C) ∗ (MrReagent) ∗ DVW] ∗ [%RAcid-Catalyst]}+{[(ECP) ∗ 0.4 ∗ (EC)]+[(NGCP) ∗ 0.6 ∗ (EC)]} ∗ AMT+0.2 ∗ TCI} ∗ (AACNC)−1] + 0.5 ∗ [ A Z Type   of   Metal [S.P. ∗ MetalMass] ∗ ENPV−1]Index (per Year)
Table 2. CBA’s variable cost; impact on the CBA’s indexes; aims of each CBA’s index; total extracted index of the CBA.
CostsCBA in Mining Waste Management—Variables of Risk AssessmentImpact of CBA’s Variables on the Relevant CBA’s IndexesAims of Each CBA’s IndexFluctuating Weighting Factors for CBA’s Indexes (%)Total
CBA Index
(Benefit/Cost)
Direct Costs (EUR)Cost of chemical reagentsLTP
(Long-term Perspective)
Section 5.2, Section 6, Section 7.1 and Section 7.2
Protection from uncontrolled and systematic disposal of hazardous wastes on ground soil [5,6]a, b, c, …
(LTP coefficient)
Section 8


a × LTP + (1 − a) × ERR


b × LTP + (1 − b) × ERR


c × LTP + (1 − c) × ERR

Section 7.2
Cost of energy consumptionHigh rate of compliance with environmental protection requirements in terms of CE [5,6]
Cost for primary installation of industrial unitsMinimization of hazard by
environmental pollution [5,6,55]
Maintenance cost of equipmentNon-hazardous wastes in the final disposal site [1,5,6,55]
Indirect Costs (EUR)Potential penalty cost for non-compliance with environmental protection requirements
Economic net present value of recovered materialsERR
(economic rate of return)
Section 5.2, Section 6, Section 7.1 and Section 7.2
Financial gain through the reuse of recovered material in terms of CE [1,7,8](1 − a), (1 − b),
(1 − c),…
(ERR coefficient)
Section 8
Beneficial price value of recovered materials
Disclaimer/Publisher’s Note: The statements, opinions and data contained in all publications are solely those of the individual author(s) and contributor(s) and not of MDPI and/or the editor(s). MDPI and/or the editor(s) disclaim responsibility for any injury to people or property resulting from any ideas, methods, instructions or products referred to in the content.

