


Geomorphological Evolution of Volcanic Cliffs in Coastal Areas: The Case of Maronti Bay (Ischia Island)

Abstract
:1. Introduction
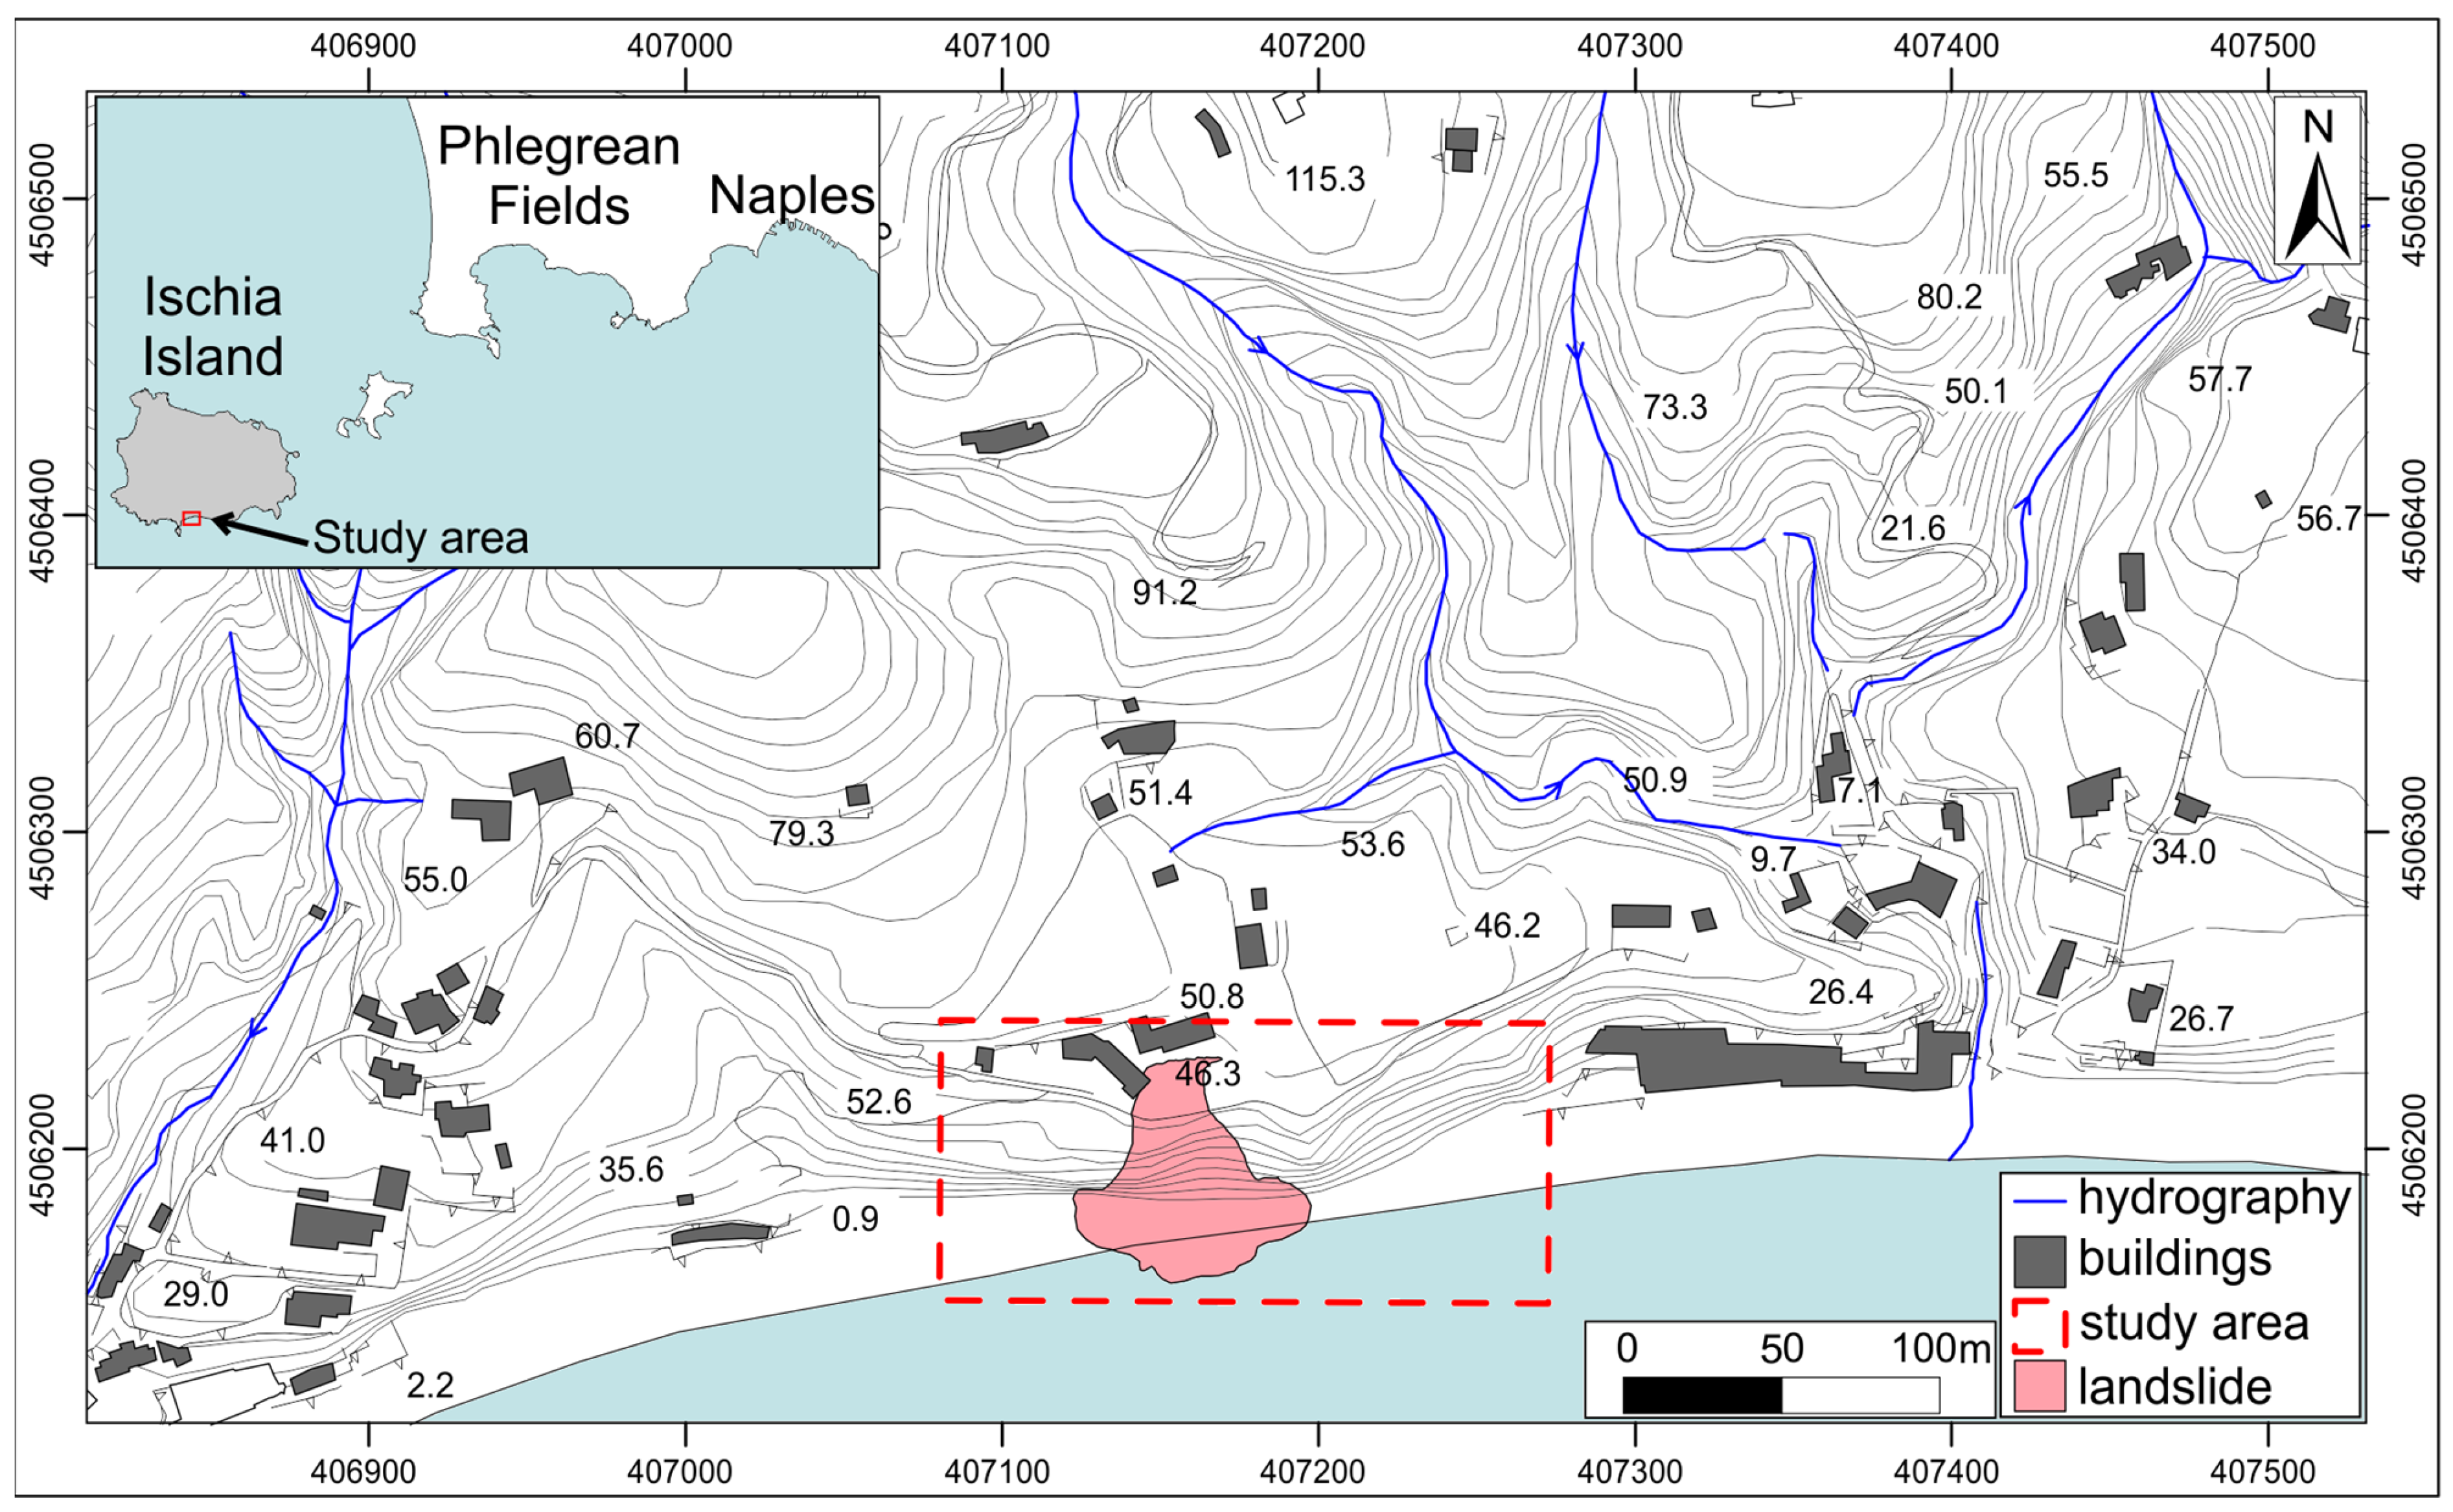
2. Study Area
2.1. Geological Setting
- -
- In the eastern sector there is a gravel-size (1–10 cm) grain-supported debris flow unit, with a sandy matrix and a light beige colour. The clasts comprise siltites of Colle Jetto, Tufite, tuffs, and lavas, appearing with both sharp and rounded edges;
- -
- Below the latter unit, there is another debris flow body, with an olive-green colour, exposed in the central sector of the coastal area. Its thickness varies from 2 to about 10 m. This unit is mainly composed of clasts of Colle Jetto siltites and small inclusions of Tufite and lava;
- -
- In turn, the latter unit has an erosive contact with another debris flow body in the central–western sector of Maronti beach. This unit is mainly composed of clasts of dark green Tufite, occasionally containing sub-rounded inclusions of siltites of Colle Jetto and lavas.
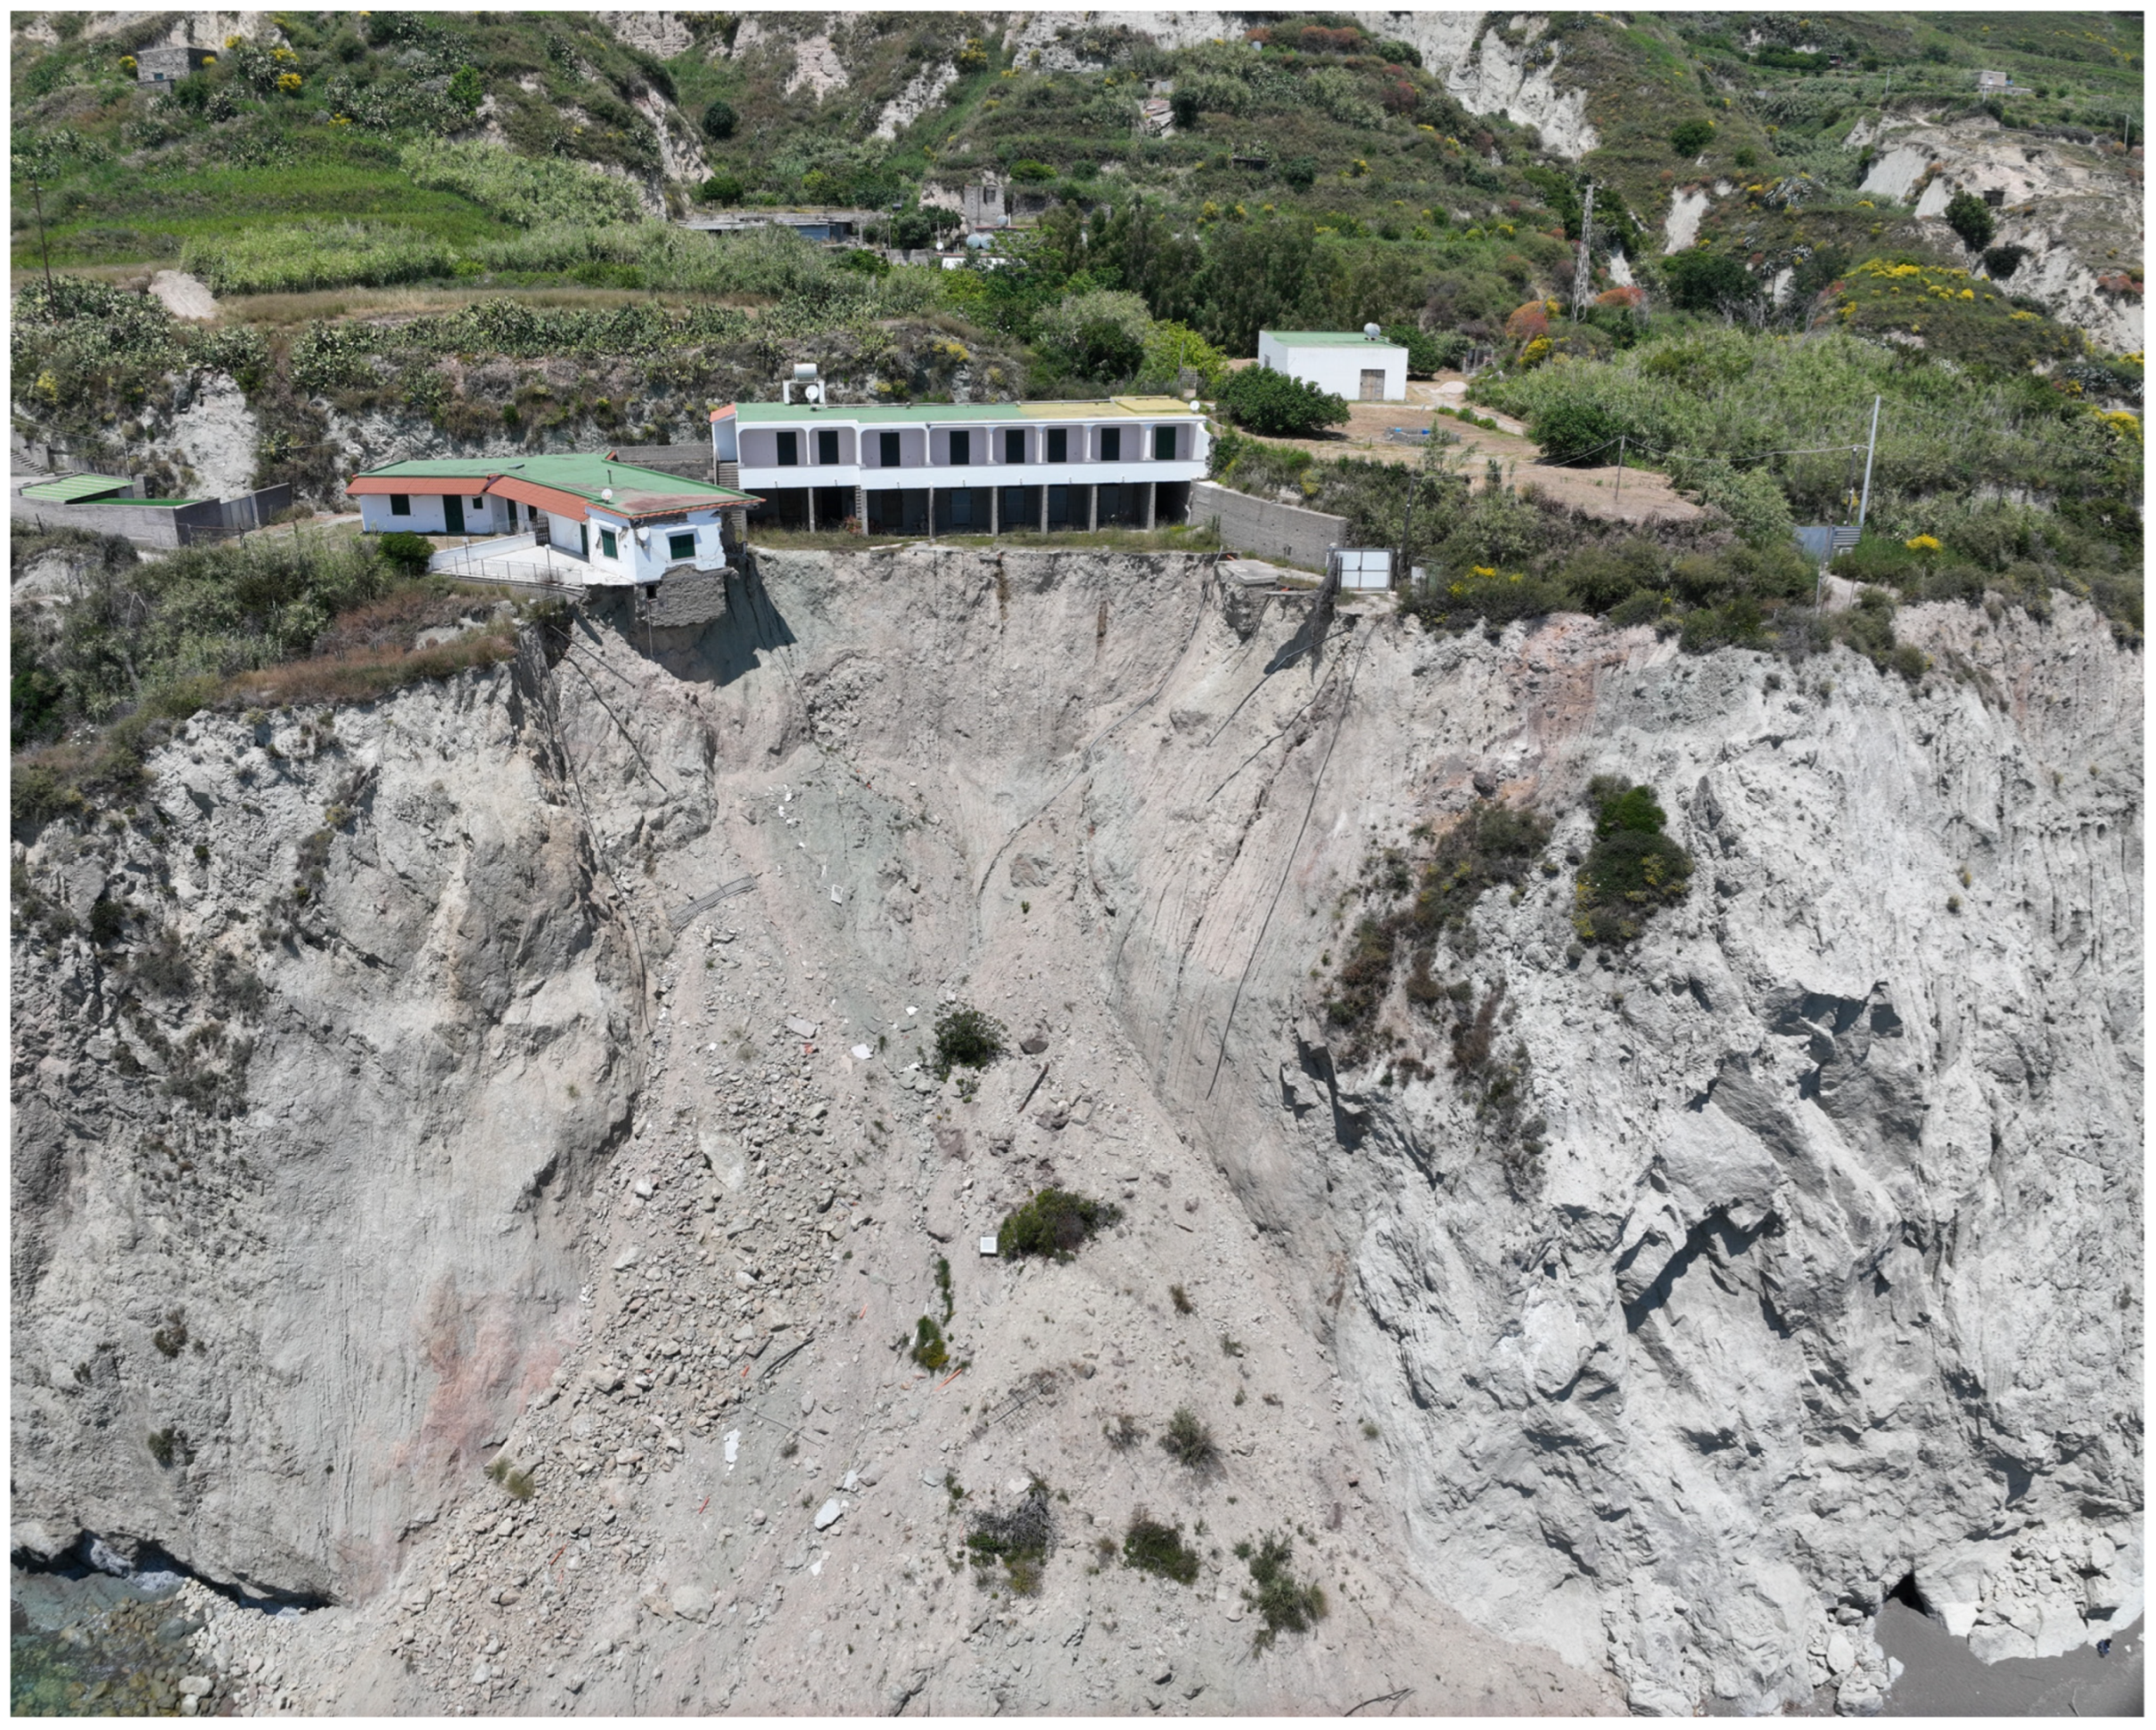
2.2. Historical Cliff Instability
3. Data and Methods
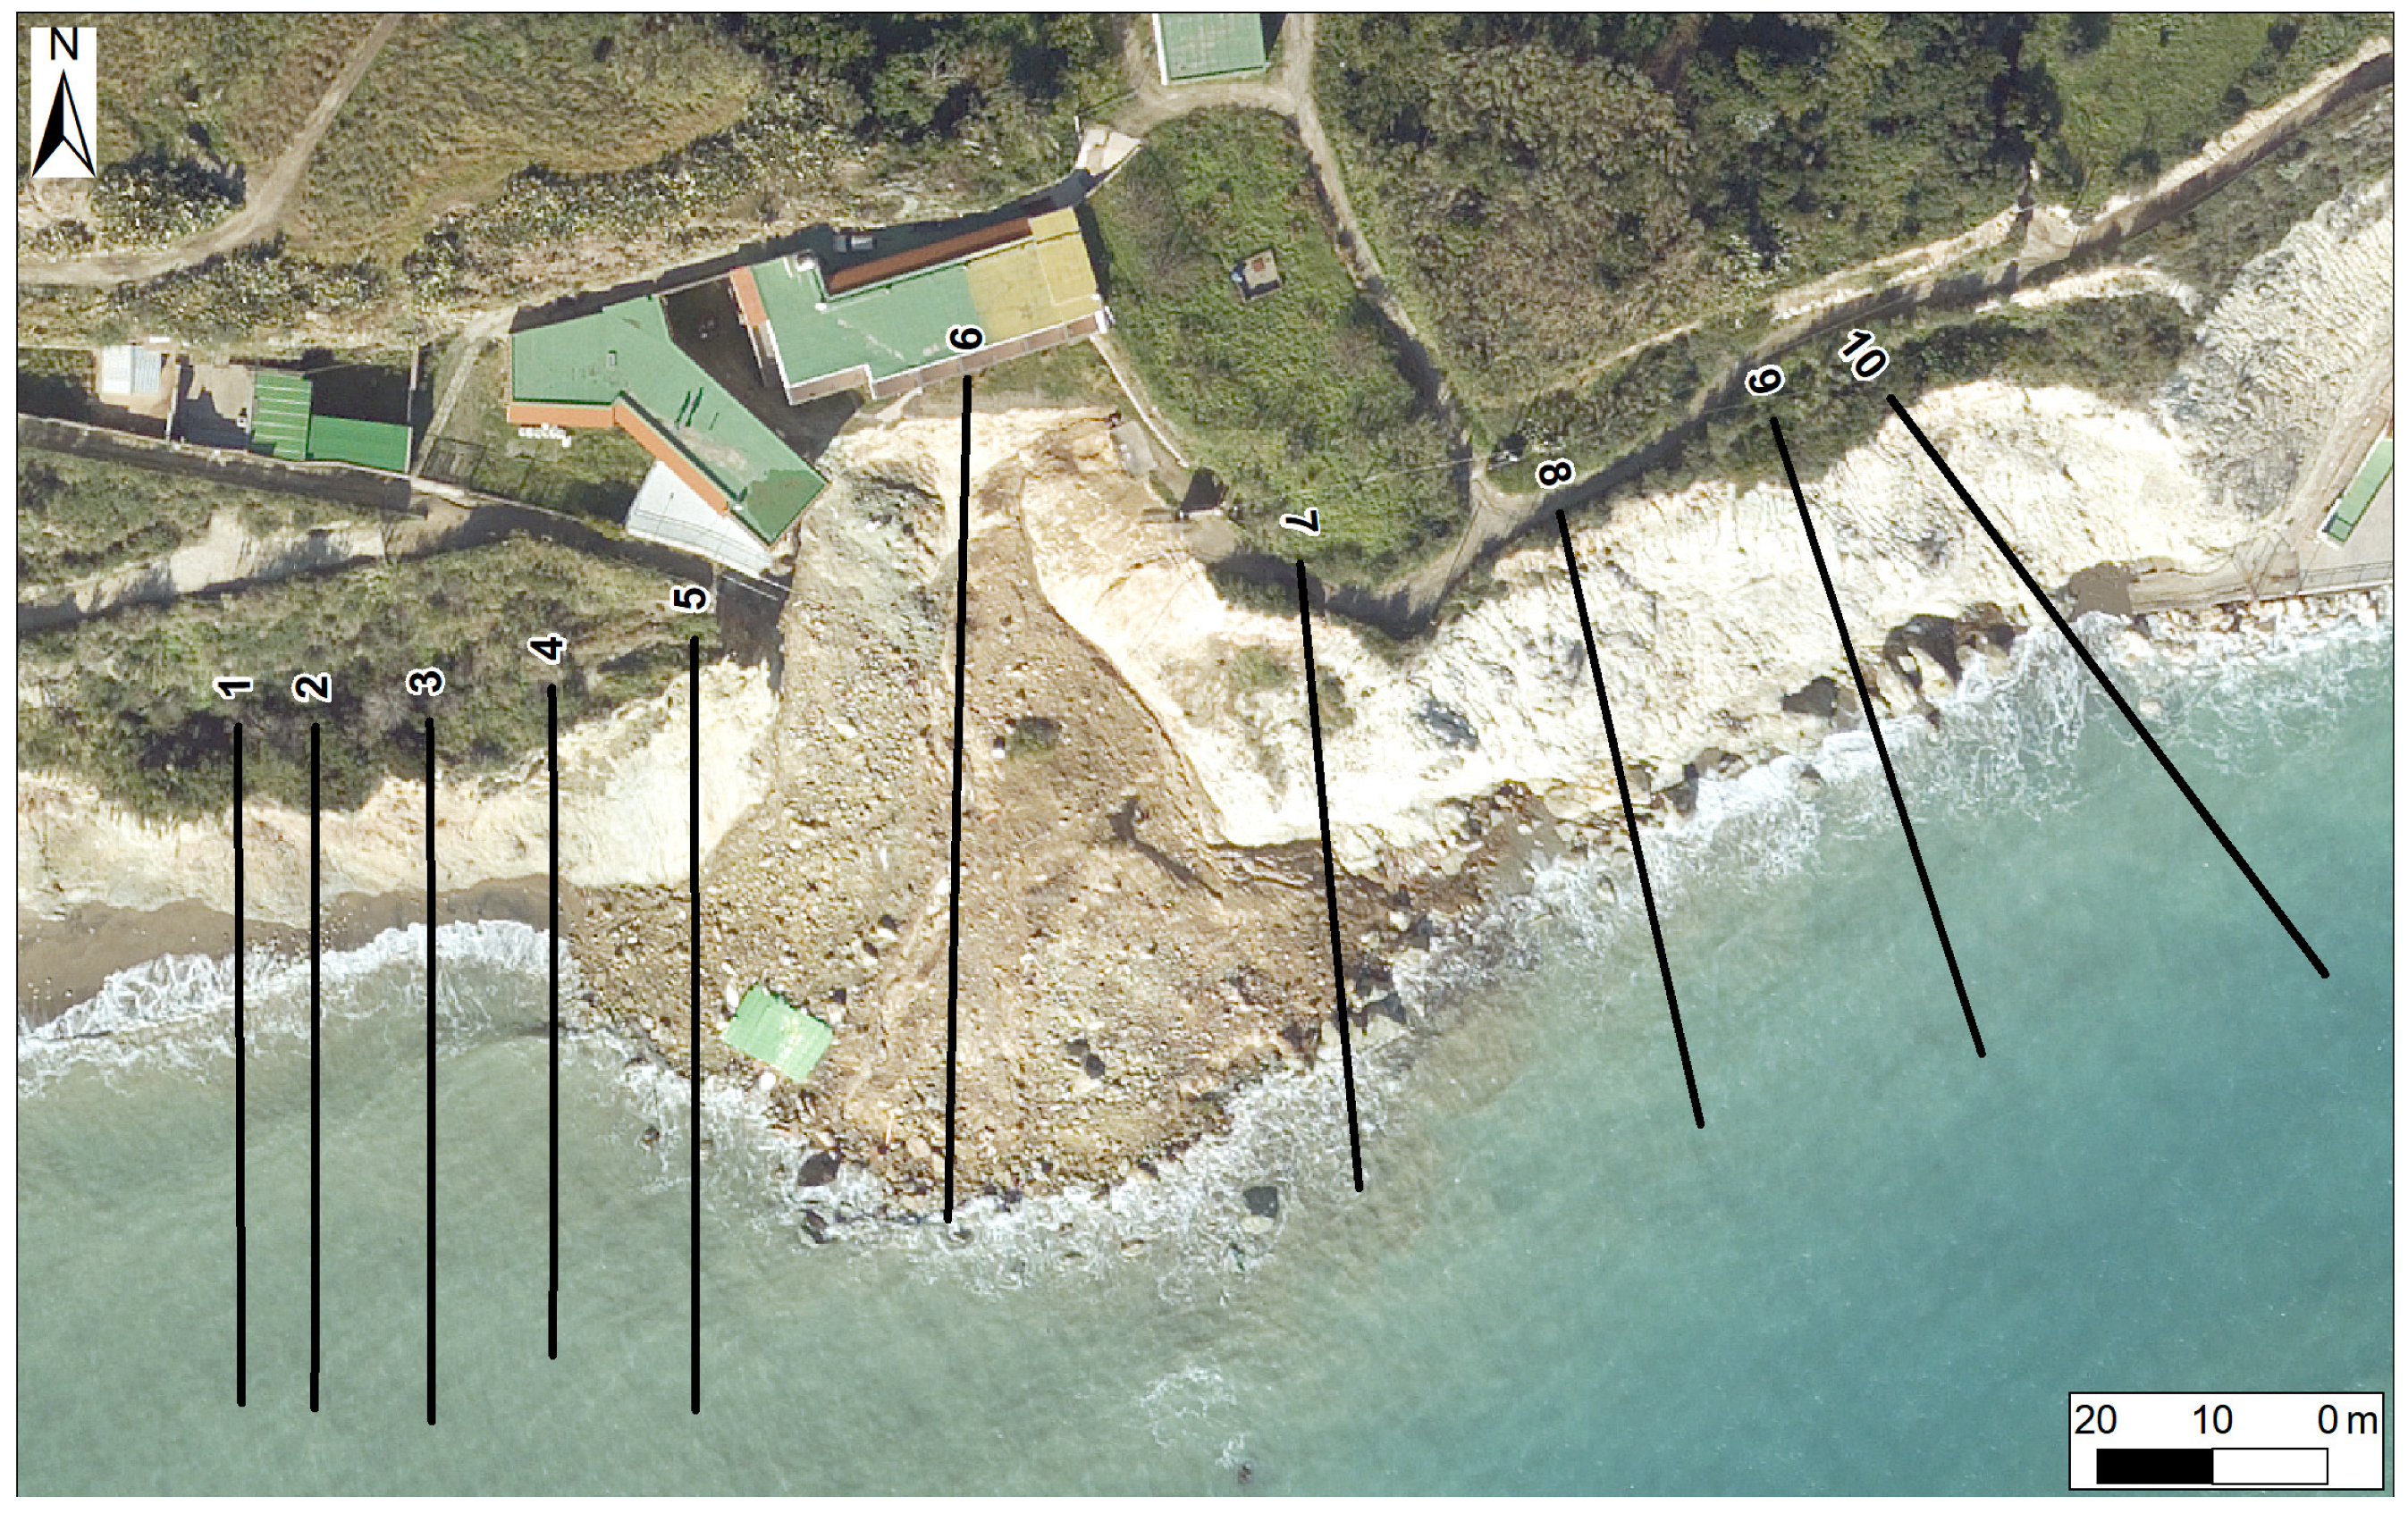
4. Results
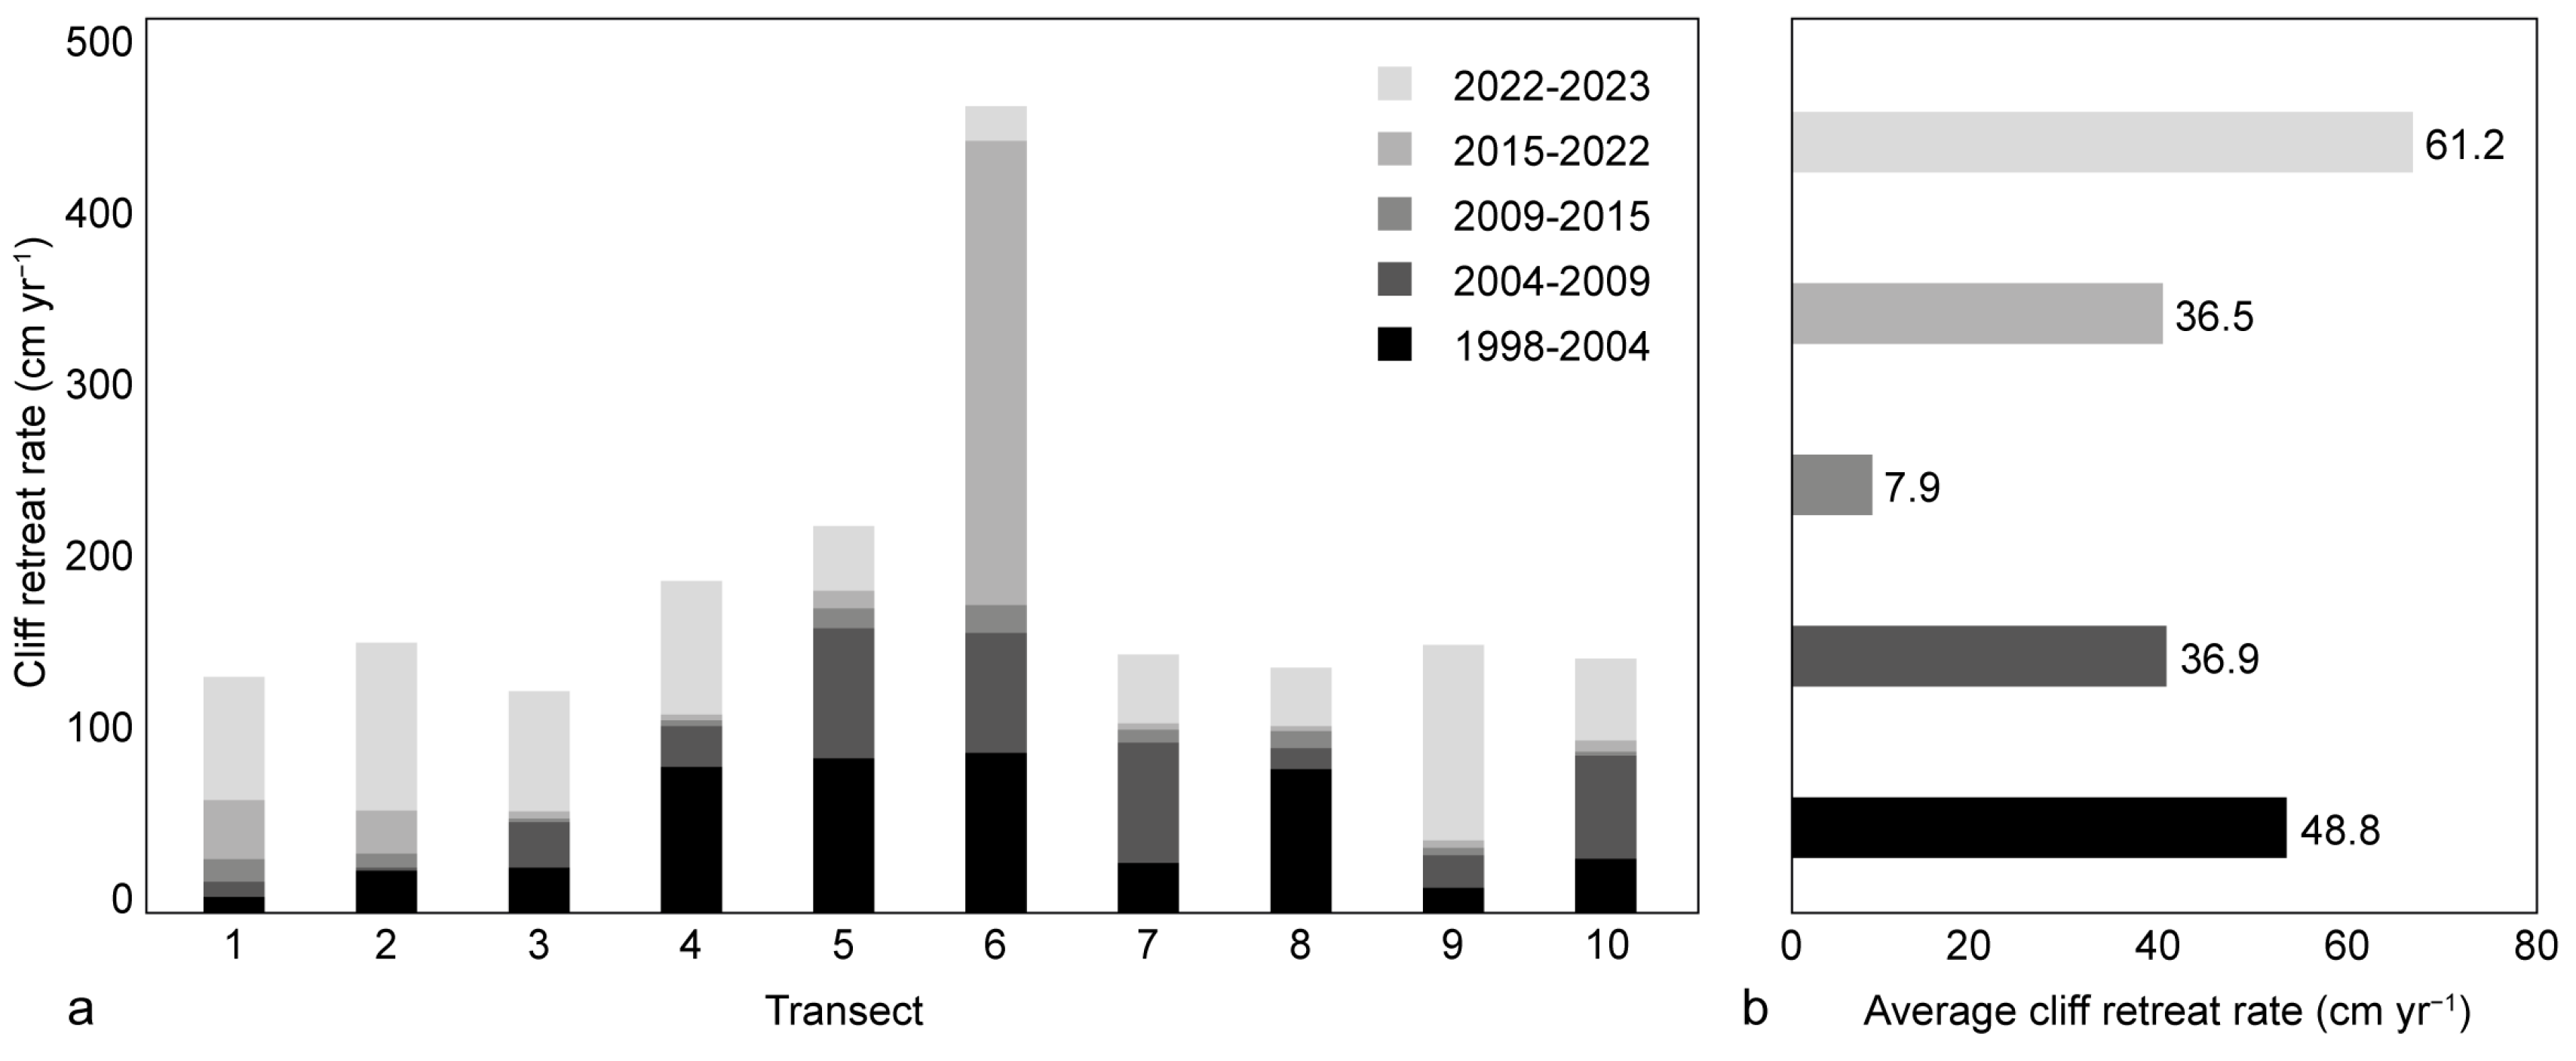
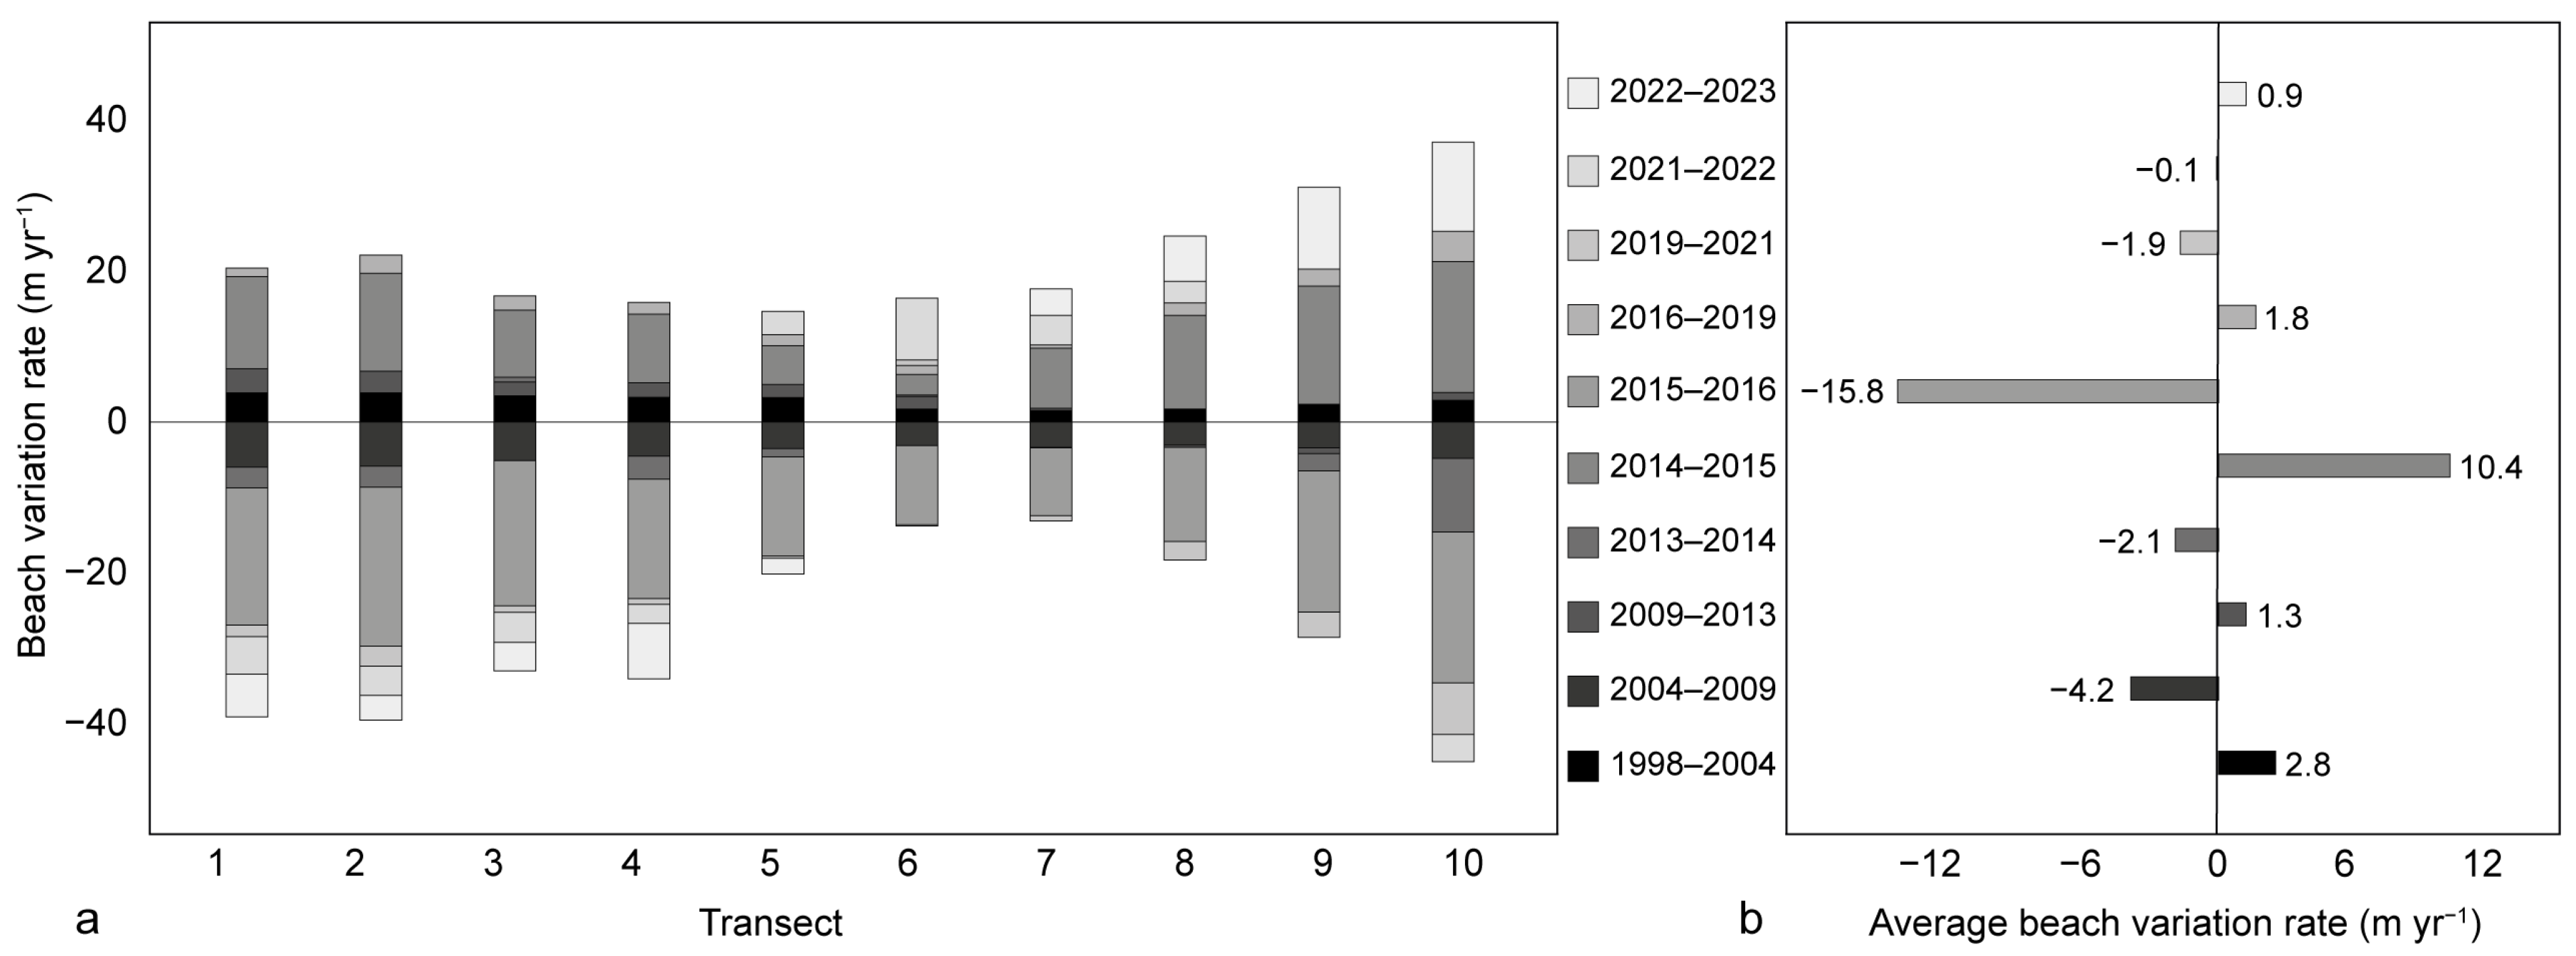
4.1. Temporal Evolution
- -
- The amount of cliff retreat is higher for the transects T4–T6, which represent the central part of the cliff (Figure 3) where the landslide events mainly occurred.
- -
- The highest regression rate is registered in the 2015–2022 period on the T6 (about 271 cm yr−1), with the landslide event of the 26 November 2022 playing a primary role.
- -
- On average, the 2022–2023 and the 2009–2015 intervals show the highest (about 61 cm yr−1) and the lowest (about 8 cm yr−1) cliff retreat rates, respectively.
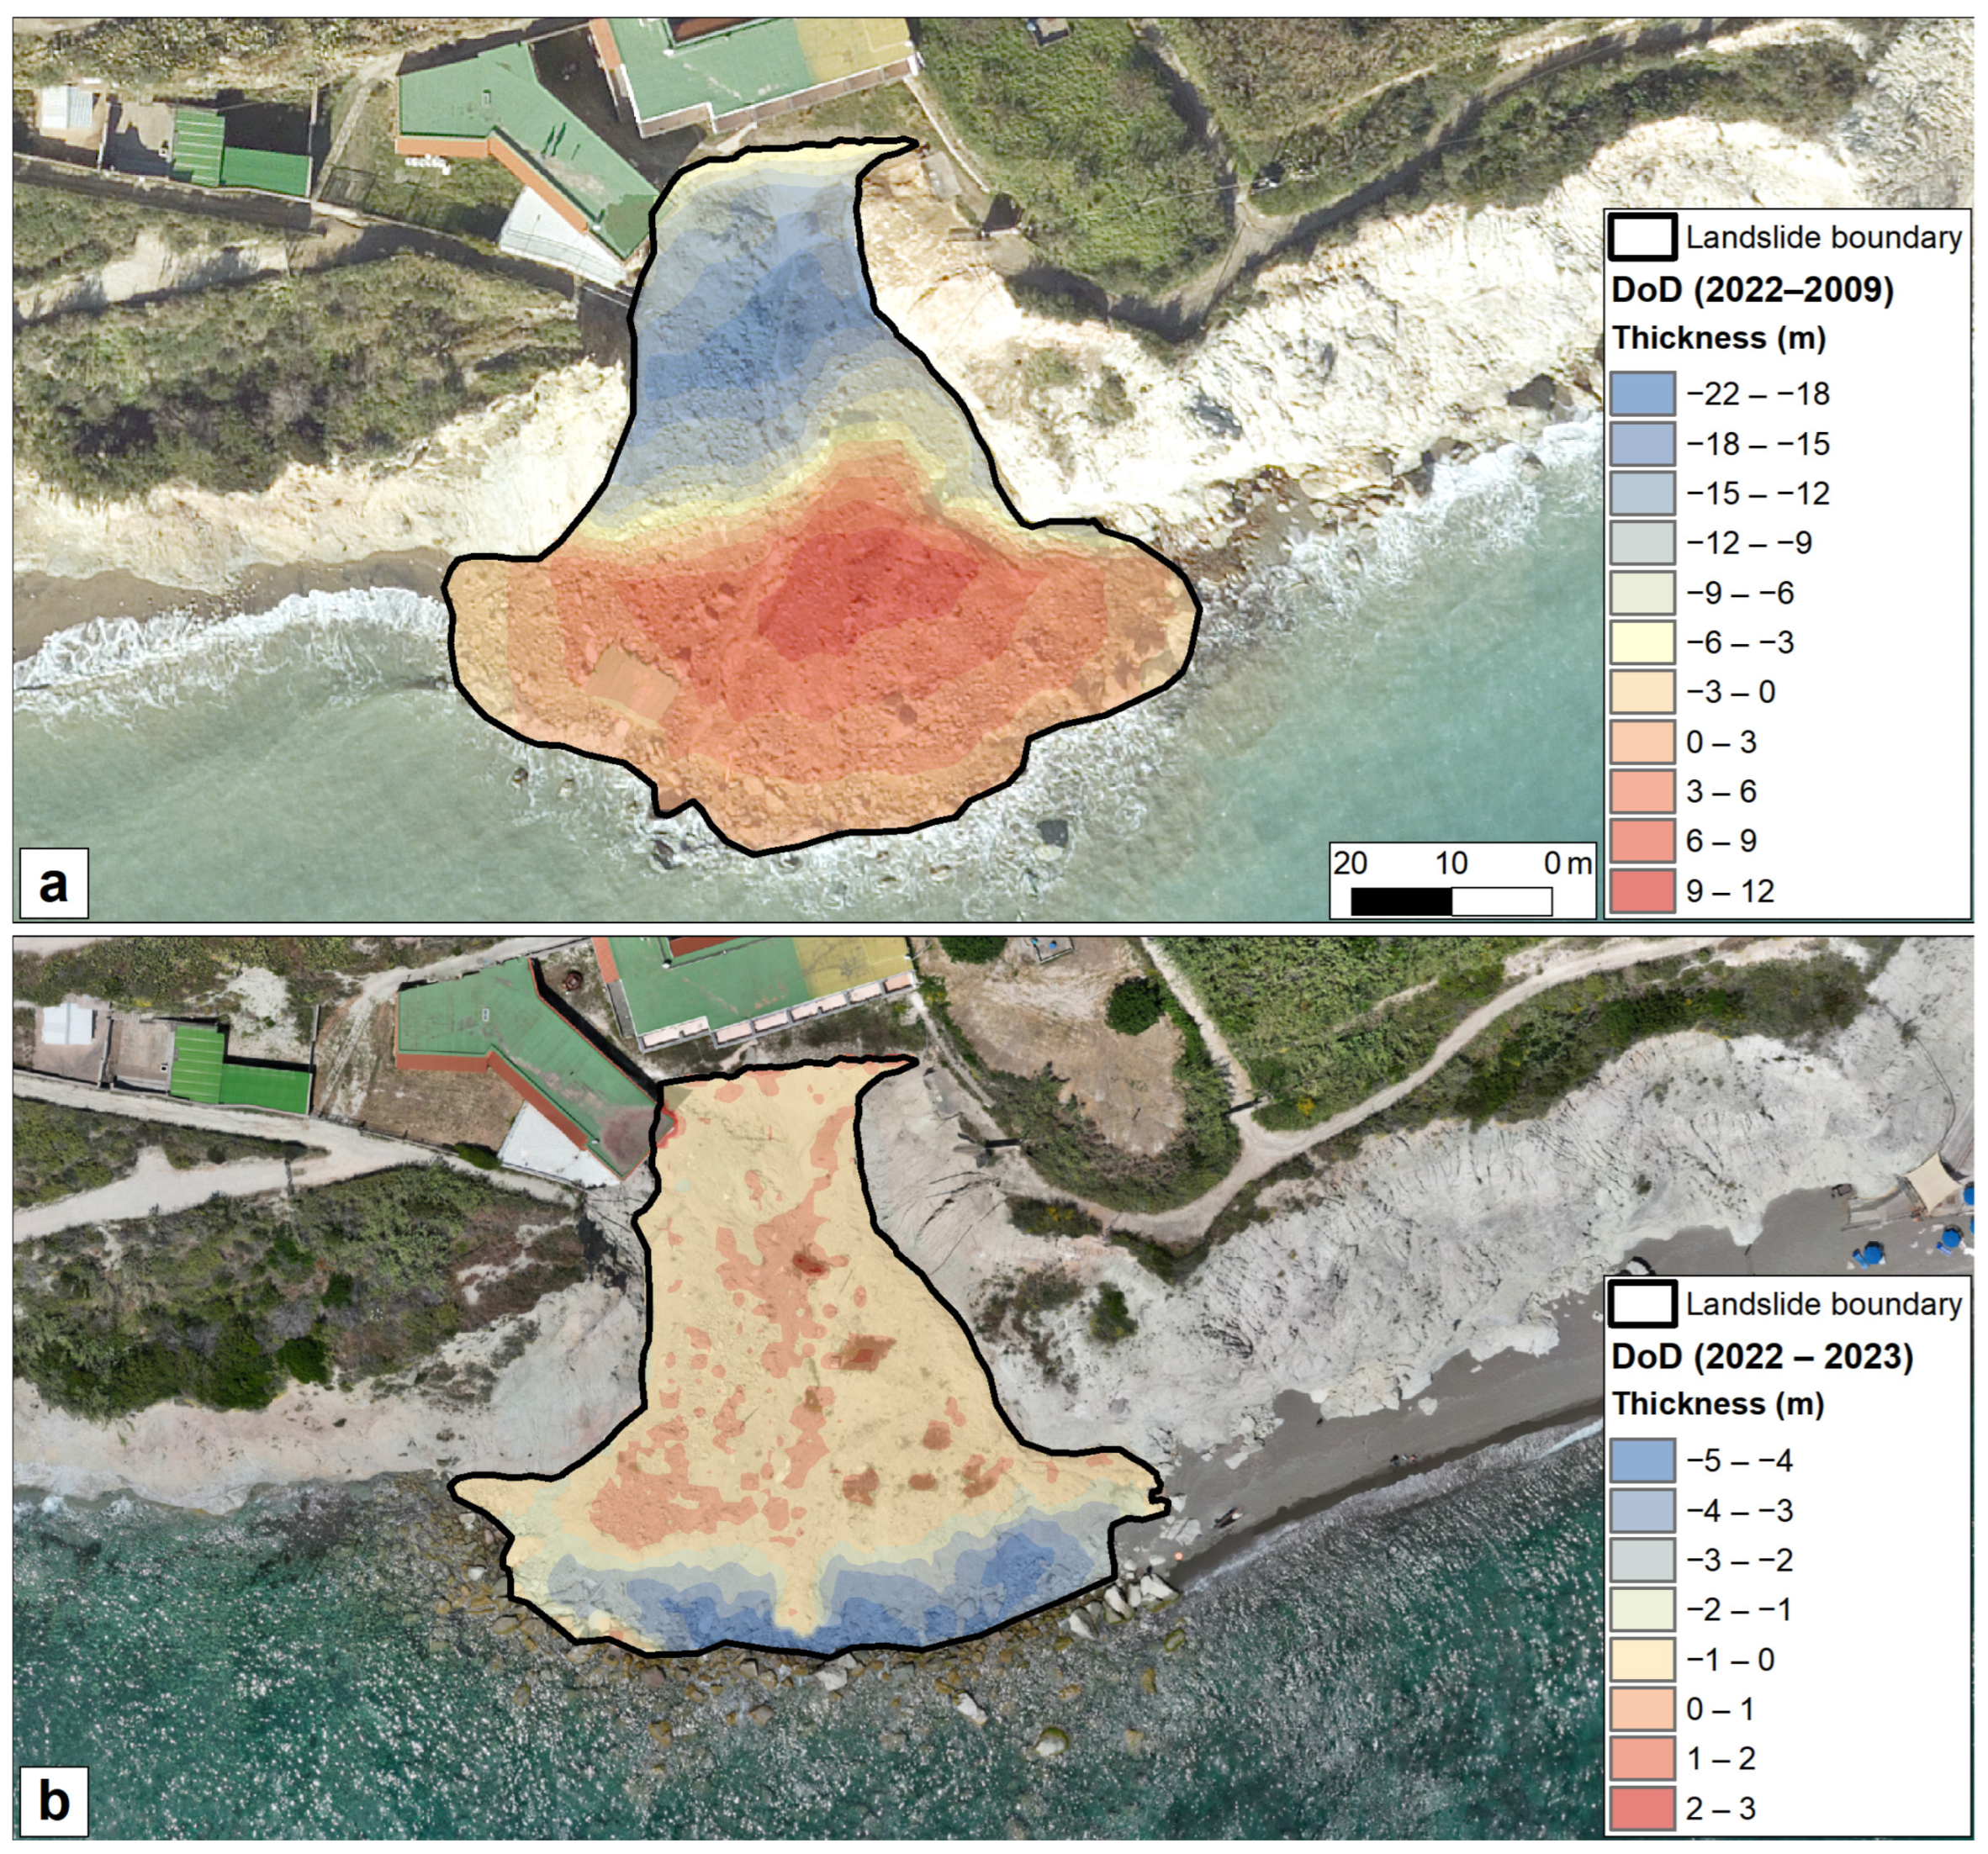
4.2. November 2022 Landslide
5. Discussion
6. Conclusions
- This is a relevant case study for multi-hazards, as characterized by a high slope instability as well as accelerated coastal erosion;
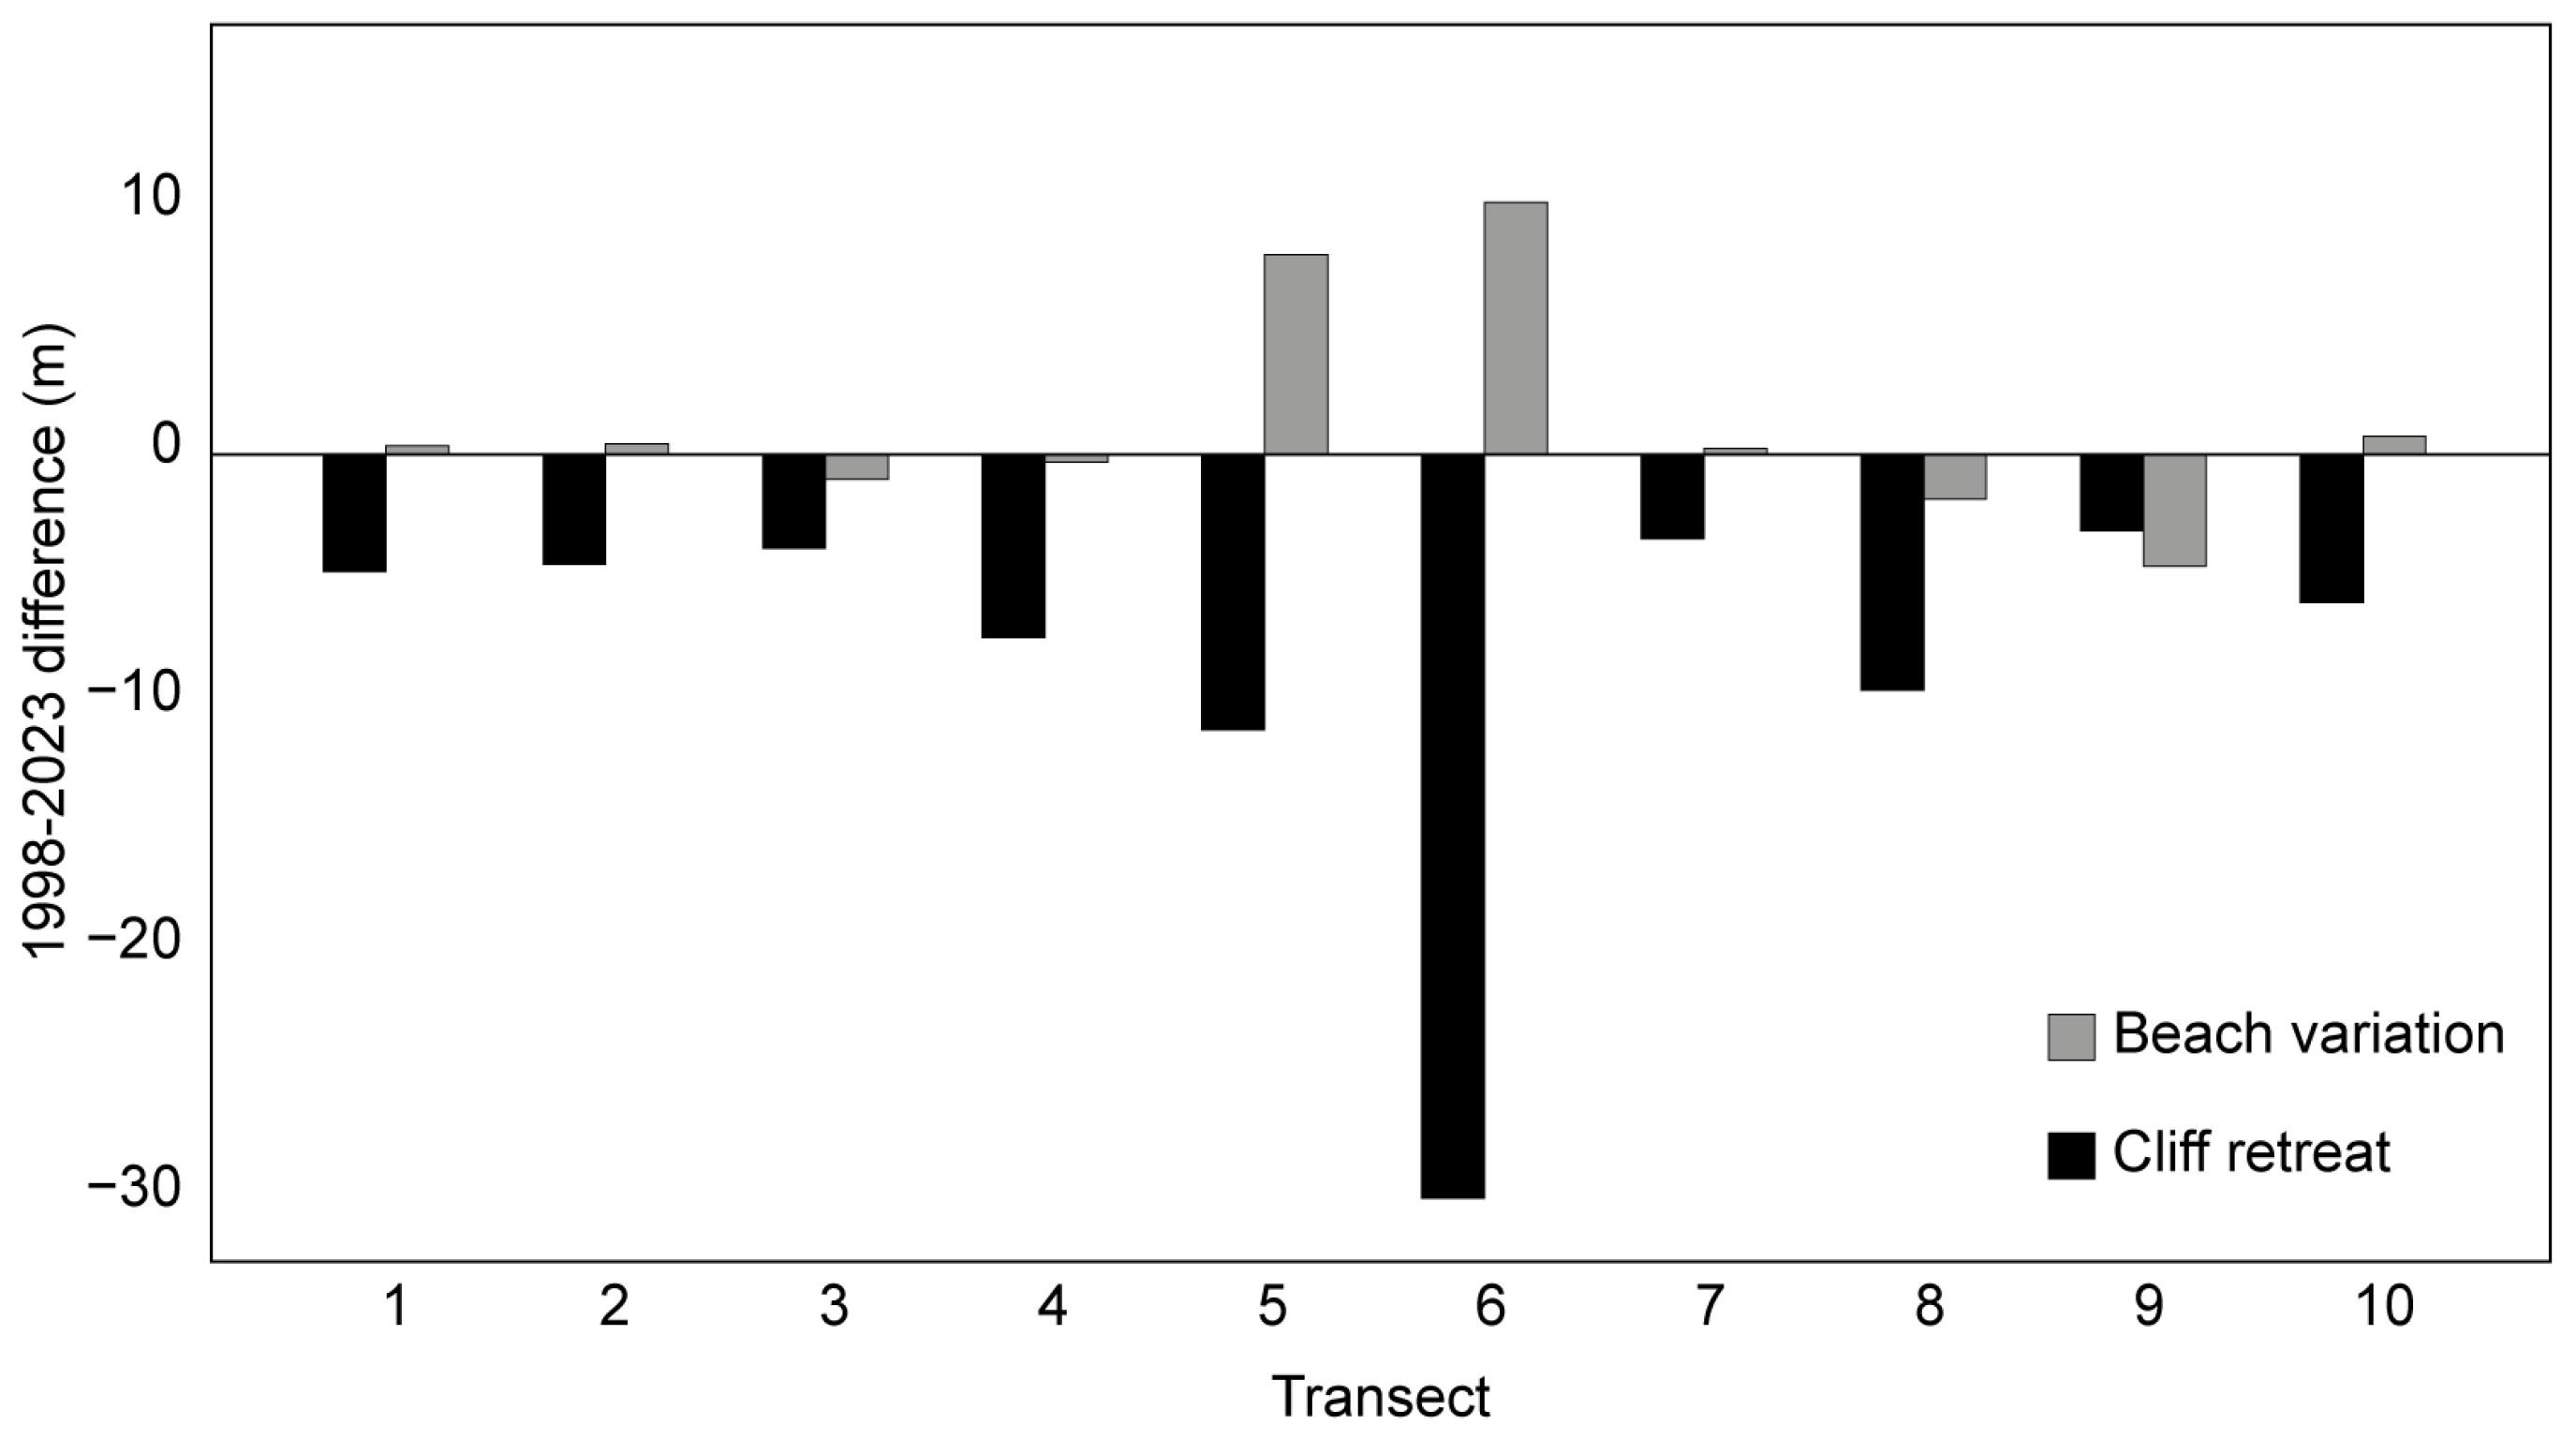
- In 25 years of historical analysis, the coastline mainly regressed despite the high production of debris coming from the failures of the sea cliff;
- These two processes were strongly related, as the main morphogenetic agent of the area was represented by the impact of the waves;
- The recent debris avalanche was studied in detail through the DoD approach, enabling an estimation of the total mobilised volume of about 29,700 m3.
Author Contributions
Funding
Data Availability Statement
Acknowledgments
Conflicts of Interest
References
- Benumof, B.T.; Storlazzi, C.D.; Seymour, R.J.; Griggs, G.B. The relationship between incident wave energy and seacliff erosion rates: San Diego County, California. J. Coast. Res. 2000, 16, 1162–1178. [Google Scholar]
- Bonasera, M.; Cerrone, C.; Caso, F.; Lanza, S.; Fubelli, G.; Randazzo, G. Geomorphological and Structural Assessment of the Coastal Area of Capo Faro Promontory, NE Salina (Aeolian Islands, Italy). Land 2022, 11, 1106. [Google Scholar] [CrossRef]
- Budetta, P.; Galietta, G.; Santo, A. A methodology for the study of the relation between coastal cliff erosion and the mechanical strength of soils and rock masses. Eng. Geol. 2000, 56, 243–256. [Google Scholar] [CrossRef]
- Callaghan, D.P.; Roshanka, R.; Andrew, S. Quantifying the storm erosion hazard for coastal planning. Coast. Eng. 2009, 56, 90–93. [Google Scholar] [CrossRef]
- Laksono, F.A.; Borzì, L.; Distefano, S.; Di Stefano, A.; Kovács, J. Shoreline Prediction Modelling as a Base Tool for Coastal Management: The Catania Plain Case Study (Italy). J. Mar. Sci. Eng. 2022, 10, 1988. [Google Scholar] [CrossRef]
- Molina, R.; Anfuso, G.; Manno, G.; Gracia Prieto, F.J. The Mediterranean Coast of Andalusia (Spain): Medium-Term Evolution and Impacts of Coastal Structures. Sustainability 2019, 11, 3539. [Google Scholar] [CrossRef]
- Elsner, J.B.; Kossin, J.P.; Jagger, T.H. The increasing intensity of the strongest tropical cyclones. Nature 2008, 455, 92–95. [Google Scholar] [CrossRef]
- Wahl, T.; Plant, N.G. Changes in erosion and flooding risk due to long-term and cyclic oceanographic trends. Geophys. Res. Lett. 2015, 42, 2943–2950. [Google Scholar] [CrossRef]
- Bengtsson, L.; Hodges, K.I.; Esch, M.; Keenlyside, N.; Kornblueh, L.; Luo, J.-J.; Yamagata, T. How may tropical cyclones change in a warmer climate? Tellus A Dyn. Meteorol. Oceanogr. 2007, 59, 539–561. [Google Scholar] [CrossRef]
- Zhang, H.; Sheng, J. Examination of extreme sea levels due to storm surges and tides over the northwest Pacific Ocean. Cont. Shelf Res. 2015, 93, 81–97. [Google Scholar] [CrossRef]
- Harley, M. Coastal Storm Definition. In Coastal Storms; Wiley Online Library: Hoboken, NJ, USA, 2017; pp. 1–21. [Google Scholar]
- Syvitski, J.P.M.; Peckham, S.D.; Hilberman, R.; Mulder, T. Predicting the terrestrial flux of sediment to the global ocean: A planetary perspective. Sediment. Geol. 2003, 162, 5–24. [Google Scholar] [CrossRef]
- Regard, V.; Prémaillon, M.; Dewez, T.J.B.; Carretier, S.; Jeandel, C.; Godderis, Y.; Bonnet, S.; Schott, J.; Pedoja, K.; Martinod, J.; et al. Rock coast erosion: An overlooked source of sediments to the ocean. Europe as an example. Earth Planet. Sci. Lett. 2022, 579, 117356. [Google Scholar] [CrossRef]
- Bush, D.M.; Richmond, B.M.; Neal, W.J. Coastal-zone hazard maps and recommendations: Eastern Puerto Rico. Environ. Geosci. 2001, 8, 38–60. [Google Scholar] [CrossRef]
- Quesada-Román, A.; Peralta-Reyes, M. Geomorphological Mapping Global Trends and Applications. Geographies 2023, 3, 610–621. [Google Scholar] [CrossRef]
- Bush, D.M.; Neal, W.J.; Young, R.S.; Pilkey, O.H. Utilization of geoindicators for rapid assessment of coastal-hazard risk and mitigation. Ocean. Coast. Manag. 1999, 42, 647–670. [Google Scholar] [CrossRef]
- Berger, A. Assessing rapid environmental change using geoindicators. Environ. Geol. 1997, 32, 36–44. [Google Scholar] [CrossRef]
- De Pippo, T.; Donadio, C.; Pennetta, M.; Terlizzi, F.; Valente, A. Application of a method to assess coastal hazard: The cliffs of the Sorrento Peninsula and Capri (southern Italy). Geol. Soc. Lond. Spec. Publ. 2009, 322, 189–204. [Google Scholar] [CrossRef]
- Martinez, C.; Winckler, P.; Agredano, R.; Esparza, C.; Torres, I.; Contreras, M. Coastal erosion in sandy beaches along a tectonically active coast: The Chile study case. Prog. Phys. Geogr. Earth Environ. 2021, 46, 250–271. [Google Scholar] [CrossRef]
- Komar, P.D. Beach processes and sedimentation. EOS Trans. Am. Geophys. Union 1977, 58, 1092. [Google Scholar]
- Van Rijn, L.C. Coastal erosion and control. Ocean. Coast. Manag. 2011, 54, 867–887. [Google Scholar] [CrossRef]
- Alvioli, M.; De Matteo, A.; Castaldo, R.; Tizzani, P.; Reichenbach, P. Three-dimensional simulations of rockfalls in Ischia, Southern Italy, and preliminary susceptibility zonation. Geomat. Nat. Hazards Risk 2022, 13, 2712–2736. [Google Scholar] [CrossRef]
- Caccavale, M.; Matano, F.; Sacchi, M. An integrated approach to earthquake-induced landslide hazard zoning based on probabilistic seismic scenario for Phlegrean Islands (Ischia, Procida and Vivara), Italy. Geomorphology 2017, 295, 235–259. [Google Scholar] [CrossRef]
- de Vita, S.; Sansivero, F.; Orsi, G.; Marotta, E. Cyclical slope instability and volcanism related to volcano-tectonism in resurgent calderas: The Ischia island (Italy) case study. Eng. Geol. 2006, 86, 148–165. [Google Scholar] [CrossRef]
- Del Prete, S.; Mele, R. Il contributo delle informazioni storiche per la valutazione della propensione al dissesto nell’Isola d’Ischia. Rend. Soc. Geol. It Nuova Ser. 2006, 2, 29–47. [Google Scholar]
- Del Prete, S.; Mele, R. L’Influenza dei fenomeni d’instabilita di versante nel quadro morfoevolutivo della costa dell’isola d’Ischia. Boll. Della Soc. Geol. Ital. 1999, 118, 339–360. [Google Scholar]
- Santo, A.; Di Crescenzo, G.; Del Prete, S.; Di Iorio, L. The Ischia island flash flood of November 2009 (Italy): Phenomenon analysis and flood hazard. Phys. Chem. Earth Parts A/B/C 2012, 49, 3–17. [Google Scholar] [CrossRef]
- De Falco, M.; Forte, G.; Marino, E.; Massaro, L.; Santo, A. UAV and field survey observations on the November 26th 2022 Celario flowslide, Ischia Island (Southern Italy). J. Maps 2023, 19, 2261484. [Google Scholar] [CrossRef]
- Selva, J.; Acocella, V.; Bisson, M.; Caliro, S.; Costa, A.; Della Seta, M.; De Martino, P.; de Vita, S.; Federico, C.; Giordano, G.; et al. Multiple natural hazards at volcanic islands: A review for the Ischia volcano (Italy). J. Appl. Volcanol. 2019, 8, 5. [Google Scholar] [CrossRef]
- Chiesa, S.; Civetta, L.; De Lucia, M.; Orsi, G.; Poli, S. Volcanological evolution of the island of Ischia. Rend. Acc. Sci. Fis. Mat. Napoli Spec. Issue 1987, 69–83. [Google Scholar]
- Orsi, G.; De Vita, S.; Piochi, M. The volcanic island of Ischia. In Proceedings of the Volcanic Hazards and Risk in the Parthnopean Megacity, International Meeting “Cities on Volcanoes”, Rome/Naples, Italy, 28 June–4 July 1998; pp. 72–78. [Google Scholar]
- Civetta, L.; Gallo, G.; Orsi, G. Sr- and Nd-isotope and trace-element constraints on the chemical evolution of the magmatic system of Ischia (Italy) in the last 55 ka. J. Volcanol. Geotherm. Res. 1991, 46, 213–230. [Google Scholar] [CrossRef]
- Sbrana, A.; Marianelli, P.; Pasquini, G. Volcanology of Ischia (Italy). J. Maps 2018, 14, 494–503. [Google Scholar] [CrossRef]
- Duperret, A.; Genter, A.; Martinez, A.; Mortimore, R. Coastal chalk cliff instability in NW France: Role of lithology, fracture pattern and rainfall. Geol. Soc. Lond. Eng. Geol. Spec. Publ. 2004, 20, 33–55. [Google Scholar] [CrossRef]
- Hampton, M.A. Gravitational failure of sea cliffs in weakly lithified sediment. Environ. Eng. Geosci. 2002, 8, 175–191. [Google Scholar] [CrossRef]
- Quigley, R.M.; Gelinas, P.J.; Bou, W.; Packer, R.W. Cyclic erosion–instability relationships: Lake Erie north shore bluffs. Can. Geotech. J. 1977, 14, 310–323. [Google Scholar] [CrossRef]
- Giordano, L.; Ferrante, V.; Marsella, E.; Vicinanza, D. Coastal erosion processes modeling at Maronti Bay (Ischia Island–Southern Italy). In Proceedings of the ISOPE International Ocean and Polar Engineering Conference, San Francisco, CA, USA, 28 May–2 June 2006; p. ISOPE–I-06-123. [Google Scholar]
- Alberico, I.; Cavuoto, G.; Di Fiore, V.; Punzo, M.; Tarallo, D.; Pelosi, N.; Ferraro, L.; Marsella, E. Historical maps and satellite images as tools for shoreline variations and territorial changes assessment: The case study of Volturno Coastal Plain (Southern Italy). J. Coast. Conserv. 2018, 22, 919–937. [Google Scholar] [CrossRef]
- Martínez del Pozo, J.; Anfuso, G. Spatial Approach to Medium-term Coastal Evolution in South Sicily (Italy): Implications for Coastal Erosion Management. J. Coast. Res. 2008, 24, 33–42. [Google Scholar] [CrossRef]
- Bull, J.M.; Miller, H.; Gravley, D.M.; Costello, D.; Hikuroa, D.C.H.; Dix, J.K. Assessing debris flows using LIDAR differencing: 18 May 2005 Matata event, New Zealand. Geomorphology 2010, 124, 75–84. [Google Scholar] [CrossRef]
- DeLong, S.B.; Prentice, C.S.; Hilley, G.E.; Ebert, Y. Multitemporal ALSM change detection, sediment delivery, and process mapping at an active earthflow. Earth Surf. Process. Landf. 2012, 37, 262–272. [Google Scholar] [CrossRef]
- Jaboyedoff, M.; Oppikofer, T.; Abellán, A.; Derron, M.-H.; Loye, A.; Metzger, R.; Pedrazzini, A. Use of LIDAR in landslide investigations: A review. Nat. Hazards 2012, 61, 5–28. [Google Scholar] [CrossRef]
- Hungr, O.; Leroueil, S.; Picarelli, L. The Varnes classification of landslide types, an update. Landslides 2014, 11, 167–194. [Google Scholar] [CrossRef]
- Young, A.P.; Guza, R.T.; Flick, R.E.; O’Reilly, W.C.; Gutierrez, R. Rain, waves, and short-term evolution of composite seacliffs in southern California. Mar. Geol. 2009, 267, 1–7. [Google Scholar] [CrossRef]
- Alberti, S.; Olsen, M.J.; Allan, J.; Leshchinsky, B. Feedback thresholds between coastal retreat and landslide activity. Eng. Geol. 2022, 301, 106620. [Google Scholar] [CrossRef]
- Olsen, M.J.; Johnstone, E.; Driscoll, N.; Kuester, F.; Ashford, S.A. Fate and transport of seacliff failure sediment in southern California. J. Coast. Res. 2016, 76, 185–199. [Google Scholar] [CrossRef]


| Location | Date | Landslide Type | Deposit type | Sources | Damages |
|---|---|---|---|---|---|
| Testaccio-Maronti | March 1970 | Rotational sliding | Tuffs, pyroclastic deposits, and detrital deposits | Il Mattino, 1970; Il Mattino, 1978 | Destruction of “Testaccio-Maronti” road at km 1 + 800 |
| Lido dei Maronti | 7 June 1978 | Rockfall evolving into a debris flow | Detrital deposits | Il Mattino, 1978 | Invasion of the beach area and 5 fatalities |
| Lido dei Maronti (Fumarole) | 2 August 1983, 4 August 1983 | Rockfall | Detrital deposits | Il Mattino, 1983 | Invasion of the beach area and destruction of “Alba Marina” beach establishment with 1 injured person |
| Lido dei Maronti | 22 February 1987 | Rockfall | Detrital deposits | Pellegrino, 1994 | Damage to Hotel Vittoria |
| Lido dei Maronti | 14 October 1989 | Rockfall | Detrital deposits | Pellegrino, 1994 | Information not available |
| Lido dei Maronti | 6 November 1990 | Rockfall | Detrital deposits | Il Mattino, 1990 | No damages reported |
| Lido dei Maronti | September 1997 | Rockfall | Detrital deposits | Field surveys | Invasion of the beach area and damages in Via Maronti and to private buildings |
| Lido dei Maronti | 28 December 1998 | Rockfall | Detrital deposits | Field surveys | No damages reported |
| Lido dei Maronti | 30 September 1999 | Rockfall | Detrital deposits | Enti, Il Golfo, 1999 | Invasion of the beach area and damages in Via Maronti and to private buildings |
| Lido dei Maronti | 27–28 December 1999 | Rockfall | Detrital deposits | Il Golfo, 1999 e 2000 | No damages reported |
| Lido dei Maronti | 31 December 2000 | Rockfall | Detrital deposits | Il Golfo, 2001 | Invasion of the beach area |
| Lido dei Maronti | 3 January 2001 | Rockfall | Detrital deposits | Il Golfo, 2001 | Invasion of the beach area |
| Lido dei Maronti | 15 December 2020 | Rockfall | Detrital deposits | La Repubblica, 2020 | Invasion of the beach area and damages in Via Iesca |
| Lido dei Maronti | 26 November 2022 | Rockfall | Detrital deposits | Local team, 2022 | Invasion of the beach area and damage to private buildings |
| Data Type | Year | Source |
|---|---|---|
| Topographic Map (1:5000) | 1998 | Regione Campania |
| Topographic Map (1:5000) and Orthophoto | 2004 | |
| LiDAR (1 × 1 m) | 2009 | Città metropolitana |
| Satellite image | 2013 | Google Earth |
| 2014 | ||
| Topographic Map (1:5000) and Orthophoto | 2015 | Regione Campania |
| Satellite image | 2016 | Google Earth |
| 2019 | ||
| 2021 | ||
| LiDAR (1 × 1 m) and Orthophoto | 2022 | Protezione Civile |
| Orthophoto and DTM (1 × 1 m) | 2023 | Drone survey |
| Time Range | T1 | T2 | T3 | T4 | T5 | T6 | T7 | T8 | T9 | T10 |
|---|---|---|---|---|---|---|---|---|---|---|
| m | m | m | m | m | m | m | m | m | m | |
| 1998–2004 | 0.6 | 1.5 | 1.6 | 5.1 | 5.4 | 5.6 | 1.7 | 5.0 | 0.9 | 1.9 |
| 2004–2009 | 0.4 | 0.1 | 1.3 | 1.2 | 3.8 | 3.5 | 0.6 | 3.2 | 1.0 | 3.0 |
| 2009–2015 | 0.8 | 0.5 | 0.1 | 0.2 | 0.7 | 1.0 | 0.5 | 0.6 | 0.3 | 0.1 |
| 2015–2022 | 2.4 | 1.7 | 0.3 | 0.2 | 0.7 | 19.0 | 0.3 | 0.2 | 0.3 | 0.4 |
| 2022–2023 | 0.4 | 0.5 | 0.3 | 0.4 | 0.2 | 0.1 | 0.2 | 0.2 | 0.6 | 0.2 |
| Time Range | T1 | T2 | T3 | T4 | T5 | T6 | T7 | T8 | T9 | T10 |
|---|---|---|---|---|---|---|---|---|---|---|
| m | m | m | m | m | m | m | m | m | m | |
| 1998–2004 | 23.2 | 23.2 | 20.8 | 19.7 | 19.4 | 10.7 | 9.3 | 10.4 | 14.2 | 17.4 |
| 2004–2009 | −29.6 | −28.9 | −25.4 | −22.4 | −17.4 | −15.3 | −16.7 | −15.26 | −16.9 | −23.8 |
| 2009–2013 | 12.8 | 11.4 | 7.5 | 7.8 | 7.0 | 6.5 | 1.1 | −1.1 | −3.0 | 4.1 |
| 2013–2014 | −2.8 | −2.8 | 0.6 | −3.1 | −1.1 | 0.2 | −0.1 | 0.0 | −2.3 | −9.7 |
| 2014–2015 | 12.2 | 13.0 | 8.9 | 9.0 | 5.1 | 2.7 | 7.9 | 12.4 | 15.7 | 17.3 |
| 2015–2016 | −18.1 | −21.0 | −19.2 | −15.8 | −13.1 | −10.5 | −9.0 | −12.4 | −18.7 | −20.0 |
| 2016–2019 | 3.4 | 7.3 | 5.6 | 4.7 | 4.3 | 3.6 | 1.3 | 5.0 | 6.7 | 12.1 |
| 2019–2021 | −2.9 | −5.3 | −1.7 | −1.5 | −0.6 | 1.4 | −1.3 | −5.0 | −6.7 | −13.6 |
| 2021–2022 | −5.0 | −3.9 | −4.0 | −2.5 | 3.1 | 8.2 | 3.9 | 2.8 | 0.0 | −3.6 |
| 2022–2023 | −2.8 | −1.7 | −1.9 | −3.7 | −1.0 | −0.1 | 1.7 | 3.0 | 5.4 | 5.9 |
| Time Interval | Landslide Area | Average Erosion Thickness | Average Deposition Thickness | Eroded Volume | Deposited Volume |
|---|---|---|---|---|---|
| m2 | m | m | m3 | m3 | |
| 2009–2022 | 2828 | −10.5 | 4.6 | 29,700 | 13,000 |
| 2022–2023 | 2176 | −1.2 | 0.3 | 2600 | 650 |
Disclaimer/Publisher’s Note: The statements, opinions and data contained in all publications are solely those of the individual author(s) and contributor(s) and not of MDPI and/or the editor(s). MDPI and/or the editor(s) disclaim responsibility for any injury to people or property resulting from any ideas, methods, instructions or products referred to in the content. |
© 2023 by the authors. Licensee MDPI, Basel, Switzerland. This article is an open access article distributed under the terms and conditions of the Creative Commons Attribution (CC BY) license (https://creativecommons.org/licenses/by/4.0/).
Share and Cite
Massaro, L.; Forte, G.; De Falco, M.; Santo, A. Geomorphological Evolution of Volcanic Cliffs in Coastal Areas: The Case of Maronti Bay (Ischia Island). Geosciences 2023, 13, 313. https://doi.org/10.3390/geosciences13100313
Massaro L, Forte G, De Falco M, Santo A. Geomorphological Evolution of Volcanic Cliffs in Coastal Areas: The Case of Maronti Bay (Ischia Island). Geosciences. 2023; 13(10):313. https://doi.org/10.3390/geosciences13100313
Chicago/Turabian StyleMassaro, Luigi, Giovanni Forte, Melania De Falco, and Antonio Santo. 2023. "Geomorphological Evolution of Volcanic Cliffs in Coastal Areas: The Case of Maronti Bay (Ischia Island)" Geosciences 13, no. 10: 313. https://doi.org/10.3390/geosciences13100313