Article

Mineralogy and Mineral Chemistry of the REE-Rich Black Sands in Beaches of the Kavala District, Northern Greece

by
Eftychia Peristeridou
1,
Vasilios Melfos
1,*,
Lambrini Papadopoulou
1,
Nikolaos Kantiranis
1 and
Panagiotis Voudouris
2
1
Faculty of Geology, Aristotle University of Thessaloniki, 54124 Thessaloniki, Greece
2
Faculty of Geology & Geoenvironment, National and Kapodistrian University of Athens, 15784 Athens, Greece
*
Author to whom correspondence should be addressed.
Geosciences 2022, 12(7), 277; https://doi.org/10.3390/geosciences12070277
Submission received: 14 May 2022 / Revised: 15 June 2022 / Accepted: 8 July 2022 / Published: 10 July 2022
(This article belongs to the Section Geochemistry)

Abstract

:
The coastal area of the Kavala district, Northern Greece, is characterized by minerals enriched in rare earth elements (REE). The present study focuses on the mineralogy of the black sands from six different locations and the comprehensive mineral chemistry of the REE-bearing minerals, allanite-(Ce), epidote, monazite, thorite, zircon and titanite. Allanite-(Ce) is the most important carrier of light REE (LREE) in the studied black sands, reaching up to 23.24 wt % ΣREE. The crystal chemistry of allanite-(Ce) transitions into ferriallanite-(Ce), due to the significant involvement of Fe3+. High resolution backscattered electron (BSE) images were used to identify zoning that corresponds to variations in REE, Th and U. These modifications follow the exchange scheme: (Ca + (Fe3+, Al))−1(LREE, Y, Th, U + (Fe2+, Mg, Mn))+1. Epidotes may also contain up to 0.5 REE3+ apfu. Monazite and thorite are found as inclusions in allanite-(Ce) and are enriched in Ce, La and Nd, together with Th and U. Some zircons are enriched in Hf, while some titanites host Nb and V.

1. Introduction

Critical metals are essential for future sustainable technologies, as the continuous growth in population and our dependence on technological innovation cause a rapid increase in their consumption. For this reason, the European Union (EU) Raw Materials Initiative assesses and releases periodically, since 2011, a list of metals, which are critical for the industry of new technology products and the “green” energy [1]. The 2020 EU Critical Raw Materials list was defined by two main parameters, the economic importance and the supply disruption of each commodity. The list of critical metals includes among others, the rare earth elements (REE) [2].
The REE are a group of 17 chemically similar elements including the lanthanides, from lanthanum to lutetium with atomic numbers 57 to 71, along with Y and Sc, with atomic number 39 and 21, as defined by the International Union of Pure and Applied Chemistry (IUPAC). The criticality of these metals is related to their application in the high-technology products and the clean “green” energy technologies, as there are concerns about supply constraints due to geological scarcity, a small number of producing countries and supply inelasticity driven by various byproduct features [1].
The REE are not necessarily rare in nature and are found in almost all rock formations. As they are suggested to be relatively immobile in various geological environments, they are widely used in petrogenetic studies. The least abundant REE are Tm and Lu, which are estimated to be 200 times more common than gold in the Earth’s crust [3]. Thus, the REE are not rare in terms of average crustal abundance, but concentrated and economic deposits of REE are limited in number [4].
The global supply chain of rare earths is dominated by China, which controls >90% of the total production [5,6,7]. For over 50 years, carbonatites have been the primary source of Nb and REE, particularly the light rare earths (LREE) La, Ce, Pr and Nd, globally [7]. Since 2014, the largest carbonatite-type deposit, Bayan Obo (REE-Nb-Fe), in China, has been the primary supplier of the world’s LREE [8,9]. There are over 100 potential REE ore minerals, but less than ten of them have been successfully processed for REE extraction [10,11]. One of the major issues in the REE metallurgy is the environmental impact due to the radioactivity that is related to elevated concentrations of uranium (U) and thorium (Th) in these deposits.
The natural deposits of rare earths can be classified into two categories based on their geological associations: primary and the secondary deposits. The primary, high-temperature deposits are associated with magmatic intrusions, especially carbonatites and alkaline–peralkaline igneous rocks, and with hydrothermal systems. The secondary, low-temperature deposits result from sedimentary or weathering processes, and are associated with placers, offshore sediments, bauxites, Ni-laterites, and ion-adsorption clays [5,6].
Placer deposits are considered as important REE resources and mainly occur in Malaysia, India, Australia, Brazil and Sri Lanka [5]. They form from the erosion, transportation and deposition of heavy minerals, in streambeds or at sand beaches. The streams and the wave energy are sufficient to carry away the low-density material, but not the heavy minerals, and a natural separation by gravity segregation may form the black sands. The term “black sands” is used for the dark-colored formations, which are enriched in heavy minerals, including ilmenite (Ti), rutile (Ti), zircon (Zr), monazite (REE) and xenotime (REE), and are a potential source for critical metals, offering the advantages of easy mechanical separation [10,11].
The black sands along the coast of Northern Aegean in Greece, and particularly between the Strymonikos Gulf and the Eleftheres Bay, of the Kavala district (Figure 1), have attracted the attention of many exploration research projects so far. The potential of these sands was initially described by Papadakis [12]. In 1981–1984, the Institute of Geology and Mineral Exploration (IGME) carried out extensive geological, mineralogical and geochemical research on the marine sediments of the Strymonikos plateau and the gulfs of Ierissos, Strymonikos and Kavala [13]. The strong anomalies of La and Zr in the sediments led IGME to conduct detailed research in this area, for the exploration of the polymetallic placers, during the period 1996–2000 [14,15]. The area was also investigated in the frame of the EuRare project (2013–2015) that focused on mapping and characterization of REE deposits in Europe [16]. Recently, natural radioactivity measurements and detailed geochemical analyses of enriched sand fractions were conducted in order to determine the source and the chemical character of the REE-rich minerals [16,17,18,19,20,21].
Beach placers of Kavala district are considered to be one of the most promising REE sources in Greece, since they demonstrate the most significant enrichment in ΣREE + Y [19,20] compared to the other REE occurrences in Greece. The purpose of the present work is to determine the nature of the REE-bearing minerals in the black sands from six locations between the Strymonikos Gulf and Eleftheres Bay, of the Kavala district in Northern Greece (Figure 1). The chemical composition of the REE-bearing minerals (allanite-(Ce), REE-rich epidote, epidote, monazite-(Ce), monazite-(La) and thorite) together with zircon and titanite is discussed for their enrichment in Ce, La, Nd, Nb, Hf, Th and U. The findings of this study show that the detailed characterization of the chemical composition of the REE-bearing minerals is important in understanding the correlation of rare earths with other structural elements of these minerals. In addition, scanning electron microscopy–backscattered electron (SEM–BSE) imaging reveals a fundamental study for the zoning patterns.

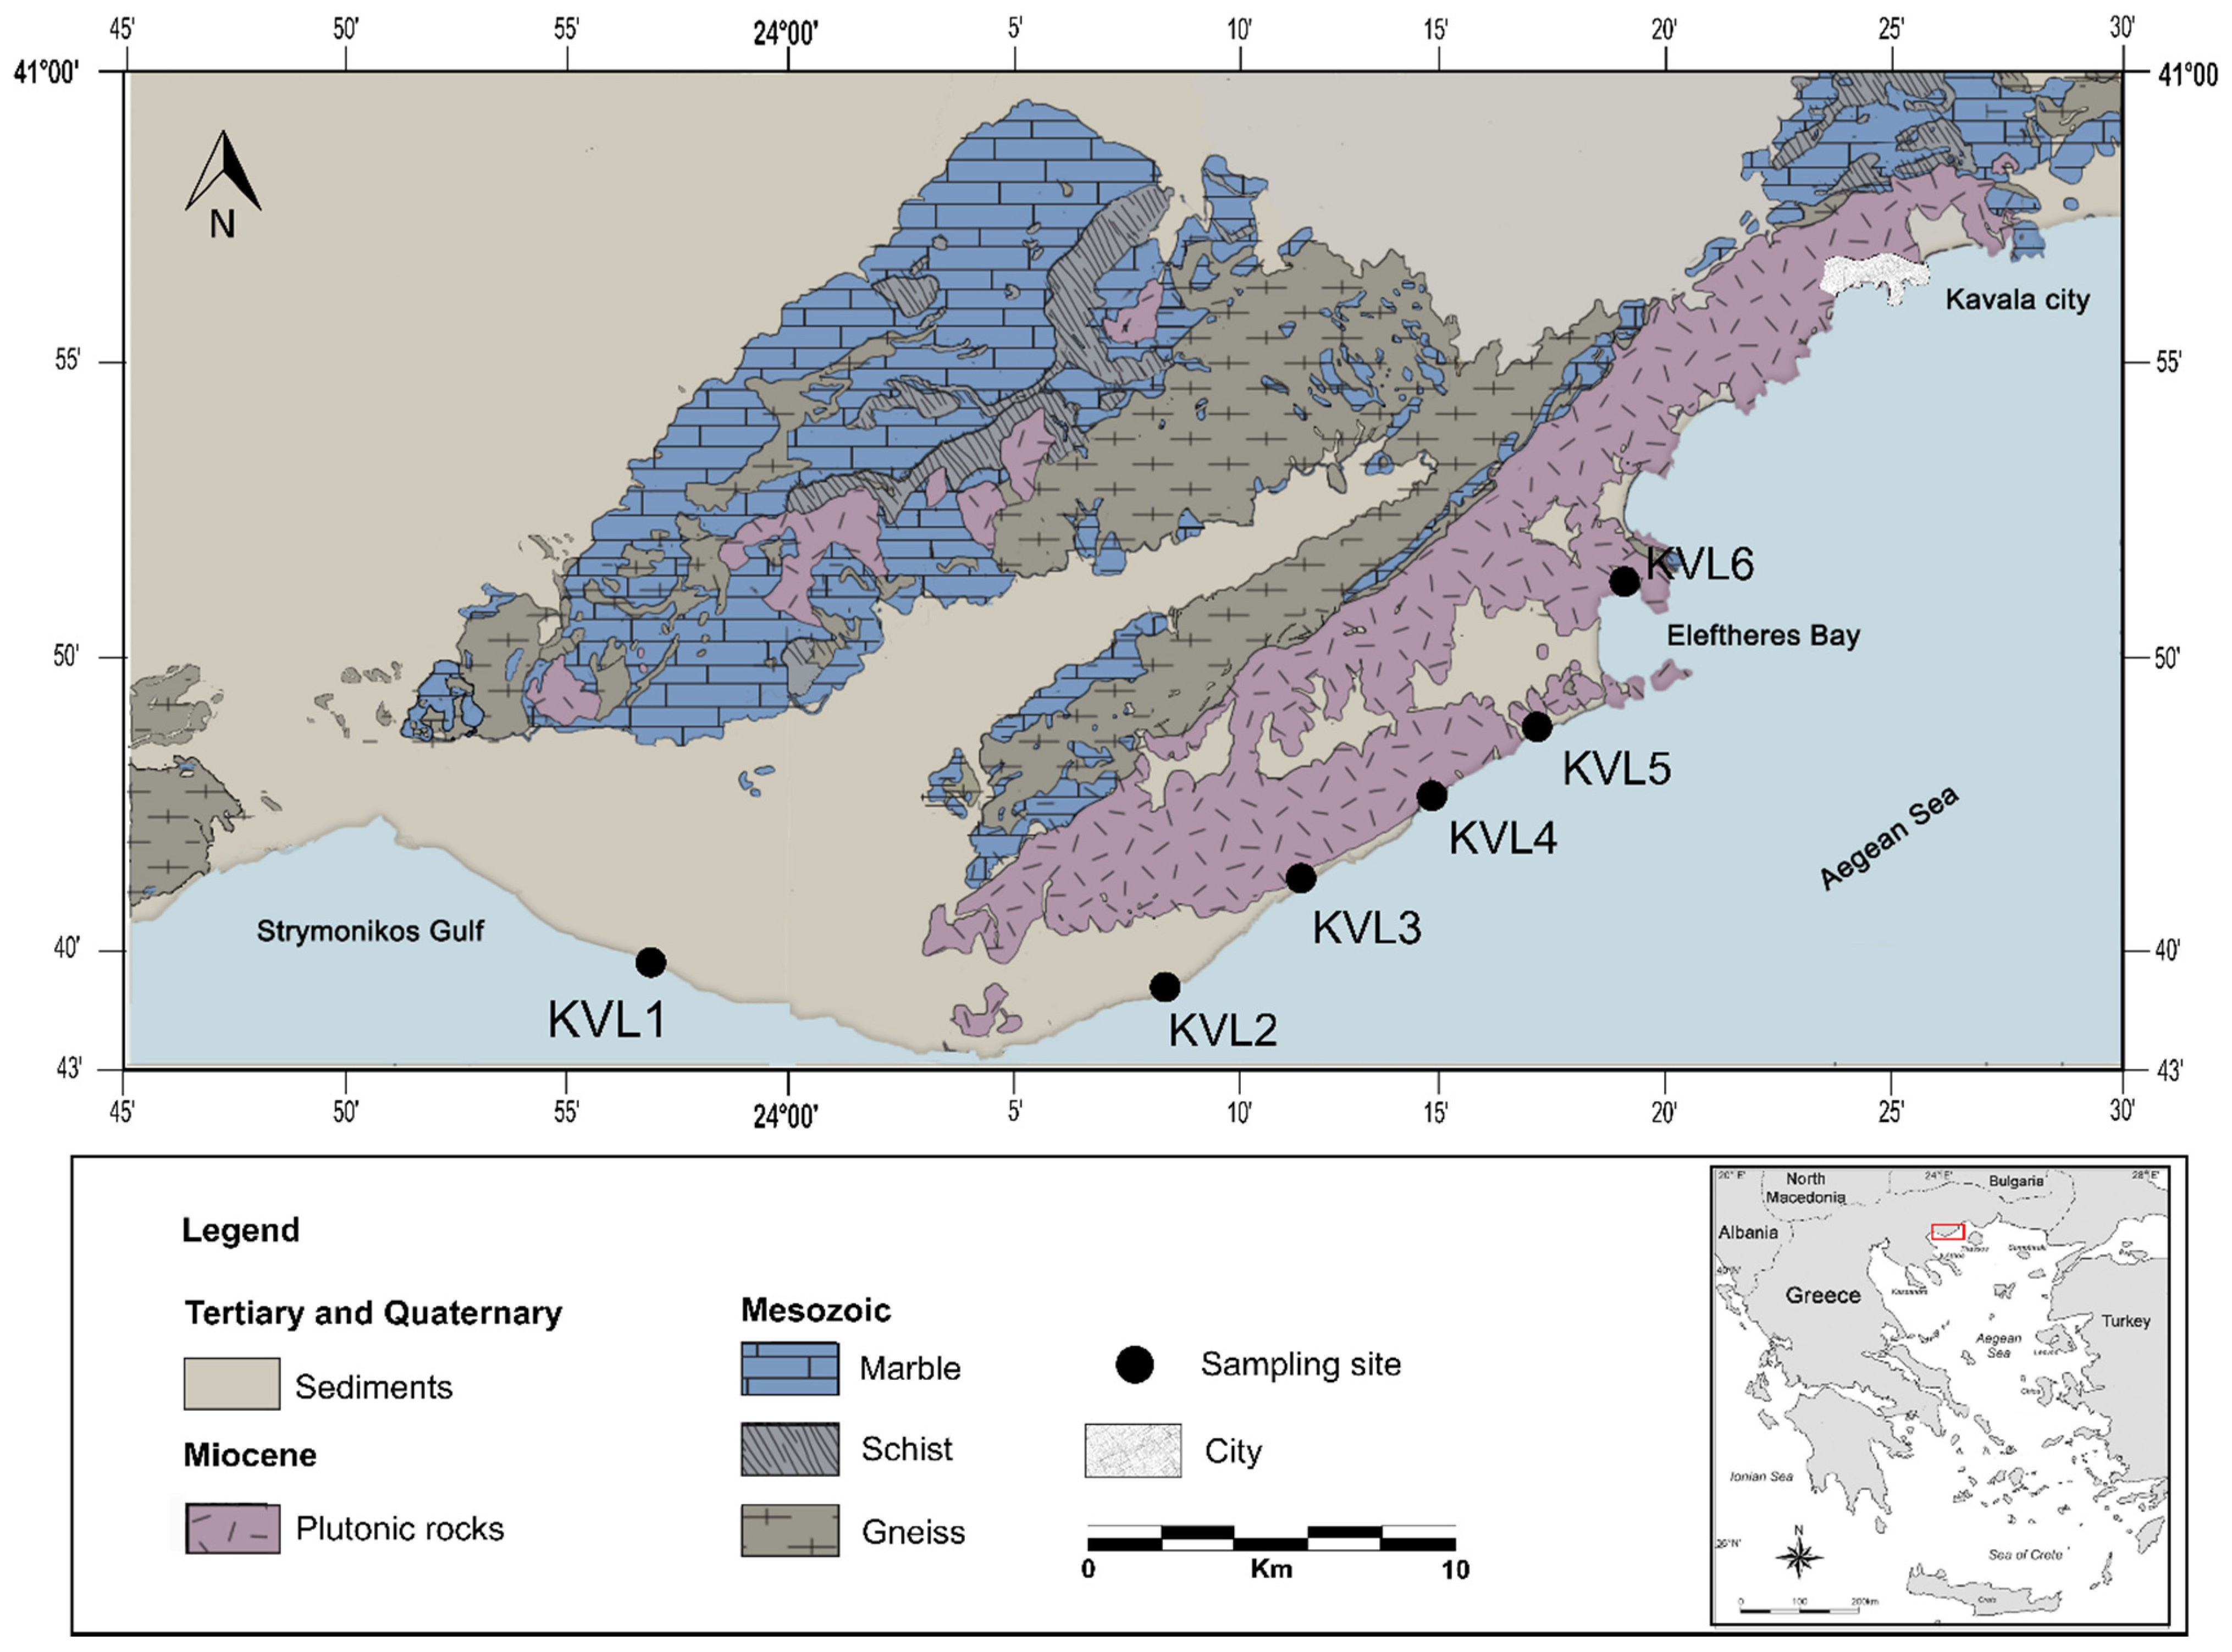
2. Geological Setting

The study area is part of the Southern Rhodope Core Complex (SRCC) that comprises Paleozoic–Mesozoic orthogneisses overlain by massive Triassic marble horizons with schist and amphibolite intercalations [25,26,27]. These rocks were intruded by Upper Eocene to Middle Miocene plutonic rocks and covered by Oligocene to Miocene volcanics.
The dominant magmatic rock in the studied area is the Kavala (or Symvolon) pluton (Figure 1) that intruded the metamorphic basement along a detachment fault of SW–NE direction [28]. This pluton is a metaluminous, I-type intrusion with a calc-alkaline affinity [29]. The dominant rock type is an amphibole–biotite granodiorite, with numerous enclaves of tonalite, diorite, monzogranite and monzodiorite. All the rock types consist of similar mineralogical phases in different ratios. The main minerals are hornblende, biotite, muscovite, plagioclase, K-feldspar and quartz, while the accessory minerals include apatite, titanite, epidote, allanite, zircon, monazite, magnetite, thorite and ilmenite [29]. Occasionally discrete aplitic, pegmatitic and more mafic, usually porphyritic, veins and dikes, along with tourmaline-rich veins and breccias also occur [30,31].
Dating of titanite with U-Pb geochronology and hornblende with 40Ar/39Ar spectra yielded the emplacement age for the Kavala pluton at 21 Ma [27]. The K-Ar biotite ages of 15.5 ± 0.5 Ma [32] and 17.8 ± 0.8 Ma [33] along with the 14–16 Ma Rb-Sr biotite age [34] were initially attributed to reset metamorphic ages, but Dinter and Royden [32] suggested that they are cooling ages of the footwall of the detachment fault system. This assumption is confirmed by the 11.1 ± 0.2 − 15.5 ± 0.3 Ma 40Ar/39Ar dating results for biotite and K-feldspar from the central parts of the pluton [27].
Tertiary and mainly Quaternary nonconsolidated sedimentary deposits are also present (Figure 1). These deposits were formed from the action of the rivers that drain the metamorphic and igneous rocks, and consist of alluvial sediments, i.e., pebbles, gravels, sands, and clays. Along the coast, marine deposits of Holocene age, mainly sands, also occur [22,23,24].

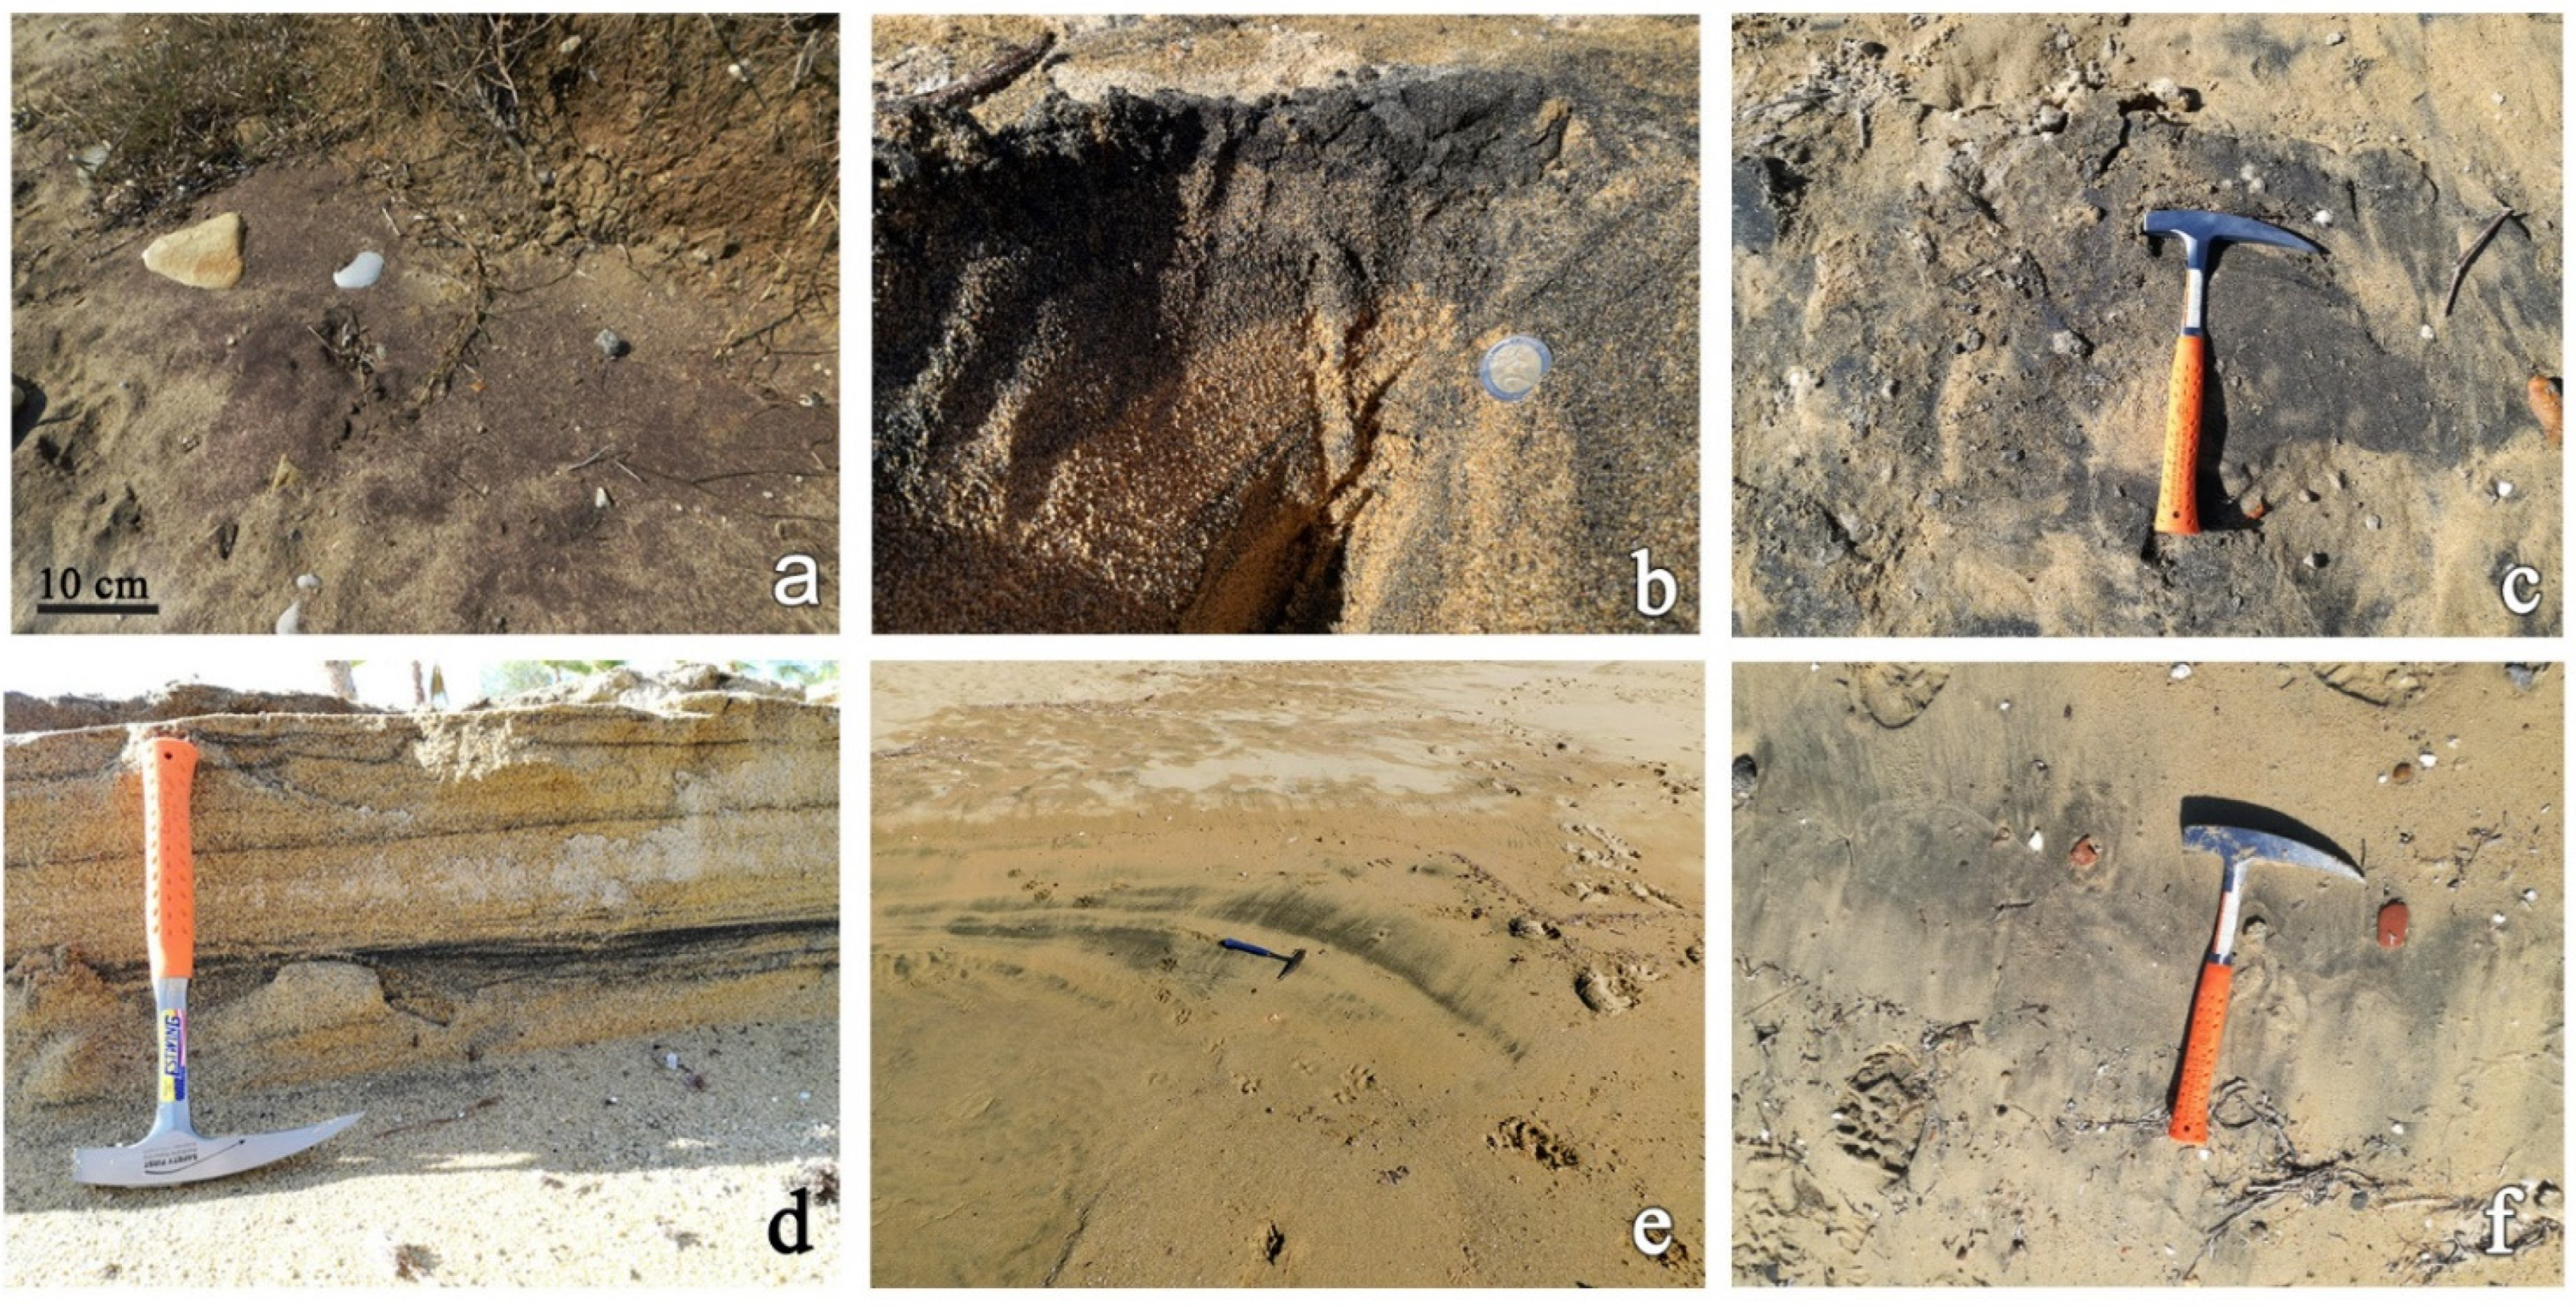
3. Materials and Methods

A total of six black sand samples (Table 1) were collected along the coastal area of the Kavala district. The study area extends from the Strymonikos Gulf to Eleftheres Bay (Figure 1), over a 40 km long distance. Most of the sampling sites are adjacent to the Kavala intrusion and are characterized by thick horizons of black sands (up to 8 cm). The samples of the heavy mineral accumulations were collected from the surface or from these horizons (Figure 2). The preparation of the samples and the separation of the REE-rich minerals were performed at the laboratory of the Faculty of Geology at the Aristotle University of Thessaloniki.
Initially, the samples were rinsed with water and then dried. The coarse fragments (organic material and rock gravels) were removed by sieving. Then, a preconcentration process was achieved with magnetic separation. For this reason, magnetite was removed manually using a common magnet. Subsequently, a Frantz L-1 Isodynamic Magnetic Separator was used, under the settings of 0.8 A current, and inclined forward 15° and 25° sideways, for the enrichment of the REE-rich minerals. Two fractions, magnetic and nonmagnetic, were obtained. The weight percentage of each fraction is shown in Table 2. Sample KVL1 contains the highest (59.89 wt %) and sample KVL6 the lowest magnetic fraction (22.60 wt %). This procedure led to the concentration of the heavy minerals in the magnetic fraction, due to their high magnetic susceptibility. The REE-bearing minerals, i.e., allanite-(Ce), epidote, monazite-(Ce), monazite-(La) and thorite, were separated under a binocular stereoscope (Leica Wild M10), and polished epoxy mounts of these minerals were prepared for detailed mineralogical observations.
The mineralogical composition of the six magnetic fractions was determined by X-ray diffractometry (XRD), using a Philips PW1820/00 diffractometer, equipped with a PW 1710/00 controller and CuKα radiation (1.54056 Å wavelength) using a Ni-filter. The settings and the measurement parameters were settled with scanning speed of 0.5 sec, in a continuous scanning mode, and the scanning area of the goniometer was fixed between 3° and 63° at 35 kV and 25 mA. The Rietveld refinement of powder X-ray diffraction was performed with PROFEX software (version 4.3.5) [35] using the BGMN program.
The polished sections with the REE-bearing minerals were studied with a JEOL JSM-840A scanning electron microscope (SEM) (JEOL Ltd., Tokyo, Japan) equipped with an OXFORD INCA 300 energy dispersive system (EDS) (Oxford Instruments Ltd., Abingdon, UK) in the School of Sciences at Aristotle University of Thessaloniki. The operating conditions were a 20 kV accelerating voltage and 0.4 mA probe current, 80 s analysis time, and a beam diameter of ~1 μm, in backscattering electron (BSE) mode. SEM–EDS microanalysis was targeted on the REE-bearing minerals and the following standards were used: SiK, AlK, KK, sanidine; NaK, albite; FeK, hematite; MgK, CaK, diopside; MnK, tephroite; TiK, rutile; ClK, sylvite; FK, fluorite; LaL, LaB6; CeL, CeO2; NdL, NdF3; EuL, EuF3; YL, Y; UM, synthetic UO3; ThM, synthetic ThO2; PK, GaP; ZrL, Zr; HfL, Hf; VK, vanadinite; NbL, synthetic Nb2O5.

4. Results

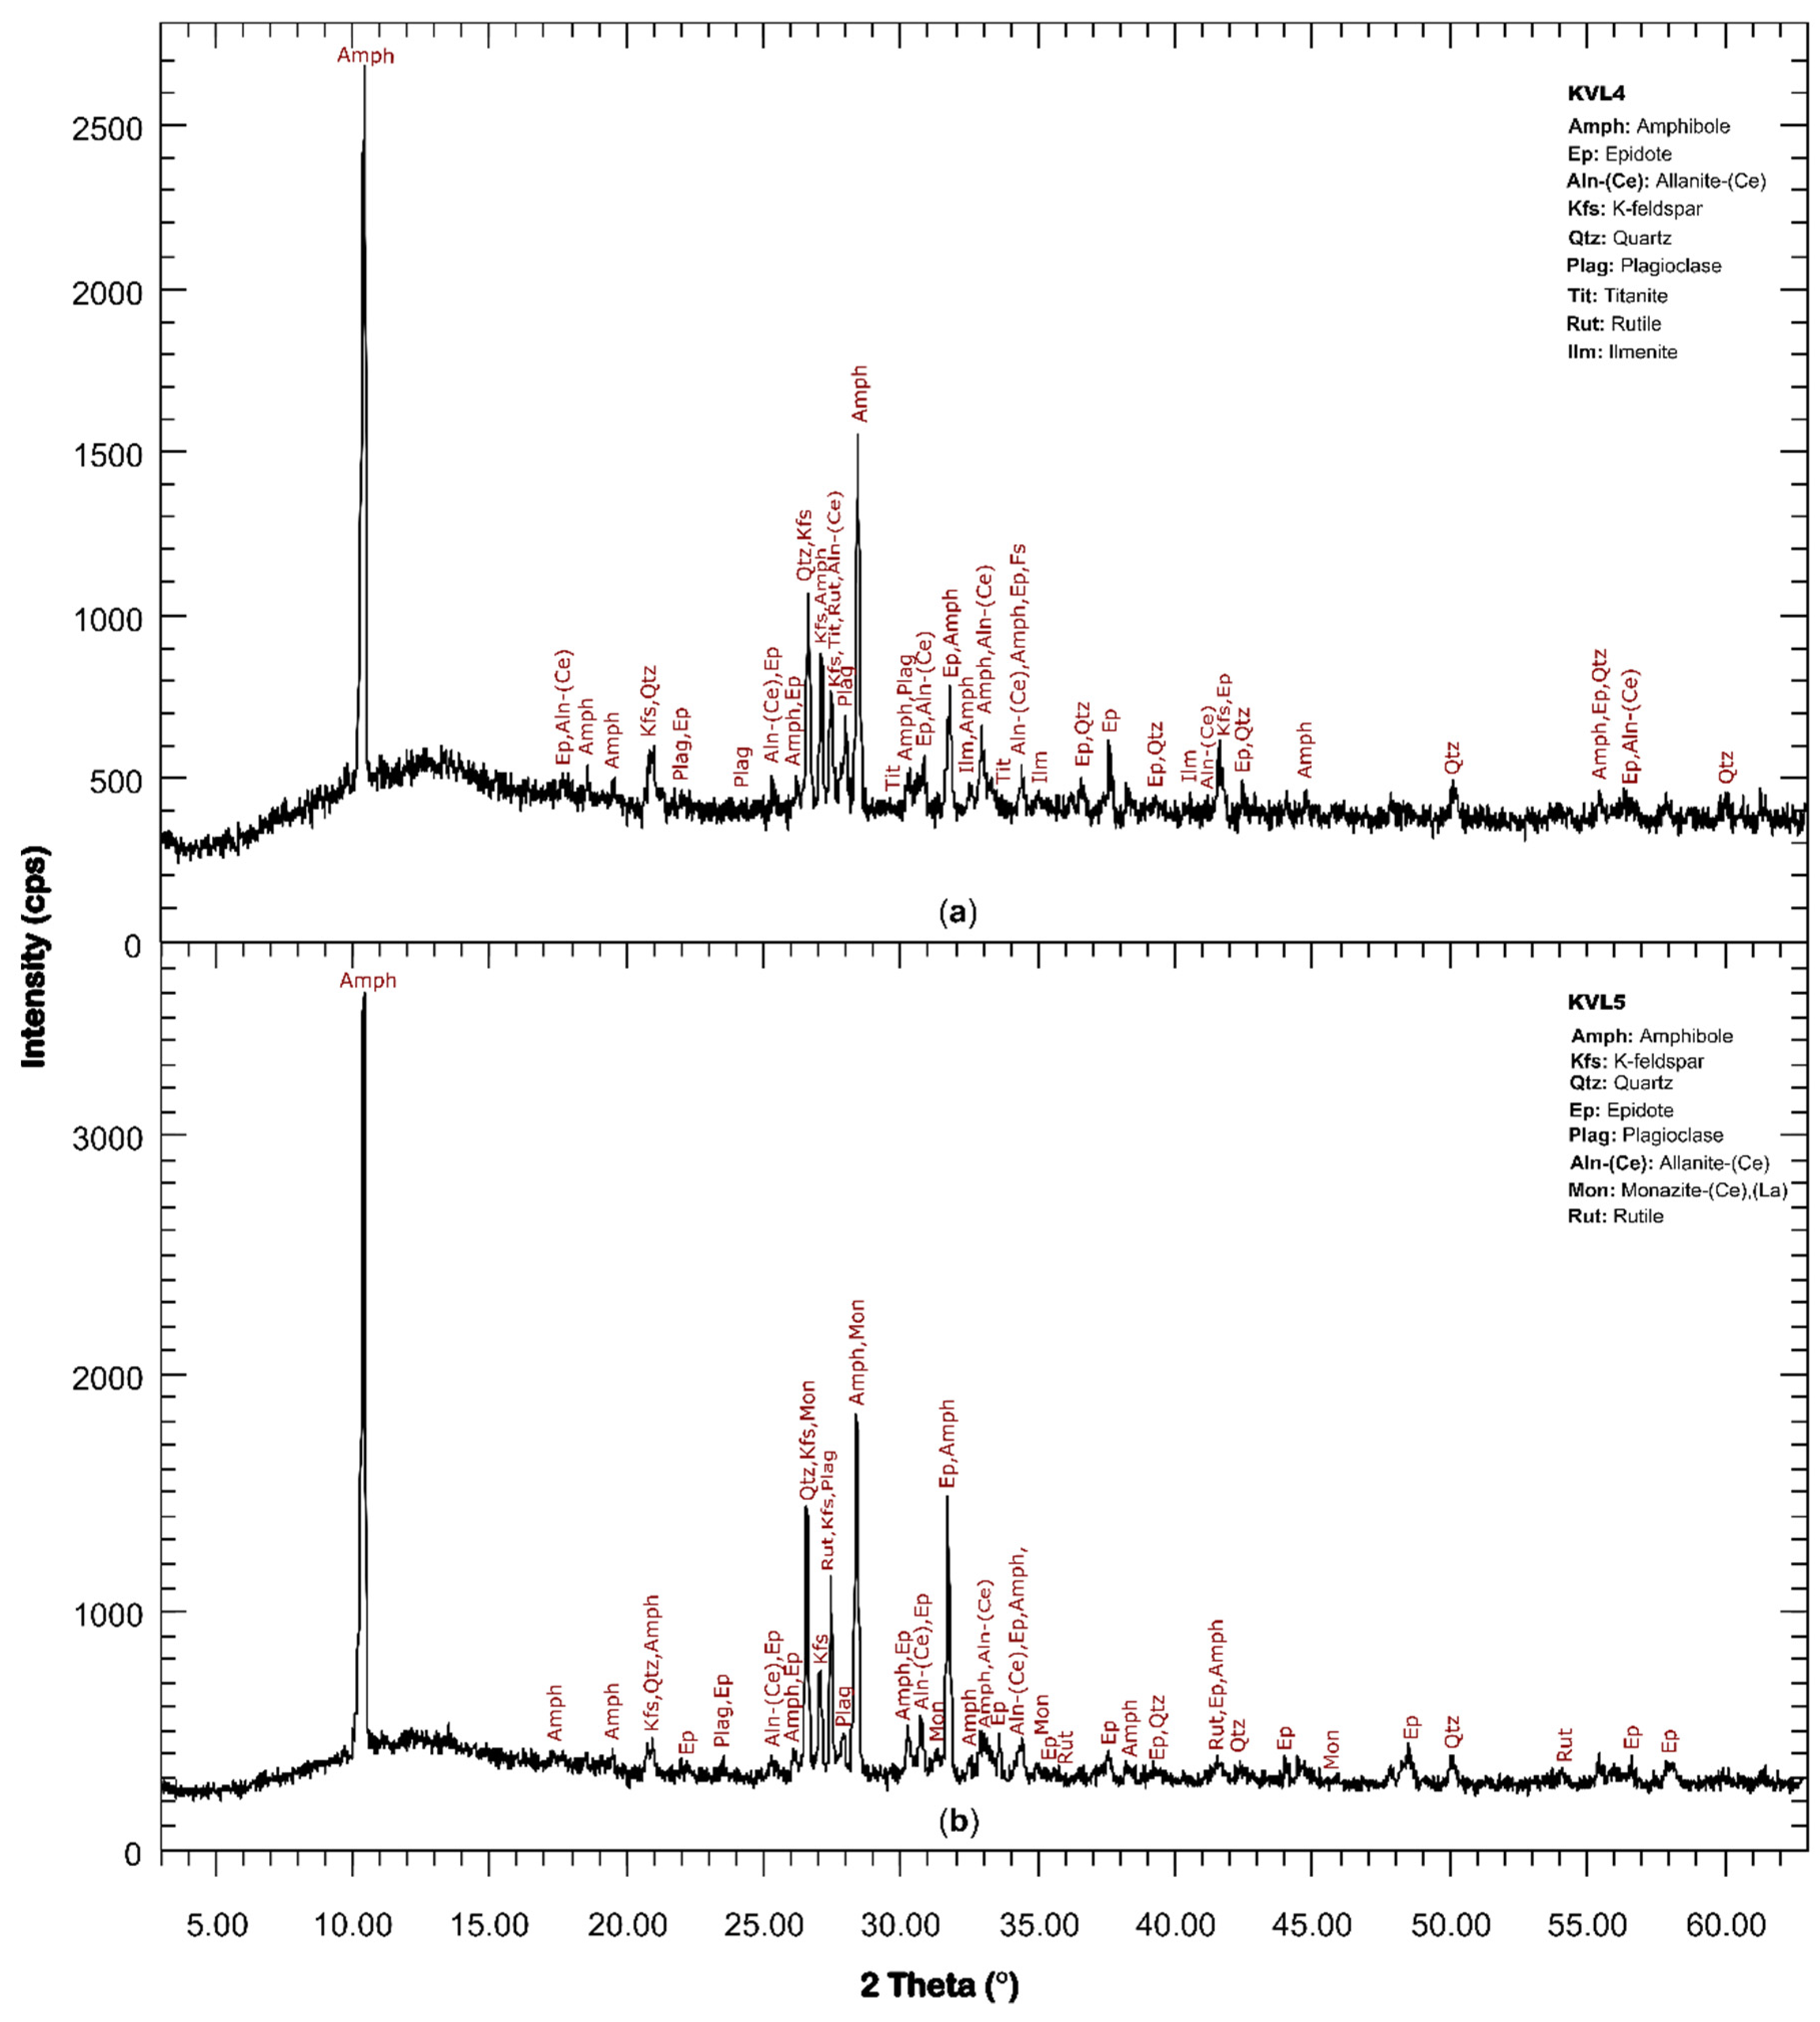
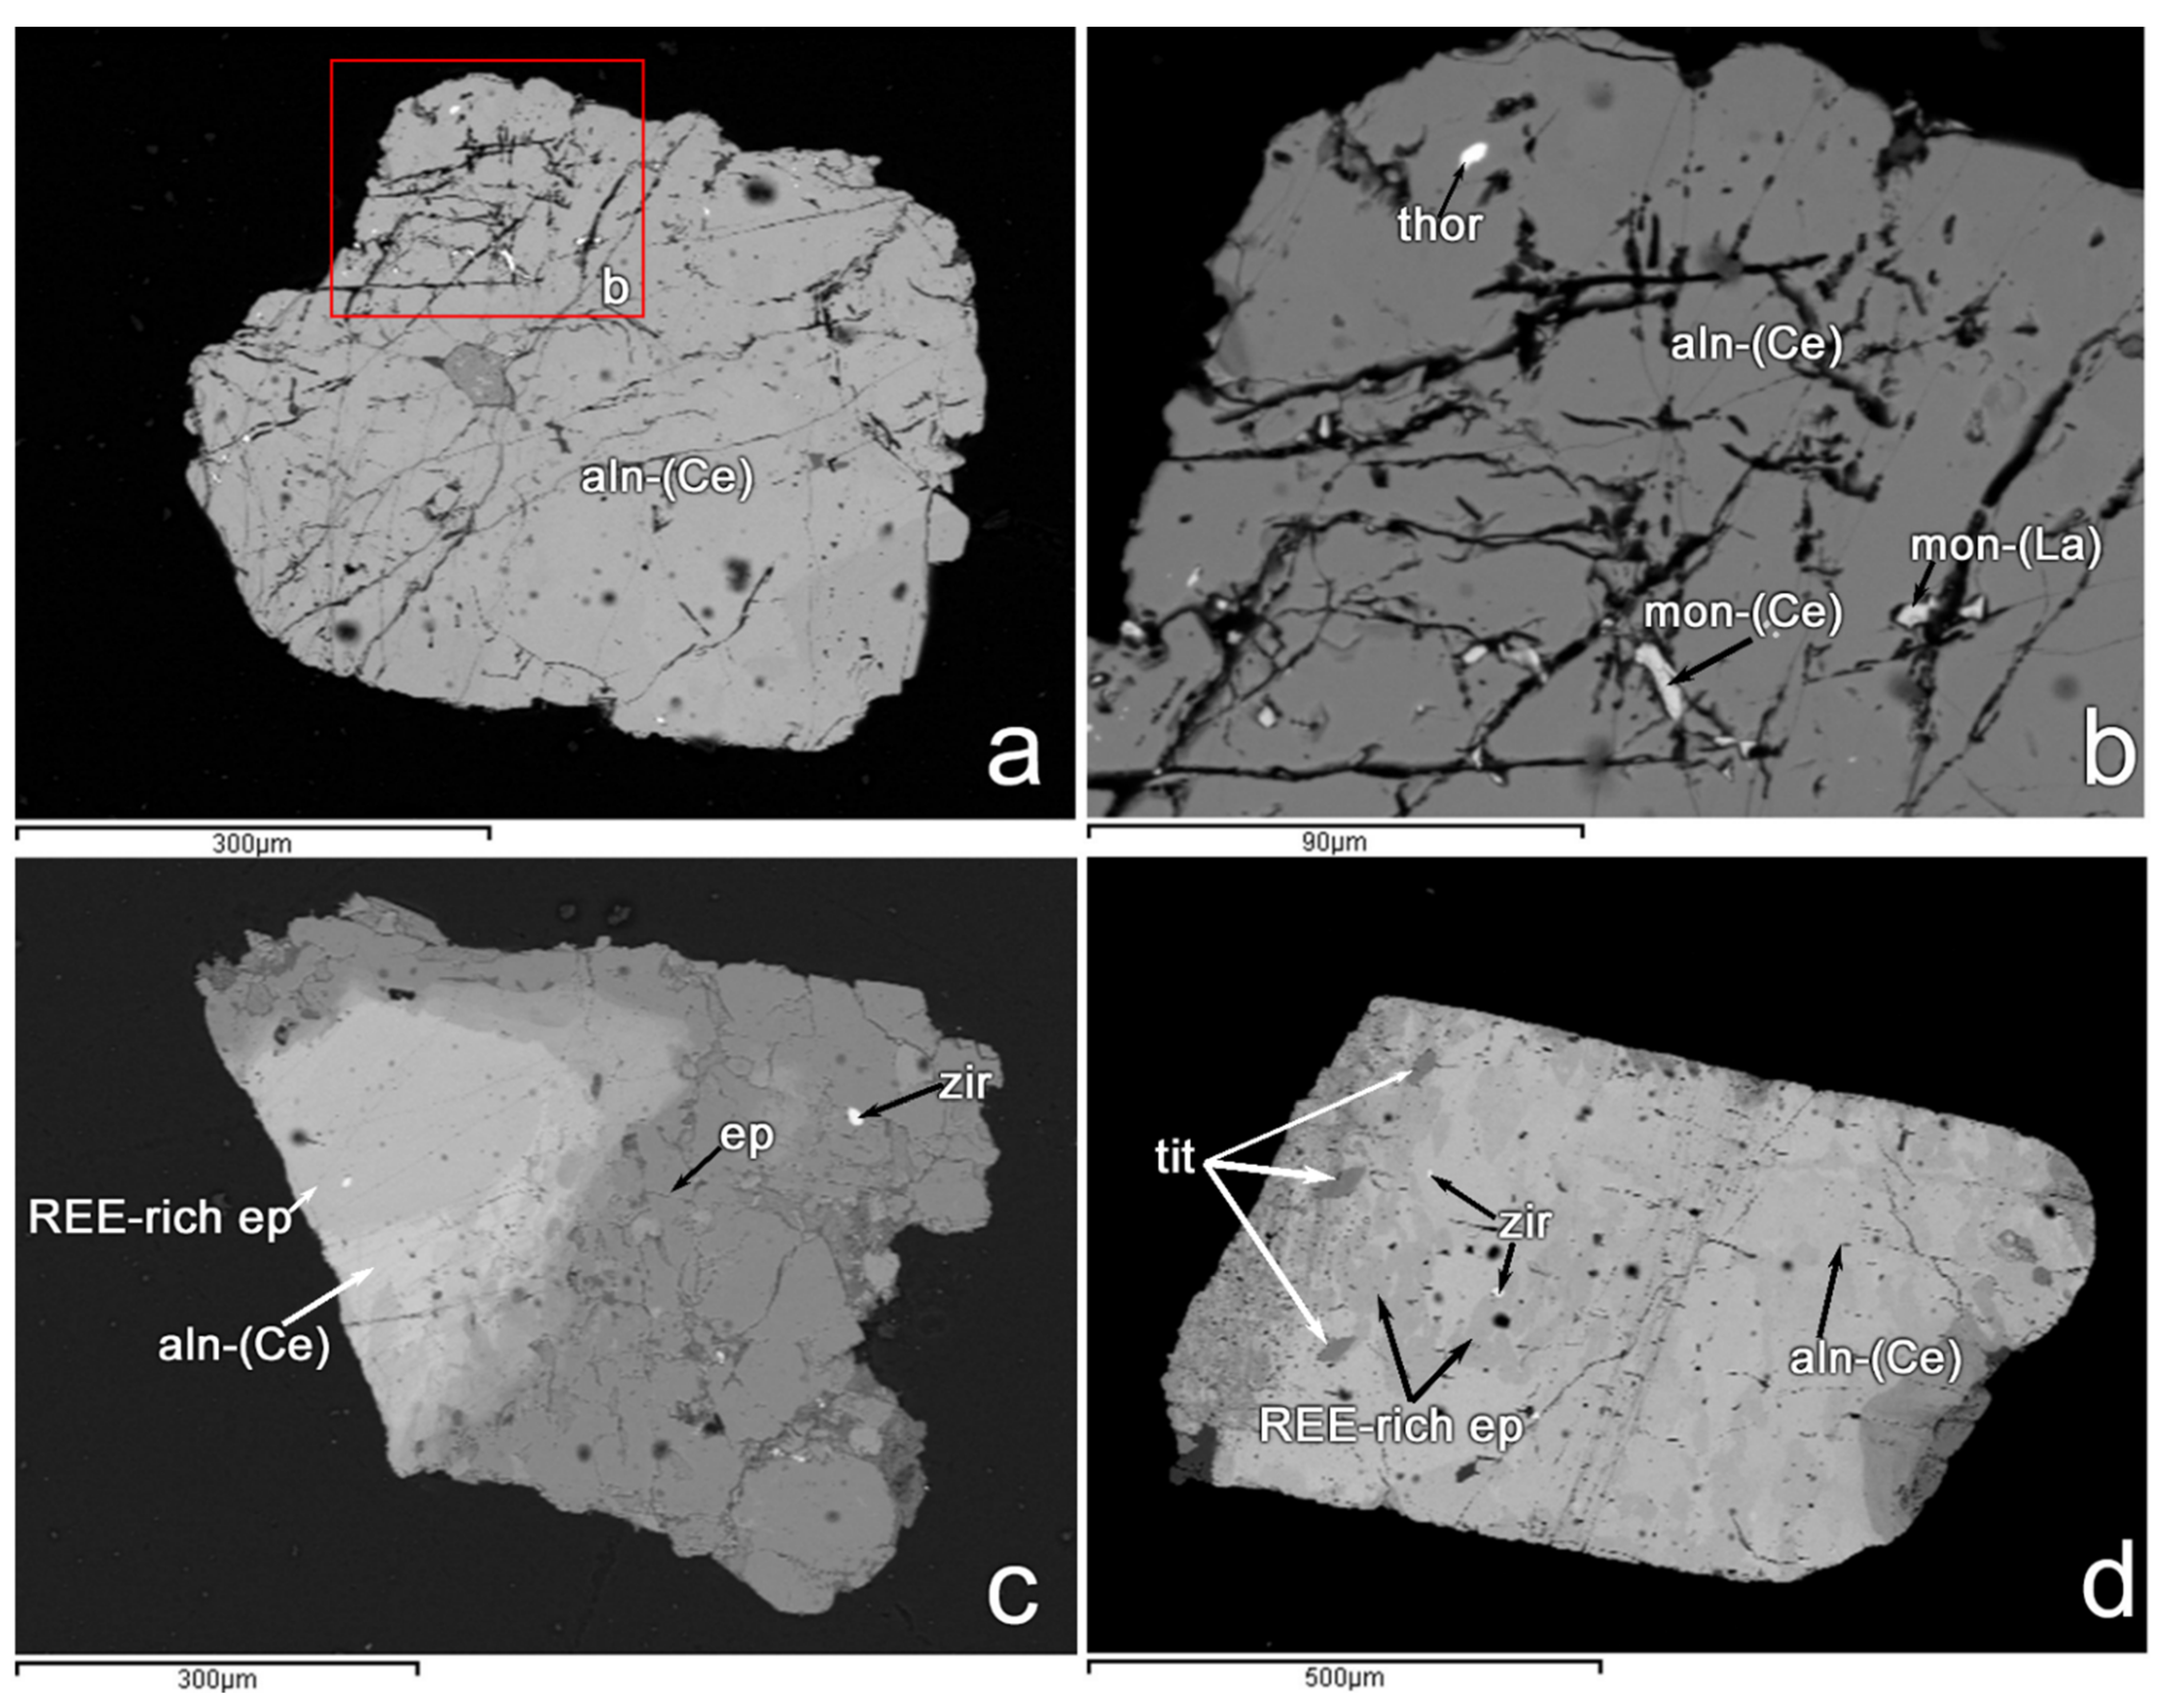
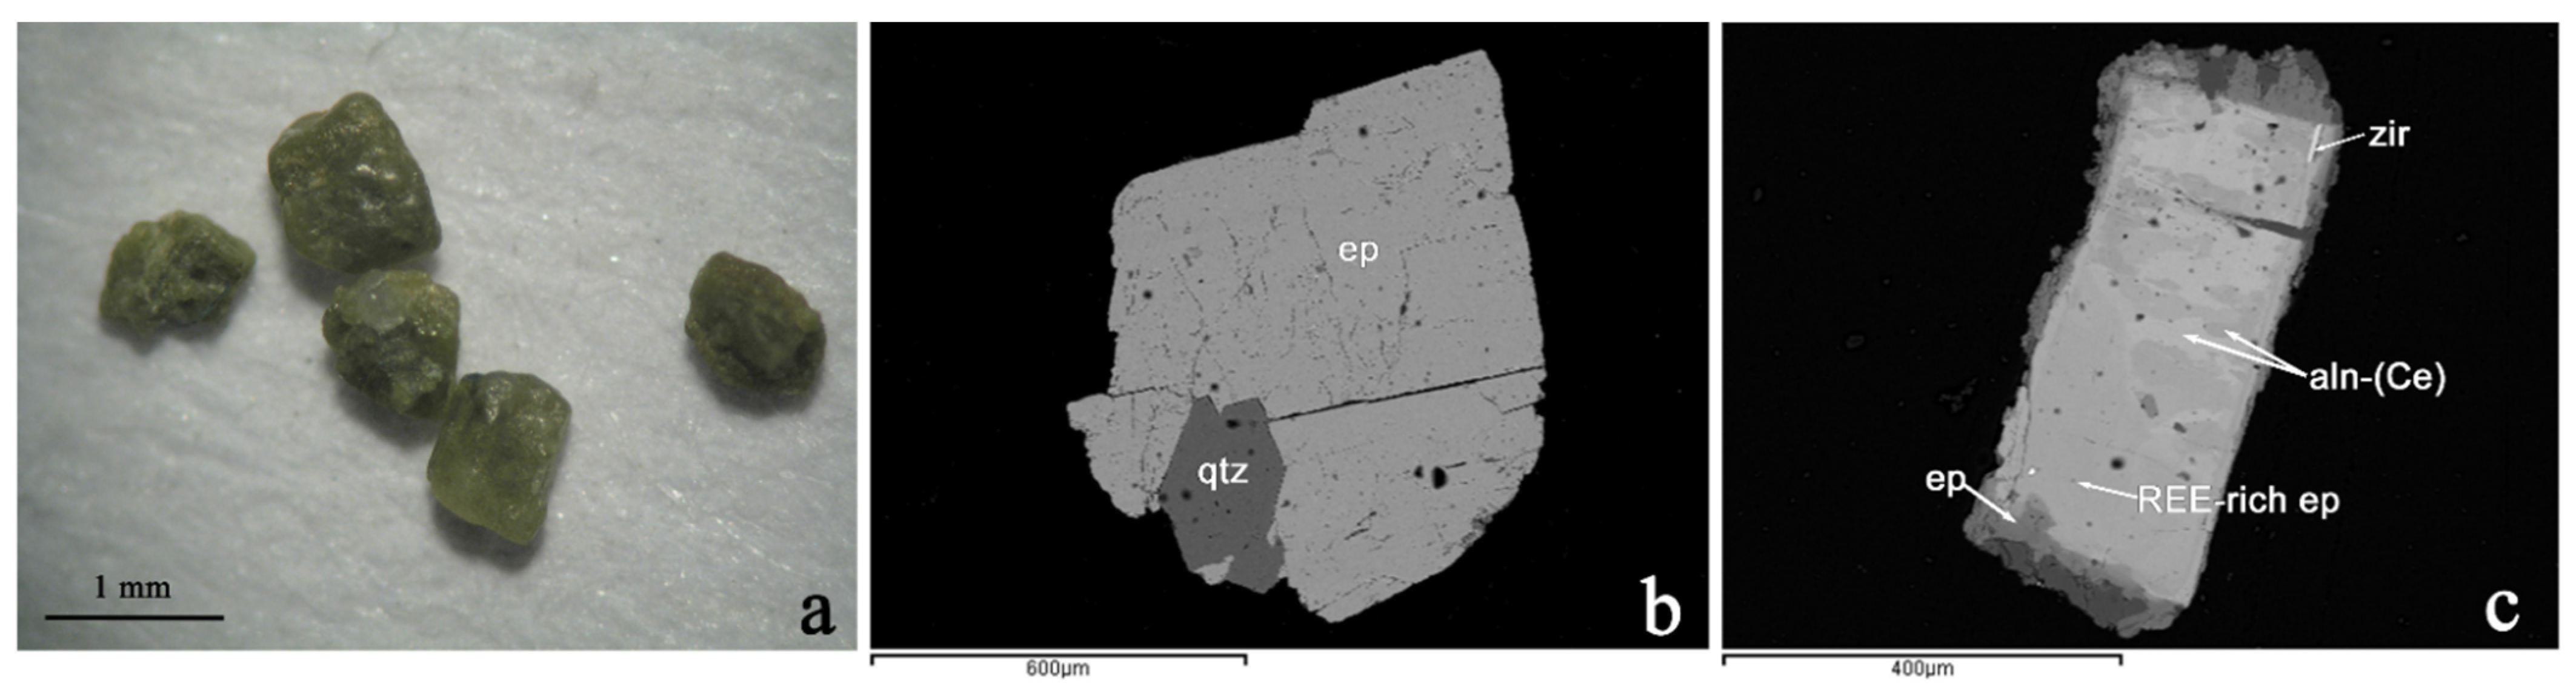
4.1. Mineralogical Composition of the REE-Bearing Minerals

The major and minor mineral phases of the magnetic fractions of the studied black sand samples were determined by XRD in combination with SEM–EDS analysis. The mineralogical composition consists mainly of silicates, Fe- and Ti-oxides, with minor phosphate minerals. The heavy mineral fraction, with specific gravity larger than that of quartz (~2.65), includes amphibole, epidote, hematite, goethite, mica, allanite, garnet, titanite, zircon, monazite, ilmenite, rutile, magnetite, chlorite and thorite (Table 3, Figure 3).
The fraction of the heavy minerals was semiquantitatively determined, ranging from 62 to 100 wt %, while the remaining amount consists of quartz, K-feldspar and plagioclase (Table 3, Figure 3). Major components of five samples are amphibole and epidote, apart from KVL1, which is predominated by garnet (68 wt %). XRD results indicate that all samples of the magnetic fraction contain REE-bearing minerals (allanite-(Ce), epidote, monazite-(Ce), monazite-(La) and thorite). Allanite is present in all samples (2–5 wt %), while epidote appears to a greater extent, from 6 wt % in KVL1 to 38 wt % in KVL5. The minerals thorite and zircon were not detected in the fractions of all samples since they appear mainly as inclusions in allanite-(Ce) crystals. In addition, monazite-(Ce) and monazite-(La) constitute an alteration product of allanite and appear in fractures of the allanite-(Ce) grains.

4.2. Chemical Composition of the REE-Bearing Minerals

The REE-bearing minerals in the black sands of the Kavala area are dominated by allanite-(Ce), REE-rich epidote, monazite-(Ce), monazite-(La) and thorite. Zircon and titanite have been reported in previous studies [16,19] as light REE (LREE) and heavy REE (HREE) carriers, respectively, based on the sensitive analytical method laser-ablation inductively coupled plasma mass spectrometry (LA–ICPMS), but the concentrations of the REE were under the detection limits of the analytical method (SEM–EDS) used in the present study. Zircon from the Kavala area, apart from Zr, contains minor amounts of Hf, U and Th, whereas V and Nb occur in traces in titanite. Thorium and U, which are commonly associated with REE-bearing minerals, are incorporated in the crystal structure of the most minerals of the magnetic fragment, except titanite.

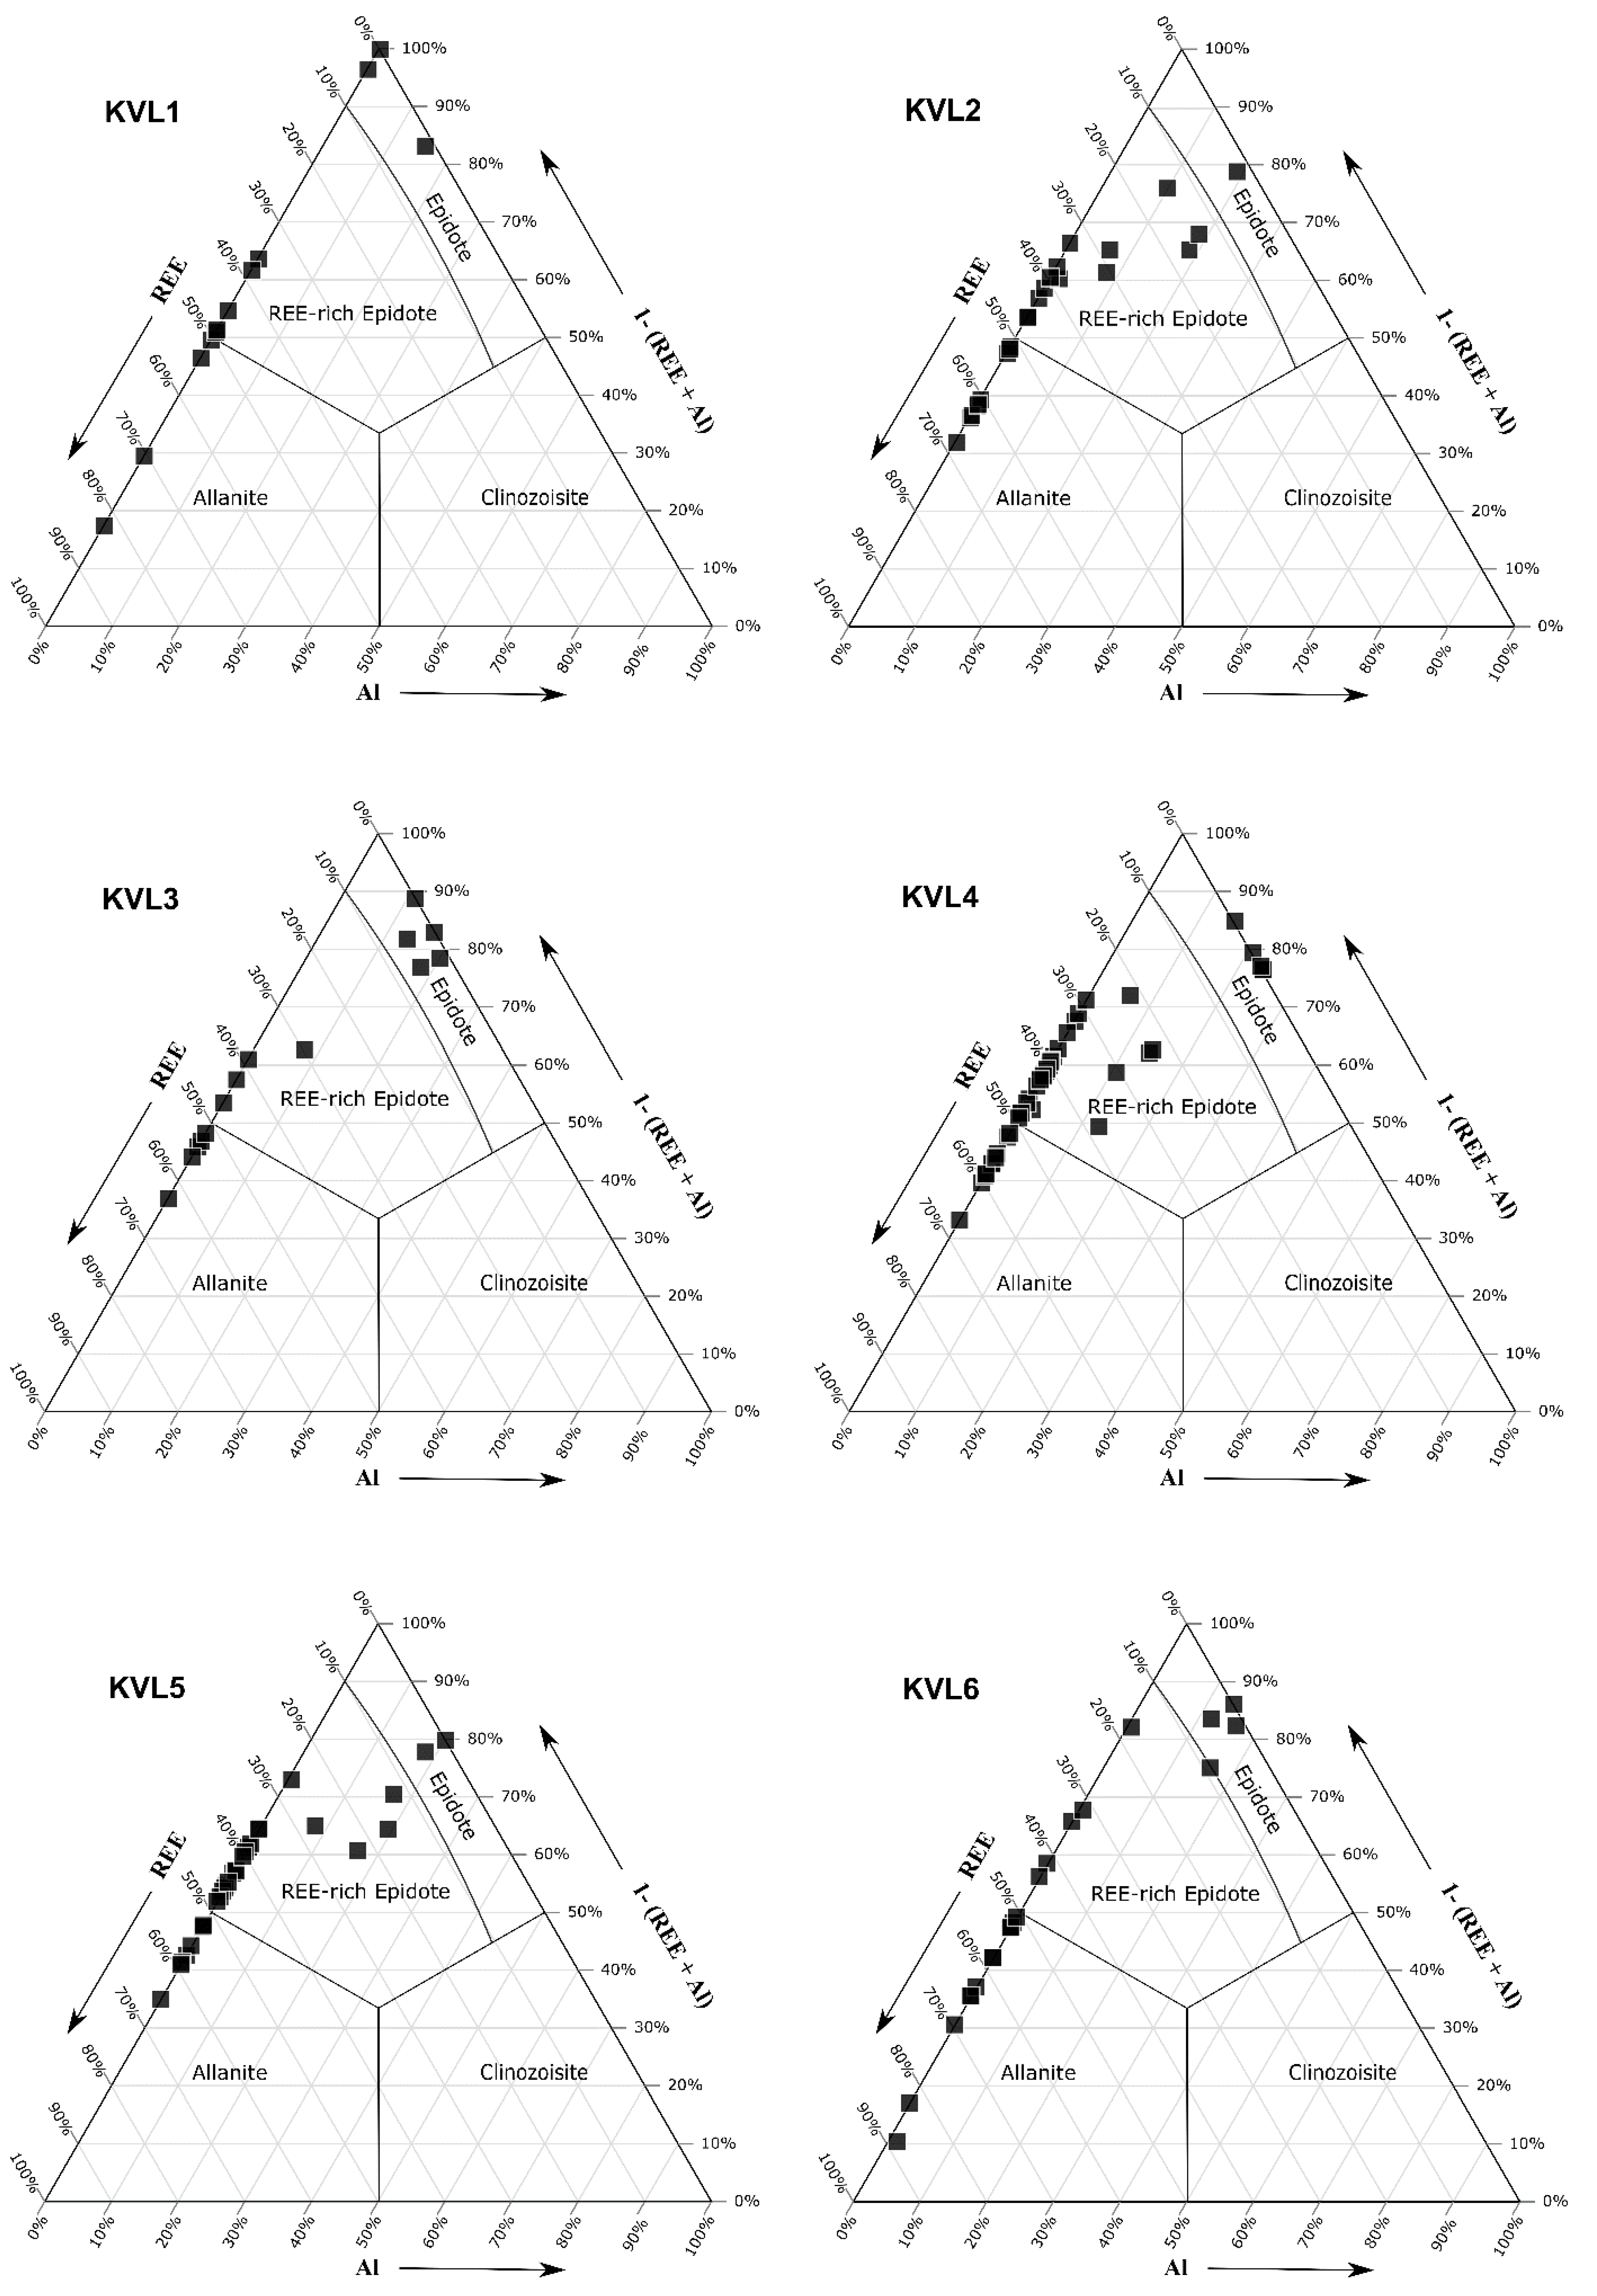
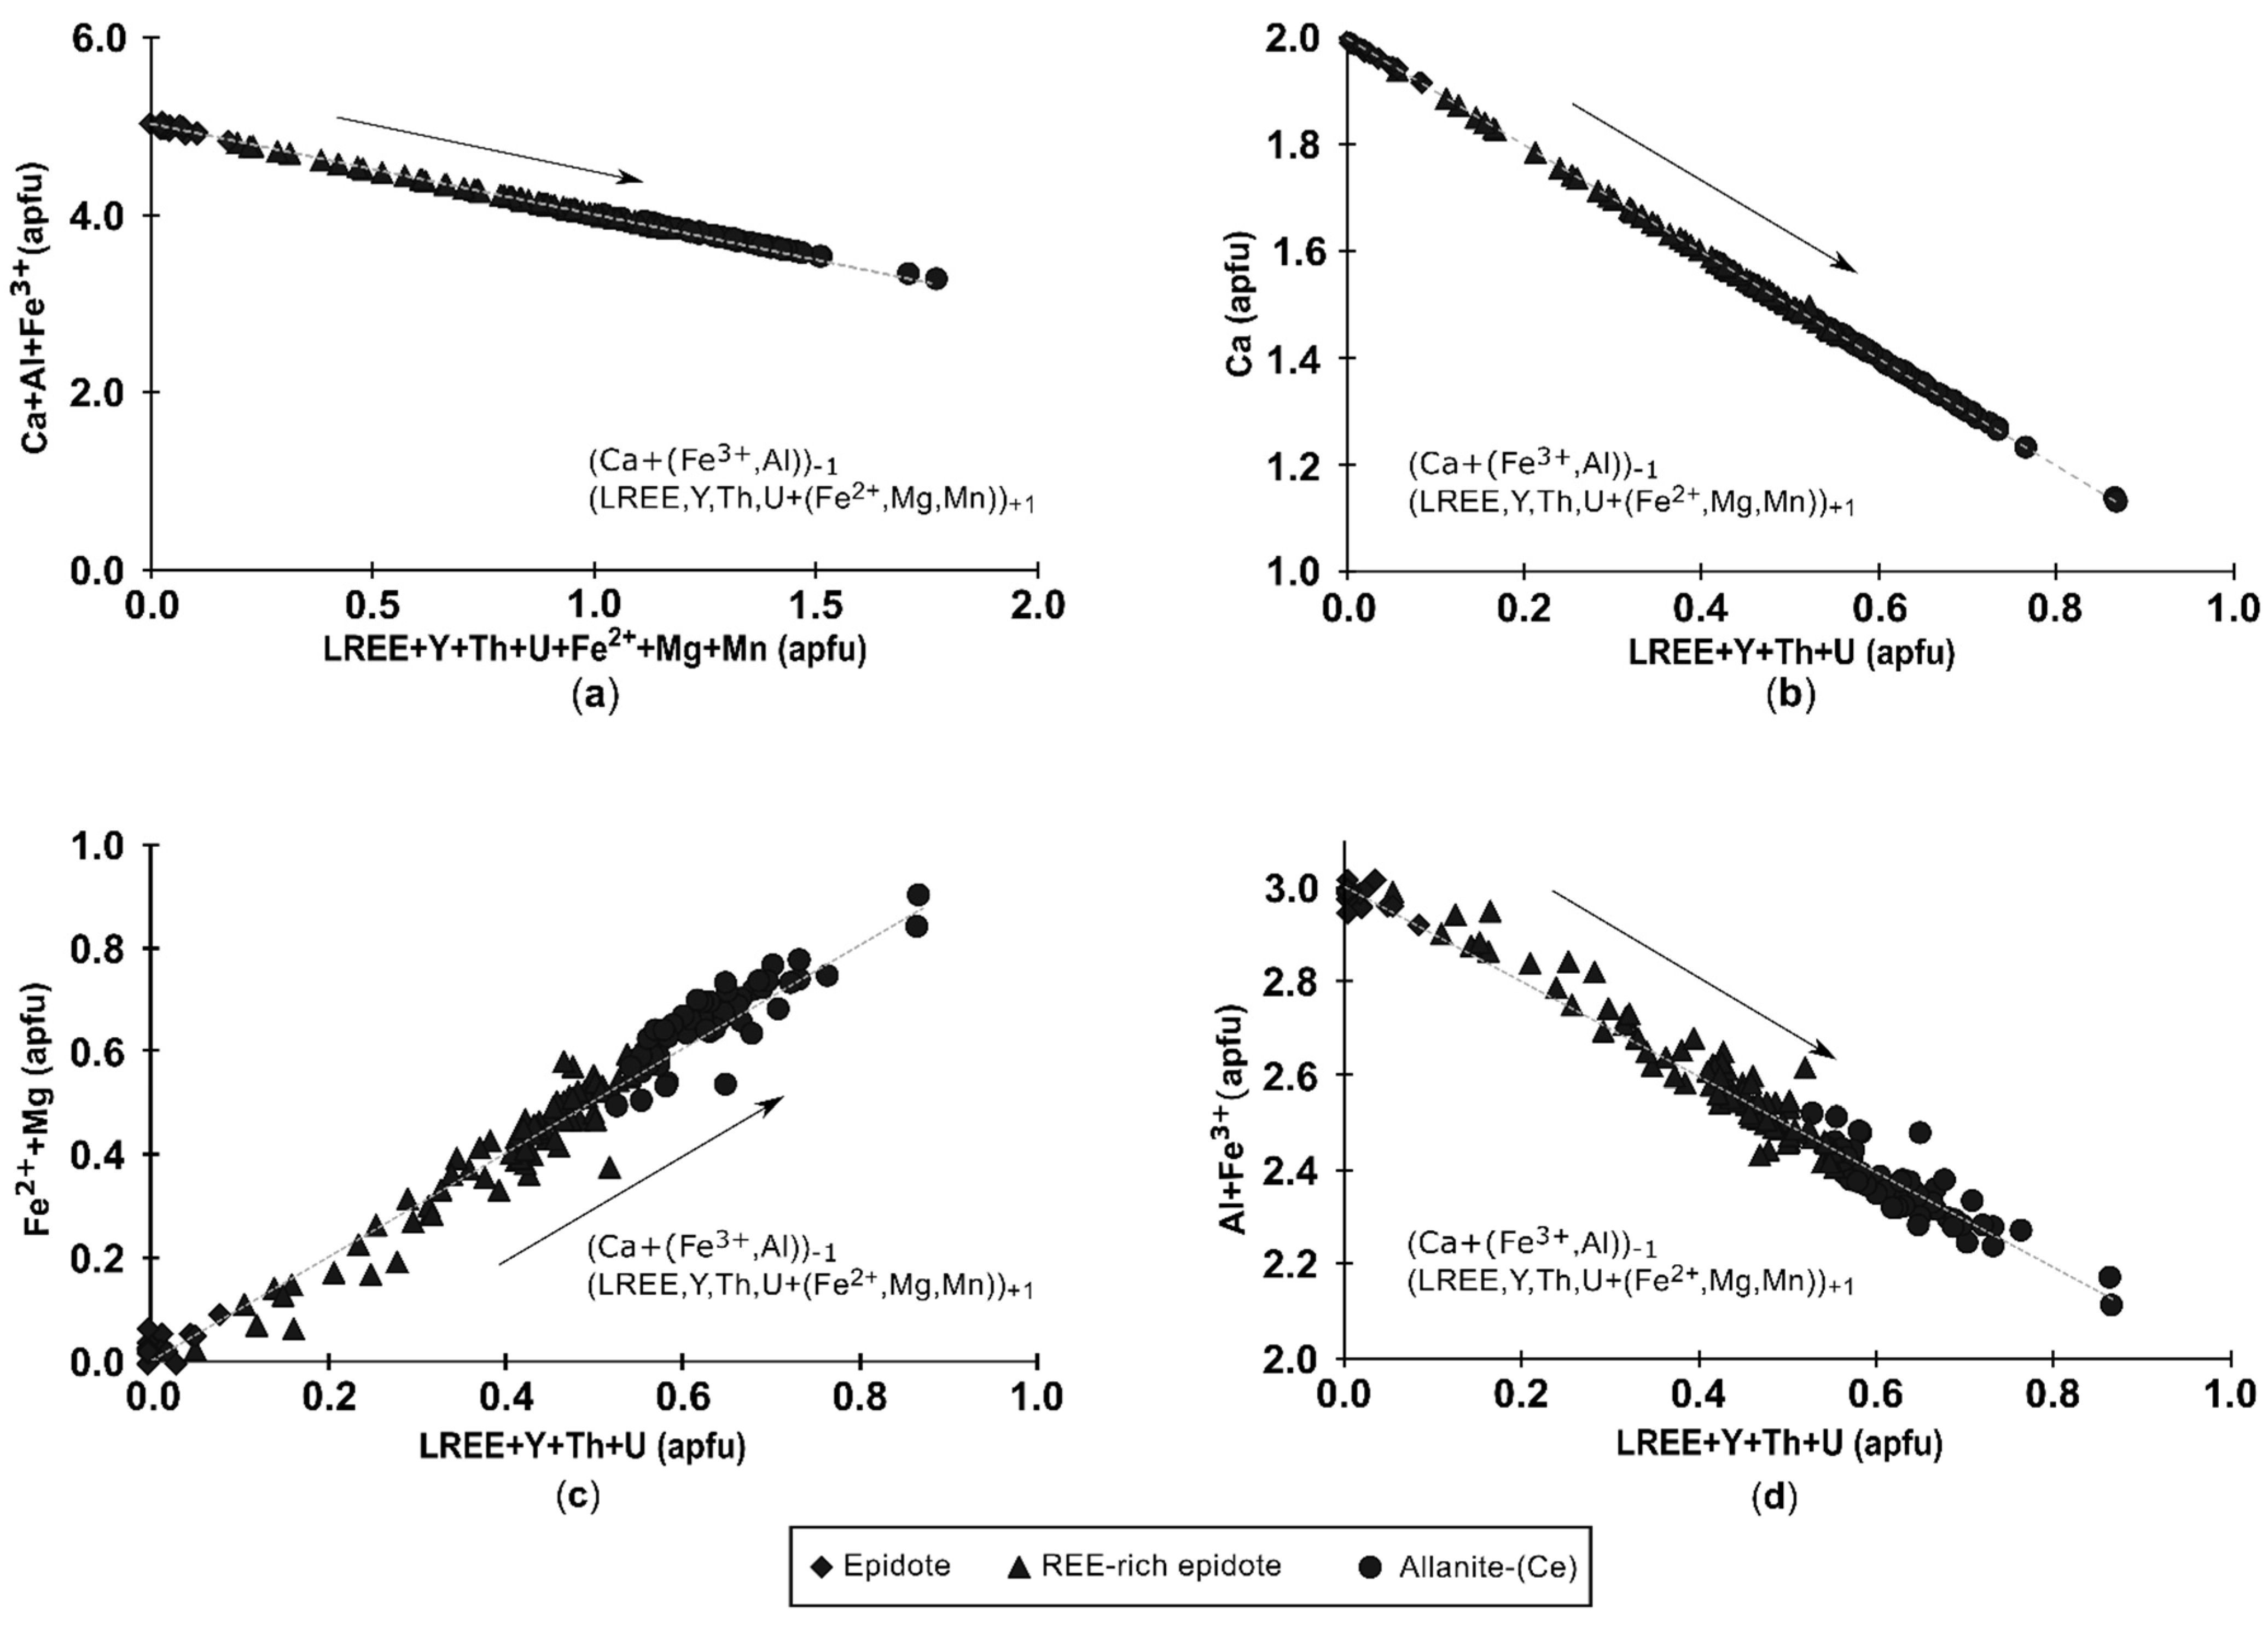
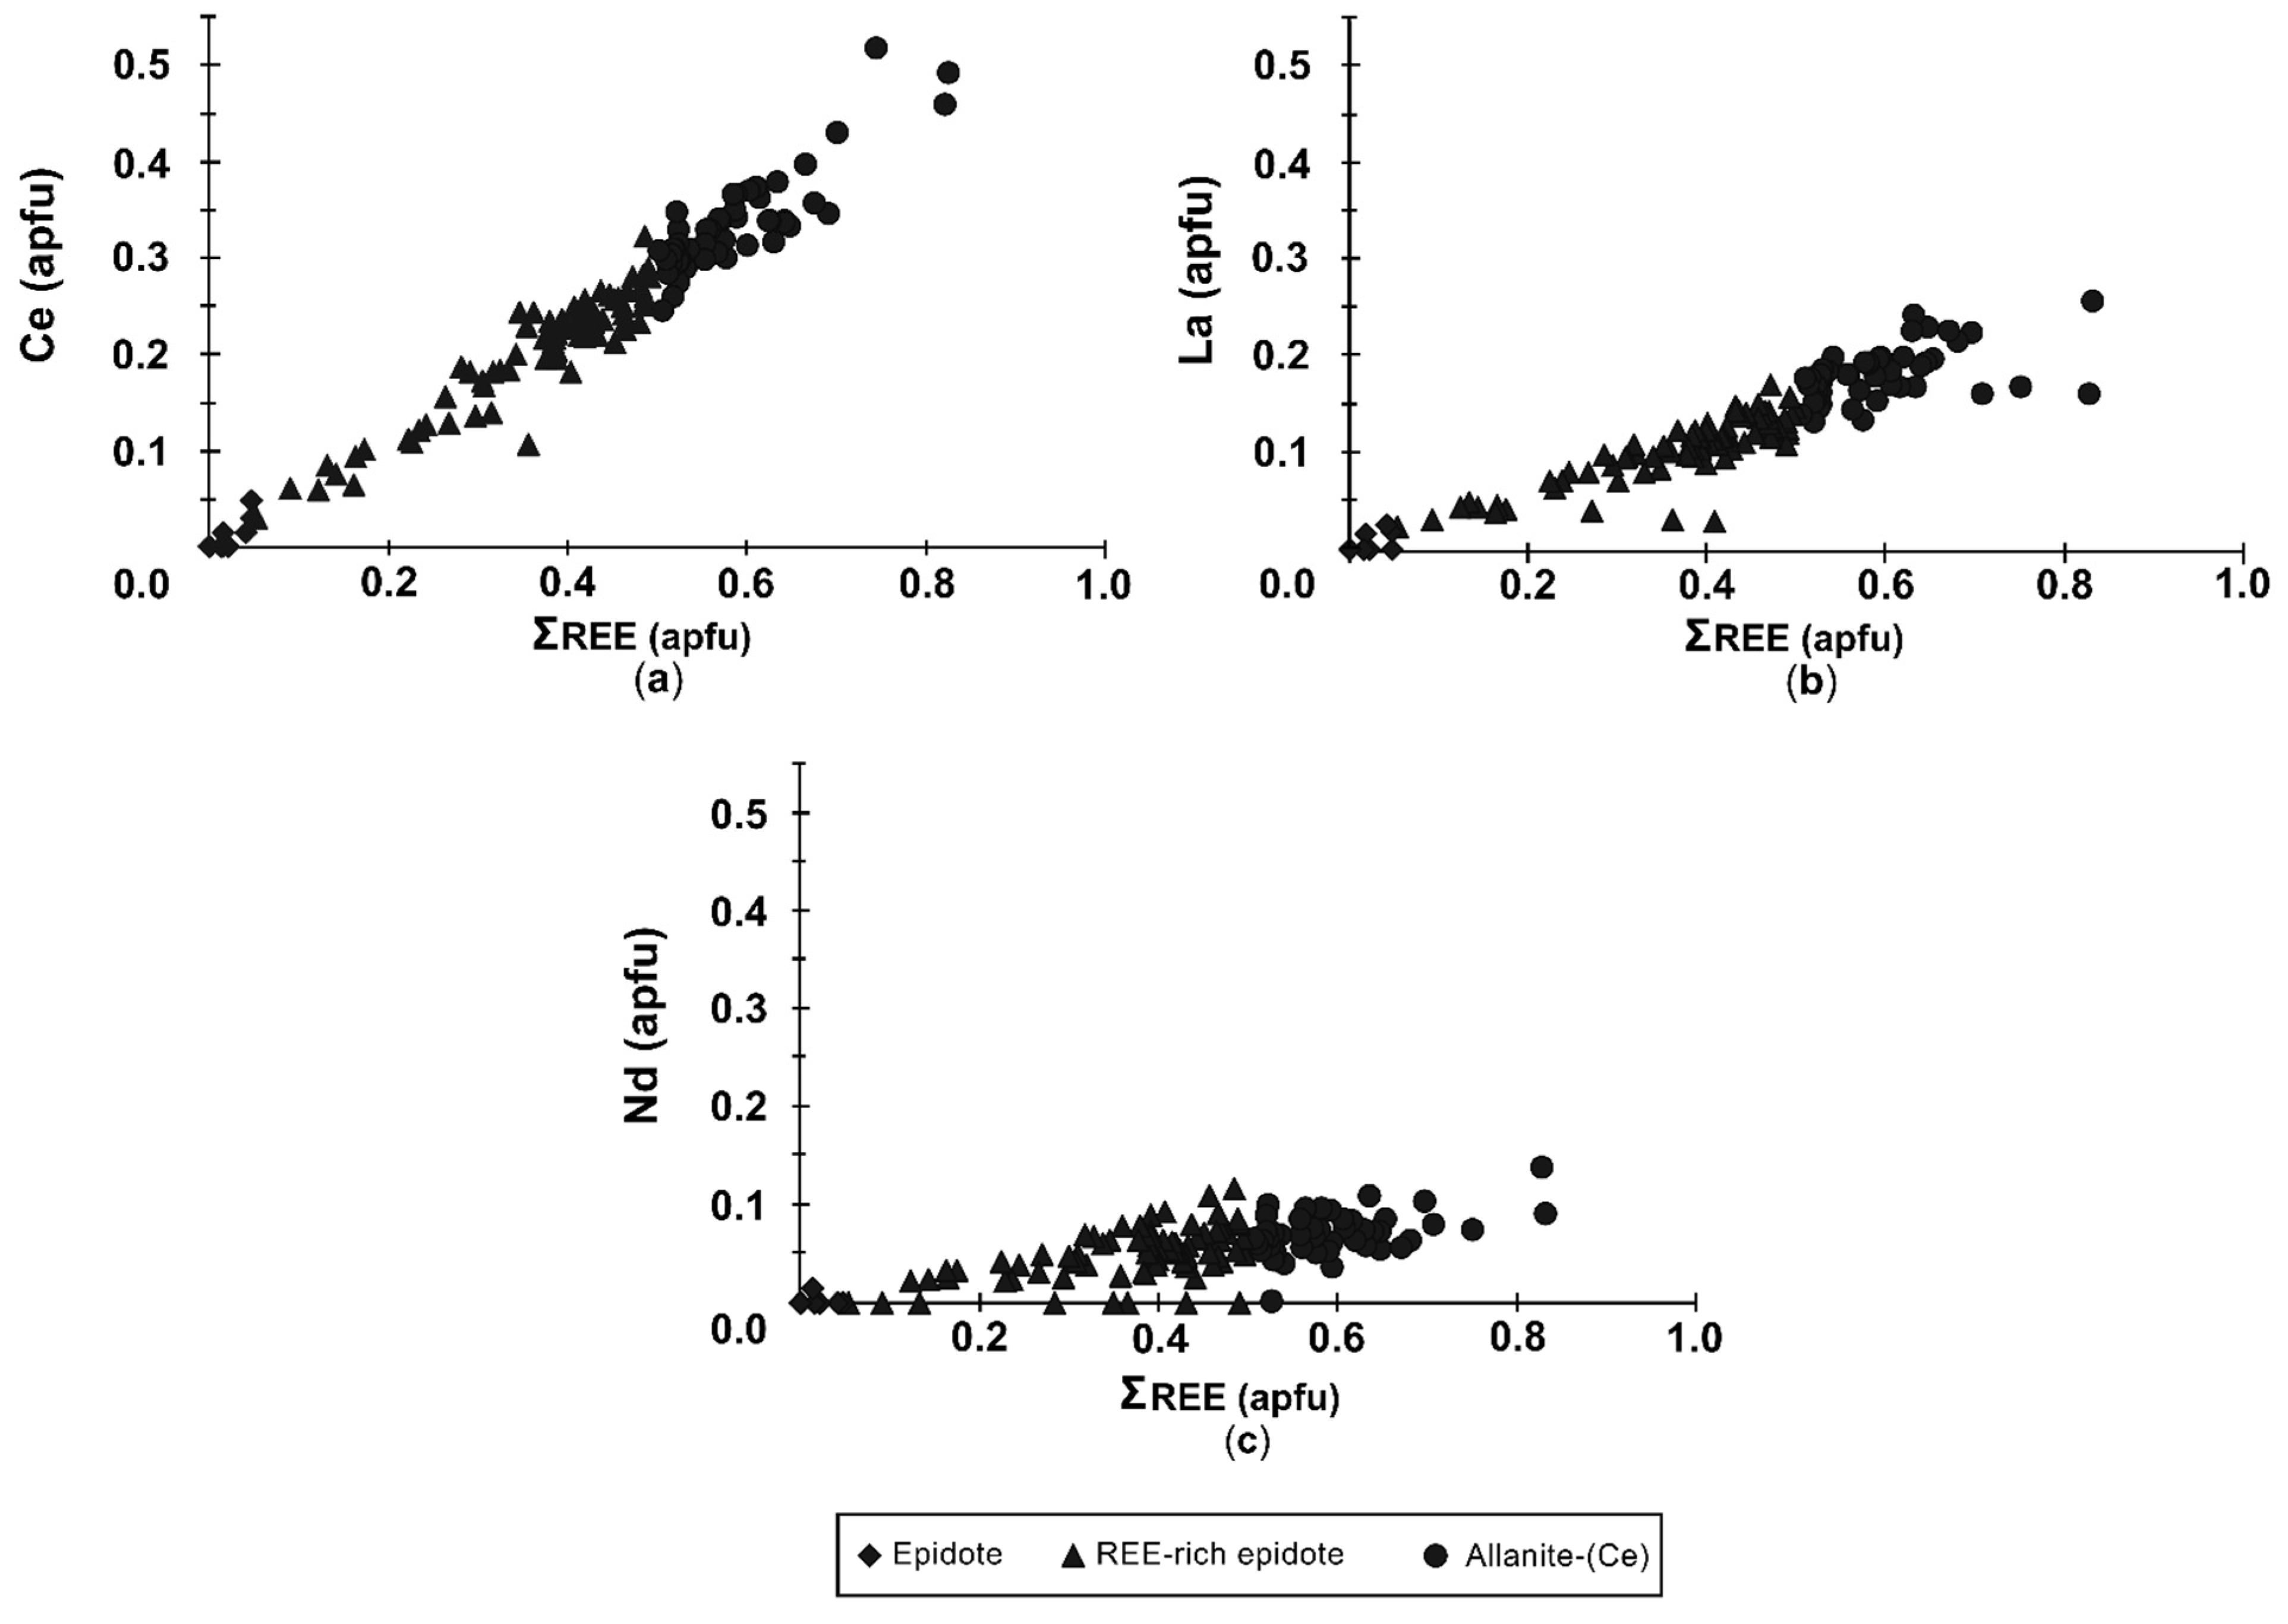
4.2.1. Composition of Allanite

Allanite constitutes the most REE-rich member of the epidote-group minerals, and its general chemical formula is {A12+A22+M13+M23+M32+}(Si2O7)(SiO4)O(OH) [36]. The A1 site is dominated by Ca, while in the A2 site, the excess Ca and the cations Sr, Pb2+, Mn2+, REE3+, Th and U are incorporated. The cations Al, Fe3+, Fe2+, Mn3+, Mn2+, Mg, Cr3+ and V3+ are distributed in the three structurally different octahedral M sites, M1, M2 and M3 [37,38].
As compared with the epidote and the clinozoisite subgroups, allanite is characterized by a dominance of REE3+ against Ca2+ in the A2 site, with (REE)2O3 concentration > 3 wt %, and REE3+ > 0.5 atoms per formula unit (apfu) [39]. Cerium is the most common REE in allanite, but there are available literature data for La- and Y-dominant species, presenting distinct allanite mineral species [39,40]. In the M3 site, Fe3+ of epidote or Al3+ of clinozoisite is replaced by Fe2+ of allanite [36,39,40,41].
The classification of the analyzed allanite and epidote from Kavala is shown in the three major end-members (epidote–allanite–clinozoisite) ternary plot (Figure 4). The analyses with REE + Y content between 0.5 and 0.1 apfu are referred to as REE-rich epidotes, while those with <0.1 apfu, as epidotes. Microanalyses from Kavala distinguish three types of minerals: epidote, REE-rich epidote and allanite-(Ce), whereas clinozoisite is absent.
Allanite-(Ce) is the major REE-bearing mineral phase in the studied black sands from Kavala. It occurs as euhedral to subhedral crystals with dark brown to black color. Its morphology shows a tabular habit, while it also occurs as prismatic to acicular grains with no apparent cleavage. Allanite-(Ce) grains range in size from 0.2 to 0.8 mm, and sometimes they are found as inclusions in quartz or epidote. The SEM–BSE images demonstrate a homogenous appearance (Figure 5a), although in some cases allanite-(Ce) shows variations in brightness within a single crystal, indicating variances to the REE content (Figure 5c,d). Additionally, it rarely contains inclusions of zircon (Figure 5c,d), thorite (Figure 5b), titanite (Figure 5d) and monazite-(Ce) (Figure 5b).
Multiple grains of allanite and several points within a single grain were analyzed for 26 elements (Table 4). Apart from Ca, Al, Si, Fe and LREE (Ce, La), the concentration of the other elements, such as Mg, Mn, U, Th, Nd, Eu and Y, are below the detection limit or rarely exceed 0.3 atoms per formula unit. According to the structure refinement described by Armbruster et al. [39], the structural formula of allanite was calculated on the basis of 12.5 oxygens and 8 cations per formula unit (ΣA+M+T = 8).
The content of the rare earths in allanite-(Ce) from Kavala varies between 14.78 and 23.24 wt % in total. Lanthanum (III) oxide (La2O3) ranges from 3.84 to 7.12 wt %, Ce2O3 from 7.15 to 14.75 wt %, Nd2O3 up to 3.91 wt %, Eu2O3 up to 2.35 wt % and Y2O3 up to 1.10 wt %. Allanite-(Ce) also contains up to 3.81 wt % ThO2. Similar concentrations have been presented previously [20,21].
The ratio Fe2+/Fe3+ was calculated until the total cation charges were equal to 25. Manganese is assumed to be as Mn2+; this assumption does not introduce large stoichiometric errors because Mn2+ is a minor constituent [43]. Epidote is characterized by a strong preference for Fe3+ in the M3 site, whereas the cation Fe2+ occupies the octahedral M3 site in allanite. Ferriallanite, almost identical to allanite, is constituted by essential Fe2+ quantity and exhibits Fe3+ dominance in the octahedral M1 site [44]. The average chemical formula of the allanite from Kavala is:
(REE0.597Ca1.360Th0.047U0.002) (Al1.732Fe2+0.443Fe3+0.620Mn0.052Mg0.154) (Si2.962Al0.038O12) (OH). In this formula, REE0.597 represents the sum of the atoms of individual lanthanides and yttrium contents, i.e., La0.184, Ce0.331, Nd0.070, Eu0.007 and Y0.005. The ΣREE + Y content in all analyzed allanites from Kavala varies between 0.505 and 0.830 apfu. Thorium content reaches 0.081 apfu, while U is typically present in lower concentrations, up to 0.021 apfu, when it is present.
The graphic illustration of Altot vs. REE + Y (apfu), proposed by [38,45], shows the chemical relationship between ferriallanite, allanite, epidote and clinozoisite (Figure 6). This diagram can be used to estimate the Feox = Fe3+/Fetot values from the lines radiating by the clinozoisite end member; however, these values are slightly different from the Feox that were calculated from the microanalysis based on [38] (Table 4 and Table 5). The REE-enriched allanites plot within the area between allanite and ferriallanite, indicating a sufficient ferriallanite component with significant Fe3+ incorporation in the composition of the allanite. The plotted Altot values of allanite range between 1.34 and 1.96 apfu. The plotted Feox values are < 0.6.

4.2.2. Composition of Epidote

The epidote mineral subgroup is described by the general chemical formula {A12+A22+M13+M23+M33+} (Si2O7)(SiO4)O(OH) [39,41,46], where the A1 and A2 sites are dominated by Ca, although Mn, REE (mainly Ce), Th and U are usually incorporated. The three distinct octahedral sites M1, M2 and M3 are generally occupied by Al, and are commonly substituted by Fe3+. Epidote may also contain small amounts of Mn, Mg, Fe2+, Sr, Cr and V. The subgroup of epidote is derived from the clinozoisite subgroup by homovalent substitution in the M sites of the type: Al3+  Fe3+ [39]. Fe3+ strongly favors the M3 site. However, when total Fe3+ content is high, it substitutes in the M1 site. The term REE-rich epidote refers to epidotes with 0.1 < REE < 0.5 apfu in the A1 site.
Epidote in the black sands at Kavala is found as discrete anhedral grains or as clusters of grains around allanite-(Ce), and has a light green to yellow-green color, ranging in length from 400 μm to 2 mm (Figure 7a). In the SEM–BSE images, the epidote grains show either homogeneous internal textures (Figure 7b) or they present zoning patterns of progressive hydrothermal alteration of allanite-(Ce) (Figure 7c). Epidote rims are significantly lower in REE content and thus darker in the SEM–BSE images (Figure 7c). In addition, the allanite-(Ce) crystals with varying brightness are linked to fluctuations in the REE contents, so that the darker areas are depleted in REE and are characterized as REE-rich epidote in contrast to the brighter core.
The analyzed epidotes display elevated REE contents reaching 15.75 wt % ΣREE in the REE-rich epidote (Table 5). Calcium dominates in the A site and decreases with increasing REE content. Thorium rarely exceeds 0.035 apfu in the REE-poor epidote and reaches 0.104 apfu in the REE-rich epidote. Uranium in epidote participates in smaller quantities, reaching up to 0.017 apfu. The SEM–EDS analyses yielded the following representative chemical formula for the REE-rich epidotes:
(Ca1.595REE0.369Th0.035U0.001) (Al1.915Fe3+0.683Fe2+0.284Mg0.080Mn0.037) (Si2.958Al0.042O12) (OH)
and for the epidotes:
(Ca1.976REE0.020Th0.004U0.001) (Al1.903Fe3+0.939Fe2+0.001Mg0.006Mn0.031) (Si2.973Al0.044O12) (OH).

4.2.3. Composition of Monazite and Thorite

Monazite in the studied samples is rare and usually forms tiny (~40 μm) columnar grains with a relic appearance and overgrown by allanite-(Ce). Occasionally, monazite occurs along the fractures of allanite-(Ce) (Figure 5b). Table 6 reports representative SEM–EDS analyses carried out in the monazite grains of the Kavala black sands.
Monazite chemical composition presents a strong variability in the contents of ΣREE2O3 (22.2–55.21 wt %) and ThO2 (6.33–49.61 wt %). The KVL1-1.4 grain contains 21.69 wt % Ce, and is characterized as monazite-(Ce), including minor concentrations of La and Nd, while the KVL1-1.5 grain is dominated by La (20.64 wt %), and is characterized as monazite-(La). The higher content of Th in the KVL5-7.5 grain (49.61 wt % Th) is coupled with lower ΣREE (22.23 wt %) in comparison to Th-poor monazite-(La) (Table 6). The KVL5-7.5 grain may represent a monazite–cheralite solid-solution mineral phase.
Thorite is an accessory phase in the KVL1 sample, forming bleb-like inclusions (~10 μm across) in allanite-(Ce). Apart from Th (almost 75.95 wt %), it contains La (1.34 wt %) and Ce (2.48 wt %) (Table 6).

4.2.4. Composition of Zircon and Titanite

Numerous zircon inclusions are found in allanite-(Ce), epidote and titanite of the black sands at Kavala. Microanalyses (Table 7) demonstrated an enrichment of HfO2 (up to 1.73 wt %), and UO2 (up to 2.72 wt %) in some grains. Rare earths were not observed. Titanite is a rare mineral phase in the magnetic fraction of the black sands. Under the binocular microscope they are reddish brown to colorless with a mean grain size of 0.3 mm. It is found also as inclusions in allanite-(Ce) and magnetite. Representative microanalyses of titanite are shown in Table 8. V2O5 ranges between 0.57 and 0.62 wt %, and Nb2O5 from 0.55 to 1.03 wt %. REE2O3, ThO2 and UO3 are below the detection limits.

5. Discussion

Numerous mineralogical and geochemical studies have been carried out at the coastal areas of the Kavala district so far, demonstrating elevated concentrations in rare earths, uranium and thorium [12,13,14,15,16,17,18,19,20,21]. For more than 30 years, the Institute of Geological and Mineral Exploration (IGME, today EAGME) in collaboration with the Hellenic Centre for Marine Research (ELKETHE), have been conducting an extended exploration project on the sediments of the Northern Aegean for REE, focusing on allanite, monazite and zirconium [13,14]. The sediments contain up to 0.8 g/t LREE, mainly lanthanum (La), cerium (Ce) and neodymium (Nd) [14]. According to Stouraiti et al. [21], the maximum extraction proportion of rare earths with magnetic separation from the coastal black sands at Kavala district can reach up to 92% in La, up to 91% Ce and up to 87% in Nd.
Previous studies have shown elevated radioactivity reaching 4488 Bq/kg, which is the highest ever measured in sediments of Greece [17,20]. The sediments offer the opportunity for detailed characterization of allanite-(Ce) and REE-rich epidote from placer deposits regarding the zoning behavior, and the partition coefficients that describe the alteration and the mechanism of chemical zoning.
The present study of the magnetic fraction of the black sands at Kariani, Pirgos, Mirtofito, Eleochori, Agia Marina and Nea Peramos of the Kavala district showed that the mineralogical composition consists of amphibole, epidote, hematite, goethite, mica, allanite-(Ce), garnet, titanite, zircon, monazite-(Ce), monazite-(La), ilmenite, rutile, magnetite, chlorite and thorite. The major REE-bearing minerals are allanite-(Ce), 2–5 wt % of the total magnetic fraction, and epidote. Monazite and thorite contribute to a lesser extent in the REE content. Similar results were previously presented by [19,20,21]. LA–ICP–MS analysis conducted by [18,19,20] demonstrated that titanite and zircon also contain traces of REE.
The quantity of the REE-bearing minerals shows strong fluctuations depending on the proximity of the beaches to the Kavala pluton (Figure 1), which is considered the main source for allanite-(Ce), REE-rich epidote, epidote, monazite-(Ce), monazite-(La) and thorite. The KVL1 sample from Kariani, which was collected at a rather long distance from the pluton, has the lowest allanite-(Ce) and epidote concentrations. The main component is garnet, possibly implying a source from the metamorphic rocks, especially gneiss, of the broader area. The maximum quantity of allanite-(Ce) was found in sample KVL4 at Eleochori (Table 3).
Allanite is the compositionally most diverse part of the epidote group. In the A2 sites, Ca2+ is replaced by trivalent REE, Th and U. This incorporation of REE3+ is charge-balanced by divalent cation substitutions for trivalent cations in the M sites, according to the exchange A22+ + M33+ A23+ + M32+ [38,45]. More precisely, Al3+ and Fe3+ are substituted by Fe2+, Mg2+ and Mn2+ in the unit cell of allanites of Kavala. These cation exchanges are plotted in Figure 8a, and are characterized by a negative trend line, indicating that the exchange mechanism is (Ca + (Fe3+, Al))−1(LREE, Y, Th, U + (Fe2+, Mg, Mn))+1 [37]. The exchange vector specifies the 1:1 substitution mechanism. The strong negative correlation of the cations in the alkali site A2 proves the considerable substitution between LREE+Y+Th+U and Ca (Figure 8b).
A positive correlation is evident between Fe2++Mg+Mn and LREE+Y+Th+U (Figure 8c). The cation Fe2+ in the M3 site expands the allanite structure to accommodate REE in the A2 site. Magnesium and Mn in the M3 site compensate for this charge imbalance. Figure 8d indicates less participation of the substitution mechanism of Al+Fe3+ vs. LREE+Y+Th+U.
The epidote-group minerals found in the Kavala black sands are suggested to originate from the adjacent Miocene Kavala pluton. In many grains, allanites-(Ce) occur as cores that progressively lapse into REE-rich epidote and finally to epidote in the rims. This zoning structure possibly reflects the melt depletion of LREE and fractionation in allanite, from the core to the rim, a process that is common in magmatic rocks, as has been previously suggested by [38]. In addition, some allanite-(Ce) grains reveal patchy internal textures, displaying darker and lighter gray domains with irregular limits in the SEM–BSE images. The low BSE intensity is ascribed to REE leaching in allanite-(Ce), and has been described by [47]. This chemical variation is possibly generated by hydrothermal fluids that penetrated allanite along grain fractures.
The elevated Th content indicates that the allanite is metamict, and resulted in the LREE leaching and the enrichment of Th, and Y in some crystals. The negative cation correlation plots of epidote mineral group (Figure 8a) suggest that the alteration is related to the chemical exchange mechanism between the primary allanite-(Ce) and the hydrothermal fluids, and is described by the reaction: LREE3+ + Fe2+  Ca2+ + Al3+ [47,48]. This is documented by the mode of occurrence of thorite and monazite–cheralite, which are found locally along the cracks of the allanite-(Ce) grains. These mineral phases were formed after allanite-(Ce) formation, due to fluid circulation that removed the REE and re-precipitated them in these cracks [47,48,49].
The plots of the three most abundant rare earths (Ce, La, Nd) versus ΣREE in the epidote-group minerals at Kavala show different decreasing trends, depending on the abundance and the atomic number of these elements. There is a strong positive correlation of the ΣREE with Ce and La (Figure 9a,b) demonstrating that these two elements dominate among the REE in the epidote-group minerals from the Kavala black sands. Neodymium shows a slight positive correlation with ΣREE (Figure 9c), suggesting a minor incorporation.

6. Conclusions

The mineralogical study of the magnetic fraction from the coastal black sands at Kavala district, Northern Greece, revealed the presence of allanite (2–5% wt) as the major host mineral for LREE (La, Ce, Nd), Th and U. Low REE concentrations were also observed in the REE-rich epidote, in monazite, and in thorite. Cerium dominates among the other rare earths, and thus the allanites of the black sand are identified as allanite-(Ce). The high Th content and the elevated Feox (>0.5) are common in the metamictic allanites. The epidote-group minerals show a clear substitution between Ca + (Fe3+, Al) and LREE, Y, Th, U + (Fe2+, Mg, Mn), which is correlated with the zoning patterns among allanite-(Ce), REE-rich epidote and epidote in single grains.

Author Contributions

Conceptualization, V.M. and E.P.; methodology, E.P., L.P. and N.K.; software, E.P.; validation, E.P., V.M., L.P., N.K. and P.V.; formal analysis, E.P.; investigation, E.P., L.P. and N.K.; data curation, E.P., V.M., L.P., N.K. and P.V.; writing—original draft preparation, E.P.; writing—review and editing, V.M., L.P., N.K. and P.V.; supervision, V.M.; funding acquisition, E.P. All authors have read and agreed to the published version of the manuscript.

Funding

E.P. received a scholarship founded by HELLENIC PETROLEUM S.A. through the Special Account for Research Grants (S.A.R.G.) A.U.Th. in the context of the project No 98665 “Graduate Student Scholarships with the support of ELPE-2019” (MIS-547370).

Data Availability Statement

Not applicable.

Acknowledgments

The present study was carried out within the framework of the master thesis of the first author, Eftychia Peristeridou, who has been financially supported by HELLENIC PETROLEUM S.A. (HELPE). Special thanks should be addressed to Christos Stergiou for his assistance during sampling.

Conflicts of Interest

The authors declare no conflict of interest. The funders had no role in the design of the study; in the collection, analyses or interpretation of data; in the writing of the manuscript, or in the decision to publish the results.

References

  1. Watari, T.; McLellan, B.C.; Giurco, D.; Dominish, E.; Yamasue, E.; Nansai, K. Total material requirement for the global energy transition to 2050: A focus on transport and electricity. Resour. Conserv. Recycl. 2019, 148, 91–103. [Google Scholar] [CrossRef]
  2. European Commission. Critical Raw Materials Resilience: Charting a Path towards Greater Security and Sustainability; European Commission: Brussels, Belgium, 2020; p. 4. [Google Scholar]
  3. Emsley, J. Nature’s Building Blocks: An AZ Guide to the Elements, 2nd ed.; Oxford University Press: Oxford, UK, 2011. [Google Scholar]
  4. Van Gosen, B.S.; Verplanck, P.L.; Seal, R.R., II; Long, K.R.; Gambogi, J. Rare-Earth Elements, Chap. 0. In Critical Mineral Resources of the United States: Economic and Environmental Geology and Prospects for Future Supply, No. 1802-O; U.S. Geological Survey Professional Paper 1802; Schulz, K.J., De Young, J.H., Seal, R.R., Bradley, D.C., Eds.; U.S. Geological Survey: Reston, VA, USA, 2018; pp. 1–31. [Google Scholar] [CrossRef]
  5. Dushyantha, N.; Batapola, N.; Ilankoon, I.M.S.K.; Rohitha, S.; Premasiri, R.; Abeysinghe, B.; Ratnayake, N.; Dissanayake, K. The story of rare earth elements (REEs): Occurrences, global distribution, genesis, geology, mineralogy and global production. Ore Geol. Rev. 2020, 122, 103521. [Google Scholar] [CrossRef]
  6. Goodenough, K.M.; Schilling, J.; Jonsson, E.; Kalvig, P.; Charles, N.; Tuduri, J.; Deady, E.A.; Sadeghi, M.; Schiellerup, H.; Müller, A.; et al. Europe’s Rare Earth Element Resource Potential: An Overview of REE Metallogenetic Provinces and Their Geodynamic Setting. Ore Geol. Rev. 2016, 72, 838–856. [Google Scholar] [CrossRef]
  7. Barakos, G.; Gutzmer, J.; Mischo, H. Strategic evaluations and mining process optimization towards a strong global REE supply chain. J. Sustain. Min. 2016, 15, 26–35. [Google Scholar] [CrossRef] [Green Version]
  8. Verplanck, P.L.; Hitzman, M.W. Rare Earth and Critical Elements in Ore Deposits. Rev. Econ. Geol. 2016, 18, 1–3. [Google Scholar] [CrossRef] [Green Version]
  9. Long, K.R.; van Gosen, B.S.; Foley, N.K.; Cordier, D. The Principal Rare Earth Elements Deposits of the United States: A Summary of Domestic Deposits and a Global Perspective. In Non-Renewable Resource Issues: Geoscientific and Societal Challenges; Sinding-Larsen, R., Wellmer, F.W., Eds.; Springer: Berlin, Germany, 2012; pp. 131–156. [Google Scholar] [CrossRef]
  10. Castor, S.B.; Hedrick, J.B. Rare earth elements. Ind. Miner. Rocks 2006, 769–792. [Google Scholar] [CrossRef]
  11. Jordens, A.; Cheng, Y.P.; Waters, K.E. A Review of the Beneficiation of Rare Earth Element Bearing Minerals. Miner. Eng. 2013, 41, 97–114. [Google Scholar] [CrossRef]
  12. Papadakis, A. The black sands of Loutra Eleftheron near Kavala, Greece. Sci. Ann. Fac. Phys. Math. Univ. Thessalon. 1975, 15, 331–390. [Google Scholar]
  13. Perissoratis, C.; Moorby, S.A.; Angelopoulos, I.; Cronan, D.S.; Papavasiliou, C.; Konispoliatis, N.; Sakellariadou, F.; Mitropoulos, D. Mineral Concentrations in the Recent Sediments Off Eastern Macedonia, Northern Greece: Geological and Geochemical Considerations. In Mineral Deposits within the European Community; Springer: Berlin/Heidelberg, Germany, 1988. [Google Scholar] [CrossRef]
  14. Pergamalis, F.; Karageorgiou, D.E.; Koukoulis, A.; Katsikis, I. Mineralogical and chemical composition of sand ore deposits in the seashore zone N. Peramos-L. Eleftheron (N. Greece). Bull. Geol. Soc. Greece 2001, 34, 845–850. [Google Scholar] [CrossRef] [Green Version]
  15. Pergamalis, F.; Karageorgiou, D.E.; Koukoulis, A. The location of Ti, REE, Th, U, Au deposits in the seafront zones of Nea Peramos-Loutra Eleftheron area, Kavala (N. Greece) using radiation. Bull. Geol. Soc. Greece 2001, 34, 1023–1029. [Google Scholar] [CrossRef] [Green Version]
  16. Aggelatou, V.; Papamanoli, S.; Stouraiti, C.; Papavasileiou, K. REE distributions in the black sands of Kavala coastal zone, northern Greece: Mineralogical and geochemical characterization of beneficiation products. In Proceedings of the 1st International Electronic Conference on Mineral Science, virtual, 16–31 July 2018; Volume 1. [Google Scholar] [CrossRef]
  17. Papadopoulos, A.; Koroneos, A.; Christofides, G.; Stoulos, S. Natural Radioactivity Distribution and Gamma Radiation Exposure of Beach Sands Close to Kavala Pluton, Greece. Open Geosci. 2015, 7, 407–422. [Google Scholar] [CrossRef] [Green Version]
  18. Papadopoulos, A.; Koroneos, A.; Christofides, G.; Papadopoulou, L. Geochemistry of Beach Sands from Kavala, Northern Greece. Ital. J. Geosci. 2016, 135, 526–539. [Google Scholar] [CrossRef]
  19. Papadopoulos, A.; Tzifas, I.T.; Tsikos, H. The Potential for REE and Associated Critical Metals in Coastal Sand (Placer) Deposits of Greece: A Review. Minerals 2019, 9, 469. [Google Scholar] [CrossRef] [Green Version]
  20. Tzifas, I.T.; Papadopoulos, A.; Misaelides, P.; Godelitsas, A.; Göttlicher, J.; Tsikos, H.; Gamaletsos, P.N.; Luvizotto, G.; Karydas, A.G.; Petrelli, M.; et al. New Insights into Mineralogy and Geochemistry of Allanite-Bearing Mediterranean Coastal Sands from Northern Greece. Chem. Der. Erde. 2019, 79, 247–267. [Google Scholar] [CrossRef]
  21. Stouraiti, C.; Angelatou, V.; Petushok, S.; Soukis, K.; Eliopoulos, D. Effect of Mineralogy on the Beneficiation of REE from Heavy Mineral Sands: The Case of Nea Peramos, Kavala, Northern Greece. Minerals 2020, 10, 387. [Google Scholar] [CrossRef]
  22. Kromberg, P.; Schenk, P.F. Nikisiani- Loutra Elevtheron Sheets. In Geological Map of Greece, Scale 1:50.000; Institute of Geology and Mineral Exploration (IGME): Athens, Greece, 1974. [Google Scholar]
  23. Xidas, S. Rodholivos Sheet. In Geological Map of Greece, Scale 1:50,000; Institute of Geology and Mineral Exploration (IGME): Athens, Greece, 1984. [Google Scholar]
  24. Kromberg, P. Kavala Sheet. In Geological Map of Greece, Scale 1:50,000; Institute of Geology and Mineral Exploration (IGME): Athens, Greece, 1973. [Google Scholar]
  25. Brun, J.P.; Sokoutis, D. Kinematics of the Southern Rhodope Core Complex (North Greece). Int. J. Earth Sci. 2007, 96, 1079–1099. [Google Scholar] [CrossRef]
  26. Kounov, A.; Wüthrich, E.; Seward, D.; Burg, J.P.; Stockli, D. Low-Temperature Constraints on the Cenozoic Thermal Evolution of the Southern Rhodope Core Complex (Northern Greece). Int. J. Earth Sci. 2015, 104, 1337–1352. [Google Scholar] [CrossRef]
  27. Dinter, D.A.; Macfarlane, A.; Hames, W.; Isachsen, C.; Bowring, S.; Royden, L. U-Pb and 40Ar/39Ar Geochronology of the Symvolon Granodiorite: Implications for the Thermal and Structural Evolution of the Rhodope Metamorphic Core Complex, Northeastern Greece. Tectonics 1995, 14, 886–908. [Google Scholar] [CrossRef]
  28. Dinter, D.A. Late Cenozoic Extension of the Alpine Collisional Orogen, Northeastern Greece: Origin of the North Aegean Basin. Bull. Geol. Soc. Am. 1998, 110, 1208–1230. [Google Scholar] [CrossRef]
  29. Neiva, A.M.R.; Christofides, G.; Eleftheriadis, G.; Soldatos, T. Geochemistry of Granitic Rocks and Their Minerals from the Kavala Pluton, Northern Greece. Chem. Der Erde 1996, 56, 117–142. [Google Scholar]
  30. Christofides, G.; Neiva, A.M.R.; Soldatos, T.; Eleftheriadis, G. Petrology of the Kavala plutonite (Eastern Macedonia, Greece). Proc. XV Congr. CBGA 1995, 489–494. [Google Scholar]
  31. Xydous, S.; Magganas, A.; Pomonis, P.; Kokkinakis, A. Tourmalinite veins and breccias from the Symvolon-Kavala pluton, northern Greece: Petrogenetic preliminary results. Bull. Geol. Soc. Greece 2016, 50, 2079–2087. [Google Scholar] [CrossRef] [Green Version]
  32. Dinter, D.A.; Royden, L. Late Cenozoic Extension in Northeastern Greece: Strymon Valley Detachment System and Rhodope Metamorphic Core Complex. Geology 1993, 21, 45–48. [Google Scholar] [CrossRef]
  33. Kokkinakis, A. Geologie und Petrographie des Kavala-Gebietes und des Symvolongebirges in Griechisch-Ostmakedonien. Z. Dtsch. Geol. Ges. 1980, 131, 903–925. [Google Scholar]
  34. Kyriakopoulos, K.; Pezzino, A.; Del Moro, A. Rb-Sr geochronological, petrological and structural study of the Kavala plutonic complex (N. Greece). Bull. Geol. Soc. Greece 1989, 23, 545–560. [Google Scholar]
  35. Doebelin, N.; Kleeberg, R. Profex: A graphical user interface for the Rietveld refinement program BGMN. J. Appl. Crystallogr. 2015, 48, 1573–1580. [Google Scholar] [CrossRef] [Green Version]
  36. Dollase, W.A. Refinement of the Crystal Structures of Epidote, Allanite and Hancockite. Am. Mineral. 1971, 56, 447–464. [Google Scholar]
  37. Deer, W.A.; Howie, R.A.; Zussman, J. Rock-forming minerals. Disilicates and Ring Silicates, 2nd ed.; Longman: Harlow, UK, 1997; 629p. [Google Scholar]
  38. Gieré, R.; Sorensen, S.S. Allanite and Other: REE-Rich Epidote-Group Minerals. Rev. Mineral. Geochem. 2004, 56, 431–493. [Google Scholar] [CrossRef]
  39. Armbruster, T.; Bonazzi, P.; Akasaka, M.; Bermanec, V.; Chopin, C.; Gieré, R.; Heuss-Assbichler, S.; Liebscher, A.; Menchetti, S.; Pan, Y.; et al. Recommended Nomenclature of Epidote-Group Minerals. Eur. J. Mineral. 2006, 18, 551–567. [Google Scholar] [CrossRef] [Green Version]
  40. Thomson, T. Experiments on allanite, a new mineral from Greenland. Trans. R. Soc. Edinburg 1810, 8, 371–386. [Google Scholar]
  41. Franz, G.; Liebscher, A. Physical and Chemical Properties of the Epidote Minerals—An Introduction. Rev. Mineral. Geochem. 2004, 56, 1–82. [Google Scholar] [CrossRef]
  42. Graser, G.; Markl, G. Ca-Rich Ilvaite-Epidote-Hydrogarnet Endoskarns: A Record of Late-Magmatic Fluid Influx into the Persodic Ilímaussaq Complex, South Greenland. J. Petrol. 2008, 49, 239–265. [Google Scholar] [CrossRef] [Green Version]
  43. Ercit, T.S. The Mess That Is “Allanite”. Can. Mineral. 2002, 40, 1411–1419. [Google Scholar] [CrossRef]
  44. Kartashov, P.M.; Ferraris, G.; Ivaldi, G.; Sokolova, E.; McCammon, C.A. Ferriallanite-(Ce), CaCeFe3+AlFe2+(SiO4(Si2O7)O(OH), a new member of the Epidote Group: Description, X-Ray and Mössbauer Study. Can. Mineral. 2003, 41, 829–830. [Google Scholar] [CrossRef] [Green Version]
  45. Petrik, I.; Broska, I.; Lipka, J.; Siman, P. Granitoid Allanite-(Ce): Substitution Relations, Redox Conditions and REE Distributions (on an Example of I-Type Granitoids, Western Carpathians, Slovakia). Geol. Carpathica 1995, 46, 79–94. [Google Scholar]
  46. Mills, S.J.; Hatert, F.; Nickel, E.H.; Ferraris, G. The Standardisation of Mineral Group Hierarchies: Application to Recent Nomenclature Proposals. Eur. J. Mineral. 2009, 21, 1073–1080. [Google Scholar] [CrossRef] [Green Version]
  47. Poitrasson, F. In Situ Investigations of Allanite Hydrothermal Alteration: Examples from Calc-Alkaline and Anorogenic Granites of Corsica (Southeast France). Contrib. Mineral. Petrol. 2002, 142, 485–500. [Google Scholar] [CrossRef]
  48. Chen, W.T.; Zhou, M.F. Ages and Compositions of Primary and Secondary Allanite from the Lala Fe-Cu Deposit, SW China: Implications for Multiple Episodes of Hydrothermal Events. Contrib. Mineral. Petrol. 2014, 168, 1–20. [Google Scholar] [CrossRef]
  49. Sawka, W.N.; Chappell, B.W.; Norrish, K. Light-Rare-Earth-Element Zoning in Sphene and Allanite during Granitoid Fractionation. Geology 1984, 12, 131–134. [Google Scholar] [CrossRef]
Figure 1. Simplified geological map of the area between the Strymonikos Gulf and Eleftheres Bay, of the Kavala district, with the sampling sites (KVL1–KVL6). Modified after [22,23,24].
Geosciences 12 00277 g001
Figure 2. Sampling sites of the coast black sands at Kavala district. Heavy mineral accumulations were collected from the surface (a,c,e,f) and from horizons in the sand (b,d). The samples KVL1 to KVL6 are depicted in the images (af), respectively.
Geosciences 12 00277 g002
Figure 3. X-ray diffraction pattern of magnetic fraction of the black sand samples: (a) KVL4 and (b) KVL5.
Geosciences 12 00277 g003
Figure 4. Epidote–Allanite–Clinozoisite ternary plots [42] for the six studied samples.
Geosciences 12 00277 g004
Figure 5. SEM–BSE images of allanite grains from Kavala. (a,b) Homogeneously colored allanite-(Ce) with inclusions of thorite and monazite-(Ce). (c) Heterogeneous grain showing the enrichment of REE in the brighter parts. The straight limits indicate the progressive hydrothermal alteration of allanite-(Ce) to REE-rich epidote and finally to epidote. Inclusions of zircon are also present. (d) Heterogeneous, hydrothermally altered allanite-(Ce) with inclusions of titanite and zircon. aln-(Ce) = allanite-(Ce), thor = thorite, mon-(Ce) = monazite-(Ce), mon-(La) = monazite-(La), REE-rich ep = epidote (with more than 0.1 ΣREE apfu), ep = epidote, tit = titanite.
Geosciences 12 00277 g005
Figure 6. Altot vs. REE + Y (apfu) diagram after [45], showing the position of the studied epidote mineral group in the ferriallanite–allanite–epidote–clinozoisite system. Isolines represent the Feox = Fe3+/Fetot ratio.
Geosciences 12 00277 g006
Figure 7. (a) Epidote grains under binocular microscope; (b) SEM–BSE image of epidote intergrown with quartz; (c) SEM–BSE image illustrating a grain with epidote in the rim and REE-rich epidote and allanite-(Ce) in the core. The ragged edges between REE-rich epidote and allanite-(Ce) zones are attributed to hydrothermal alteration of epidote. Zircon inclusions are also present. Ep = epidote, qtz = quartz, zir = zircon, aln-(Ce) = allanite-(Ce), REE-rich ep = epidote (with more than 0.1 ΣREE apfu).
Geosciences 12 00277 g007
Figure 8. Plots showing possible cationic substitutions in epidote mineral group structure indicated for the Kavala black sands: (a) Ca+Al+Fe3+ vs. LREE+Y+Th+U+Fe2++Mg+Mn; (b) Ca vs. LREE+Y+Th+U; (c) Fe2++Mg+Mn vs. LREE+Y+Th+U; (d) Al+Fe3+ vs. LREE+Y+Th+U.
Geosciences 12 00277 g008
Figure 9. Plots showing the correlations between (a) Ce vs. ΣREE; (b) La vs. ΣREE and (c) Nd vs. ΣREE in the epidote-group minerals from the Kavala black sands.
Geosciences 12 00277 g009
Table 1. Code names and locations of the samples along the coast of the Kavala prefecture, shown in Figure 1.
SampleLocation
KVL1Kariani
KVL2Pirgos
KVL3Mirtofito
KVL4Eleochori
KVL5Agia Marina
KVL6Nea Peramos
Table 2. Magnetic fraction (MF) and nonmagnetic fraction (NMF) wt % for each of the studied samples.
SampleMF %NMF %
KVL159.8940.11
KVL229.1070.90
KVL326.6473.36
KVL434.7665.24
KVL527.3272.68
KVL622.6077.40
Table 3. Mineralogical composition (%wt) of the magnetic fractions of the studied samples.
KVL1KVL2KVL3KVL4KVL5KVL6
Allanite-(Ce)333523
Amphibole426 31302723
Chloriten.d.n.d.5n.d.n.d.6
Epidote62032213828
Garnet683tracestracesn.d.traces
Goethiten.d.9n.d.n.d.n.d.n.d.
Hematite4114tracesn.d.1
Ilmenite7n.d.n.d.2n.d.n.d.
K-feldsparn.d. 751588
Magnetite2n.d.tracesn.d.tracesn.d.
Mica65n.d.n.d.n.d.6
Monazite-(Ce), -(La)tracesn.d.n.d.n.d.22
Plagioclasen.d.16n.d.11118
Quartzn.d.98121011
Rutilen.d.traces122n.d.
Thoritetracesn.d.n.d.n.d.tracesn.d.
Titanitetracestracesn.d.2traces3
Zircontraces11tracestraces1
Total100100100100100100
n.d. = not detected.
Table 4. Representative microanalyses (wt %) and calculated formulae of allanite-(Ce) from the black sands at Kavala.
KVL1 1.3KVL2 5.2KVL2 5.4KVL3 1.2KVL3 1.3KVL4 3.1KVL6 2.3KVL6 3.1KVL6 3.3KVL6 3.4
SiO230.4331.6332.1131.7332.7431.8730.0132.2131.4032.48
Al2O313.0415.1916.7516.1417.2814.7215.1416.7515.8816.78
FeO*15.5714.2213.7113.6114.0813.5214.0214.0913.8211.97
MgO1.881.291.310.990.811.861.271.131.031.17
MnObdl0.68bdl0.450.510.92bdlbdl1.191.03
CaO10.8212.5614.3213.7215.2212.8210.8514.4713.2714.44
La2O34.436.163.845.715.566.507.125.056.995.15
Ce2O312.7210.238.658.858.8611.4413.598.079.737.15
Nd2O33.911.832.661.141.501.632.521.291.671.72
Eu2O32.35bdl0.34bdl0.13bdlbdl1.42bdlbdl
Y2O3bdl1.10bdlbdlbdlbdlbdlbdlbdl0.75
UO3bdlbdlbdlbdlbdl1.00bdlbdlbdlbdl
ThO22.002.573.193.81bdl1.001.702.301.893.02
Total97.1597.4696.8996.1496.6997.2996.2296.7796.8795.67
Chemical Formulae Calculated on the Basis of 12.5 O
Si2.9632.9692.9532.9762.9522.9842.9282.9552.9342.991
Al0.0370.0310.0470.0240.0480.0160.0720.0450.0660.009
T3.0003.0003.0003.0003.0003.0003.0003.0003.0003.000
Fe30.5410.3500.2350.2420.2090.3910.3280.2350.3190.189
Al0.4590.6500.7680.7600.7890.6090.6690.7660.6830.813
M11.0001.0001.0031.0020.9981.0000.9971.0011.0021.002
Al1.0001.0001.0001.0001.0001.0001.0001.0001.0001.000
M21.0001.0001.0001.0001.0001.0001.0001.0001.0001.000
Mn20.0000.0540.0000.0360.0390.0730.0000.0000.0940.081
Fe20.6150.5310.4360.5140.3390.3390.6450.4260.4100.388
Mg0.2730.1800.1800.1380.1080.2590.1840.1540.1440.160
Fe30.1120.2350.3840.3120.5140.3290.1710.4200.3520.371
M31.0001.0001.0001.0001.0001.0001.0001.0001.0001.000
M3.0003.0003.0033.0022.9983.0002.9973.0013.0023.002
Ca1.0001.0001.0001.0001.0001.0001.0001.0001.0001.000
A11.0001.0001.0001.0001.0001.0001.0001.0001.0001.000
Ca0.1280.2630.4110.3790.4710.2870.1340.4220.3290.425
REE0.8260.6250.5190.5400.5300.6700.8300.5280.6300.473
Y0.0000.0550.0000.0000.0000.0000.0000.0000.0000.037
U0.0000.0000.0000.0000.0000.0210.0000.0000.0000.000
Th0.0440.0550.0670.0810.0000.0210.0380.0480.0400.063
A20.9980.9980.9971.0001.0010.9991.0020.9980.9990.998
A1.9981.9981.9972.0002.0011.9992.0021.9981.9991.998
Σcation charge24.98524.99024.99324.99624.99224.98125.00024.99825.00025.000
Feox0.5150.5240.5870.5190.6810.6800.4360.6060.6210.591
FeO*: total iron as FeO; bdl: below detection limit.
Table 5. Representative microanalyses (wt %) and calculated formulae of REE-rich epidote and epidote from the black sands at Kavala.
REE-Rich EpidoteEpidote
KVL1 3.3KVL4 2.2KVL4 2.5KVL5 2.3KVL5 7.1KVL5 5.8KVL6 5.1KVL4 3.5KVL5 14.3
SiO233.1433.4434.1032.1432.9332.2733.0337.2036.77
Al2O317.3419.0521.1117.1618.0316.2818.1723.7723.82
FeO*13.1513.1912.3713.4012.8113.6313.2711.4812.94
MgO0.93bdlbdl1.080.631.130.59bdlbdl
MnO0.66bdl0.530.642.420.930.550.340.98
CaO15.8315.5618.6714.4716.6714.7815.8423.3223.51
La2O33.705.172.524.810.924.002.83bdlbdl
Ce2O37.317.053.969.703.256.856.89bdlbdl
Nd2O3bdl1.971.221.242.433.531.84bdlbdl
Eu2O3bdlbdlbdlbdlbdlbdl1.24bdlbdl
Y2O3bdlbdlbdlbdl3.11bdlbdlbdlbdl
UO3bdlbdl0.870.76bdlbdlbdlbdlbdl
ThO25.081.751.012.033.283.182.960.23bdl
Total97.1597.1996.3697.4296.4896.5897.2096.3398.02
Chemical Formulae Calculated on the Basis of 12.5 O
Si2.9902.9992.9322.9342.9092.9632.9632.9722.924
Al0.0100.0010.0680.0660.0910.0370.0370.0280.076
T3.0003.0003.0003.0003.0003.0003.0003.0003.000
Fe30.1680.0000.0000.2190.2090.2740.1170.2070.207
Al0.8341.0031.0010.7800.7870.7250.8840.7930.793
M11.0021.0031.0010.9990.9960.9991.0011.0001.000
Al1.0001.0001.0001.0001.0001.0001.0001.0001.000
M21.0001.0001.0001.0001.0001.0001.0001.0001.000
Mn20.0510.0000.0390.0490.1810.0720.0420.0230.066
Fe20.3980.5460.1550.3280.1430.3580.3820.0000.000
Mg0.1250.0000.0000.1470.0820.1550.0790.0000.000
Fe30.4260.4440.7350.4760.5940.4150.4970.5600.568
Al0.0000.0100.0710.0000.0000.0000.0000.0000.000
M31.0001.0001.0001.0001.0001.0001.0001.0010.998
M3.0023.0033.0012.9992.9962.9993.0013.0012.998
Ca1.0001.0001.0001.0001.0001.0001.0001.0001.000
A11.0001.0001.0001.0001.0001.0001.0001.0001.000
Ca0.5300.4960.7200.4160.5780.454.5230.9961.003
REE0.3640.4660.2430.5270.2120.4820.4170.0000.000
Y0.0000.0000.0000.0000.1460.0000.0000.0000.000
U0.0000.0000.0170.0150.0000.0000.0000.0000.000
Th0.1040.0360.0200.0420.0660.0660.0060.0040.000
A20.9980.9981.0000.9991.0021.00021.0001.0001.003
A1.9981.9982.0001.9992.0022.0022.0002.0002.003
Σcharge cation24.99024.99624.99024.98124.98524.99325.00024.96024.858
Feox0.5990.4480.8260.6790.8490.6580.6161.0001.000
FeO*: total iron as FeO; bdl: below detection limit.
Table 6. Representative microanalyses (wt %) and calculated formulae of monazite mineral group and thorite from the black sands at Kavala.
KVL1.1 4KVL1.1 5KVL5.7 5KVL1.4 1
Monazite-(Ce)Monazite-(La)Monazite–CheraliteThorite
P2O531.2532.2625.94bdl
SiO2bdlbdlbdl19.87
CaO6.075.821.810.29
La2O313.0820.648.271.34
Ce2O321.6919.497.982.48
Nd2O35.9215.085.98bdl
ThO221.456.3349.6175.95
Total99.4599.6299.5899.94
Chemical Formulae Calculated on the Basis of 4 O
P1.0111.0150.9590.000
Si0.0000.0000.0001.036
Ca0.2480.2320.0850.016
La0.1840.2830.1330.026
Ce0.3030.2650.1280.047
Nd0.0810.2000.0930.000
Th0.1860.0540.4930.901
Total2.0142.0491.8912.026
bdl = below detection limit.
Table 7. Representative microanalyses (wt %) and calculated formulae of zircon from the black sands at Kavala.
KVL3 3.5KVL3 6.7KVL4 1.6KVL4 6.6KVL6 2.5
SiO232.3431.8532.2632.0732.09
ZrO267.1265.3365.6664.6364.06
ThO2bdlbdlbdl1.931.42
HfO2bdlbdl1.73bdl1.19
UO3bdl2.24bdl1.091.00
Total99.4699.4299.6499.7199.76
Chemical Formulae Calculated on the Basis of 16 O
Si3.9763.9693.9843.9923.998
Zr4.0243.9693.9553.9233.891
Th0.0000.0000.0000.0550.040
Hf0.0000.0000.0610.0000.042
U0.0000.0620.0000.0300.028
bdl = below detection limit.
Table 8. Representative microanalyses (wt %) and calculated formulae of titanite from the black sands at Kavala.
KVL2 1.6KVL2 7.1KVL5 2 9.1KVL5 10.1KVL5 1.5KVL5 4.6
SiO230.8330.5531.2230.3930.7930.84
TiO238.0939.1736.9837.4738.1038.64
Al2O31.590.922.401.841.781.42
FeO1.611.63bdl4.501.661.47
MnObdl0.520.27bdlbdlbdl
MgObdlbdlbdlbdlbdl0.29
CaO26.2825.8728.8224.1426.4226.62
V2O50.62bdlbdlbdl0.57bdl
Nb2O50.660.87bdl1.03bdl0.55
Total99.6899.5299.6999.3799.8899.82
Chemical Formulae Calculated on the Basis of 4 O
Si4.0004.0004.0004.0004.0004.000
Ti3.7163.8563.5633.7083.7223.768
Al0.2430.1420.3620.2850.2730.216
Y3.9593.9983.9253.9943.9953.985
Fe0.1740.1780.0000.4960.1800.159
Mn0.0000.0580.0300.0000.0000.000
Mg0.0000.0000.0000.0000.0000.056
Ca3.6543.6293.9563.4043.6773.698
V0.0650.0000.0000.1080.0600.000
Nb0.1060.1400.0000.0000.0900.088
X3.9994.0043.9864.0084.0074.001
bdl = below detection limit.
Publisher’s Note: MDPI stays neutral with regard to jurisdictional claims in published maps and institutional affiliations.

