Article

Temperature Variation during Salt Migration in Frozen Hydrate-Bearing Sediments: Experimental Modeling

Center for Petroleum Science and Engineering, Skolkovo Institute of Science and Technology, Bolshoy Boulevard 30, bld. 1, 121205 Moscow, Russia
*
Author to whom correspondence should be addressed.
Geosciences 2022, 12(7), 261; https://doi.org/10.3390/geosciences12070261
Submission received: 20 May 2022 / Revised: 21 June 2022 / Accepted: 23 June 2022 / Published: 27 June 2022
(This article belongs to the Special Issue Permafrost and Gas Hydrate Response to Ground Temperature Rising)

Abstract

:
Salt migration may be another reason why pore-gas hydrates dissociate in permafrost, besides pressure and temperature changes. Temperature variations in frozen hydrate-saturated sediments interacting with a NaCl solution have been studied experimentally at a constant temperature, ~−6 °C typical for permafrost. The experiments with frozen sandy samples containing metastable methane hydrate show that the migration of Na+ ions in the NaCl solution and their accumulation in the sediments can induce heat-consuming hydrate dissociation and ice melting. The hydrate-saturated frozen soils cool down at higher rates than their hydrate-free counterparts and require more time to recover their initial temperature. The temperature effects in hydrate-saturated frozen sediments exposed to contact with NaCl solutions depend strongly on salt concentration. The experimental results are used to model phase changes in the pore space associated with salt-ions transport and provide insights into the reasons for temperature changes.

1. Introduction

Gas hydrates are crystalline clathrate compounds that look like ice or snow, which are formed out of water molecules and low-molecular gas under certain pressures and temperatures [1]. Hydrates of natural gas (mainly methane) are widely distributed in nature, especially in the bottom sediments of seas and oceans, at sea depths below 250–300 m, and also in the permafrost environment, where pressure and chemical conditions can maintain their stability [2,3,4,5,6,7]. Gas hydrates sequester large amounts of natural gas: in normal conditions, each volume unit of gas-hydrate stores about 160 units of methane. Over the past three decades, gas hydrates have been actively considered as a promising source of hydrocarbons [4,8,9,10]. Meanwhile, although being promising unconventional resources of natural gas, gas hydrates pose serious threats to petroleum production, from the conventional reservoirs located below the probable zone of hydrate stability [11,12,13,14,15,16].
Gas hydrates can lose stability and dissociate into water and gas, as a result of pressure drop and/or temperature changes (e.g., decompression and warming) [17]. The dissociation of pore hydrates is a heat-consuming process and, thus, leads to the considerable cooling of sediments [18,19,20]. However, the released interstitial water in permafrost quite rapidly freezes to ice, which coats the gas-hydrate particles and impedes their further dissociation [19,21,22,23,24,25,26,27,28]. Furthermore, the heat-consuming dissociation reaction and the related cooling accelerate the freezing rate and maintain the self-preservation of pore-gas hydrates. For this reason, hydrates can remain metastable for a long time, even at atmospheric pressure [22,29]. Numerous field data obtained during the drilling of engineering wells in Russian permafrost indicate the possibility of gas-hydrate existence in shallow permafrost (up to a depth of 150 m), above the modern gas-hydrate-stability zone [16,30,31]. These relic gas hydrates were formed in past periods, when favorable thermobaric conditions arose at these depths. Consequently, within negative temperatures, they were able to stay in the preserve form (in a metastable state), due to the geological manifestation of the self-preservation effect of intrapermafrost-gas hydrates. These relic gas-hydrate formations are sensitive to changes in the thermobaric and geochemical conditions [32].
The dissociation of gas hydrates may have other triggers besides the pressure and temperature changes. Their destabilization may result from reactions with chemical agents that inhibit hydrate formation: salts, acids, and organic or inorganic compounds [33,34,35,36,37,38,39,40], including electrolytes (e.g., a NaCl solution). The effect of dissolved salts on the pressure and temperature conditions of hydrate stability has been largely studied. The results include data on thermodynamic equilibrium of methane hydrate affected by salts in a free volume [34,36,41,42,43,44], inhibition of hydrate formation by injected brines at positive temperatures, etc. [37,45,46,47,48,49,50,51]. Hydrates reacting with chloride salts at t > 0 °C dissociate due to the interaction between the water molecules in the clathrate structure and the salt ions in the solutions [34,46,47]. The ionized, dissolved salts react with water molecules and develop Coulomb bonds that are stronger than hydrogen or Van der Waals bonds in the hydrate lattice. As a result, the salt ions destroy the originally stable clathrate structure and induce methane release.
However, the behavior of salt ions in the pore space of hydrate- and ice-bearing sediments remains poorly investigated, especially the thermal effects associated with salt migration and related hydrate–salt interactions. Pore-gas hydrates in permafrost, including the subsea permafrost of the Arctic shelf, can lose stability upon reactions with salt ions migrating from seawater [52] or from cryopeg brines, which can penetrate into permafrost as a result of natural or human-caused (drilling, disposal of technical waters, etc.) processes.
Although the interaction of saline solutions with frozen hydrate-bearing sediments has been rather poorly studied, some inferences can be made from the available evidence on such interaction with pore ice, which is similar to gas hydrates in many aspects. Ice melts when interacting with a saline solution, until the salt reaches an equilibrium concentration corresponding to the freezing point of the solution. The molten ice dilutes the solution, and the latter cools down until the equilibrium concentration [53,54,55], while salt ions migrate into the sediments and into ice along the boundaries of ice crystals [56]. The amount of unfrozen pore water increases progressively, and the thawing front propagates along the salt-migration paths [57,58,59]. In the same way, dissolved salts can accumulate in permafrost that presumably contains pore-gas hydrates [56].
The phase changes in pore moisture of frozen hydrate-bearing rocks interacting with saline solutions differ from those in hydrate-free rocks, as hydrate dissociation consumes 1.5 times more heat than the ice–water transition: 5.99 kJ/mol against 18.13 kJ/mol, respectively [18,60]. Correspondingly, salt transport causes different thermal effects in hydrate-bearing and hydrate-free frozen sediments.
Accounting for thermal processes during salt transfer in frozen hydrate-containing formations opens up new opportunities for understanding the nature and detection of salt ions, in the complex system of natural sediments containing ice and gas components. These components are very sensitive to temperature and pressure transducers as well as to the transformation of geochemical conditions (especially under the influence of salt).
The dynamics of changes in the thermal field in the process of salt transfer make it possible to trace the kinetics of salt accumulation and dissociation of pore-gas hydrate. In addition, the analysis of temperature changes in the process of salt transfer makes it possible to evaluate the intensity of dissociation of porous-gas hydrate, along with secondary ice formation due to the freezing of the supercooled water formed during the hydrate decomposition. That is why it is important to study experimentally the temperature patterns in frozen hydrate-saturated rocks associated with salt transport at negative temperatures and atmospheric pressure.
In this paper, on the basis of experimental modeling, thermal processes are analyzed that occur in frozen rocks containing porous-gas hydrate under metastability conditions, i.e., at a pressure below equilibrium, when they interact with salt solutions. Similar processes can take place in the upper horizons of permafrost containing relict gas hydrates, where, during the evolution of permafrost and technogenic impacts, the interaction of intrapermafrost-gas hydrates and salt solutions of various origins is possible.

2. Methods

Temperature changes in frozen hydrate-saturated sediments interacting with a NaCl solution were investigated in experiments at a constant negative temperature. The experiments were performed with samples, which were saturated with hydrate in laboratory and exposed to contact with a frozen NaCl solution. The experimental procedure included several steps:
  • Sand samples were saturated with water until the specified moisture content and placed in a pressure cell for saturation with methane hydrate under vacuum.
  • The hydrate-saturated samples in the pressure cell were frozen and brought to a metastable state by reducing the pressure to 0.1 MPa.
  • The frozen hydrate-saturated samples were taken out of the pressure cell and measured for water contents, density, and fraction of water converted to hydrate (hydrate coefficient Khin, u.f.).
  • Temperature sensors were mounted along the samples at different distances to their bottom end (2.5, 3.5, 6.0, and 7.0 cm).
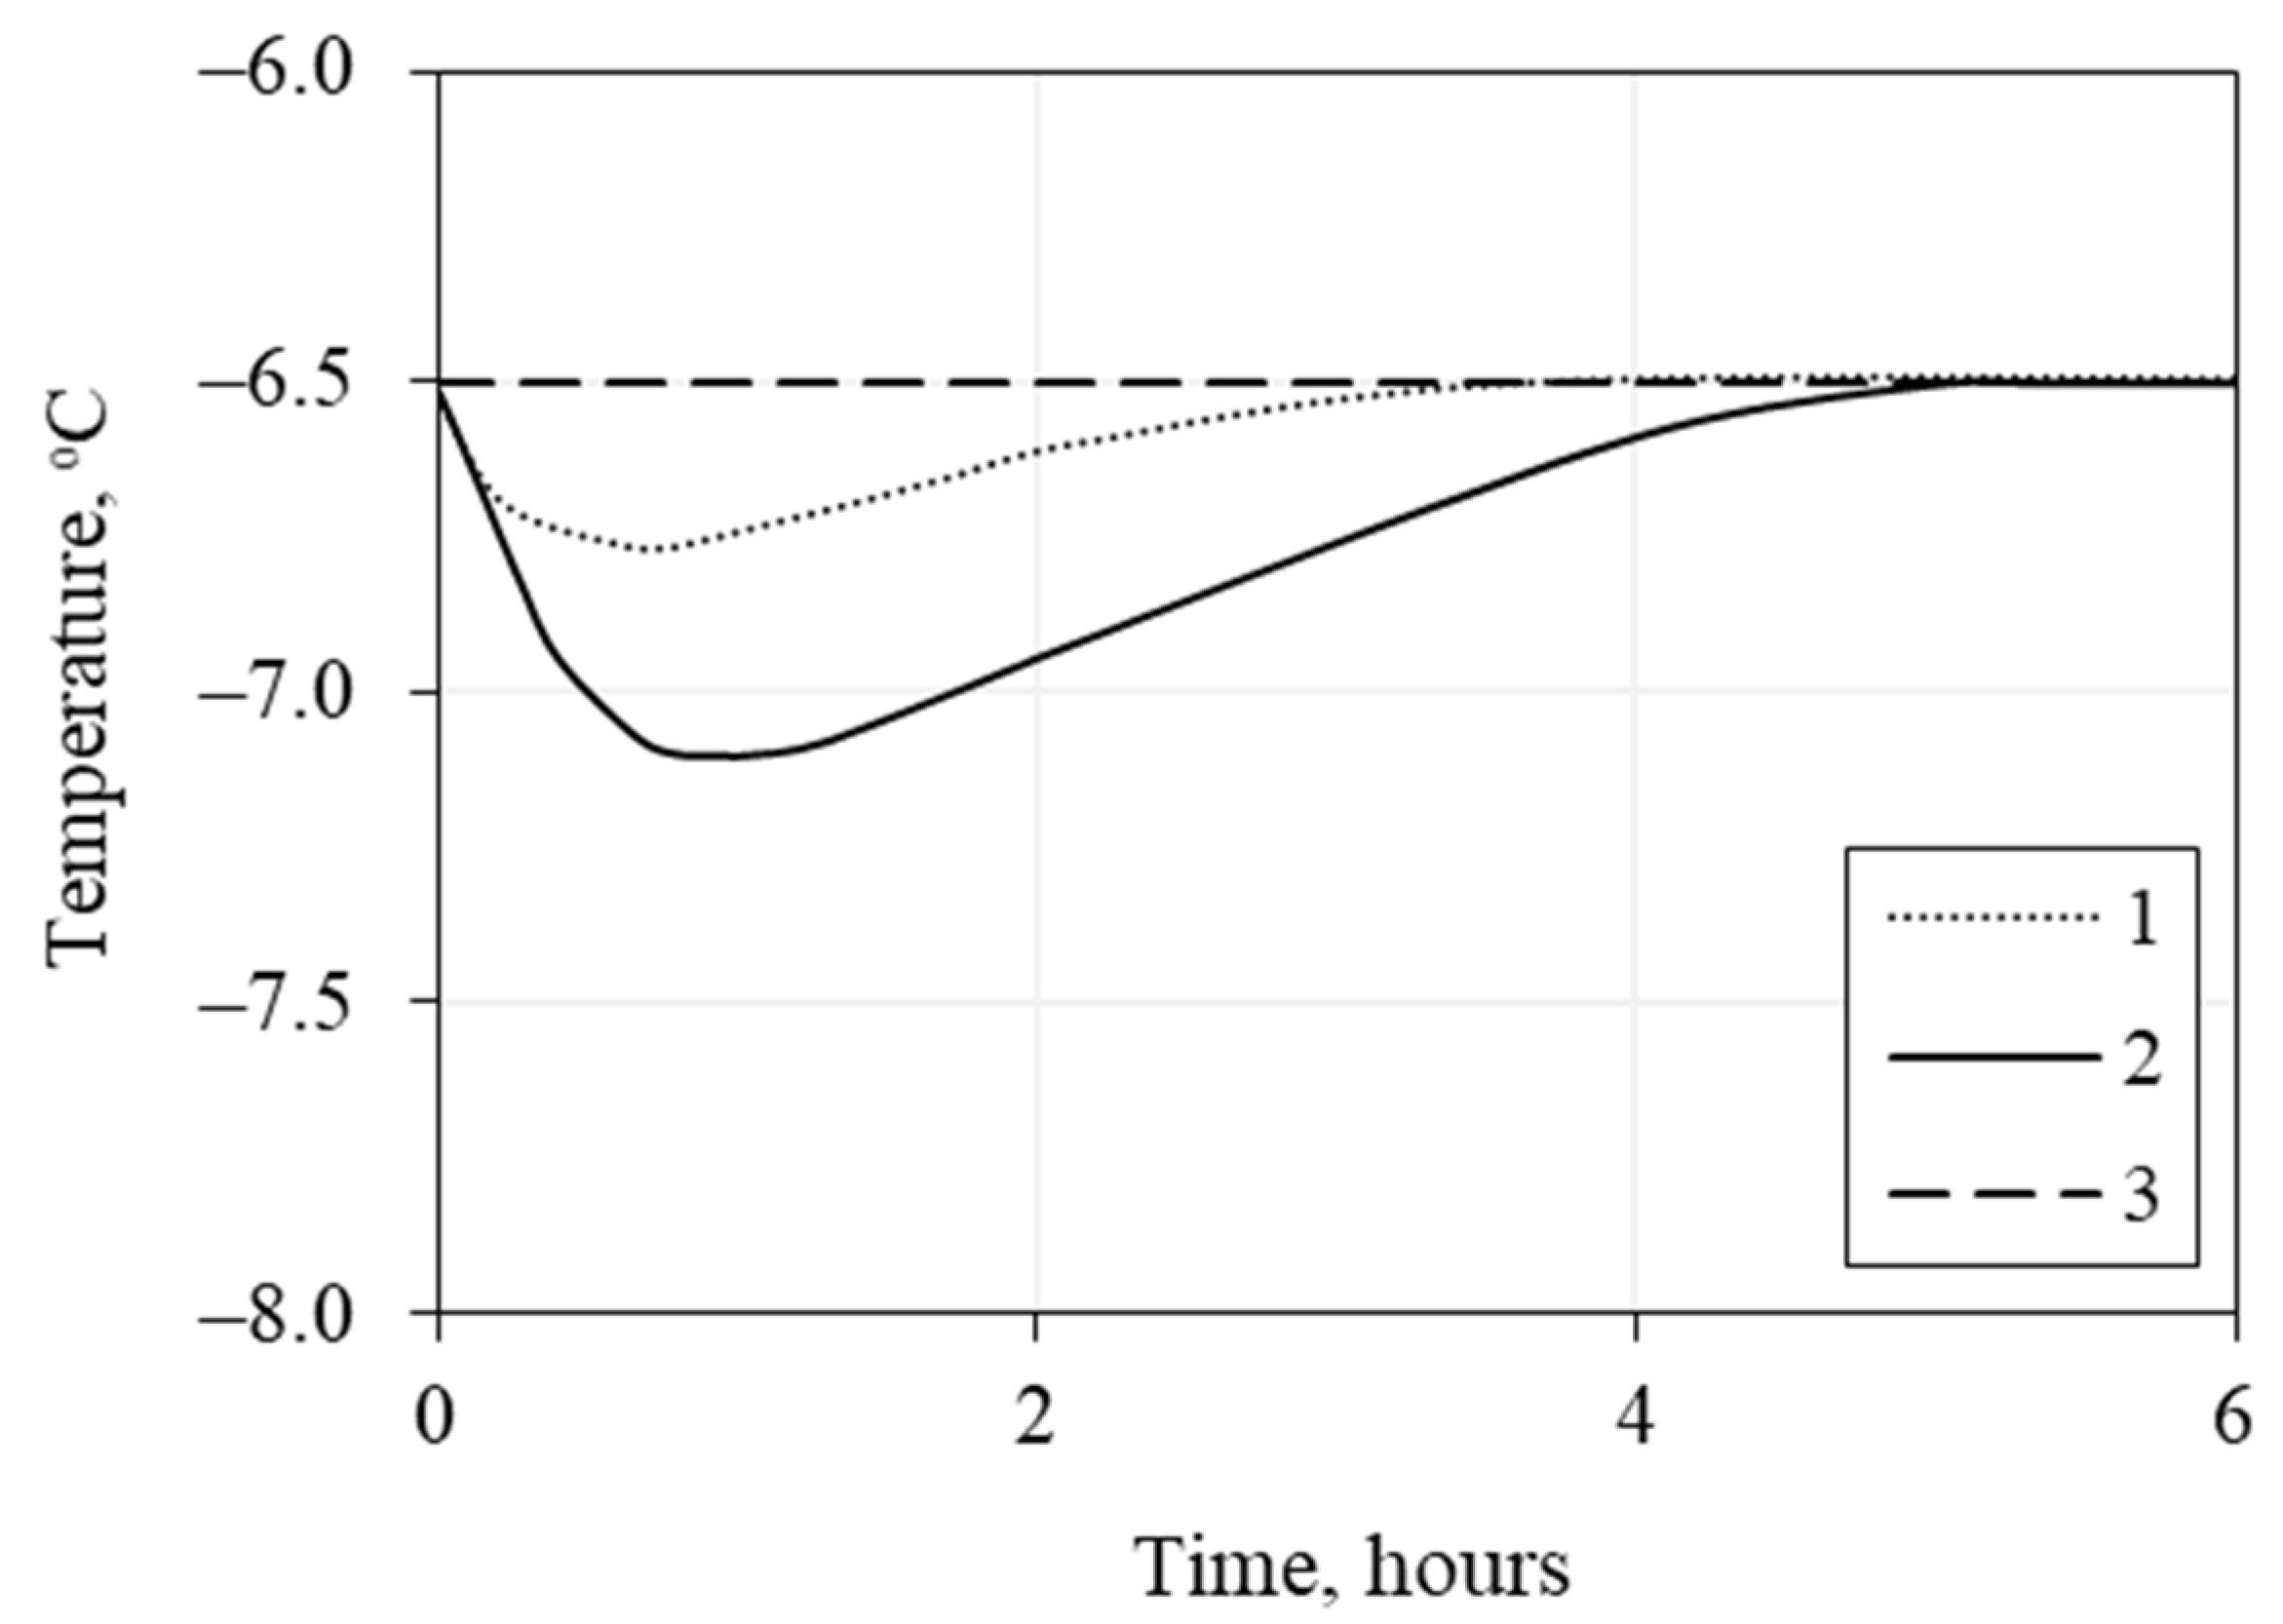
  • The samples were juxtaposed against a frozen NaCl solution (saline ice) at a constant negative temperature (−6.5 ± 0.1 °C) and under atmospheric pressure (0.1 MPa), in a tight thermally insulated box. The interaction process was monitored continuously, with temperature sampling.
The sand samples were mainly (about 80%) composed of 0.25–0.1 mm quartz particles (Table 1) and had natural salinity within 0.1% (Table 2); the active surface area was ~0.6 g/m2.
The frozen cylindrical samples (~5 cm in diameter and 9 cm high) initially containing 11–12% of water were saturated in the vacuumed tight-pressure cell, by filling it with cold hydrate-forming gas (99.98% CH4) until the hydrate formation pressure >3 MPa, under specially created conditions providing uniform saturation of the pore space [52]. Additionally, two twin samples with similar moisture contents, density, and hydrate saturation were prepared in the same way and were used for comparison. Saturation of the samples in the pressure cell began at −5 °C to −6 °C; gas hydrates formed immediately on the surface of porous ice, impeded migration of pore moisture, and became distributed uniformly over the samples. The saturation process was accelerated using cyclic temperature fluctuations from −5 °C or −6 °C to +3 °C. It lasted at least two weeks, and then the samples were frozen to −6.5 ± 0.1 °C. The residual pore moisture that had not converted to hydrate froze up. Thus, obtained samples had hydrate saturation of at least 60%.
Then the pressure in the cell was reduced to 0.1 MPa, while the temperature was maintained at −6.5 °C, and the frozen hydrate-saturated samples became metastable. They underwent partial dissociation and kept residual hydrate saturation of 30% for quite a long time, due to the self-preservation effect. The initial parameters measured in the samples before they were exposed to interaction with the NaCl solution were: within 11–12% water content; 35% to 40% porosity; 1.80 g/cm3 density; and hydrate coefficient 0.4–0.6 Khin. The frozen hydrate-bearing sand had a massive ice–hydrate texture and the properties distributed uniformly along the samples.
Initial gas contents were estimated by measuring the volume of gas released (with 2–3 times repeatability) as the samples were thawing in the saturated NaCl solution. The obtained values were used to estimate hydrate content and hydrate coefficient, assuming a hydrate number of 5.9 for methane hydrate [52].
Specific gas content (G, cm3/g) was found as:
G = ( V 2 V 1 ) · T m s ,
where ( V 2 V 1 ) —change in the volume of liquid in the gas collector tube (cm3); T—temperature correction; m s —the mass of the soil sample (g).
The weight gas-hydrate content (H, wt. % of sample weight) was determinate for each interval as:
H = m g · 7.64 · 100 % ,
where m g is a specific gravity of methane in gas-hydrate form (g/g i.e., grams of gas in per gram of sediment) calculated from the specific gas content ( G ) for pure methane.
The fraction of water converted to hydrate or the hydrate coefficient (Kh, u.f.) is given by
K h = W h W ,
where W h is the percentage of water in the hydrate form (wt.% of sample weight) and W is the total amount of water (wt.%).
Temperature variations in the frozen hydrate-saturated sand interacting with the NaCl solutions at 0.1 MPa and −6.5 °C were recorded on a “Kriolab Tbf” system designed at the KrioLab Company and equipped with built-in software (Figure 1). The system consists of a cooling chamber for maintaining negative temperatures, eight thermistors (d = 2.5 mm), and an electronic recording unit that samples temperature at specified time intervals (every 30 s in this study). The temperature sensors were calibrated to a precision of ±0.01 °C against a special reference sensor, in a thermostat. The temperature in the cooling chamber was maintained at −6.5 °C for the whole run (Figure 1).
The temperature sensors were placed in four holes (2.5 mm in diameter) spaced at ~1.5 cm, which were drilled to a depth of 3 cm toward the center of the frozen hydrate-saturated samples with measured initial variables. Then, the samples were exposed to contact with a NaCl solution of different concentrations (0.1 to 1.0 N), at 0.1 MPa and a constant temperature of −6.5 °C. Simultaneously, hydrate-free samples interacted with a similar NaCl solution under the same pressure and temperature conditions.
The temperature was monitored since the onset of experimental runs, which lasted 5–9 h on average, until the thermal stabilization in the samples.

3. Experimental Results

The experiments confirmed active Na+ diffusion into frozen hydrate-saturated samples interacting with a frozen NaCl solution, which led to dissociation of pore-methane hydrate [52]. The diffusion process showed up as time-dependent variations in the Na+ contents (A) and hydrate coefficient (B), based off the sample–solution interface under atmospheric pressure (0.1 MPa) and a constant negative temperature (−6 °C), for ~4 h to ~29 h of interaction with a 0.1 N NaCl solution (Figure 2). In four hours, salt ions (Na+) penetrated into the samples to a depth of 2.3 cm while hydrate dissociated at a distance of 1 cm to the contact; the respective distances attained for twenty-nine hours of interaction were 5 cm and 4 cm. Thus, the salinity front propagated in frozen hydrate-bearing sand interacting with the NaCl solution and produced the hydrate-dissociation front at some critical salt concentrations in the samples.
The salinity increases in the hydrate-bearing and hydrate-free frozen samples interacting with the NaCl solution were accompanied by their cooling, because hydrate dissociation and ice melting are both heat-consuming processes. In these conditions, the hydrate-bearing samples can be expected to cool down more strongly than the hydrate-free ones, as the enthalpy of hydrate dissociation is 1.5 times higher than that of ice melting. Indeed, the experiments showed this difference (Figure 3) at 2.5 cm to the sample–solution interface (0.4 N NaCl solution). The samples had initial moisture contents of 12% and a porosity of 38–40%. The hydrate-free sample contained 50% of pore ice, and the hydrate saturation of the other sample reached 35 %, at a total saturation of 53% (Table 3).
The samples cooled down almost immediately after the onset of interaction with the NaCl solution, but the temperature reached its minimum at 2.5 cm to the contact in 0.7 h for the hydrate-free sample and in 1 h for the hydrate-bearing one. The hydrate-bearing and hydrate-free samples became 0.6 °C and 0.2 °C colder, respectively. The respective cooling rates were 0.6 °C/h and 0.4 °C/h.
After cooling, the samples warmed up gradually to the initial temperature (−6.5 °C), which took 5 and 3.7 h for the hydrate-bearing and hydrate-free samples, respectively.
The temperature distribution along the frozen samples with and without pore methane hydrates departed from the initial −6.5 °C value after 0.6 h of interaction with a 0.4 N NaCl solution (Figure 4), more strongly in the case of the hydrate-saturated sample.
The cooling trend from −6.5 °C was also observed in the case of a more concentrated (1.0 N) NaCl solution (Figure 5). The hydrate-bearing sample became ~1.9 °C colder, but the time when it reached the minimum temperature (−8.3 °C) depended on the distance to the contact: after 20 min of interaction at 2.5 cm to the contact (1 sensor) and after 35 min at 7 cm. The onset of cooling likewise depended on the distance to the contact, while the cooling rate was within 0.08 to 0.1 deg/min.
Having reached the minimum value, the temperature gradually returned to −6.5 °C. After three hours of interaction, the temperature distribution was almost uniform, though warming continued.
After the onset of interaction with the 1.0 N NaCl solution, the hydrate-bearing sample was cooling down (Figure 6) relative to the initial constant temperature of −6.5 °C.
The cooling began already after 1 min of interaction: Δt = 1 °C at 2.5 cm to the sample–solution interface, though no cooling was yet evident at 3.5 cm to the contact. The cooling spread to 5.5 cm in 4 min and covered the whole sample in 8 min. After 8 min of interaction, Δt reached 1.8 °C at 2.5 cm to the contact, and the temperature gradient over the sample length was 0.4 deg/cm. Later on, the temperature equilibrated due to stabilization near the contact with the NaCl solution and the cooling away from it. As a result, the temperature distribution over the distance 2.5 to 7 cm to the contact became quasi-linear after 30 min of interaction and ranged from −8.2 to −8.4 °C. Then, the sample began to warm up slightly, especially near the contact: after 1 h of interaction, the temperature became 0.3 °C higher than the minimum value at 2.5 cm to the contact but did not change yet at 7 cm (Figure 6).
Thus, the interaction of hydrate-bearing frozen sand with a cold NaCl solution produced a cold wave, due to the hydrate dissociation caused by the salt migration, which led to a 1.8 °C temperature decrease over the sample. As the dissociation process stopped, the sample warmed up gradually from its contact with the solution. The dependence of the cooling rate on the salt concentration was investigated by using NaCl solution concentrations of 0.2, 0.4, 0.6, and 1.0 N; the samples had hydrate and ice saturations of 35% to 41% and 11% to 18%, respectively (Table 4).
The patterns for the solutions of the different concentrations revealed temperature sensitivity to salinity (Figure 7). As the salt concentration increased from 0.1 to 1.0 N (Figure 7), cooling at 2.5 cm to the sample-solution contact became stronger (Δt from 0.3 °C to 1.9 °C) and faster (the sample reached the temperature minimum in 15 min instead of 1 h). The reason is that more concentrated solutions can cause more rapid dissociation of pore-gas hydrates. The temperature change Δt showed salinity dependence (Figure 8): the sample interacting with a 0.1 N NaCl solution became only 0.1 °C colder, but the cooling reached 2.0 °C in the case of a 1.0 N solution, i.e., Δt became 20 times greater as the salt concentration increased from 0.1 to 1.0 N.
Note that the cooling rate (Vt, °C/h) likewise increased considerably with the salinity increase (Figure 9): from 0.4 °C/h for 0.1 N to 4.7 °C/h for 1.0 N, which is an increase of more than 10 times.
The NaCl concentration of the solution also controls the time required for the temperature recovery of the sample (Figure 10). The frozen hydrate-saturated sample returned to its initial temperature (−6.5 °C) in 5 h of interaction with a 0.2 N solution and in 12 h in the case of 1 N.
Thus, the experiments have revealed temperature variations controlled by dissociation of pore-gas hydrates and pore ice melting in frozen-sand samples interacting with a NaCl solution. The cooling of the samples due to hydrate dissociation considerably exceeds the effect from ice melting, while the cooling rate is sensitive to the salt concentration.

4. Discussion

The experimental results show that the interaction of hydrate-bearing and hydrate-free frozen sediments with saline solutions at a constant negative temperature of −6.5 °C induces salt transport to the samples, mainly along the films of unfrozen water that coat the soil particles, as well as along the boundaries of the ice and hydrate crystals. Other migration paths may include structure defects and heterogeneities in ice and gas hydrates. Salts migrating from seawater or brines accumulate in the pore space, together with ice and hydrates, and cause phase transitions in the pore moisture (ice–hydrate–liquid water): heat-consuming reactions of ice melting and hydrate dissociation occur, which leads to the cooling of the sediments. The cooling is especially prominent in the presence of pore-gas hydrates because the enthalpy of hydrate dissociation is 1.5 times greater than that of ice melting.
The increasing amount of salt ions in the films of unfrozen water interferes with the phase equilibrium of permafrost and induces melting of the pore ice, along with the ensuing cooling. Further salinity increases lead to progressive ice melting and further cooling, which continues until equilibration occurs between the rock temperature, pore-water salinity, and ice saturation. The equilibrium temperature, which occurs at a certain NaCl concentration (Figure 11), actually corresponds to the freezing point of the respective solution. Thus, the maximum cooling corresponds to the equilibrium temperature attained during the interaction of the pore ice with a NaCl solution of a certain concentration.
The cooling front follows the propagating salinity front associated with salt transport (Figure 5). The samples reach the maximum cooling at the highest rates of ice melting and hydrate dissociation and begin to warm up, until the ambient values when both melting and dissociation processes decay, or when the pore ice converts to liquid water while the gas-hydrate inclusions decompose completely. The warming of the hydrate-bearing samples takes more time than for the hydrate-free ones, because hydrate dissociation causes stronger cooling and produces additional ice.
Temperature variations associated with salt transport in hydrate-saturated frozen sediments can be illustrated in a model (Figure 12). Before interacting with the NaCl solution, the samples have a uniform thermal field at a constant negative temperature corresponding to ambient temperature (Figure 12a). After the onset of the interaction at isothermal conditions, the samples cool down near the contact as a result of heat-consuming ice melting and hydrate dissociation induced by the migration and accumulation of Na+ (Figure 12b). Progressive Na+ accumulation accelerates the dissociation of the pore-gas hydrates and leads to further cooling (Figure 12c). Then, the cooling process decays near the contact but shifts deeper into the sample, together with the salinity front (Figure 12d). Pore-gas hydrates can dissociate partly or completely, depending on the Na+ contents in the sample controlled by the concentration of the NaCl solution. If the dissociation is complete, the respective front appears together with the salinity front, as well as with the thaw front, especially with high Na+ contents.
The propagation of cooling away from the contact induced by salt transport is followed by the gradual warming of the samples because of the ambient temperature, while the phase transitions decay, i.e., the pore ice and the NaCl solution attain a new thermodynamic equilibrium (Figure 12e).
The changes caused by salt transport to frozen samples containing metastable pore-gas hydrates can be presented in a more detailed model (Figure 13). At some point, after the onset of the interaction with the NaCl solution and the related Na+ migration and accumulation, the samples develop a cooling zone produced by the dissociation of gas hydrates and the melting of ice in the pore space. In the hydrate-saturated samples, the initial (ambient) temperature and the initial contents of the pore ice and hydrates persist far from the contact, where dissolved salts have not penetrated yet. In these conditions, pore hydrates exist in the preserved state, and no phase transitions occur (Figure 13a).
The hydrate-dissociation front reaches the coldest middle part of the sample, where it causes local cooling (Figure 13b). Hydrate saturation in this zone is much lower than elsewhere due to dissociation, while the liquid water released by the dissociation reaction dilutes the NaCl solution. As a result, the liquid pore water freezes up, increasing the ice content to above the initial value, despite the higher contents of Na+ and the unfrozen water (Figure 13c). Thus, the sample warms up to the initial temperature near the contact with the NaCl solution, due to both heat release upon the water freezing and temperature equilibration because of the ambience. Furthermore, Na+ accumulation near the contact with the NaCl solution may decrease the ice saturation and, hence, increase, the amount of unfrozen water.
Thus, the cooling records the process of pore-hydrate dissociation, and the temperature minimum corresponds to the point when it begins to decay. Then, the temperature in the cooling zone of the sample increases until reaching the thermal equilibrium because of the ambience, at the account of the heat transfer, as well as due to the heat released upon the freezing of water that was produced from the gas hydrates by the dissociation reaction.
The thermal effect of salt migration on the hydrate-bearing permafrost is inferred to be sensitive to temperature, pressure, and salinity, which control the processes of salt transport and hydrate dissociation. Namely, the two processes occur faster at higher salt concentrations. Correspondingly, active hydrate dissociation accelerates cooling and extends the time required for the rock to return to the ambient temperature.
The experimental results open a new perspective on hydrate dissociation in permafrost, for the conditions of salt transport and the formation of temperature anomalies that affect phase changes in the pore moisture. In this respect, the injection of saline brines for disposal in the permafrost, as reported from West Yakutia [62], may be responsible for gas shows and anomalously low temperatures in the respective depth intervals, where implicit evidence indicates the possible presence of gas hydrates.

5. Conclusions

The reported experiments show that the interaction of frozen hydrate-saturated sediments with a NaCl solution leads to salt migration and Na+ increase in the pore space, as well as to phase transitions of the pore moisture and dissociation of gas hydrates, with related cooling.
The notable cooling associated with the migration and accumulation of dissolved salts in hydrate-bearing sediments first appears near the sample–solution interface and then propagates off the contact and causes pore-moisture-phase transitions. The cooling effect in hydrate-bearing sediments is stronger (in the case of a 0.4 N NaCl solution—by a factor two times stronger) than that in hydrate-free soils, because the enthalpy of hydrate dissociation is much greater than that of ice melting. Correspondingly, the hydrate-bearing sediments show higher cooling rates and require more time to recover the initial temperature, despite the crystallization of the pore water released during the dissociation reaction.
The cooling effect is more powerful at higher salt concentrations, which increases the hydrate-dissociation rate. At the same time, both the cooling rate and the temperature recovery time increase.
The experimental data were used to develop a conceptual model of the phase transitions of the pore moisture and temperature variations in frozen fine sand that contains metastable gas hydrates interacting with a NaCl solution.

Author Contributions

E.C.: conceptualization, experimental methodology, and supervision; V.E., E.K., and V.S.: experimental work; E.C., V.E., and D.D.: processing and analysis; E.C., V.E., D.D., and B.B.: manuscript writing and editing. All authors have read and agreed to the published version of the manuscript.

Funding

The research was supported by the Russian Science Foundation (Grant Nos. 22-17-00112, 21-77-10074).

Data Availability Statement

Not applicable.

Conflicts of Interest

The authors declare no conflict of interest.

References

  1. Sloan, E.D., Jr.; Koh, C.A. Clathrate Hydrates of Natural Gases; CRC Press: Boca Raton, FL, USA, 2007; p. 752. ISBN 9780429129148. [Google Scholar] [CrossRef]
  2. Max, M. Natural Gas Hydrate in Oceanic and Permafrost Environments; Kluwer Academic Publishers: Washington, DC, USA, 2000; p. 419. ISBN 978-1-4020-1362-1. [Google Scholar] [CrossRef]
  3. Solov’yev, V.A.; Ginsburg, G.D. Formation of Submarine Gas Hydrates. Bull. Geol. Soc. Den. 1994, 41, 86–94. [Google Scholar] [CrossRef]
  4. Collett, T.; Bahk, J.-J.; Baker, R.; Boswell, R.; Divins, D.; Frye, M.; Goldberg, D.; Husebø, J.; Koh, C.; Malone, M.; et al. Methane Hydrates in Nature—Current Knowledge and Challenges. J. Chem. Eng. Data 2015, 60, 319–329. [Google Scholar] [CrossRef]
  5. Waite, W.F.; Ruppel, C.D.; Boze, L.-G.; Lorenson, T.D.; Buczkowski, B.J.; McMullen, K.Y.; Kvenvolden, K.A. Preliminary Global Database of Known and Inferred Gas Hydrate Locations; U.S. Geological Survey, Coastal and Marine Hazards and Resources Program: Woods Hole, MA, USA, 2020. [CrossRef]
  6. Ruppel, C.D. Gas Hydrate in Nature; US Geological Survey: Reston, VA, USA, 2018; p. 4. ISBN 2327-6916. [CrossRef]
  7. Ruppel, C. Permafrost-Associated Gas Hydrate: Is It Really Approximately 1% of the Global System? J. Chem. Eng. Data 2015, 60, 429–436. [Google Scholar] [CrossRef]
  8. Boswell, R.; Collett, T.S. Current Perspectives on Gas Hydrate Resources. Energy Environ. Sci. 2011, 4, 1206–1215. [Google Scholar] [CrossRef]
  9. Boswell, R.; Hancock, S.; Yamamoto, K.; Collett, T.; Pratap, M.; Lee, S.-R. Natural Gas Hydrates: Status of Potential as an Energy Resource. In Future Energy; Elsevier: Amsterdam, The Netherlands, 2020; pp. 111–131. [Google Scholar] [CrossRef]
  10. Yamamoto, K.; Boswell, R.; Collett, T.S.; Dallimore, S.R.; Lu, H. Review of Past Gas Production Attempts from Subsurface Gas Hydrate Deposits and Necessity of Long-Term Production Testing. Energy Fuels 2022, 36, 5047–5062. [Google Scholar] [CrossRef]
  11. Max, M.D.; Johnson, A.H.; Dillon, W.P. Natural Gas Hydrate—Arctic Ocean Deepwater Resource Potential; Springer: Cham, Switzerland; Dordrecht, The Netherlands, 2013; p. 113. ISBN 9783319025070. [Google Scholar] [CrossRef]
  12. Nimblett, J.N.; Shipp, R.C.; Strijbos, F. Gas Hydrate as a Drilling Hazard: Examples from Global Deepwater Settings. In Proceedings of the Annual Offshore Technology Conference, Houston, TX, USA, 2–5 May 2011; pp. 1429–1435. [Google Scholar] [CrossRef]
  13. Yakushev, V.S. Natural Gas and Gas Hydrates in the Permafrost; Gazprom VNIIGAZ: Moscow, Russia, 2009; p. 192. (In Russian) [Google Scholar]
  14. Yakushev, V. Natural Gas Liberations around Production Wells at Russian Arctic Gas Fields. Geosciences 2020, 10, 184. [Google Scholar] [CrossRef]
  15. Zhao, R.; Chang, H.J.; Chen, K.L. Environmental Risk of Gas Hydrates Exploitation in Tibetan Plateau Permafrost. Adv. Mater. Res. 2014, 955–959, 2114–2117. [Google Scholar] [CrossRef]
  16. Chuvilin, E.; Tipenko, G.; Bukhanov, B.; Istomin, V.; Pissarenko, D. Simulating Thermal Interaction of Gas Production Wells with Relict Gas Hydrate-Bearing Permafrost. Geosciences 2022, 12, 115. [Google Scholar] [CrossRef]
  17. Koh, C.A.; Sloan, E.D. Natural Gas Hydrates: Recent Advances and Challenges in Energy and Environmental Applications. AIChE J. 2007, 53, 1636–1643. [Google Scholar] [CrossRef]
  18. Cherskiy, N.V.; Groysman, A.G.; Nikitina, L.M.; Tserev, V.P. First Experimental Determination of Heats of Decomposition of Natural-Gas Hydrates. Dokl. Acad. Sci. USSR Earth Sci. Sect. 1984, 265, 163–167. (In Russian) [Google Scholar]
  19. Istomin, V.A.; Yakushev, V.S. Gas Hydrates in Nature; Nedra: Moscow, Russia, 1992; p. 235. (In Russian) [Google Scholar]
  20. Handa, P.Y. A Calorimetric Study of Naturally Occurring Gas Hydrates. Ind. Eng. Chem. Res. 1988, 27, 872–874. [Google Scholar] [CrossRef]
  21. Ershov, E.D.; Lebedenko, Y.P.; Chuvilin, E.M.; Istomin, V.A.; Yakushev, V.S. Features of the Existence of Gas Hydrates in the Cryolithozone. Rep. Acad. Sci. USSR 1991, 321, 788–791. (In Russian) [Google Scholar]
  22. Chuvilin, E.; Bukhanov, B.; Davletshina, D.; Grebenkin, S.; Istomin, V. Dissociation and Self-Preservation of Gas Hydrates in Permafrost. Geosciences 2018, 8, 431. [Google Scholar] [CrossRef] [Green Version]
  23. Hachikubo, A.; Takeya, S.; Chuvilin, E.; Istomin, V. Preservation Phenomena of Methane Hydrate in Pore Spaces. Phys. Chem. Chem. Phys. 2011, 13, 17449–17452. [Google Scholar] [CrossRef] [PubMed]
  24. Takeya, S.; Ebinuma, T.; Uchida, T.; Nagao, J.; Narita, H. Self-Preservation Effect and Dissociation Rates of CH4 Hydrate. J. Cryst. Growth 2002, 237, 379–382. [Google Scholar] [CrossRef]
  25. Stern, L.A.; Circone, S.; Kirby, S.H.; Durham, W.B. Anomalous Preservation of Pure Methane Hydrate at 1 Atm. J. Phys. Chem. B 2001, 105, 1756–1762. [Google Scholar] [CrossRef]
  26. Kuhs, W.F.; Genov, G.; Staykova, D.K.; Hansen, T. Ice Perfection and Onset of Anomalous Preservation of Gas Hydrates. Phys. Chem. Chem. Phys. 2004, 6, 4917–4920. [Google Scholar] [CrossRef]
  27. Istomin, V.A.; Yakushev, V.S.; Makhonina, N.A.; Kwon, V.G.; Chuvilin, E.M. Self-Preservation Phenomenon of Gas Hydrate. Gas Ind. Russ. 2006, 4, 16–27. [Google Scholar]
  28. Istomin, V.A.; Yakushev, V.S. Gas-Hydrates Self-Preservation Effect. In Physics and Chemistry of Ice; Maeno, N., Hondo, T., Eds.; Hokkaido University Press: Sapporo, Japan, 1992; pp. 136–140. [Google Scholar]
  29. Chuvilin, E.M.; Guryeva, O.M. Experimental Study of Self-Preservation Effect of Gas Hydrates in Frozen Sediments. In Proceedings of the 9th International Conference on Permafrost, Fairbanks, AK, USA, 29 June–3 July 2008; Volume 28. [Google Scholar]
  30. Chuvilin, E.M.; Yakushev, V.S.; Perlova, E.V. Gas and Possible Gas Hydrates in the Permafrost of Bovanenkovo Gas Field, Yamal Peninsula, West Siberia. Polarforschung 2000, 68, 215–219. [Google Scholar]
  31. Yakushev, V.S.; Chuvilin, E.M. Natural Gas and Gas Hydrate Accumulations within Permafrost in Russia. Cold Reg. Sci. Technol. 2000, 31, 189–197. [Google Scholar] [CrossRef]
  32. Chuvilin, E.; Davletshina, D.; Ekimova, V.; Bukhanov, B.; Shakhova, N.; Semiletov, I. Role of Warming in Destabilization of Intrapermafrost Gas Hydrates in the Arctic Shelf: Experimental Modeling. Geosciences 2019, 9, 407. [Google Scholar] [CrossRef] [Green Version]
  33. Sloan, E.D. Clathrate Hydrates of Natural Gases, Second Edition, Revised and Expanded; CRC Press: New York, NY, USA, 1998; p. 705. ISBN 9780824799373. [Google Scholar]
  34. Saw, V.K.; Das, B.B.; Ahmad, I.; Mandal, A.; Laik, S. Influence of Electrolytes on Methane Hydrate Formation and Dissociation. Energy Sources Part A Recovery Util. Environ. Eff. 2014, 36, 1659–1669. [Google Scholar] [CrossRef]
  35. Najibi, H.; Mohammadi, A.H.; Tohidi, B. Estimating the Hydrate Safety Margin in the Presence of Salt and/or Organic Inhibitor Using Freezing Point Depression Data of Aqueous Solutions. Ind. Eng. Chem. Res. 2006, 45, 4441–4446. [Google Scholar] [CrossRef]
  36. Qi, Y.; Wu, W.; Liu, Y.; Xie, Y.; Chen, X. The Influence of NaCl Ions on Hydrate Structure and Thermodynamic Equilibrium Conditions of Gas Hydrates. Fluid Phase Equilib. 2012, 325, 6–10. [Google Scholar] [CrossRef]
  37. Kamath, V.A.; Mutalik, P.N.; Sira, J.H.; Patil, S.L. Experimental Study of Brine Injection Depressurization of Gas Hydrates Dissociation of Gas Hydrates. SPE Form. Eval. 1991, 6, 477–484. [Google Scholar] [CrossRef]
  38. Masoudi, R.; Tohidi, B. On Modelling Gas Hydrate Inhibition by Salts and Organic Inhibitors. J. Pet. Sci. Eng. 2010, 74, 132–137. [Google Scholar] [CrossRef]
  39. Chong, Z.R.; Chan, A.H.M.; Babu, P.; Yang, M.; Linga, P. Effect of NaCl on Methane Hydrate Formation and Dissociation in Porous Media. J. Nat. Gas Sci. Eng. 2015, 27, 178–189. [Google Scholar] [CrossRef]
  40. Halliday, W.; Clapper, D.K.; Smalling, M. New Gas Hydrate Inhibitors for Deepwater Drilling Fluids. In Proceedings of the IADC/SPE Asia Pacific Drilling Technology Conference, APDT, Dallas, TX, USA, 3–6 March 1998; pp. 201–211. [Google Scholar] [CrossRef]
  41. Li, S.; Wang, J.; Lv, X.; Ge, K.; Jiang, Z.; Li, Y. Experimental Measurement and Thermodynamic Modeling of Methane Hydrate Phase Equilibria in the Presence of Chloride Salts. Chem. Eng. J. 2020, 395, 125126. [Google Scholar] [CrossRef]
  42. Zatsepina, O.Y.; Buffett, B.A. Thermodynamic Conditions for the Stability of Gas Hydrate in the Seafloor. J. Geophys. Res. Solid Earth 1998, 103, 24127–24139. [Google Scholar] [CrossRef]
  43. Dholabhai, P.D.; Englezos, P.; Kalogerakis, N.; Bishnoi, P.R. Equilibrium Conditions for Methane Hydrate Formation in Aqueous Mixed Electrolyte Solutions. Can. J. Chem. Eng. 1991, 69, 800–805. [Google Scholar] [CrossRef]
  44. Dickens, G.R.; Quinby-Hunt, M.S. Methane Hydrate Stability in Seawater. Geophys. Res. Lett. 1994, 21, 2115–2118. [Google Scholar] [CrossRef]
  45. Chen, J.; Liu, C.; Zhang, Z.; Wu, N.; Liu, C.; Ning, F.; Fang, B.; Wan, Y.; Bu, Q.; Hu, G. Molecular Study on the Behavior of Methane Hydrate Decomposition Induced by Ions Electrophoresis. Fuel 2022, 307, 121866. [Google Scholar] [CrossRef]
  46. Ding, T.; Wang, R.; Xu, J.; Camara, M.; Zhou, W.; Zhang, J. Dissociation Mechanism of Methane Hydrate by CaCl2: An Experimental and Molecular Dynamics Study. J. Mol. Model. 2022, 28, 109. [Google Scholar] [CrossRef] [PubMed]
  47. Li, X.-S.; Wan, L.-H.; Li, G.; Li, Q.-P.; Chen, Z.-Y.; Yan, K.-F. Experimental Investigation into the Production Behavior of Methane Hydrate in Porous Sediment with Hot Brine Stimulation. Ind. Eng. Chem. Res. 2008, 47, 9696–9702. [Google Scholar] [CrossRef]
  48. Xu, J.; Gu, T.; Sun, Z.; Li, X.; Wang, X. Molecular Dynamics Study on the Dissociation of Methane Hydrate via Inorganic Salts. Mol. Phys. 2016, 114, 34–43. [Google Scholar] [CrossRef]
  49. Ahn, T.; Park, C.; Lee, J.; Kang, J.M.; Nguyen, H.T. Experimental Characterization of Production Behaviour Accompanying the Hydrate Reformation in Methane-Hydrate-Bearing Sediments. J. Can. Pet. Technol. 2012, 51, 14–19. [Google Scholar] [CrossRef]
  50. Li, S.; Xu, X.; Zheng, R.; Chen, Y.; Hou, J. Experimental Investigation on Dissociation Driving Force of Methane Hydrate in Porous Media. Fuel 2015, 160, 117–122. [Google Scholar] [CrossRef]
  51. Chen, Z.; Feng, J.; Li, X.; Zhang, Y.; Li, B.; Lv, Q. Preparation of Warm Brine in Situ Seafloor Based on the Hydrate Process for Marine Gas Hydrate Thermal Stimulation. Ind. Eng. Chem. Res. 2014, 53, 14142–14157. [Google Scholar] [CrossRef]
  52. Chuvilin, E.; Ekimova, V.; Bukhanov, B.; Grebenkin, S.; Shakhova, N.; Semiletov, I. Role of Salt Migration in Destabilization of Intra Permafrost Hydrates in the Arctic Shelf: Experimental Modeling. Geosciences 2019, 9, 188. [Google Scholar] [CrossRef] [Green Version]
  53. Alekseev, S. Cryogenesis of Groundwater and Rocks (on the Example of the Daldino-Alakitsky Region of Western Yakutia); SRC OIGGM SO: Novosibirsk, Russia, 2000; p. 119. (In Russian) [Google Scholar]
  54. Borisov, V.; Alekseev, S. Factors of Interaction of Brines with Ice (Frozen Rock) at a Negative Temperature. In Fundamental Problems of Water and Water Resources at the Turn of the III Millennium; NTL: Tomsk, Russia, 2000; pp. 584–589. (In Russian) [Google Scholar]
  55. Volkov, N.G.; Komarov, I.A.; Mironenko, M.V.; Fotiev, S.M. Methods for Assessing the Formation Temperature of the Ion-Salt Composition of Cryopegs. Kriosf. Zemli 2005, 9, 54–61. (In Russian) [Google Scholar]
  56. Chuvilin, E.M.; Ershov, E.D.; Smirnova, O.G. Ionic Migration in Frozen Soils and Ice. In Proceedings of the 7th International Permafrost Conference, Yellowknife, NT, Canada, 23–27 June 1998; pp. 167–171. [Google Scholar]
  57. Gaidaenko, E.P. Solubility of Ice in Frozen Soils under the Influence of Saline Solutions. In Problems of engineering glaciology; Nauka: Novosibirsk, Russia, 1986; pp. 32–36. (In Russian) [Google Scholar]
  58. Pekhovich, A.I.; Shatalina, I.N. Experimental Studies of Ice Melting in Aqueous Solution. In Heat and Mass Transfer; Minsk: Nauka i Tekhnika, Belarus, 1968; Volume 2, pp. 98–104. (In Russian) [Google Scholar]
  59. Fedorov, A.M. Laboratory Studies of the Destruction of Ice and Ice-Rock Monoliths by Brines. In Conditions and Processes of Cryogenic Migration of Matter; Permafrost Institute SB AS USSR: Yakutsk, Russia, 1989; pp. 83–96. (In Russian) [Google Scholar]
  60. Yakushev, V.S.; Istomin, V.A. Causes of Gas Emissions in Frozen Rocks of the Yamburg Gas Condensate Field. In Features of Gas Well Development in Difficult Geocryological Conditions; VNIIGAZ: Moscow, Russia, 1987; pp. 119–127. (In Russian) [Google Scholar]
  61. Chuvilin, E.M.; Bukhanov, B.A.; Mukhametdinova, A.Z.; Grechishcheva, E.S.; Sokolova, N.S.; Alekseev, A.G.; Istomin, V.A. Freezing Point and Unfrozen Water Contents of Permafrost Soils: Estimation by the Water Potential Method. Cold Reg. Sci. Technol. 2022, 196, 103488. [Google Scholar] [CrossRef]
  62. Porokhniak, A.M. Gas Hydrates of the Permafrost Zone in Western Yakutia; Publishing House of TsNIITsvetmet: Moscow, Russia, 1988; p. 30. (In Russian) [Google Scholar]
Figure 1. Sketch of Kriolab Tbf system (a) and picture of the frozen hydrate saturated sand sample with temperature sensors (b). 1 = frozen hydrate-saturated sediment; 2 = solution container; 3 = NaCl solution; 4 = temperature sensors; 5 = thermistor streamer; 6 = branch box; 7 = fan; 8 = USB cable; 9 = PC with Kriolab Tbf software; 10 = cooling chamber. Modified after [61].
Geosciences 12 00261 g001
Figure 2. Changes of Na+ contents (a) and hydrate coefficient (b) in frozen hydrate-bearing sand (Khin = 0.6, W = 12%) for 3.9, 25.5, and 28.8 h of interaction with a 0.1 N NaCl solution at 0.1 MPa and −6 °C.
Geosciences 12 00261 g002
Figure 3. Time-dependent temperature variations between frozen sand and a 0.4 N NaCl solution at 0.1 MPa, at 2.5 cm to the contact. 1 = hydrate-free frozen sand (dotted line); 2 = hydrate-bearing frozen sand (solid line); 3 = initial temperature (tin) −6.5 °C (dashed line).
Geosciences 12 00261 g003
Figure 4. Time-dependent temperature variations in hydrate-free (1) and hydrate-bearing (2) sand after 0.6 h of interaction with a 0.4 N NaCl solution at 0.1 MPa. Dashed line (3) shows initial temperature (tin = −6.5 °C).
Geosciences 12 00261 g004
Figure 5. Time-dependent temperature variations in the hydrate-saturated frozen sample (Shin = 38%, Siin = 15%) at 2.5, 3.5, 5.5, and 7.0 cm from the contact with 1.0 N NaCl solution (tin = −6.5 °C, p = 0.1 MPa): (a) in the current experiment; (b) in a narrower time interval before the temperature became unique in the sample structure.
Geosciences 12 00261 g005
Figure 6. Cooling of the hydrate-saturated sand sample (Shin = 41%, Siin = 12%) for 60 min of interaction with the 1 N NaCl solution (tin = −6.5 °C, p = 0.1 MPa).
Geosciences 12 00261 g006
Figure 7. Time-dependent temperature variations in frozen hydrate-saturated sand at 2.5 cm to the contact with a NaCl solution of 0.2 to 1.0 N; tin= −6.5 °C, p = 0.1 MPa.
Geosciences 12 00261 g007
Figure 8. Maximum temperature decrease (Δt = tin − tmin) in frozen hydrate-saturated sand as a function of NaCl concentration (Csol from 0.1 to 1.0 N; tin = −6.5 °C, p = 0.1 MPa).
Geosciences 12 00261 g008
Figure 9. Cooling rate (Vt) of frozen hydrate-saturated sand as a function of NaCl concentration (Csol from 0.1 to 1.0 N; tin = −6.5 °C, p = 0.1 MPa).
Geosciences 12 00261 g009
Figure 10. Temperature recovery in frozen hydrate-saturated sand as a function of NaCl concentration (Csol from 0.1 to 1.0 N; tin = −6.5 °C, p = 0.1 MPa).
Geosciences 12 00261 g010
Figure 11. Phase diagram of NaCl solution, modified after [44].
Geosciences 12 00261 g011
Figure 12. Temperature variations associated with salt transport in hydrate-saturated frozen sediments. Detailed description in the text.
Geosciences 12 00261 g012
Figure 13. Temperature changes caused by salt migration in frozen sand containing metastable gas hydrates, accompanied by phase transitions of pore moisture and variations of ice and hydrate saturation along the sample. Detailed description in the text.
Geosciences 12 00261 g013
Table 1. Grain sizes and mineralogy of sand samples.
SampleParticle-Size Distribution, %Mineralogy 1
1–0.50.5–0.250.25–0.10.1–0.050.05–0.001<0.001
Fine sand>0.11.580.417.30.8>0.1>98% quartz
1 The listed mineral phases have percentages > 1%.
Table 2. Salinity and major-ion chemistry of solutions used in experiments.
Soil TypeAnions, mg—EQ/100 gCations, mg—EQ/100 gTDS, %
pHHCO3ClSO₄2−Ca2+Mg2+Na+ + K+
Sand7.10.0750.0250.060.025--0.1350.01
Table 3. Properties of hydrate-free (sample #1) and hydrate-saturated (sample #2) frozen sand.
SampleWater Content, %Density, g/cm3Porosity, %Ice
Saturation, %
Hydrate
Saturation, %
1121.840500
2121.85381835
Table 4. Frozen hydrate-saturated sand samples before interaction with a NaCl solution of different concentrations.
Solution
N
SampleWater
Content, %
Density, g/cm3Porosity,
%
Ice
Saturation, %
Hydrate
Saturation, %
0.21121.80401241
0.421.85381835
0.631.79391140
1.041.83381538
Publisher’s Note: MDPI stays neutral with regard to jurisdictional claims in published maps and institutional affiliations.

