
Petrographical and Geochemical Study of Syn-Rift Sediments, Pranhita-Godavari Intracratonic Gondwana Basin, India: Genesis and Paleo-Environmental Implications


Abstract
:1. Introduction
2. Geological Background
3. Methods
4. Results
4.1. Paleocurrent Directions
4.2. Petrography
4.3. Geochemistry
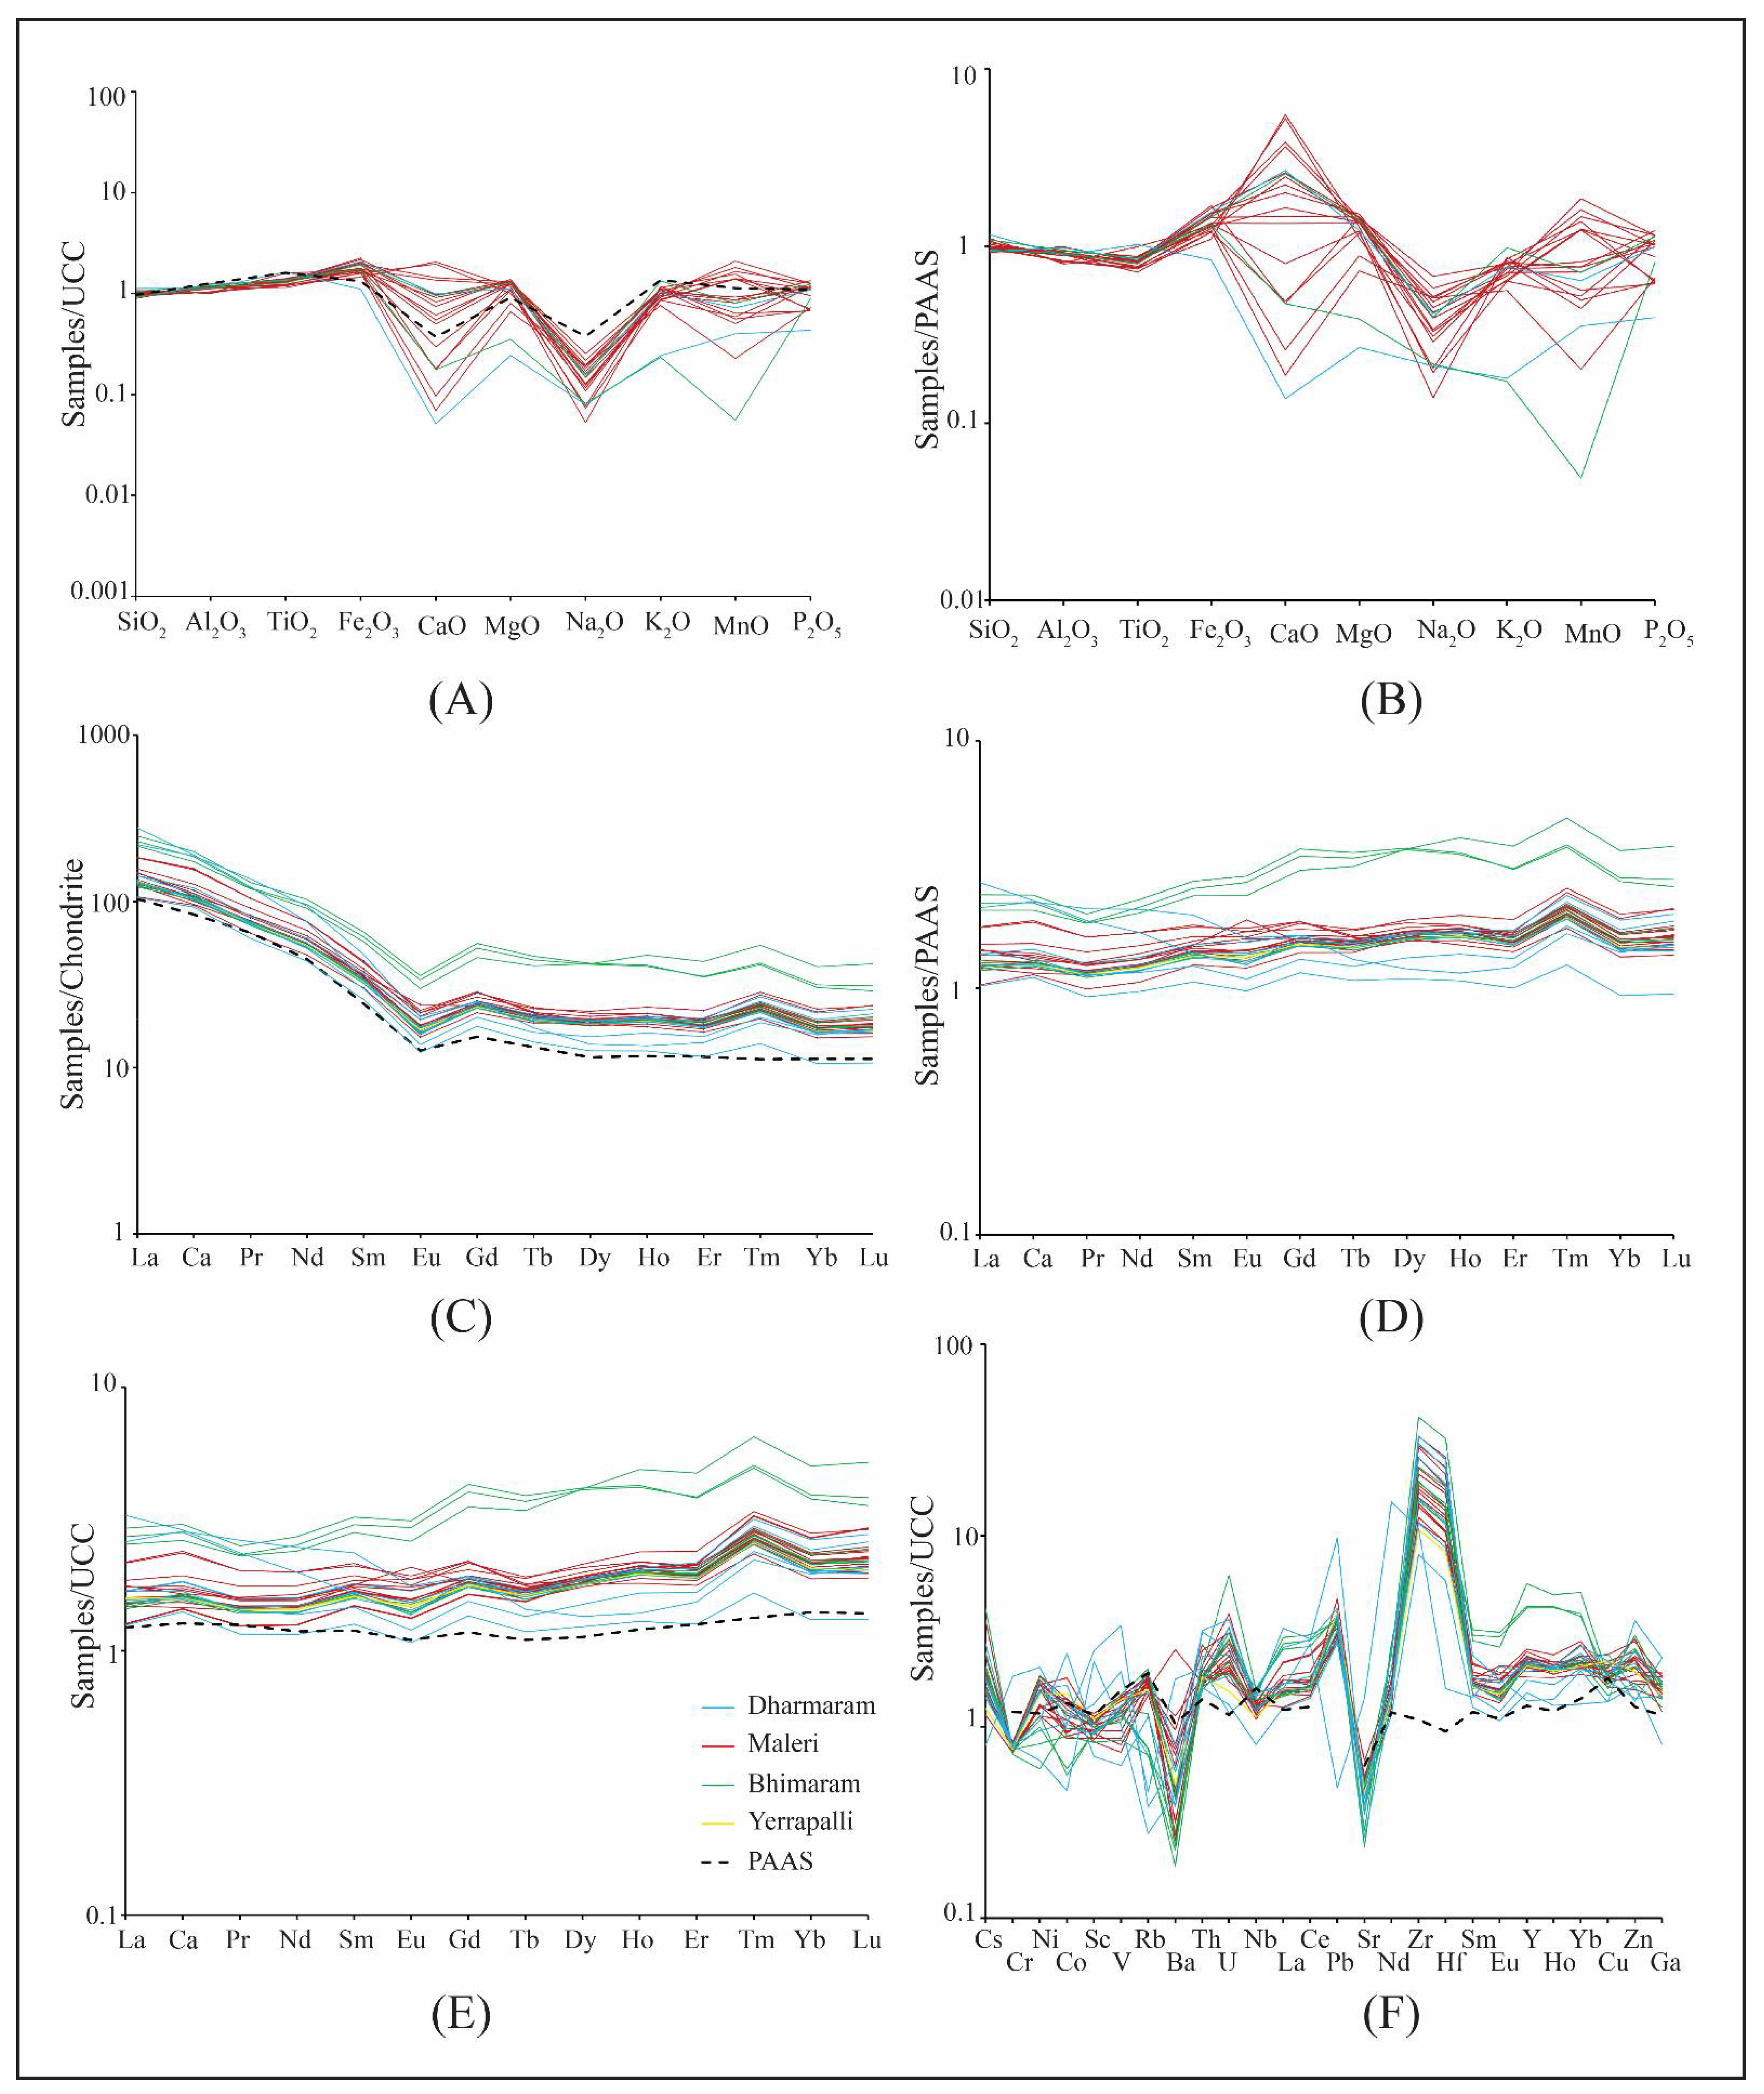
4.3.1. Major Oxides
4.3.2. Trace Elements
4.3.3. Rare Earth Elements (REE)
5. Interpretation and Discussion
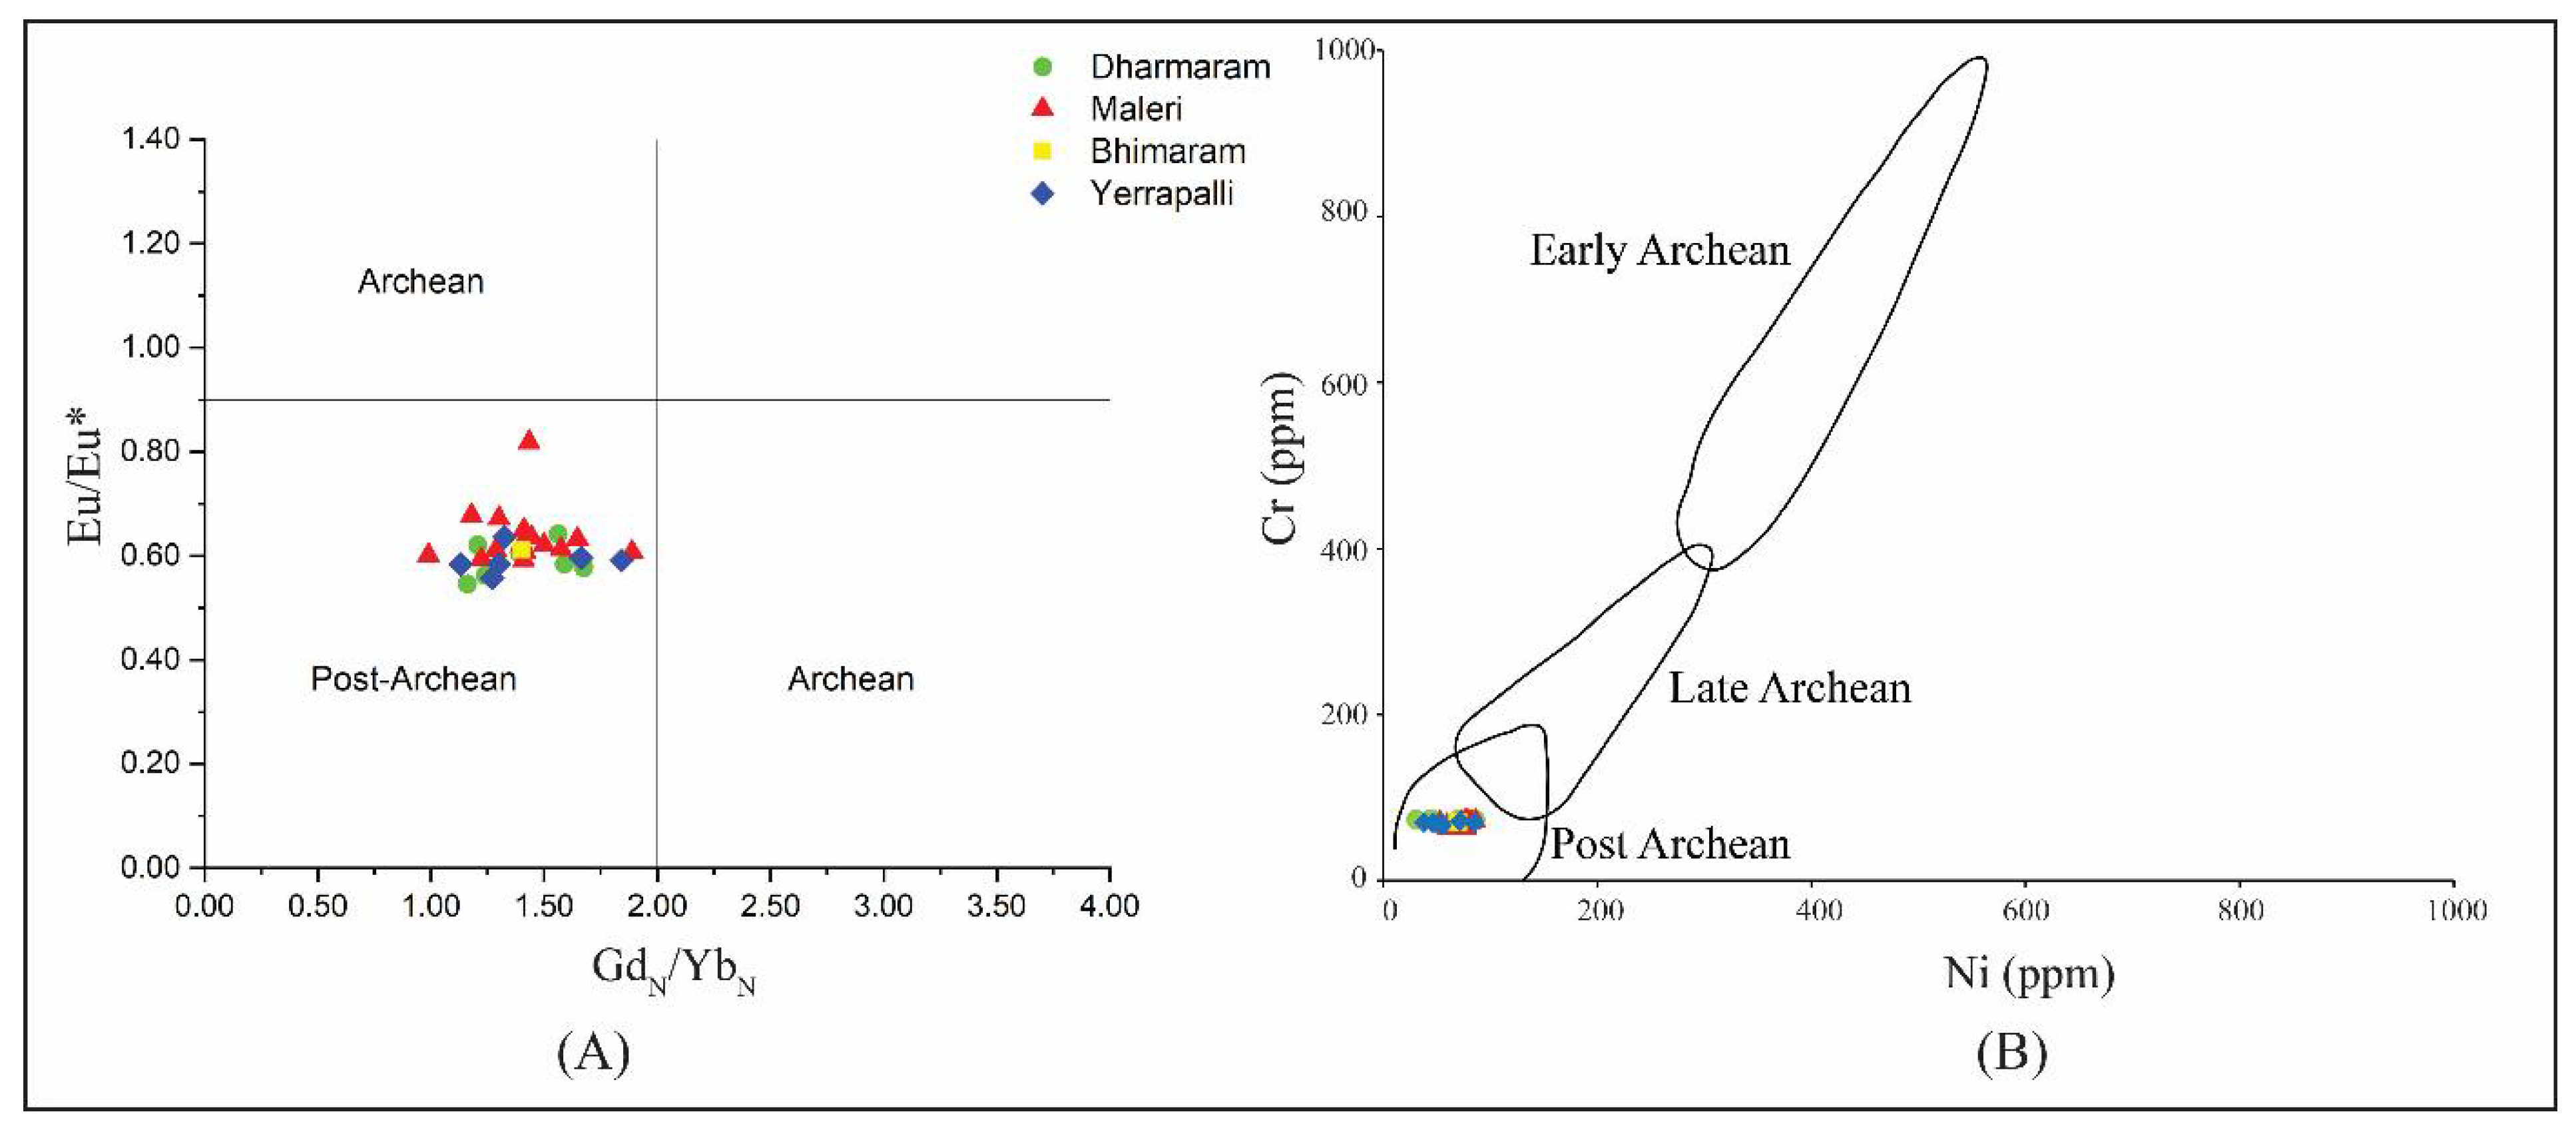
5.1. Composition of Source Rock
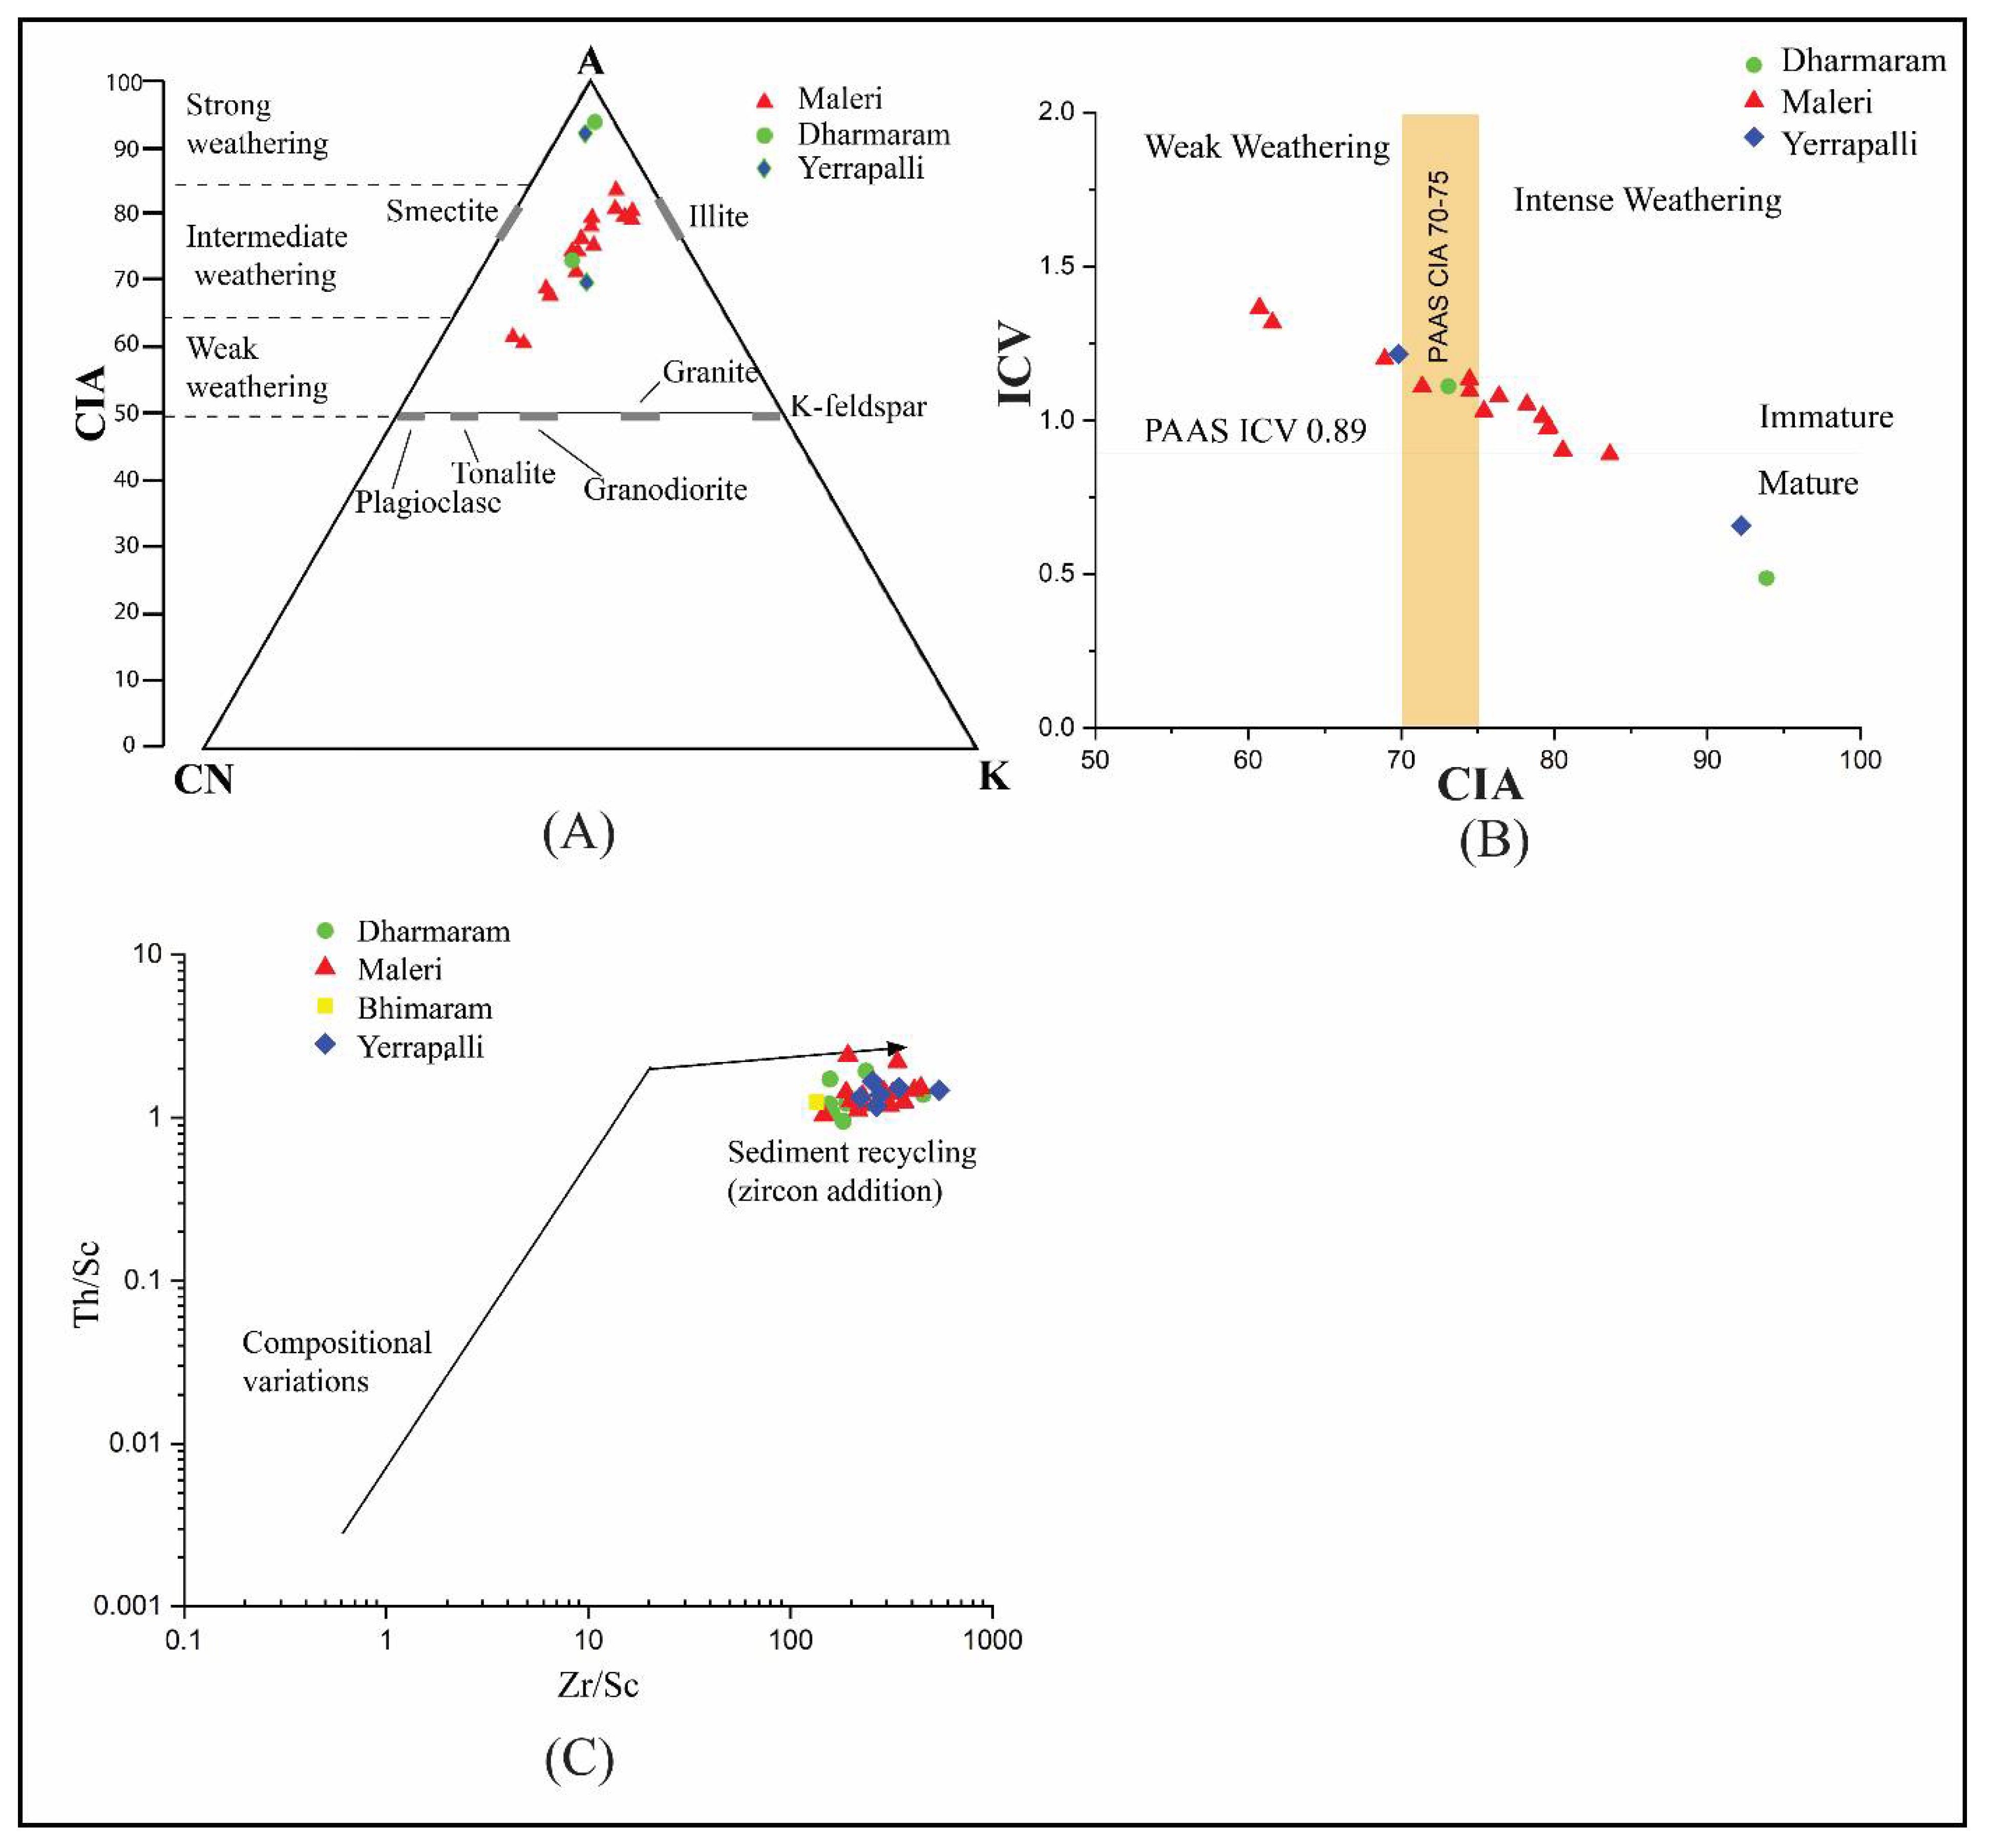
5.2. Source Area Weathering and Recycling
5.3. Tectonic Setting
5.4. Paleoenvironmental Implication
6. Conclusions
Author Contributions
Funding
Informed Consent Statement
Data Availability Statement
Acknowledgments
Conflicts of Interest
References
- Reeves, C.; Wit, M. Making ends meet in Gondwana: Retracing the transforms of the Indian Ocean and reconnecting continental Shear Zones. Terra Nova 2000, 12, 272–280. [Google Scholar] [CrossRef]
- Chatterjee, S.; Goswami, A.; Scotese, C.R. The longest voyage: Tectonic, magmatic, and paleoclimatic evolution of the Indian plate during its northward flight from Gondwana to Asia. Gondwana Res. 2013, 23, 238–267. [Google Scholar] [CrossRef]
- Dasgupta, S.; Biswas, M.; Mukherjee, S.; Chatterjee, R. Structural evolution and sediment depositional system along the transform margin- Palar–Pennar basin, Indian east coast. J. Pet. Sci. Eng. 2022, 211, 110155. [Google Scholar] [CrossRef]
- Dasgupta, S. Implication of transfer zones in rift fault propagation: Example from Cauvery basin, Indian east coast. In Tectonics and Structural Geology: Indian Context; Mukherjee, S., Ed.; Springer Geology: Cham, Switzerland, 2019. [Google Scholar] [CrossRef]
- Fox, C.S. Coal in India II: The Gondwana system and related formations. Mem. Geol. Surv. India 1931, 58, 1–241. [Google Scholar]
- Robinson, P.L. The Indian Gondwana Formations-a review. 1st International Symposium on Gondwana Stratigraphy; International Union of Geological Sciences: Paris, France, 1967; pp. 201–268. [Google Scholar]
- Venkatachala, B.S.; Maheswari, H.K. Indian Gondwana-redefined. In 7th International Gondwana Symposium, Sao Paulo, BSIPB; University of Lucknow: Lucknow, India, 1988; pp. 539–547. [Google Scholar]
- Veevers, J.J.; Tewari, R.C. Gondwana master basin of Peninsular India between Tethys and the interior of the Gondwanaland province of Pangea: Geological Society of America. Memoir 1995, 187, 72. [Google Scholar]
- Chakraborty, C.; Nibir, M.; Ghosh, K. Kinematics of the Gondwana basins of peninsular India. Tectonophysics 2003, 377, 299–324. [Google Scholar] [CrossRef]
- Sarkar, A.; Yoshioka, H.; Ebihara, M.; Naraoka, H. Geochemical and organic carbon isotope studies across the continental Permo-Triassic boundary of Raniganj Basin, eastern India. Palaeogeogr. Palaeoclimatol. Palaeoecol. 2003, 191, 1–14. [Google Scholar] [CrossRef]
- Mukhopadhyay, G.; Mukhopadhyay, S.K.; Roychowdhury, M.; Parui, P.K. Stratigraphic correlation between different Gondwana Basins of India. J. Geol. Soc. India 2010, 76, 251–266. [Google Scholar] [CrossRef]
- Ghosh, S.; Sarkar, S.; Ghosh, P. Petrography and major element geochemistry of the Permo-Triassic sandstones, central India: Implication for provenance in an intracratonic pull-apart Basin. J. Asian Earth Sci. 2012, 43, 207–240. [Google Scholar] [CrossRef]
- Dickinson, W.R. Interpreting detrital modes of graywacke and arkose. J. Sediment Pet. 1970, 40, 695–707. [Google Scholar]
- Dickinson, W.R. Interpreting provenance relations from detrital modes of sandstones. In Provenance of Arenites; Zuffa, G.G., Ed.; Reidel: Dordrecht, The Netherlands, 1985; pp. 333–361. [Google Scholar]
- Basu, A. Influence of climate and relief on composition of sands released at source areas. In Provenance of Arenites; Zuffa, G.G., Ed.; Reidel: Dordrecht, The Netherlands, 1985; pp. 1–18. [Google Scholar]
- Pettijohn, F.J.; Potter, P.E.; Siever, R. Sand and Sandstones, 2nd ed.; Springer-Verlag: New York, NY, USA, 1987; p. 553. [Google Scholar]
- Garzanti, E.; He, J.; Barbarano, M.; Resentini, A.; Li, C.; Yang, L.; Yang, S.; Wang, H. Provenance versus weathering control on sediment composition in tropical monsoonal climate (South China)—2. Sand petrology and heavy minerals. Chem. Geol. 2021, 564, 119997. [Google Scholar] [CrossRef]
- Dickinson, W.R.; Suczek, C.A. Plate tectonics and sandstone compositions. AAPG Bull. 1979, 63, 2164–2182. [Google Scholar]
- Arribas, J.; Critelli, S.; Le Pera, E.; Tortosa, A. Composition of modern stream sand derived from a mixture of sedimentary and metamorphic source rocks (Henares River, central Spain). Sediment. Geol. 2000, 133, 27–48. [Google Scholar] [CrossRef] [Green Version]
- Le Pera, E.; Arribas, J.; Critelli, S.; Tortosa, A. The effects of source rocks and chemical weathering on the petrogenesis of siliciclastic sand from the Neto River (Calabria, Italy): Implications for provenance studies. Sedimentology 2001, 48, 357–378. [Google Scholar] [CrossRef]
- Critelli, S. Provenance of Mesozoic to Cenozoic Circum-Mediterranean sandstones in relation to tectonic setting. Earth Sci. Rev. 2018, 185, 624–648. [Google Scholar] [CrossRef]
- Armstrong-Altrin, J.S.; Lee, Y.I.; Kasper Zubillaga, J.J.; Trejo Ramírez, E. Mineralogy and geochemistry of sands along the Manzanillo and El Carrizal beach areas, southern Mexico: Implications for palaeoweathering, provenance and tectonic setting. Geol. J. 2017, 52, 559–582. [Google Scholar] [CrossRef]
- Critelli, S.; Muto, F.; Perri, F.; Tripodi, V. Interpreting provenance relations from sandstone detrital modes, southern Italy Foreland Region: Stratigraphic record of the Miocene tectonic evolution. Mar. Pet. Geol. 2017, 87, 47–59. [Google Scholar] [CrossRef]
- Quinby-Hunt, M.S.; Wilde, P. The provenance of low-calcic black shales. Miner. Depos. 1991, 26, 113–121. [Google Scholar] [CrossRef]
- Ochoa, M.; Arribas, M.E.; Arribas, J.; Mas, R. Significance of geochemical signatures of provenance in intracratonic rift basins: Examples from the Iberian plate, Sedimentary provenance and petrogenesis: Perspectives from petrography and geochemistry. Geol. Soc. Am Bull Spec. Pap. 2007, 420, 99–219. [Google Scholar]
- Paikaray, S.; Banerjee, S.; Mukherji, S. Geochemistry of shales from the Paleoproterozoic to Neoproterozoic Vindhyan Supergroup: Implications on provenance, tectonics and paleoweathering. J. Asian Earth Sci. 2008, 32, 34–48. [Google Scholar] [CrossRef]
- Mondal, M.E.A.; Wani, H.; Mondal, B. Geochemical signature of provenance, tectonics and chemical weathering in the Quaternary flood plain sediments of the Hindon River, Gangetic plain, India. Tectonophysics 2012, 566, 87–94. [Google Scholar] [CrossRef]
- Garzanti, E.; Resentini, A. Provenance control on chemical indices of weathering (Taiwan river sands). Sed. Geol. 2016, 336, 81–95. [Google Scholar] [CrossRef]
- Dasgupta, S. A review of stratigraphy, depositional setting and paleoclimate of the different Mesozoic basins of India. In Mesozoic Stratigraphy of India; Springer: Cham, Switzerland, 2021; pp. 1–37. [Google Scholar]
- Suess, E. Das Satilitz der Ende; Wien: Leipzig, Vienna, 1885. [Google Scholar]
- Chaudhuri, A.K.; Deb, G.K.; Patranabis-Deb, S.; Sarkar, S. Paleogeographic and tectonic evolution of the Pranhita-Godavari valley, central India: A stratigraphic perspective. Am. J. Sci. 2012, 312, 766–815. [Google Scholar] [CrossRef]
- Biswas, S.K. Regional tectonic framework of the Pranhita-Godavari basin, India. J. Asian Earth Sci. 2003, 21, 543–555. [Google Scholar] [CrossRef]
- Dasgupta, U.; Jain, A.D. A surface geochemical survey over part of the Pranhita-Godavari basin and its impact on the hydrocarbon prospects of the basin. J. Geol. Soc. India 2007, 70, 187–193. [Google Scholar]
- Chaudhuri, A.K.; Deb, G.K.; Patranabis-Deb, S. Conflicts in stratigraphic classification of the Puranas of the Pranhita–Godavari Valley: Review recommendations and status of the ‘Penganga’ sequence. In Precambrian Basins of India: Stratigraphic and Tectonic Context; Mazumder, R., Eriksson, P.G., Eds.; Geological Society of London, Memoir: Bath, UK, 2015; Volume 43, pp. 165–183. [Google Scholar]
- Krishnan, M.S. The Geology of India and Burma; Higginbothams (Pvt.) Ltd.: Madras, India, 1968; p. 536. [Google Scholar]
- Goodwin, A.M. Precambrian Geology: The Dynamic Evolution of The Continental Crust; Academic Press: London, UK, 1991; p. 666. [Google Scholar]
- Gombos, A.M., Jr.; Powell, W.G.; Norton, I.O. The tectonic evolution of western India and its impact on hydrocarbon occurrences: An overview. Sediment. Geol. 1995, 96, 119–129. [Google Scholar] [CrossRef]
- Sengupta, S. Gondwana sedimentation around Bheemaram (Bhimaram), Pranhita-Godavari Valley, India. J. Sediment. Petrol. 1970, 40, 140–170. [Google Scholar] [CrossRef]
- Kutty, T.S.; Sengupta, D.P. The Late Triassic Formations of the Pranhita-Godavari valley and their vertebrate faunal succession—A Reappraisal Indian. J. Earth Sci. 1989, 16, 189–206. [Google Scholar]
- Dasgupta, S.; Ghosh, P. Freshwater carbonates within a Late Triassic siliciclastic fluvial system in a Gondwana rift basin: The Maleri Formation, India. Sediment. Geol. 2018, 373, 254–271. [Google Scholar] [CrossRef]
- Bandyopadhyay, S.; Gillette, D.D.; Ray, S.; Sengupta, D. Osteology of Barapasaurus Tagorie (Dinosauria: Sauropoda) from the early Jurassic of India. Palaeontology 2010, 53, 533–569. [Google Scholar] [CrossRef]
- Ingersoll, R.V.; Bullard, T.F.; Ford, R.L.; Grimm, J.P.; Pickle, J.D.; Sares, S.W. The effect of grain size on detrital modes: A test of the Gazzi-Dickinson point counting method. J. Sediment Petrol. 1984, 54, 0103–0116. [Google Scholar]
- Bailey, E.H.; Stevens, R.E. Selective staining of K-feldspar and plagioclase on rock slabs and thin sections. Am. Miner. 1960, 45, 1020–1025. [Google Scholar]
- Augustsson, C. Influencing Factors on Petrography Interpretations in Provenance Research—A Case-Study Review. Geosciences 2021, 11, 205. [Google Scholar] [CrossRef]
- Norrish, K.; Hutton, J.T. An accurate X-ray spectrographic method for the analysis of a wide range of geological samples. Geochim. Et Cosmochim. Acta 1969, 33, 431–453. [Google Scholar] [CrossRef]
- Balaram, V.; Rao, T.G. Rapid determination of REEs and trace elements in geological samples by microwave ac, Turanskaya NV (1964) The effect of climate and facies environment on the fractionation of the rare earth elements during sedimentation. Geochem. Int. 2003, 1, 951–969. [Google Scholar]
- Taylor, S.R.; McLennan, S.M. The Continental Crust: Its Composition and Evolution; Blackwell Scientific Publications: London, UK, 1985; p. 312. [Google Scholar]
- Rudnick, R.L.; Gao, S.; Holland, H.D.; Turekian, K.K. Composition of the continental crust. In The Crust; Elsevier: Amsterdam, The Netherlands, 2003; Volume 3, pp. 1–64. [Google Scholar]
- Nesbitt, H.W.; Young, G.M. Early Proterozoic climates and plate motions inferred from major element chemistry of lutites. Nature 1982, 299, 715–717. [Google Scholar] [CrossRef]
- Kutty, T.S.; Jain, S.L.; Roy Chowdhury, T. Gondwana sequence of the northern Pranhita-Godavari Valley: Its stratigraphy and vertebrate faunas. Palaeobotanist 1987, 36, 214–229. [Google Scholar]
- Dasgupta, K. Some Contributions to the Stratigraphy of the Yerrapalli Formation, Pranhita-Godavari Valley, Deccan, India. J. Geol. Soc. India 1993, 42, 223–230. [Google Scholar]
- Dasgupta, S.; Ghosh, P.; Gierlowski-Kordesch, E.H. A discontinuous ephemeral stream transporting mud aggregates in a continental rift basin: The Late Triassic Maleri Formation, India. J. Sediment. Res. 2017, 87, 838–865. [Google Scholar] [CrossRef]
- Goswami, S.; Ghosh, P. Freshwater Microbialites in Early Jurassic Fluvial Strata of the Pranhita-Godavari Gondwana Basin, India. In Limnogeology: Progress, Challenges and Opportunities, Syntheses in Limnogeology; Springer: Berlin, Germany, 2021; pp. 549–578. [Google Scholar]
- Cox, R.; Lowe, D.R.; Cullers, R.L. The influence of sediment recycling and basement composition on evolution of mudrock chemistry in the southwestern United States. Geochim. Et Cosmochim. Acta 1995, 59, 2919–2940. [Google Scholar] [CrossRef]
- Folk, R.L. Petrology of Sedimentary Rocks; Hemphill: Austin, TX, USA, 1974. [Google Scholar]
- Dickinson, W.R.; Beard, L.S.; Brakenridge, G.R.; Erjavec, J.L.; Ferguson, R.C.; Inman, K.F.; Knepp, R.A.; Lindberg, F.A.; Ryberg, P.T. Provenance of North American Phanerozoic sandstones in relation to tectonic setting. Geol. Soc. Amer Bull. 1983, 94, 222–235. [Google Scholar] [CrossRef]
- Ghosh, S.; Sarkar, S. Geochemistry of Permo-Triassic mudstone of the Satpura Gondwana basin, Central India: Clues for provenance. Chem. Geol. 2010, 277, 78–100. [Google Scholar] [CrossRef]
- Madhavaraju, J.; Tom, M.; Lee, Y.I.; Balaram, V.; Ramasamy, S.; Carranza-Edwards, A.; Ramachandran, A. Provenance and tectonic settings of sands from Puerto Peñasco, Desemboque and Bahia Kino beaches, gulf of California, Sonora, México. J. South Am. Earth Sci. 2016, 71, 262–275. [Google Scholar] [CrossRef]
- Chaudhuri, A.; Banerjee, S.; Chauhan, G. Compositional evolution of siliciclastic sediments recording the tectonic stability of a pericratonic rift: Mesozoic Kutch Basin, Western India. Mar. Pet. Geol. 2020, 111, 476–495. [Google Scholar] [CrossRef]
- Chaudhuri, A.; Das, K.; Banerjee, S.; Fitzsimons, I.C.W. Detrital zircon and monazite track the source of Mesozoic sediments in Kutch to rocks of Late Neoproterozoic and Early Palaeozoic orogenies in Northern India. Gond Res. 2020, 80, 188–201. [Google Scholar] [CrossRef]
- Chaudhuri, A.; Chatterjee, A.; Banerjee, S.; Ray, J.S. Tracing multiple sources of sediments using trace element and Nd isotope geochemistry: Provenance of the Mesozoic succession in the Kutch Basin, Western India. Geol. Mag. 2020, 158, 359–374. [Google Scholar] [CrossRef]
- Chaudhuri, A.; Banerjee, S.; Prabhakar, N.; Das, A. The use of heavy mineral chemistry in reconstructing provenance: A case study from Mesozoic sandstones of Kutch Basin (India). Geol. J. 2020, 55, 7808–7817. [Google Scholar] [CrossRef]
- Perri, F.; Caracciolo, L.; Cavalcante, F.; Corrado, S.; Critelli, S.; Muto, F.; Dominici, R. Sedimentary and thermal evolution of the Eocene-Oligocene mudrocks from the southwestern Thrace Basin (NE Greece). Basin Res. 2016, 28, 319–339. [Google Scholar] [CrossRef]
- Perri, F.; Critelli, S.; Martín-Martín, M.; Montone, S.; Amendola, U. Unravelling hinterland and offshore palaeogeography from pre-to-syn-orogenic clastic sequences of the Betic Cordillera (Sierra Espuña), Spain. Palaeogeogr. Palaeoclimatol. Palaeoecol. 2017, 468, 52–69. [Google Scholar] [CrossRef] [Green Version]
- Floyd, P.A.; Leveridge, B.E. Tectonic environment of the Devonian Gramscatho basin, south Cornwall: Framework mode and geochemical evidence from turbiditic sandstones. J. Geol. Soc. 1987, 144, 531–542. [Google Scholar] [CrossRef]
- Gu, X.X.; Liu, J.M.; Zheng, M.H.; Tang, J.X.; Qi, L. Provenance and tectonic setting of the Proterozoic turbidites in Hunan, south China: Geochemical evidence. J. Sediment. Res. 2002, 72, 393–407. [Google Scholar] [CrossRef]
- Zhu, D.; Mo, X.; Niu, Y.; Zhao, Z.; Wang, L.; Pan, G.; Wu, F. Zircon U–Pb dating and in-situ Hf isotopic analysis of Permian peraluminous granite in the Lhasa terrane, southern Tibet: Implications for Permian collisional orogeny and paleogeography. Tectonophysics 2009, 469, 48–60. [Google Scholar] [CrossRef]
- Etemad-Saeed, N.; Hosseini-Barzi, M.; Armstrong-Altrin, J.S. Petrography and geochemistry of clastic sedimentary rocks as evidences for provenance of the Lower Cambrian Lalun Formation, Posht-e-badam block, Central Iran. J. Afr. Earth Sci. 2011, 61, 142–159. [Google Scholar] [CrossRef]
- Wang, W.; Zhou, M.; Yan, D.; Li, J. Depositional age, provenance, and tectonic setting of the Neoproterozoic Sibao Group, southeastern Yangtze Block, South China. Precambrian Res. 2012, 192, 107–124. [Google Scholar] [CrossRef]
- Nagarajan, R.; Armstrong-Altrin, J.S.; Kessler, F.L.; Jong, J. Petrological and geochemical constraints on provenance, paleoweathering, and tectonic setting of clastic sediments from the Neogene Lambir and Sibuti Formations, northwest Borneo. In Sediment Provenance; Elsevier: Amsterdam, The Netherlands, 2017; pp. 123–153. [Google Scholar]
- Cullers, R.L. Implications of elemental concentrations for provenance, redox conditions, and metamorphic studies of shales and limestones near Pueblo, CO, USA. Chem. Geol. 2002, 191, 305–327. [Google Scholar] [CrossRef]
- Bracciali, L.; Marroni, M.; Pandolfi, L.; Rocchi, S.; Arribas, J.; Critelli, S.; Johnsson, M.J. Geochemistry and petrography of Western Tethys Cretaceous sedimentary covers (Corsica and Northern Apennines): From source areas to configuration of margins. Spec. Pap. Geol. Soc. Am. 2007, 420, 73–93. [Google Scholar]
- Mongelli, G.; Critelli, S.; Perri, F.; Sonnino, M.; Perrone, V. Sedimentary recycling, provenance and paleoweathering from chemistry and mineralogy of Mesozoic continental redbed mudrocks, Peloritani Mountains, Southern Italy. Geochem. J. 2006, 40, 197–209. [Google Scholar] [CrossRef] [Green Version]
- Nesbitt, H.W.; Young, G.M. Prediction of some weathering trends of plutonic and volcanic rocks based on thermodynamic and kinetic considerations. J. Geol. 1984, 48, 1523–1534. [Google Scholar] [CrossRef]
- McLennan, S.M.; Bock, B.; Hemming, S.R.; Hurowitz, J.A.; Lev, S.M.; McDaniel, K.D. The roles of provenance and sedimentary processes in the geochemistry of sedimentary rocks. In Geochemistry of Sediments and Sedimentary Rocks: Evolutionary Considerations to Mineral Deposit-Forming Environments; Geological Association of Canada: St. John, NL, Canada, 2003; Volume 4, pp. 7–38. [Google Scholar]
- Reynard, B.; Lécuyer, C.; Grandjean, P. Crystal-chemical controls on rare earth element concentrations in fossil biogenic apatites and implications for paleoenviromental reconstructions. Chem. Geol. 1999, 155, 233–241. [Google Scholar] [CrossRef]
- Ryan, K.M.; Williams, D.M. Testing the reliability of discrimination diagrams for determining the tectonic depositional environment of ancient sedimentary basins. Chem. Geol. 2007, 242, 103–125. [Google Scholar] [CrossRef]
- Verma, S.P.; Armstrong-Altrin, J.S. New multi-dimensional diagrams for tectonic discrimination of siliciclastic sediments and their application to Precambrian basins. Chem. Geol. 2013, 355, 117–133. [Google Scholar] [CrossRef]
- Maravelis, A.G.; Offler, R.; Pantopoulos, G.; Collins, W.J. Provenance and tectonic setting of the Early Permian sedimentary succession in the southern edge of the Sydney Basin, eastern Australia. Geol. J. 2020, 4, 2258–2276. [Google Scholar]
- Long, X.; Sun, M.; Yuan, C.; Kröner, A.; Hu, A. Zircon REE patterns and geochemical characteristics of Paleoproterozoic anatectic granite in the northern Tarim Craton, NW China: Implications for the reconstruction of the Columbia supercontinent. Precambrian Res. 2012, 222, 474–487. [Google Scholar]
- McLennan, S.M.; Taylor, S.R. Sedimentary rocks and crustal evolution: Tectonic setting and secular trends. J. Geol. 1991, 99, 1–21. [Google Scholar] [CrossRef]
- Rudra, D.K.; Maulik, P.K. Lower Jurassic Kota Limestone of India. Glob. Geol Rec. Lake Basins 1994, 1, 185–191. [Google Scholar]
- Goswami, S.; Gierlowski-Kordesch, E.H.; Ghosh, P. Sedimentology of the Early Jurassic limestone beds of the Kota Formation: Record of carbonate wetlands in a continental rift basin of India. J. Paleolimnol. 2018, 59, 21–28. [Google Scholar]


| Formation | Lithology | Fossil Content | AGE | |
|---|---|---|---|---|
| Dharmaram (~400–600 m thick) | Planar and trough cross-bedded coarse sandstone (up to 3–6 m thick co-set, ~30–45% by volume), red mudstone (~30–40% by volume), conglomerate and cross stratified carbonate grainstone (~20–30% by volume) and minor proportion of marl | Continental vertebrates, Unio, Large petrified wood | Early Early Jurassic–Late Triassic | |
| Upper Gondwanas | Maleri (~300–500 m thick) | Dominated by pale red, stratified siltstone (up to 0.5–3 m thick co-set, ~50% by volume), fine to medium cross stratified sandstone (up to 2–5 m thick co-set, ~20% by volume), massive mudstone (up to 1–4 m thick, ~25% by volume), planar and trough cross-bedded carbonate grainstone (~5–8%), minor proportion of marl | Continental vertebrates, Unio, petrified wood | Early Late Triassic (Early Norian–Late Carnian) |
| Bhimaram (~400 m thick) | Coarse to medium cross-stratified sandstone (up to 3–8 m thick co-set, ~95% by volume), ferruginous or calcareous in places intercalated with minor proportion of red mudstone | Large petrified wood | Late Middle Triassic (Ladinian) | |
| Yerrapalli (~200 to 500 m thick) | Red and violet mudstone (~70% by volume) with gypsum, laminated calcareous sandstone (up to 2–5 m thick, ~25–28% by volume) and cross stratified carbonate grainstone (~3–5% by volume) | Continental vertebrates, very few petrified wood | Early Middle Triassic (Anisian) | |
| Lower Gondwanas | ||||
| Proterozoic and Archean basement rocks | ||||
| Facies | Description | Sedimentary Structures | Depositional Process | Interpretation | Appearance |
|---|---|---|---|---|---|
| F1—Parallel laminated sandy siltstone | Laminae thickness 1–5 mm. Stratification defined by variation in proportion of mud aggregates. Tabular sets (30–70 cm) and wedge-shaped sets (10–50 cm) present. | Plane-parallel to low-angle (<3°) laminae. | Low to mid energy, unidirectional traction sedimentation. | Plane beds formed under both upper and lower flow regimes. | Mainly in Yerrapalli and Maleri formations, minor in the Dharamaram formation. |
| F2—Ripple laminated silt (mud aggregates) to very fine sandtone | Set thickness 0.5–1.2 cm. Wavy lamination and combined-flow ripples present in topset laminae. | Current-ripple cross-laminated. Both planar and trough-shaped foresets. | Low energy, unidirectional traction sedimentation. | Migration of straight-crested and curved-crested ripples under lower flow regime. | Essentially in Yerrapalli and Maleri formations. |
| F3—Massive mudstone | Silt (~30%), very-fine-sandsize quartz and feldspar grains (~5%), rest red clay. Pedogenic features such as drab-haloed root traces, wedge-shaped peds, mudcracks and rhizocretions present. | Massive. Faint traces of current- and climbing ripple cross lamination in places. | Suspension deposition during flood events. | Fine grained clastics deposited in low-energy environment and modified due to pedogenesis. | Mostly in Yerrapalli formation, occur as paleosols (thickness 3–5 m) in Maleri formation, occur as lenses in Dharmaram formation. |
| F4—Marl | Bed thickness avg. 5–20 cm; max. 1.5 m. Lateral extent 8–20 m. Alternation of micrite, microspar, and calcareous clay-rich laminae. Shells of aquatic invertebrates and desiccation cracks present. | Thinly laminated (1–5 mm). | Carbonate precipitation. | Deposition of limemud in small, shallow and ephemeral water bodies. | Occur as thin sheets in Maleri and Dharmaram formations. |
| F5—Cross stratified carbonate grainstone | Medium-sand- to granule-size calcareous grains admixed with silt- to fine-sand-size mud aggregates and other siliciclastic grains. Fossils: freshwater bivalve (Unio), aquatic, semiaquatic vertebrates (bone fragments), and articulated ostracod shells. | Planar (5–35 cm set thickness) and trough (~10 cm set thickness) cross-bedding. | High energy traction currents, unidirectional migration of 2D and 3D sand dunes. | An admixture of carbonate and siliciclastic grains transported as straight-crested and curved crested dunes. | Lensoid bodies in ascending order of occurrence from Yerrapalli-Maleri-Bhimaram-Dharmaram formations. |
| F6—Parallel laminated very fine to fine grained sandstone | Alternating white and red laminae defined by contrast in grain size as well as by the proportion of mud aggregates in the framework. Fine-sand-size red mud aggregates dominate redish laminae. Sand-size quartz and feldspar grains dominate white laminae. | Lamina thickness 1–5 mm thick, lateral extent 10 cm–2.5 m. Plane-parallel and low-angle (<5°) lamination. Parting lineation on laminae surfaces. | Low energy, unidirectional traction sedimentation. | Plane beds formed in shallow, upper-flow-regime conditions. | Occur as thin sheets in Yerrapalli and co-sets in Maleri formation. Bhimaram and Dharmaram formations have more thicker bodies. |
| F7—Cross stratified fine to coarse grained sandstone | Set thickness ~15–40 cm, up to 70 cm. | Planar and trough cross-bedding. | High energy traction currents, unidirectional migration of 2D and 3D sand dunes. | Migration of straight-crested and curved-crested sandy dunes. | Minor in Yerrapalli and Maleri, whereas major in Bhimaram and Dharmam formations. |
| F8—Ripple laminated fine to very fine sandstone | Set thickness, 0.5–1.5 cm; lateral extent 20–50 cm. | Current-ripple cross-lamination. | Low energy, unidirectional traction sedimentation. | Migration of straight-crested and curved-crested ripples under lower flow regime. | Occur in all four formations. |
| F9—Medium grained massive sandstone | Lenses have steep margins, concave-up basal surface, internal stratification (where present) becomes progressively gentler from the sides to the centers of the lenses. | Lenses of massive sandstone. Thickness 5–30 cm, lateral extent 10–50 cm. | Rapid suspension fallout. | In-fills of erosional depressions. Either filled gradually from side, or rapidly, thereby obliterating structures due to rapid fluid escape after deposition. | Occur in all four formations. |
| QFR% | QmFLt% | |||||||||||||||||
|---|---|---|---|---|---|---|---|---|---|---|---|---|---|---|---|---|---|---|
| Sample No. | Formation | Qm | Qp(2–3) | Qp(>3) | Qp(>10) | Total Qp | Total Q(Qm + Qp) | F(K) | RF(S) | Bt | HM | Total Count | Q | F | R | Qm | F | Lt |
| Dh 158/11-12 | Dharmaram | 302 | 15 | 3 | 0 | 18 | 320 | 79 | 5 | 0 | 8 | 412 | 79.21 | 19.55 | 1.24 | 74.75 | 19.55 | 5.69 |
| Dh 166/11-12 | Dharmaram | 321 | 18 | 4 | 2 | 24 | 345 | 70 | 36 | 1 | 2 | 454 | 76.50 | 15.52 | 7.98 | 71.18 | 15.52 | 13.30 |
| Dh 153/11-12 | Dharmaram | 279 | 16 | 2 | 0 | 18 | 297 | 73 | 7 | 0 | 6 | 383 | 78.78 | 19.36 | 1.86 | 74.01 | 19.36 | 6.63 |
| Dh 162/11-12 | Dharmaram | 297 | 10 | 1 | 3 | 14 | 311 | 61 | 11 | 0 | 39 | 422 | 81.20 | 15.93 | 2.87 | 77.55 | 15.93 | 6.53 |
| Dh 132/11-12 | Dharmaram | 289 | 9 | 0 | 1 | 10 | 299 | 56 | 10 | 0 | 43 | 408 | 81.92 | 15.34 | 2.74 | 79.18 | 15.34 | 5.48 |
| Dh 133/11-12 | Dharmaram | 325 | 7 | 0 | 5 | 12 | 337 | 54 | 16 | 0 | 1 | 408 | 82.80 | 13.27 | 3.93 | 79.85 | 13.27 | 6.88 |
| Dh 167/11-12 | Dharmaram | 249 | 10 | 7 | 2 | 19 | 268 | 9 | 21 | 2 | 0 | 300 | 89.93 | 3.02 | 7.05 | 83.56 | 3.02 | 13.42 |
| Dh 151/11-12 | Dharmaram | 225 | 4 | 2 | 0 | 6 | 231 | 46 | 39 | 0 | 10 | 326 | 73.10 | 14.56 | 12.34 | 71.20 | 14.56 | 14.24 |
| Dh 161/11-12 | Dharmaram | 244 | 0 | 8 | 0 | 8 | 252 | 30 | 0 | 0 | 21 | 303 | 89.36 | 10.64 | 0.00 | 86.52 | 10.64 | 2.84 |
| Dh 149/11-12 | Dharmaram | 540 | 0 | 6 | 0 | 6 | 546 | 317 | 6 | 10 | 6 | 885 | 62.83 | 36.48 | 0.69 | 62.14 | 36.48 | 1.38 |
| 411A | Maleri | 445 | 32 | 5 | 3 | 40 | 485 | 15 | 0 | 0 | 72 | 572 | 97.00 | 3.00 | 0.00 | 89.00 | 3.00 | 8.00 |
| Ma39_12-13 | Maleri | 335 | 45 | 10 | 5 | 60 | 395 | 100 | 5 | 0 | 44 | 544 | 79.00 | 20.00 | 1.00 | 67.00 | 20.00 | 13.00 |
| Ma61_12-13 | Maleri | 405 | 39 | 15 | 6 | 60 | 465 | 30 | 5 | 0 | 56 | 556 | 93.00 | 6.00 | 1.00 | 81.00 | 6.00 | 13.00 |
| Ma62_12-13 | Maleri | 340 | 28 | 14 | 3 | 45 | 385 | 110 | 5 | 0 | 34 | 534 | 77.00 | 22.00 | 1.00 | 68.00 | 22.00 | 10.00 |
| Ma65_12-13 | Maleri | 360 | 54 | 12 | 4 | 70 | 430 | 65 | 5 | 0 | 20 | 520 | 86.00 | 13.00 | 1.00 | 72.00 | 13.00 | 15.00 |
| Ma108_11-12 | Maleri | 350 | 6 | 3 | 1 | 10 | 360 | 140 | 0 | 1 | 26 | 527 | 72.00 | 28.00 | 0.00 | 70.00 | 28.00 | 2.00 |
| Ma121_11-12 | Maleri | 305 | 9 | 4 | 2 | 15 | 320 | 180 | 0 | 0 | 33 | 533 | 64.00 | 36.00 | 0.00 | 61.00 | 36.00 | 3.00 |
| Ma126_11-12 | Maleri | 330 | 9 | 8 | 3 | 20 | 350 | 150 | 0 | 0 | 31 | 531 | 70.00 | 30.00 | 0.00 | 66.00 | 30.00 | 4.00 |
| Ma188_11-12 | Maleri | 330 | 39 | 6 | 5 | 50 | 380 | 120 | 0 | 2 | 27 | 529 | 76.00 | 24.00 | 0.00 | 66.00 | 24.00 | 10.00 |
| Ma103_11-12 | Maleri | 355 | 31 | 14 | 0 | 45 | 400 | 100 | 0 | 0 | 38 | 538 | 80.00 | 20.00 | 0.00 | 71.00 | 20.00 | 9.00 |
| Ma106_11-12 | Maleri | 325 | 26 | 6 | 3 | 35 | 360 | 135 | 5 | 0 | 26 | 526 | 72.00 | 27.00 | 1.00 | 65.00 | 27.00 | 8.00 |
| Ma196_11-12 | Maleri | 330 | 25 | 11 | 4 | 40 | 370 | 125 | 5 | 1 | 30 | 531 | 74.00 | 25.00 | 1.00 | 66.00 | 25.00 | 9.00 |
| Ma124_11-12 | Maleri | 315 | 5 | 2 | 1 | 8 | 323 | 185 | 0 | 0 | 18 | 526 | 63.58 | 36.42 | 0.00 | 62.01 | 36.42 | 1.57 |
| 421 | Maleri | 300 | 51 | 9 | 0 | 60 | 360 | 135 | 5 | 1 | 10 | 511 | 72.00 | 27.00 | 1.00 | 60.00 | 27.00 | 13.00 |
| Ma41_12-13 | Maleri | 325 | 44 | 13 | 8 | 65 | 390 | 105 | 5 | 0 | 21 | 521 | 78.00 | 21.00 | 1.00 | 65.00 | 21.00 | 14.00 |
| Ma37_12-13 | Maleri | 305 | 22 | 14 | 9 | 45 | 350 | 145 | 5 | 0 | 16 | 516 | 70.00 | 29.00 | 1.00 | 61.00 | 29.00 | 10.00 |
| Ma40_12-13 | Maleri | 370 | 9 | 6 | 5 | 20 | 390 | 110 | 0 | 2 | 42 | 544 | 78.00 | 22.00 | 0.00 | 74.00 | 22.00 | 4.00 |
| Ma23_12-13 | Maleri | 330 | 33 | 16 | 1 | 50 | 380 | 120 | 0 | 0 | 22 | 522 | 76.00 | 24.00 | 0.00 | 66.00 | 24.00 | 10.00 |
| Ma6_14-15 | Maleri | 330 | 29 | 16 | 0 | 45 | 375 | 120 | 5 | 0 | 19 | 519 | 75.00 | 24.00 | 1.00 | 66.00 | 24.00 | 10.00 |
| Ma9_14-15 | Maleri | 365 | 20 | 13 | 2 | 35 | 400 | 95 | 5 | 1 | 25 | 526 | 80.00 | 19.00 | 1.00 | 73.00 | 19.00 | 8.00 |
| Bh 201/11-12 | Bhimaram | 332 | 9 | 2 | 0 | 11 | 343 | 68 | 5 | 0 | 70 | 486 | 82.45 | 16.35 | 1.20 | 79.81 | 16.35 | 3.85 |
| Bh 118/11-12 | Bhimaram | 295 | 11 | 0 | 3 | 14 | 309 | 76 | 7 | 0 | 55 | 447 | 78.83 | 19.39 | 1.79 | 75.26 | 19.39 | 5.36 |
| Bh 191A/11-12 | Bhimaram | 369 | 8 | 0 | 0 | 8 | 377 | 81 | 5 | 2 | 29 | 494 | 81.43 | 17.49 | 1.08 | 79.70 | 17.49 | 2.81 |
| Bh187/11-12 | Bhimaram | 342 | 12 | 0 | 2 | 14 | 356 | 62 | 8 | 0 | 74 | 500 | 83.57 | 14.55 | 1.88 | 80.28 | 14.55 | 5.16 |
| Yr 177/11-12 | Yerrapalli | 391 | 20 | 1 | 4 | 25 | 416 | 7 | 6 | 0 | 0 | 429 | 96.97 | 1.63 | 1.40 | 91.14 | 1.63 | 7.23 |
| Yr 179/11-12 | Yerrapalli | 355 | 30 | 7 | 3 | 40 | 395 | 323 | 0 | 5 | 111 | 834 | 55.01 | 44.99 | 0.00 | 49.44 | 44.99 | 5.57 |
| Yr 180/11-12 | Yerrapalli | 461 | 0 | 0 | 0 | 0 | 461 | 338 | 0 | 28 | 84 | 911 | 57.70 | 42.30 | 0.00 | 57.70 | 42.30 | 0.00 |
| Yr 178/11-12 | Yerrapalli | 411 | 4 | 0 | 0 | 4 | 415 | 248 | 9 | 0 | 34 | 706 | 61.76 | 36.90 | 1.34 | 61.16 | 36.90 | 1.93 |
| Samples | SiO2 | Al2O3 | Fe2O3 | MnO | MgO | CaO | Na2O | K2O | TiO2 | P2O5 | LOI | Total | Al2O3/TiO2 | ICV | CIA |
|---|---|---|---|---|---|---|---|---|---|---|---|---|---|---|---|
| Dh170/11-12 | 69.22 | 15.97 | 5.16 | 0.04 | 0.56 | 0.17 | 0.24 | 0.63 | 0.97 | 0.06 | 7.53 | 100.60 | 16.46 | 0.49 | 93.89 |
| Dh136/11-12 | 51.86 | 16.33 | 8.83 | 0.06 | 2.38 | 3.07 | 0.44 | 2.50 | 0.74 | 0.14 | 13.59 | 100.10 | 22.07 | 1.11 | 73.10 |
| Ma2/12-13 | 52.39 | 16.26 | 9.43 | 0.12 | 2.79 | 0.54 | 0.71 | 2.58 | 0.73 | 0.09 | 14.31 | 100.20 | 22.27 | 1.05 | 80.94 |
| Ma4/12-13 | 51.04 | 14.88 | 8.06 | 0.07 | 2.74 | 4.36 | 0.30 | 2.39 | 0.70 | 0.17 | 15.69 | 100.80 | 21.26 | 1.27 | 67.85 |
| Ma8/12-13 | 53.28 | 15.36 | 7.97 | 0.14 | 2.79 | 1.66 | 0.44 | 2.18 | 0.76 | 0.16 | 14.89 | 99.86 | 20.21 | 1.05 | 78.21 |
| Ma13/12-13 | 51.32 | 16.15 | 8.62 | 0.18 | 2.90 | 2.26 | 0.47 | 2.26 | 0.72 | 0.16 | 15.70 | 100.80 | 22.43 | 1.08 | 76.40 |
| Ma49/12-13 | 52.63 | 13.37 | 6.05 | 0.15 | 2.10 | 5.89 | 0.32 | 2.43 | 0.64 | 0.14 | 15.48 | 99.88 | 20.89 | 1.37 | 60.75 |
| Ma27/12-13 | 57.73 | 15.24 | 7.46 | 0.14 | 2.40 | 0.93 | 0.15 | 2.81 | 0.68 | 0.09 | 12.78 | 100.70 | 22.41 | 0.98 | 79.67 |
| Ma28/12-13 | 58.97 | 15.17 | 6.67 | 0.05 | 2.34 | 0.57 | 0.22 | 2.87 | 0.64 | 0.09 | 11.94 | 99.87 | 23.70 | 0.90 | 80.56 |
| Ma35/12-13 | 50.02 | 16.16 | 8.68 | 0.07 | 2.77 | 2.92 | 0.35 | 2.27 | 0.71 | 0.15 | 15.35 | 100.00 | 22.76 | 1.13 | 74.47 |
| Ma42/12-13 | 49.72 | 15.86 | 8.24 | 0.08 | 2.73 | 2.45 | 0.59 | 2.39 | 0.69 | 0.14 | 17.17 | 100.30 | 22.99 | 1.10 | 74.50 |
| Ma50/12-13 | 54.66 | 15.44 | 7.07 | 0.05 | 2.60 | 1.52 | 0.41 | 2.04 | 0.76 | 0.16 | 15.07 | 100.40 | 20.32 | 0.97 | 79.55 |
| Ma109/11-12 | 61.63 | 14.01 | 7.76 | 0.06 | 1.78 | 0.31 | 0.56 | 2.80 | 0.91 | 0.09 | 9.76 | 99.68 | 15.40 | 1.01 | 79.24 |
| Ma113/11-12 | 52.98 | 13.48 | 5.36 | 0.12 | 2.43 | 6.19 | 0.20 | 2.02 | 0.65 | 0.12 | 15.96 | 100.30 | 20.74 | 1.32 | 61.58 |
| Ma141/11-12 | 65.79 | 14.20 | 7.50 | 0.02 | 1.51 | 0.23 | 0.58 | 1.97 | 0.82 | 0.10 | 7.40 | 100.10 | 17.32 | 0.89 | 83.63 |
| Ma173/11-12 | 54.75 | 15.02 | 7.14 | 0.07 | 2.65 | 2.83 | 0.55 | 2.64 | 0.68 | 0.14 | 12.73 | 99.32 | 22.09 | 1.11 | 71.39 |
| Ma193/11-12 | 54.82 | 15.28 | 7.14 | 0.04 | 2.64 | 1.88 | 0.51 | 2.59 | 0.72 | 0.15 | 14.43 | 100.40 | 21.22 | 1.03 | 75.42 |
| Ma199/11-12 | 52.51 | 14.37 | 7.34 | 0.12 | 2.57 | 4.08 | 0.34 | 2.06 | 0.71 | 0.14 | 15.91 | 100.20 | 20.24 | 1.20 | 68.92 |
| Yr148/11-12 | 63.05 | 16.59 | 7.36 | 0.01 | 0.79 | 0.57 | 0.24 | 0.59 | 0.79 | 0.12 | 9.79 | 100.50 | 21.00 | 0.66 | 92.22 |
| Yr183/11-12 | 52.63 | 15.18 | 8.38 | 0.07 | 2.72 | 2.94 | 0.42 | 3.20 | 0.70 | 0.16 | 14.16 | 100.60 | 21.69 | 1.21 | 69.83 |
| Sample | Sc | V | Cr | Co | Ni | Cu | Zn | Ga | Y | Zr | Nb | Hf | Ta | Th | U | Rb | Sr | Cs | Ba | Pb |
|---|---|---|---|---|---|---|---|---|---|---|---|---|---|---|---|---|---|---|---|---|
| Dh 136/11-12 | 15.20 | 127.16 | 73.33 | 35.29 | 85.98 | 62.09 | 161.31 | 27.30 | 43.21 | 2893.59 | 14.12 | 57.65 | 1.05 | 18.58 | 5.47 | 163.31 | 153.54 | 9.47 | 288.51 | 46.24 |
| Dh 171/11-12 | 12.88 | 125.11 | 72.51 | 16.90 | 80.58 | 52.60 | 164.65 | 29.78 | 48.06 | 5854.69 | 14.82 | 118.70 | 1.81 | 17.79 | 8.98 | 127.95 | 157.78 | 13.33 | 361.99 | 54.17 |
| Dh 164/11-12 | 34.96 | 327.69 | 74.02 | 18.02 | 44.69 | 61.76 | 90.85 | 40.09 | 46.04 | 6389.78 | 16.90 | 132.35 | 2.32 | 33.39 | 9.78 | 32.15 | 123.81 | 8.83 | 405.95 | 165.29 |
| Dh 169/11-12 | 30.73 | 98.96 | 73.38 | 8.04 | 31.22 | 37.62 | 240.52 | 40.09 | 28.72 | 4926.51 | 19.12 | 98.88 | 2.20 | 32.81 | 6.89 | 23.31 | 110.95 | 6.94 | 281.46 | 70.41 |
| Dh 170/11-12 | 12.71 | 115.88 | 71.32 | 41.76 | 50.65 | 48.57 | 94.21 | 25.25 | 36.70 | 3015.54 | 17.78 | 62.98 | 1.98 | 24.46 | 6.41 | 59.65 | 84.93 | 8.54 | 240.37 | 64.78 |
| Dh 172/11-12 | 9.77 | 60.78 | 72.35 | 28.59 | 72.97 | 37.78 | 109.61 | 14.15 | 31.54 | 1534.99 | 9.67 | 30.51 | 1.40 | 16.77 | 3.52 | 94.72 | 135.51 | 6.97 | 243.21 | 46.54 |
| Dh 114/11-12 | 14.36 | 123.30 | 73.61 | 22.90 | 70.78 | 53.34 | 143.57 | 24.46 | 45.06 | 2246.87 | 14.41 | 45.77 | 1.45 | 17.32 | 4.98 | 159.35 | 136.74 | 7.46 | 503.31 | 48.47 |
| Ma 141/11-12 | 14.39 | 136.71 | 67.35 | 31.05 | 77.99 | 47.26 | 125.16 | 31.74 | 44.84 | 6366.35 | 15.74 | 135.94 | 2.22 | 21.97 | 10.49 | 157.03 | 125.28 | 17.53 | 384.89 | 62.79 |
| Ma 113/11-12 | 13.92 | 114.00 | 74.29 | 21.30 | 82.32 | 51.97 | 156.27 | 32.38 | 53.42 | 5718.42 | 15.05 | 120.80 | 1.93 | 20.49 | 8.88 | 129.51 | 211.62 | 11.38 | 443.10 | 52.55 |
| Ma 128/11-12 | 14.28 | 109.46 | 76.66 | 19.84 | 77.40 | 58.72 | 149.60 | 26.01 | 45.87 | 2844.35 | 14.81 | 56.03 | 1.33 | 18.04 | 5.60 | 143.12 | 150.22 | 7.62 | 498.19 | 49.73 |
| Ma 173/11-12 | 12.20 | 84.16 | 70.42 | 14.99 | 53.52 | 50.69 | 135.79 | 25.60 | 43.00 | 3538.75 | 13.73 | 74.10 | 1.40 | 17.74 | 6.31 | 131.07 | 146.90 | 8.87 | 1587.85 | 79.11 |
| Ma 193/11-12 | 13.52 | 106.02 | 70.80 | 16.92 | 60.13 | 54.48 | 111.93 | 29.25 | 44.97 | 4333.92 | 15.59 | 91.28 | 1.61 | 19.03 | 6.74 | 147.90 | 142.12 | 10.14 | 276.60 | 66.90 |
| Ma 194/11-12 | 15.30 | 115.61 | 73.66 | 16.29 | 73.16 | 58.48 | 129.12 | 33.36 | 47.54 | 5583.49 | 16.40 | 110.56 | 1.71 | 19.10 | 7.63 | 154.66 | 159.37 | 11.84 | 197.26 | 68.41 |
| Ma 199/11-12 | 12.87 | 77.93 | 73.71 | 18.74 | 53.19 | 45.23 | 104.48 | 24.43 | 51.68 | 2837.77 | 14.01 | 55.14 | 1.54 | 16.92 | 5.48 | 122.19 | 171.43 | 7.28 | 475.43 | 61.13 |
| Ma 200/11-12 | 15.64 | 122.83 | 68.36 | 16.05 | 61.48 | 49.71 | 116.22 | 29.35 | 47.83 | 3384.46 | 15.37 | 71.51 | 1.52 | 17.45 | 5.85 | 150.11 | 153.71 | 9.16 | 171.07 | 60.55 |
| Ma 8/9-10 | 14.76 | 138.12 | 70.43 | 23.94 | 72.66 | 61.04 | 129.14 | 27.10 | 45.08 | 3255.77 | 14.49 | 67.21 | 1.30 | 17.79 | 5.31 | 124.06 | 142.64 | 7.49 | 300.48 | 60.35 |
| Ma 109/11-12 | 11.68 | 71.16 | 67.08 | 18.69 | 60.82 | 50.01 | 149.34 | 20.94 | 38.05 | 2253.16 | 15.93 | 49.03 | 1.58 | 28.17 | 4.64 | 134.98 | 142.55 | 5.64 | 601.43 | 55.47 |
| Ma 104/11-12 | 13.39 | 92.33 | 68.95 | 15.48 | 78.62 | 54.58 | 149.68 | 25.19 | 42.64 | 3048.90 | 15.09 | 65.04 | 1.52 | 18.29 | 5.99 | 145.24 | 150.93 | 8.95 | 200.49 | 48.85 |
| Ma 106/11-12 | 11.95 | 121.85 | 67.00 | 24.36 | 59.29 | 54.09 | 153.04 | 30.17 | 40.68 | 4044.77 | 15.71 | 87.86 | 1.80 | 26.28 | 8.37 | 137.38 | 149.01 | 8.06 | 505.63 | 57.83 |
| Ma 110/11-12 | 16.43 | 140.82 | 75.51 | 22.71 | 78.63 | 61.43 | 165.34 | 27.66 | 46.48 | 2405.31 | 14.48 | 48.48 | 1.31 | 17.04 | 5.27 | 149.53 | 165.40 | 6.98 | 159.57 | 48.71 |
| Ma 9/9-10 | 15.86 | 131.25 | 75.28 | 24.00 | 86.88 | 66.57 | 187.18 | 31.58 | 48.99 | 4928.87 | 14.73 | 96.06 | 0.84 | 18.80 | 7.34 | 135.16 | 175.79 | 9.49 | 712.82 | 51.26 |
| Ma 129/11-12 | 14.46 | 138.18 | 72.85 | 22.35 | 77.90 | 56.38 | 193.80 | 24.59 | 48.37 | 2733.44 | 13.13 | 55.00 | 1.25 | 20.70 | 5.02 | 139.87 | 136.42 | 7.31 | 271.85 | 48.13 |
| Bh 142/11-12 | 15.41 | 134.26 | 70.30 | 25.69 | 69.75 | 61.71 | 130.16 | 25.53 | 43.53 | 2074.55 | 13.42 | 43.45 | 0.56 | 19.10 | 4.13 | 130.58 | 143.75 | 6.11 | 312.27 | 67.31 |
| Yr 145/11-12 | 12.76 | 118.97 | 65.76 | 17.76 | 55.20 | 46.73 | 201.61 | 28.36 | 44.12 | 4399.52 | 17.64 | 95.21 | 2.08 | 19.50 | 7.75 | 98.12 | 154.81 | 11.95 | 149.78 | 59.04 |
| Yr 182/11-12 | 11.57 | 82.57 | 69.97 | 15.44 | 38.24 | 40.77 | 113.22 | 22.11 | 45.25 | 2949.18 | 16.59 | 60.56 | 1.71 | 19.28 | 5.12 | 59.49 | 116.12 | 7.72 | 142.13 | 60.11 |
| Yr 184/11-12 | 14.74 | 142.48 | 69.74 | 22.86 | 85.57 | 51.48 | 137.99 | 39.17 | 117.08 | 8036.72 | 18.82 | 170.36 | 2.40 | 21.70 | 16.70 | 168.41 | 158.12 | 20.21 | 285.98 | 64.77 |
| Yr 148 (2)/11-1 | 13.06 | 114.66 | 69.23 | 10.41 | 46.69 | 44.11 | 168.24 | 29.10 | 87.37 | 3644.22 | 17.94 | 77.60 | 1.95 | 18.10 | 8.41 | 64.85 | 75.39 | 9.69 | 175.98 | 61.63 |
| Yr 148/11-12 | 13.25 | 110.85 | 69.64 | 9.60 | 53.71 | 49.61 | 137.84 | 27.77 | 89.21 | 2950.21 | 18.00 | 61.34 | 1.80 | 17.62 | 7.71 | 64.44 | 91.34 | 8.92 | 117.48 | 60.56 |
| Yr 183/11-12 | 13.86 | 102.69 | 71.61 | 20.49 | 72.03 | 57.50 | 171.42 | 27.61 | 44.35 | 3707.76 | 15.24 | 74.64 | 1.52 | 16.30 | 5.94 | 163.70 | 138.67 | 10.00 | 260.37 | 46.54 |
| Sample | La | Ce | Pr | Nd | Sm | Eu | Gd | Tb | Dy | Ho | Er | Tm | Yb | Lu |
|---|---|---|---|---|---|---|---|---|---|---|---|---|---|---|
| Dh 136/11-12 | 47.26 | 99.15 | 9.99 | 37.88 | 7.41 | 1.43 | 6.99 | 1.12 | 6.98 | 1.61 | 4.33 | 0.78 | 4.07 | 0.65 |
| Dh 171/11-12 | 48.15 | 100.59 | 10.38 | 39.96 | 7.83 | 1.52 | 7.20 | 1.17 | 7.26 | 1.68 | 4.73 | 0.89 | 4.83 | 0.80 |
| Dh 164/11-12 | 101.31 | 181.34 | 16.73 | 53.75 | 7.73 | 1.37 | 7.57 | 1.14 | 7.31 | 1.72 | 4.97 | 0.95 | 5.28 | 0.86 |
| Dh 169/11-12 | 80.42 | 179.20 | 18.67 | 66.75 | 11.08 | 1.76 | 7.68 | 1.01 | 5.27 | 1.15 | 3.52 | 0.67 | 3.91 | 0.64 |
| Dh 170/11-12 | 52.30 | 105.71 | 10.11 | 37.06 | 6.88 | 1.20 | 6.16 | 0.95 | 5.85 | 1.37 | 3.83 | 0.72 | 4.02 | 0.63 |
| Dh 172/11-12 | 38.80 | 88.49 | 8.21 | 31.10 | 5.93 | 1.07 | 5.43 | 0.83 | 4.81 | 1.07 | 2.90 | 0.50 | 2.62 | 0.41 |
| Dh 114/11-12 | 52.21 | 115.19 | 11.19 | 42.69 | 8.44 | 1.69 | 7.66 | 1.20 | 7.29 | 1.66 | 4.38 | 0.76 | 3.97 | 0.61 |
| Ma 141/11-12 | 39.22 | 90.85 | 8.84 | 33.86 | 6.96 | 1.33 | 6.55 | 1.08 | 7.10 | 1.72 | 4.90 | 0.98 | 5.36 | 0.91 |
| Ma 113/11-12 | 54.74 | 103.45 | 11.32 | 44.17 | 8.69 | 1.87 | 8.13 | 1.32 | 8.32 | 1.97 | 5.50 | 1.01 | 5.59 | 0.90 |
| Ma 128/11-12 | 49.16 | 100.61 | 10.50 | 40.07 | 7.90 | 1.57 | 7.25 | 1.16 | 7.06 | 1.63 | 4.45 | 0.76 | 4.07 | 0.64 |
| Ma 173/11-12 | 47.42 | 99.22 | 10.17 | 39.34 | 8.36 | 2.08 | 7.21 | 1.10 | 6.82 | 1.56 | 4.25 | 0.77 | 4.07 | 0.65 |
| Ma 193/11-12 | 46.88 | 100.90 | 10.39 | 39.90 | 7.97 | 1.53 | 7.33 | 1.18 | 7.36 | 1.68 | 4.63 | 0.85 | 4.61 | 0.74 |
| Ma 194/11-12 | 47.02 | 96.13 | 10.17 | 38.82 | 7.56 | 1.43 | 7.11 | 1.16 | 7.21 | 1.68 | 4.75 | 0.88 | 4.71 | 0.77 |
| Ma 199/11-12 | 54.04 | 111.08 | 11.23 | 42.63 | 8.24 | 1.70 | 7.71 | 1.24 | 7.76 | 1.80 | 4.77 | 0.86 | 4.43 | 0.69 |
| Ma 200/11-12 | 57.36 | 121.40 | 12.49 | 47.64 | 9.07 | 1.77 | 8.61 | 1.34 | 8.09 | 1.81 | 4.85 | 0.86 | 4.43 | 0.70 |
| Ma 8/9-10 | 49.30 | 101.79 | 10.32 | 39.79 | 7.85 | 1.56 | 7.47 | 1.19 | 7.29 | 1.68 | 4.51 | 0.81 | 4.31 | 0.70 |
| Ma 109/11-12 | 66.82 | 148.09 | 14.32 | 53.83 | 10.10 | 1.86 | 8.74 | 1.24 | 6.98 | 1.50 | 4.07 | 0.70 | 3.75 | 0.59 |
| Ma 104/11-12 | 45.81 | 91.98 | 10.10 | 39.49 | 7.84 | 1.46 | 7.24 | 1.14 | 7.09 | 1.61 | 4.33 | 0.79 | 4.16 | 0.66 |
| Ma 106/11-12 | 67.35 | 150.36 | 14.33 | 53.80 | 9.89 | 1.93 | 8.76 | 1.25 | 7.24 | 1.64 | 4.47 | 0.80 | 4.30 | 0.71 |
| Ma 110/11-12 | 48.29 | 101.52 | 10.41 | 39.99 | 7.85 | 1.56 | 7.48 | 1.21 | 7.44 | 1.70 | 4.43 | 0.78 | 4.04 | 0.62 |
| Ma 9/9-10 | 51.91 | 108.69 | 11.10 | 41.96 | 8.40 | 1.74 | 7.48 | 1.21 | 7.51 | 1.75 | 4.74 | 0.87 | 4.66 | 0.75 |
| Ma 129/11-12 | 54.44 | 106.87 | 10.99 | 41.81 | 8.13 | 1.55 | 7.54 | 1.19 | 7.49 | 1.74 | 4.68 | 0.83 | 4.31 | 0.66 |
| Bh 142/11-12 | 48.92 | 99.79 | 10.12 | 38.83 | 7.56 | 1.47 | 7.11 | 1.13 | 6.95 | 1.63 | 4.33 | 0.77 | 4.12 | 0.63 |
| Yr 145/11-12 | 45.42 | 101.39 | 10.24 | 39.05 | 7.77 | 1.37 | 7.28 | 1.17 | 7.22 | 1.66 | 4.64 | 0.86 | 4.64 | 0.76 |
| Yr 182/11-12 | 46.27 | 103.35 | 10.13 | 38.73 | 7.65 | 1.40 | 6.99 | 1.13 | 7.02 | 1.64 | 4.52 | 0.82 | 4.35 | 0.68 |
| Yr 184/11-12 | 78.64 | 165.45 | 16.29 | 64.51 | 13.23 | 2.60 | 14.05 | 2.39 | 16.07 | 4.05 | 10.86 | 1.95 | 10.05 | 1.61 |
| Yr 148 (2)/11-12 | 84.09 | 177.47 | 16.44 | 68.12 | 14.15 | 2.94 | 16.03 | 2.58 | 15.95 | 3.47 | 8.81 | 1.52 | 7.81 | 1.18 |
| Yr 148/11-12 | 90.65 | 190.36 | 17.77 | 73.22 | 15.13 | 3.12 | 17.13 | 2.72 | 16.17 | 3.52 | 8.74 | 1.48 | 7.54 | 1.10 |
| Yr 183/11-12 | 44.76 | 97.94 | 9.85 | 37.60 | 7.49 | 1.50 | 6.97 | 1.10 | 6.91 | 1.61 | 4.37 | 0.80 | 4.26 | 0.68 |
| Sample | La/Sc | La/Th | Th/Sc | Zr/Sc | ΣREE | Eu/Eu* | Gdn/Ybn | LREE/HREE | Cr/V | Zr/Hf | Y/Ni | Th/Co | LaN/YbN | LaN/SmN |
|---|---|---|---|---|---|---|---|---|---|---|---|---|---|---|
| Dh 136/11-12 | 3.11 | 2.54 | 1.22 | 190 | 230 | 0.61 | 1.39 | 7.61 | 0.58 | 50.19 | 0.50 | 0.53 | 7.86 | 4.01 |
| Dh 171/11-12 | 3.74 | 2.71 | 1.38 | 455 | 237 | 0.62 | 1.21 | 7.24 | 0.58 | 49.33 | 0.60 | 1.05 | 6.74 | 3.87 |
| Dh 164/11-12 | 2.90 | 3.03 | 0.95 | 183 | 392 | 0.55 | 1.16 | 12.11 | 0.23 | 48.28 | 1.03 | 1.85 | 12.97 | 8.25 |
| Dh 169/11-12 | 2.62 | 2.45 | 1.07 | 160 | 382 | 0.58 | 1.59 | 14.93 | 0.74 | 49.82 | 0.92 | 4.08 | 13.89 | 4.57 |
| Dh 170/11-12 | 4.12 | 2.14 | 1.92 | 237 | 237 | 0.56 | 1.24 | 9.02 | 0.62 | 47.88 | 0.72 | 0.59 | 8.80 | 4.78 |
| Dh 172/11-12 | 3.97 | 2.31 | 1.72 | 157 | 192 | 0.58 | 1.68 | 9.29 | 1.19 | 50.32 | 0.43 | 0.59 | 9.99 | 4.12 |
| Dh 114/11-12 | 3.64 | 3.01 | 1.21 | 157 | 259 | 0.64 | 1.56 | 8.34 | 0.60 | 49.09 | 0.64 | 0.76 | 8.88 | 3.90 |
| Ma 141/11-12 | 2.73 | 1.79 | 1.53 | 442 | 210 | 0.60 | 0.99 | 6.29 | 0.49 | 46.83 | 0.57 | 0.71 | 4.94 | 3.55 |
| Ma 113/11-12 | 3.93 | 2.67 | 1.47 | 411 | 257 | 0.68 | 1.18 | 6.79 | 0.65 | 47.34 | 0.65 | 0.96 | 6.62 | 3.97 |
| Ma 128/11-12 | 3.44 | 2.73 | 1.26 | 199 | 237 | 0.64 | 1.45 | 7.71 | 0.70 | 50.76 | 0.59 | 0.91 | 8.17 | 3.92 |
| Ma 173/11-12 | 3.89 | 2.67 | 1.45 | 290 | 233 | 0.82 | 1.43 | 7.74 | 0.84 | 47.76 | 0.80 | 1.18 | 7.87 | 3.57 |
| Ma 193/11-12 | 3.47 | 2.46 | 1.41 | 321 | 236 | 0.61 | 1.29 | 7.26 | 0.67 | 47.48 | 0.75 | 1.12 | 6.87 | 3.70 |
| Ma 194/11-12 | 3.07 | 2.46 | 1.25 | 365 | 229 | 0.59 | 1.22 | 7.07 | 0.64 | 50.50 | 0.65 | 1.17 | 6.75 | 3.91 |
| Ma 199/11-12 | 4.20 | 3.19 | 1.31 | 220 | 258 | 0.65 | 1.41 | 7.77 | 0.95 | 51.47 | 0.97 | 0.90 | 8.25 | 4.13 |
| Ma 200/11-12 | 3.67 | 3.29 | 1.12 | 216 | 280 | 0.61 | 1.58 | 8.09 | 0.56 | 47.33 | 0.78 | 1.09 | 8.75 | 3.98 |
| Ma 8/9-10 | 3.34 | 2.77 | 1.21 | 221 | 239 | 0.62 | 1.40 | 7.47 | 0.51 | 48.44 | 0.62 | 0.74 | 7.72 | 3.95 |
| Ma 109/11-12 | 5.72 | 2.37 | 2.41 | 193 | 323 | 0.61 | 1.89 | 10.64 | 0.94 | 45.96 | 0.63 | 1.51 | 12.05 | 4.17 |
| Ma 104/11-12 | 3.42 | 2.50 | 1.37 | 228 | 224 | 0.59 | 1.41 | 7.22 | 0.75 | 46.88 | 0.54 | 1.18 | 7.44 | 3.68 |
| Ma 106/11-12 | 5.64 | 2.56 | 2.20 | 339 | 327 | 0.63 | 1.65 | 10.14 | 0.55 | 46.04 | 0.69 | 1.08 | 10.58 | 4.29 |
| Ma 110/11-12 | 2.94 | 2.83 | 1.04 | 146 | 237 | 0.62 | 1.50 | 7.51 | 0.54 | 49.61 | 0.59 | 0.75 | 8.08 | 3.87 |
| Ma 9/9-10 | 3.27 | 2.76 | 1.19 | 311 | 253 | 0.67 | 1.30 | 7.67 | 0.57 | 51.31 | 0.56 | 0.78 | 7.53 | 3.89 |
| Ma 129/11-12 | 3.76 | 2.63 | 1.43 | 189 | 252 | 0.61 | 1.42 | 7.82 | 0.53 | 49.70 | 0.62 | 0.93 | 8.54 | 4.22 |
| Bh 142/11-12 | 3.18 | 2.56 | 1.24 | 135 | 233 | 0.61 | 1.40 | 7.70 | 0.52 | 47.74 | 0.62 | 0.74 | 8.03 | 4.07 |
| Yr 145/11-12 | 3.56 | 2.33 | 1.53 | 345 | 233 | 0.56 | 1.27 | 7.22 | 0.55 | 46.21 | 0.80 | 1.10 | 6.62 | 3.68 |
| Yr 182/11-12 | 4.00 | 2.40 | 1.67 | 255 | 235 | 0.58 | 1.30 | 7.59 | 0.85 | 48.70 | 1.18 | 1.25 | 7.18 | 3.81 |
| Yr 184/11-12 | 5.34 | 3.62 | 1.47 | 545 | 402 | 0.58 | 1.13 | 5.54 | 0.49 | 47.17 | 1.37 | 0.95 | 5.29 | 3.74 |
| Yr 148 (2)/11-12 | 6.44 | 4.65 | 1.39 | 279 | 421 | 0.60 | 1.66 | 6.28 | 0.60 | 46.96 | 1.87 | 1.74 | 7.28 | 3.77 |
| Yr 148/11-12 | 6.84 | 5.14 | 1.33 | 223 | 449 | 0.59 | 1.84 | 6.63 | 0.63 | 48.10 | 1.66 | 1.84 | 8.13 | 3.76 |
| Yr 183/11-12 | 3.23 | 2.75 | 1.18 | 267 | 226 | 0.64 | 1.33 | 7.41 | 0.70 | 49.68 | 0.62 | 0.80 | 7.10 | 4.10 |
Publisher’s Note: MDPI stays neutral with regard to jurisdictional claims in published maps and institutional affiliations. |
© 2022 by the authors. Licensee MDPI, Basel, Switzerland. This article is an open access article distributed under the terms and conditions of the Creative Commons Attribution (CC BY) license (https://creativecommons.org/licenses/by/4.0/).
Share and Cite
Dasgupta, S.; Banerjee, S.; Ghosh, P. Petrographical and Geochemical Study of Syn-Rift Sediments, Pranhita-Godavari Intracratonic Gondwana Basin, India: Genesis and Paleo-Environmental Implications. Geosciences 2022, 12, 230. https://doi.org/10.3390/geosciences12060230
Dasgupta S, Banerjee S, Ghosh P. Petrographical and Geochemical Study of Syn-Rift Sediments, Pranhita-Godavari Intracratonic Gondwana Basin, India: Genesis and Paleo-Environmental Implications. Geosciences. 2022; 12(6):230. https://doi.org/10.3390/geosciences12060230
Chicago/Turabian StyleDasgupta, Sanghita, Santanu Banerjee, and Parthasarathi Ghosh. 2022. "Petrographical and Geochemical Study of Syn-Rift Sediments, Pranhita-Godavari Intracratonic Gondwana Basin, India: Genesis and Paleo-Environmental Implications" Geosciences 12, no. 6: 230. https://doi.org/10.3390/geosciences12060230