
OH-Defects in Detrital Quartz Grains from the Julian Basin (NE Italy and Slovenia): A Fourier Transform Infrared Study


Abstract
:1. Introduction
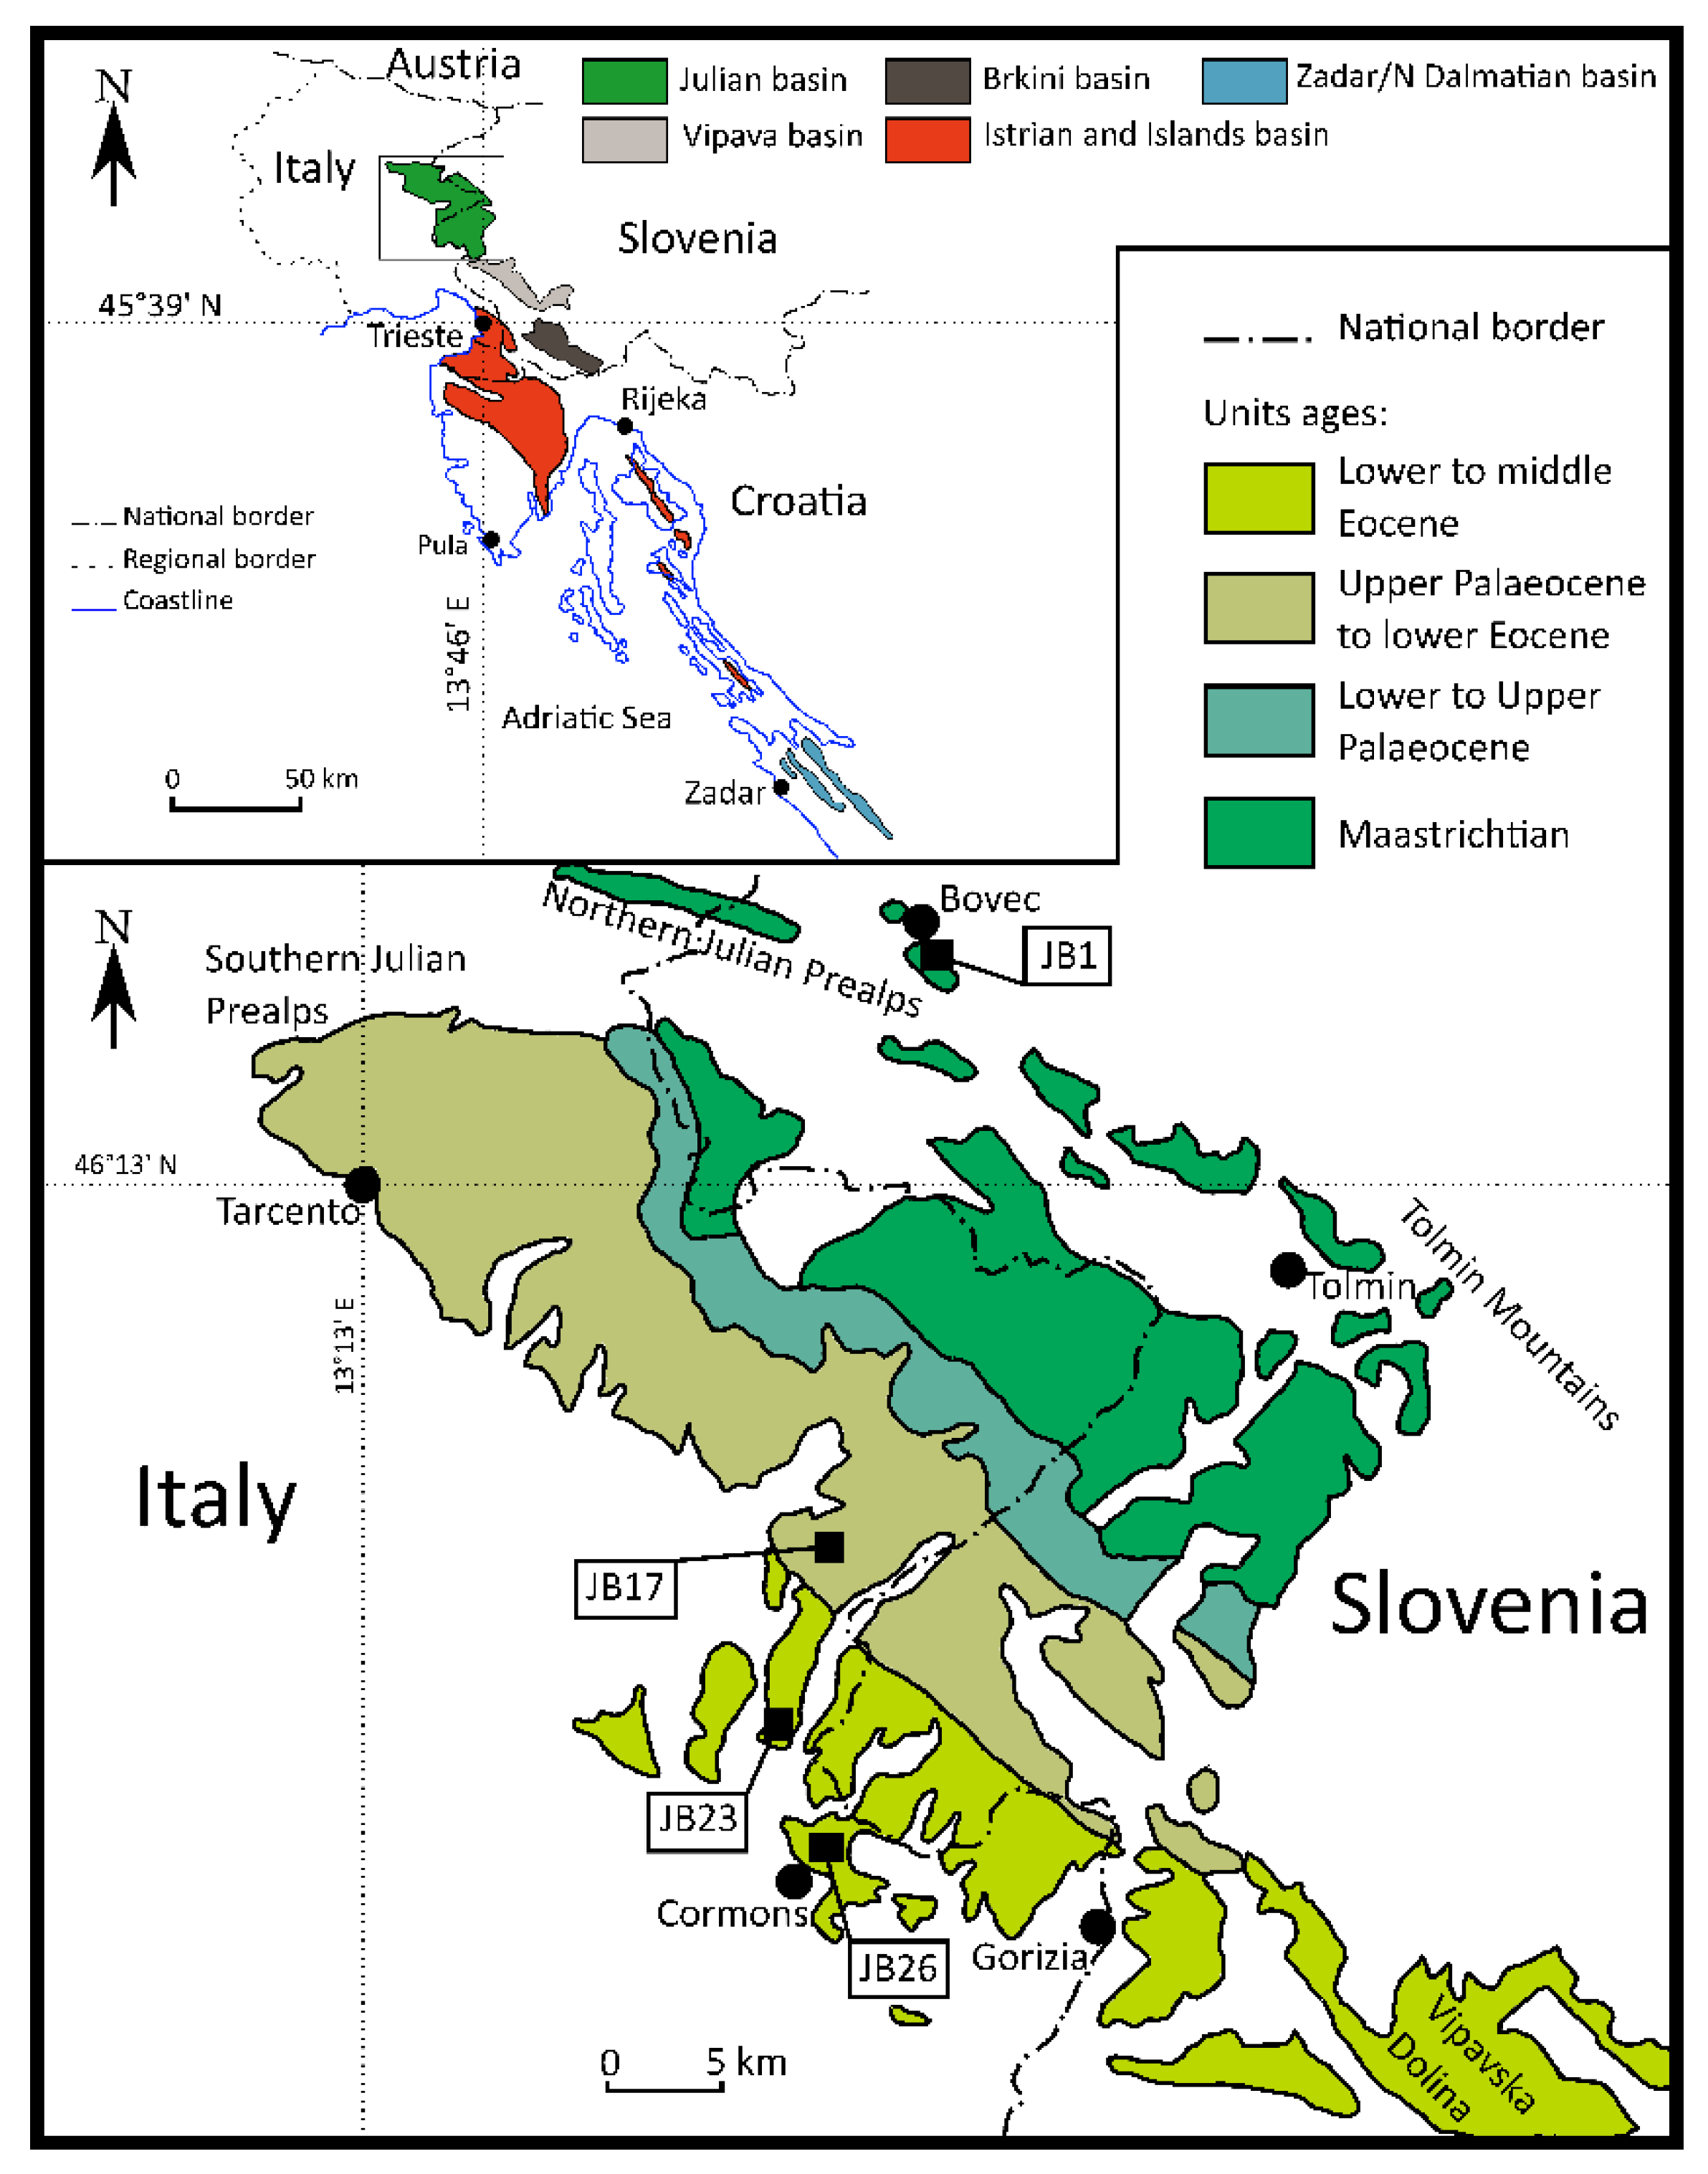
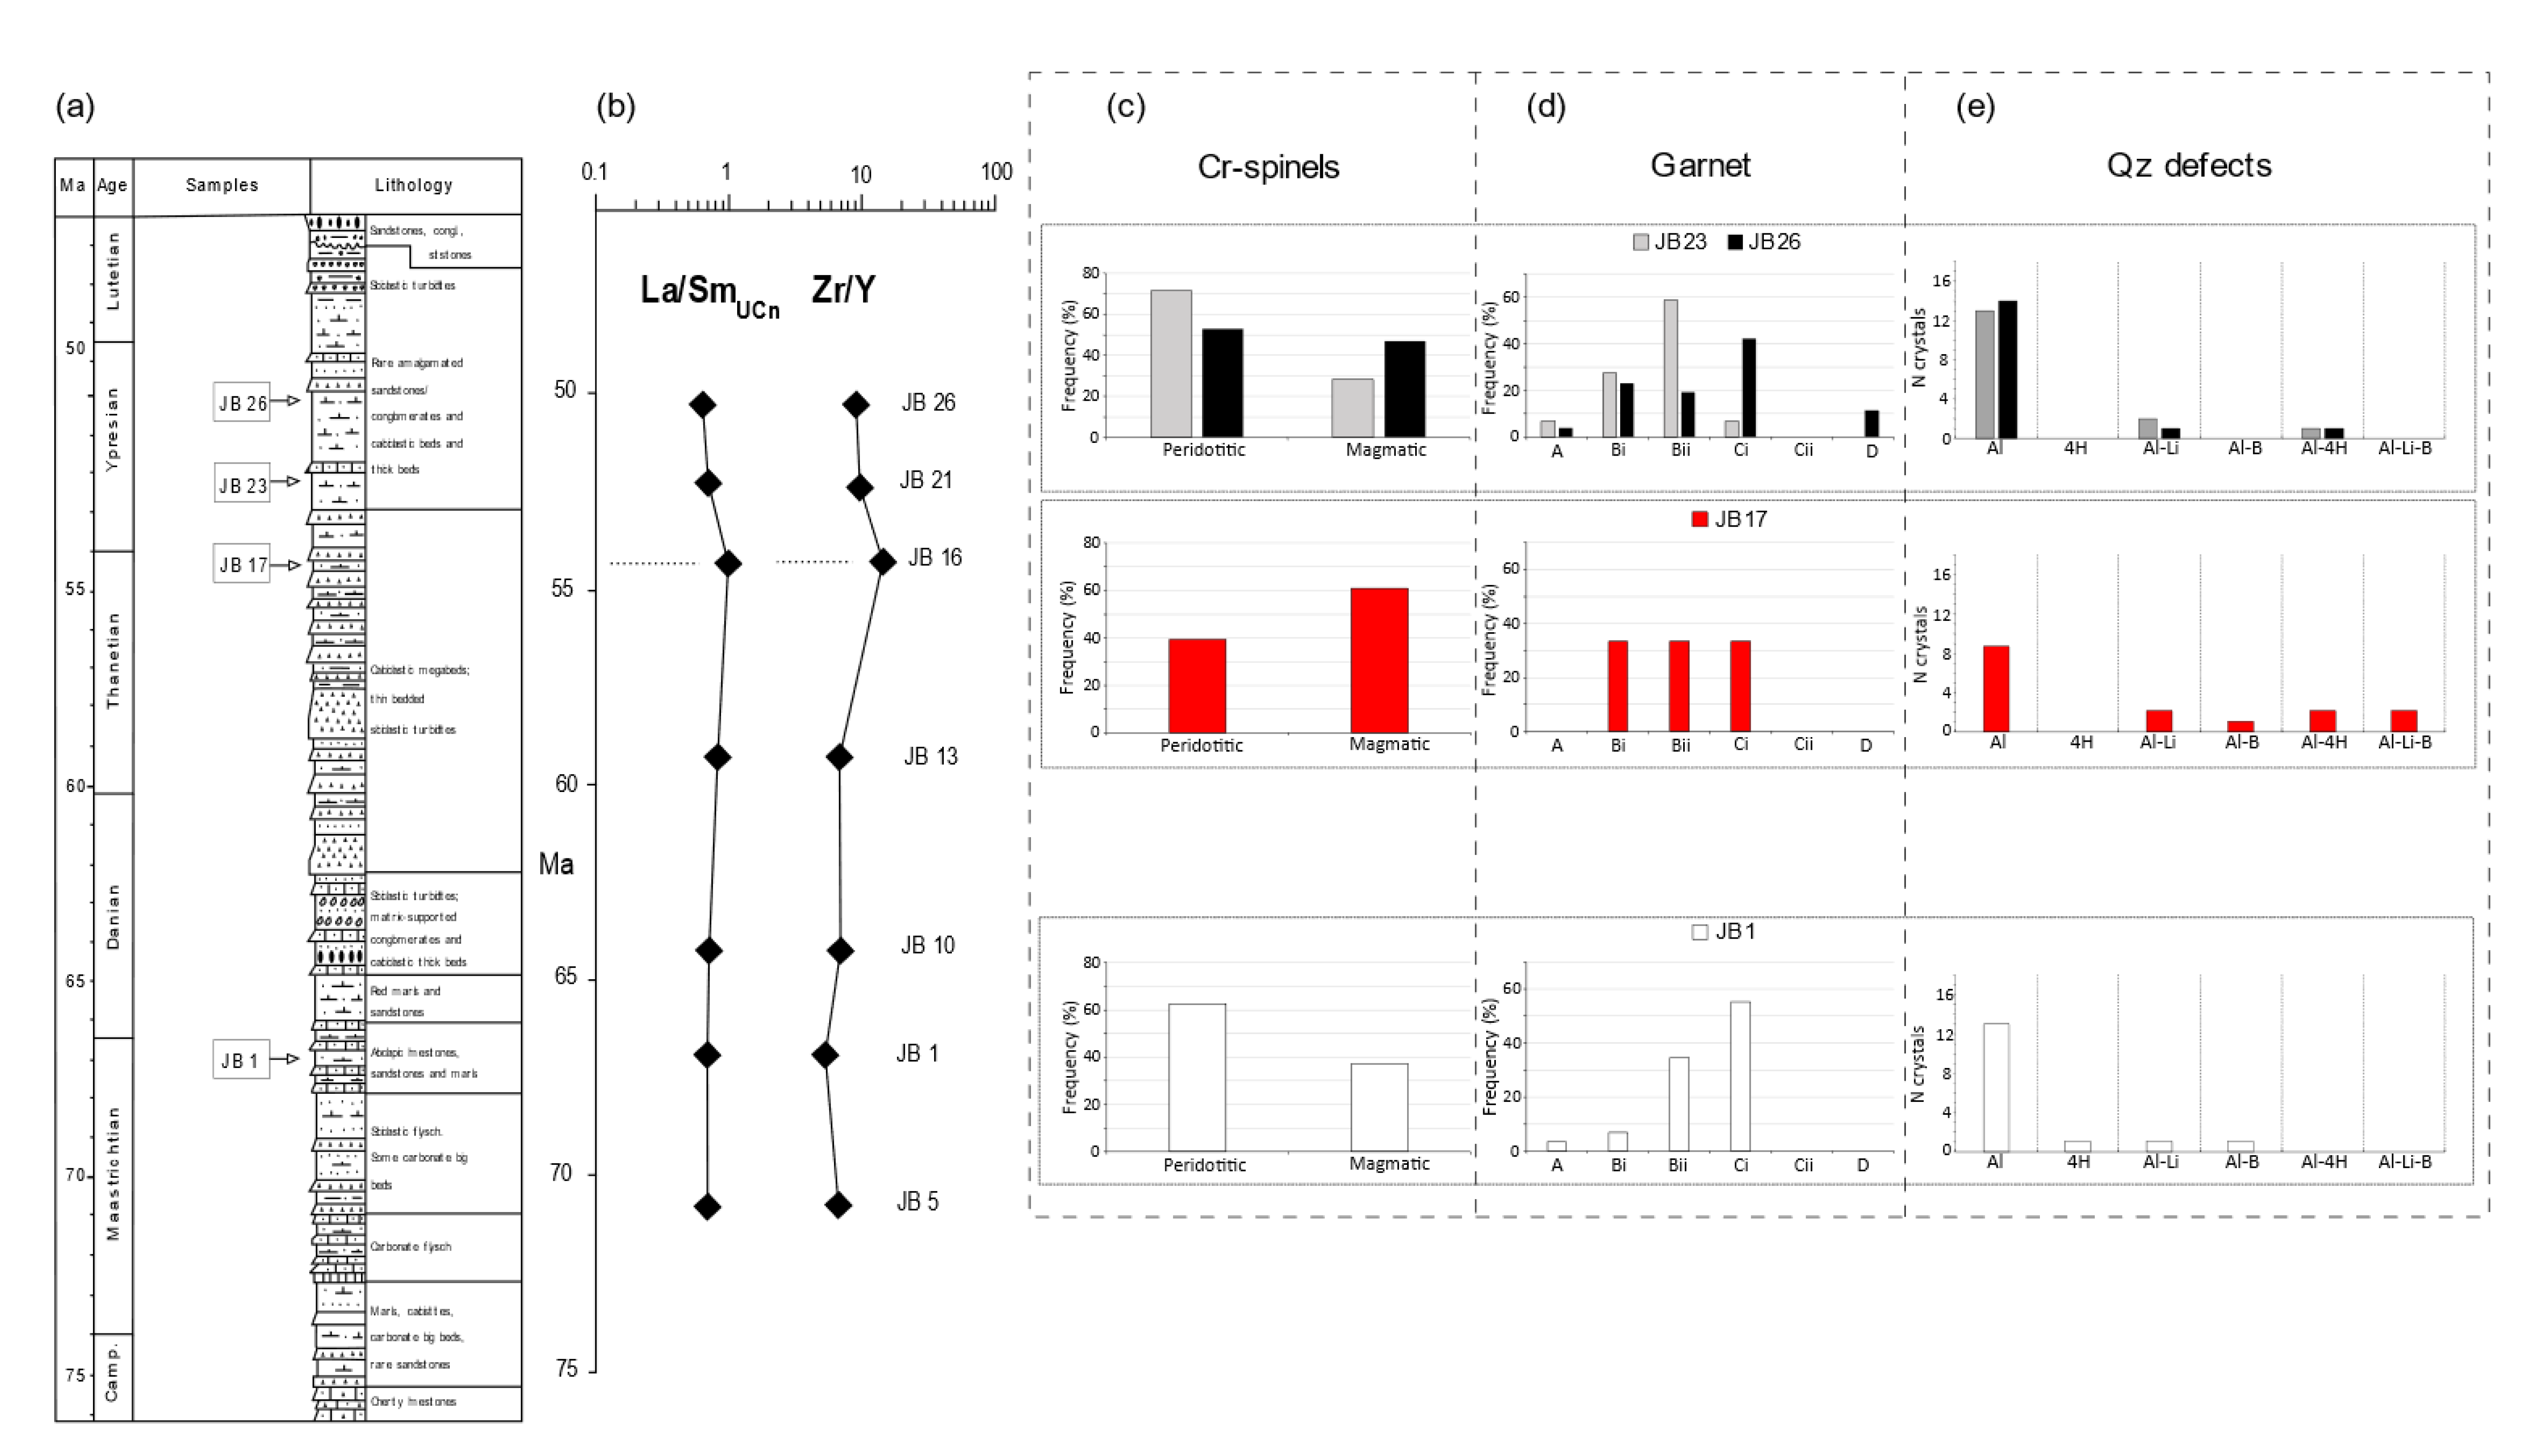
1.1. Geological Setting

1.2. Previous Studies and the OH-Defect Method
2. Materials and Methods
2.1. Sample Preparation
2.2. FTIR Spectroscopy and Water Quantification
3. Results
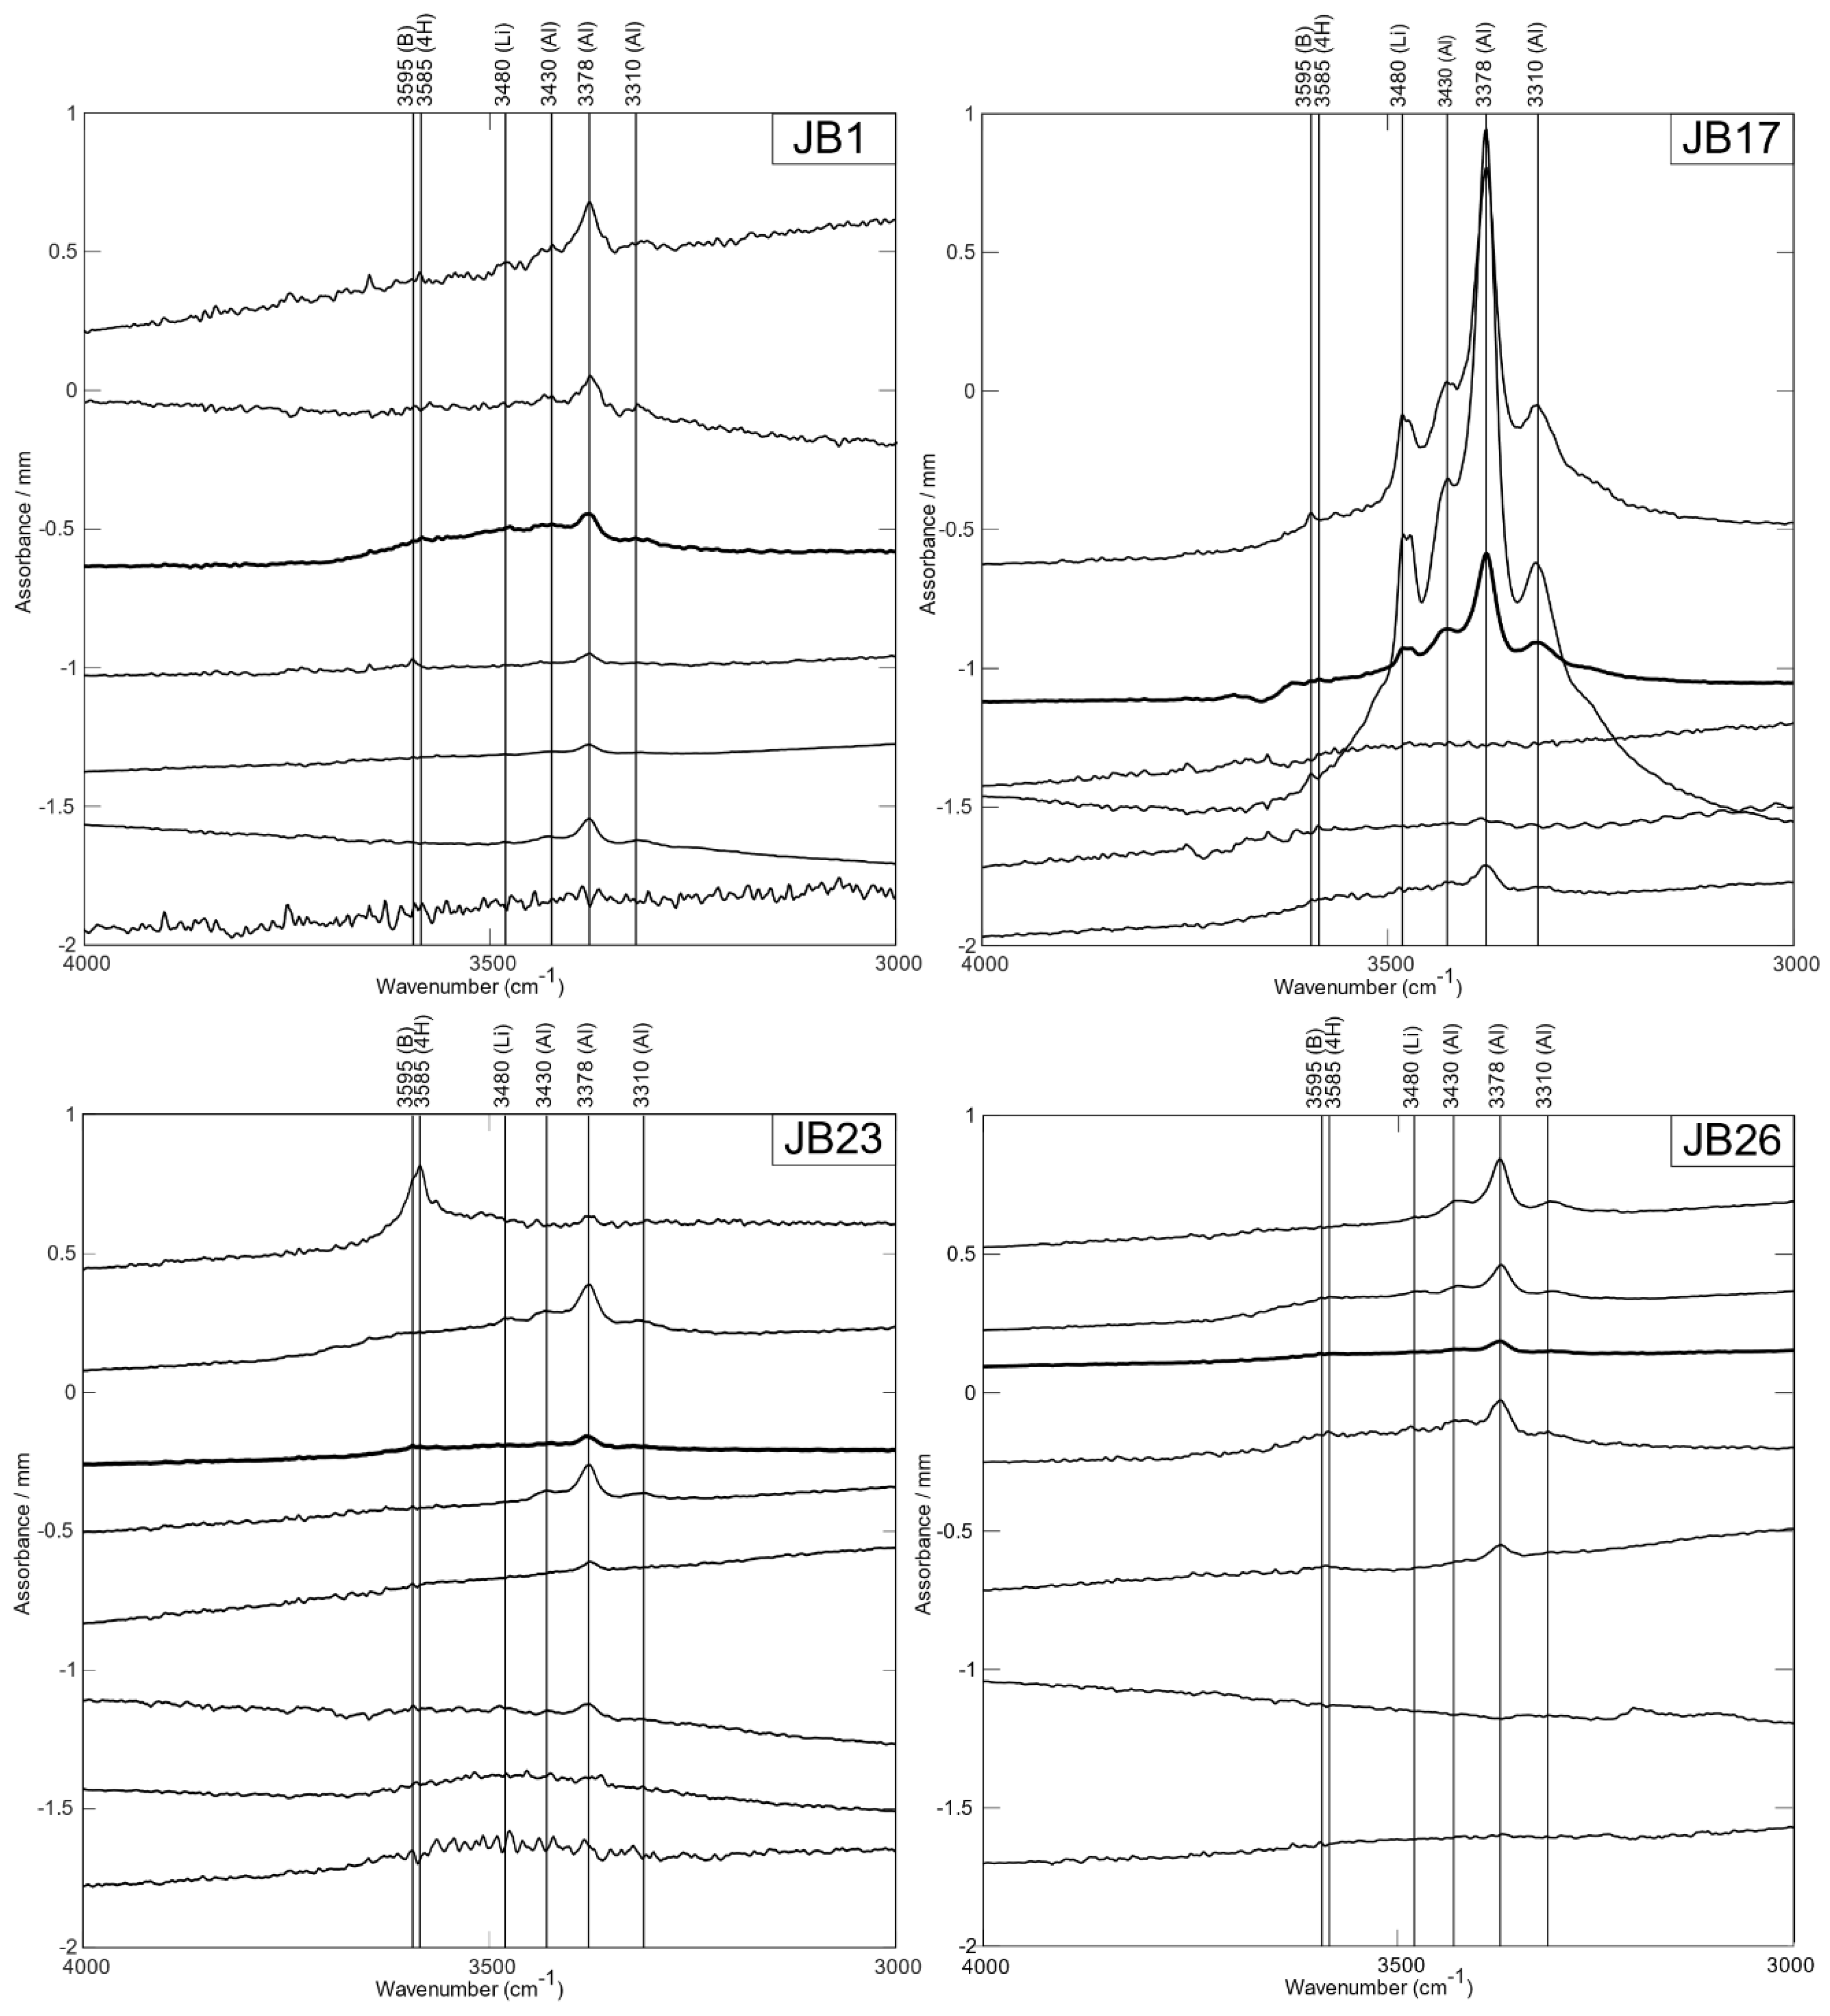
3.1. IR Spectra
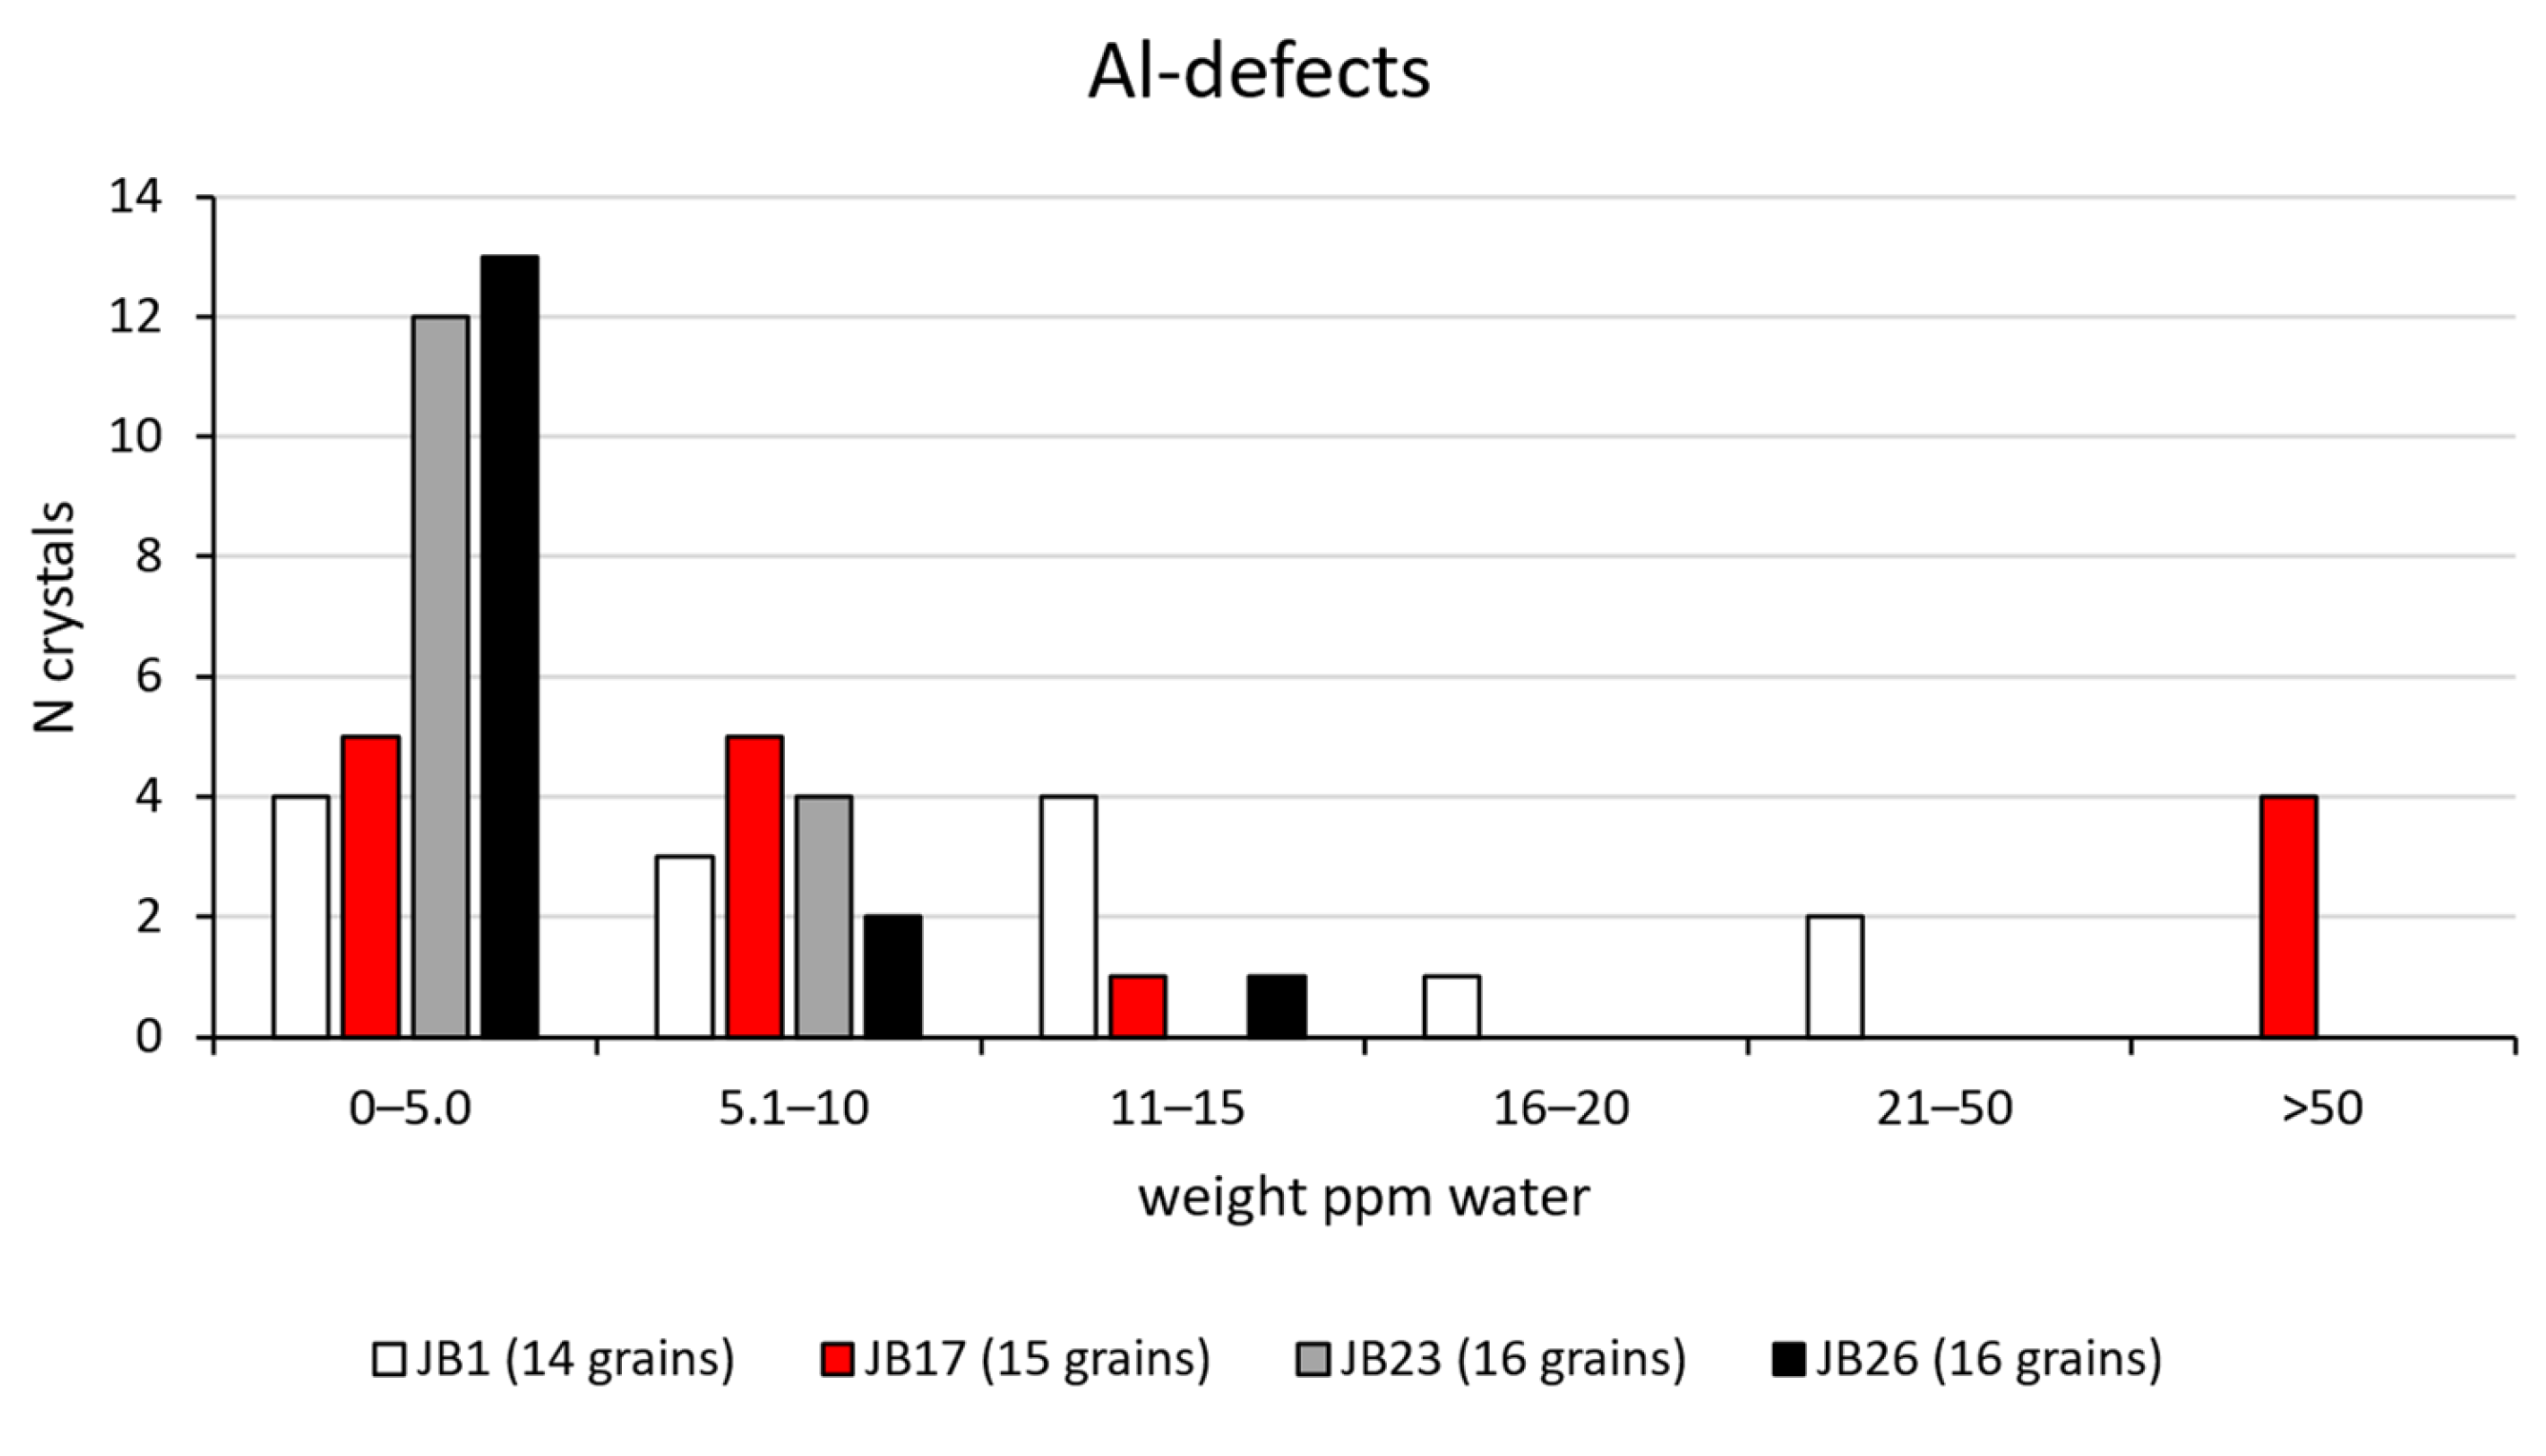
3.2. Defect Water Content
3.2.1. Al-Related Defects
3.2.2. Li-Related Defects
3.2.3. 4H-Related Defects
3.2.4. B-Related Defects
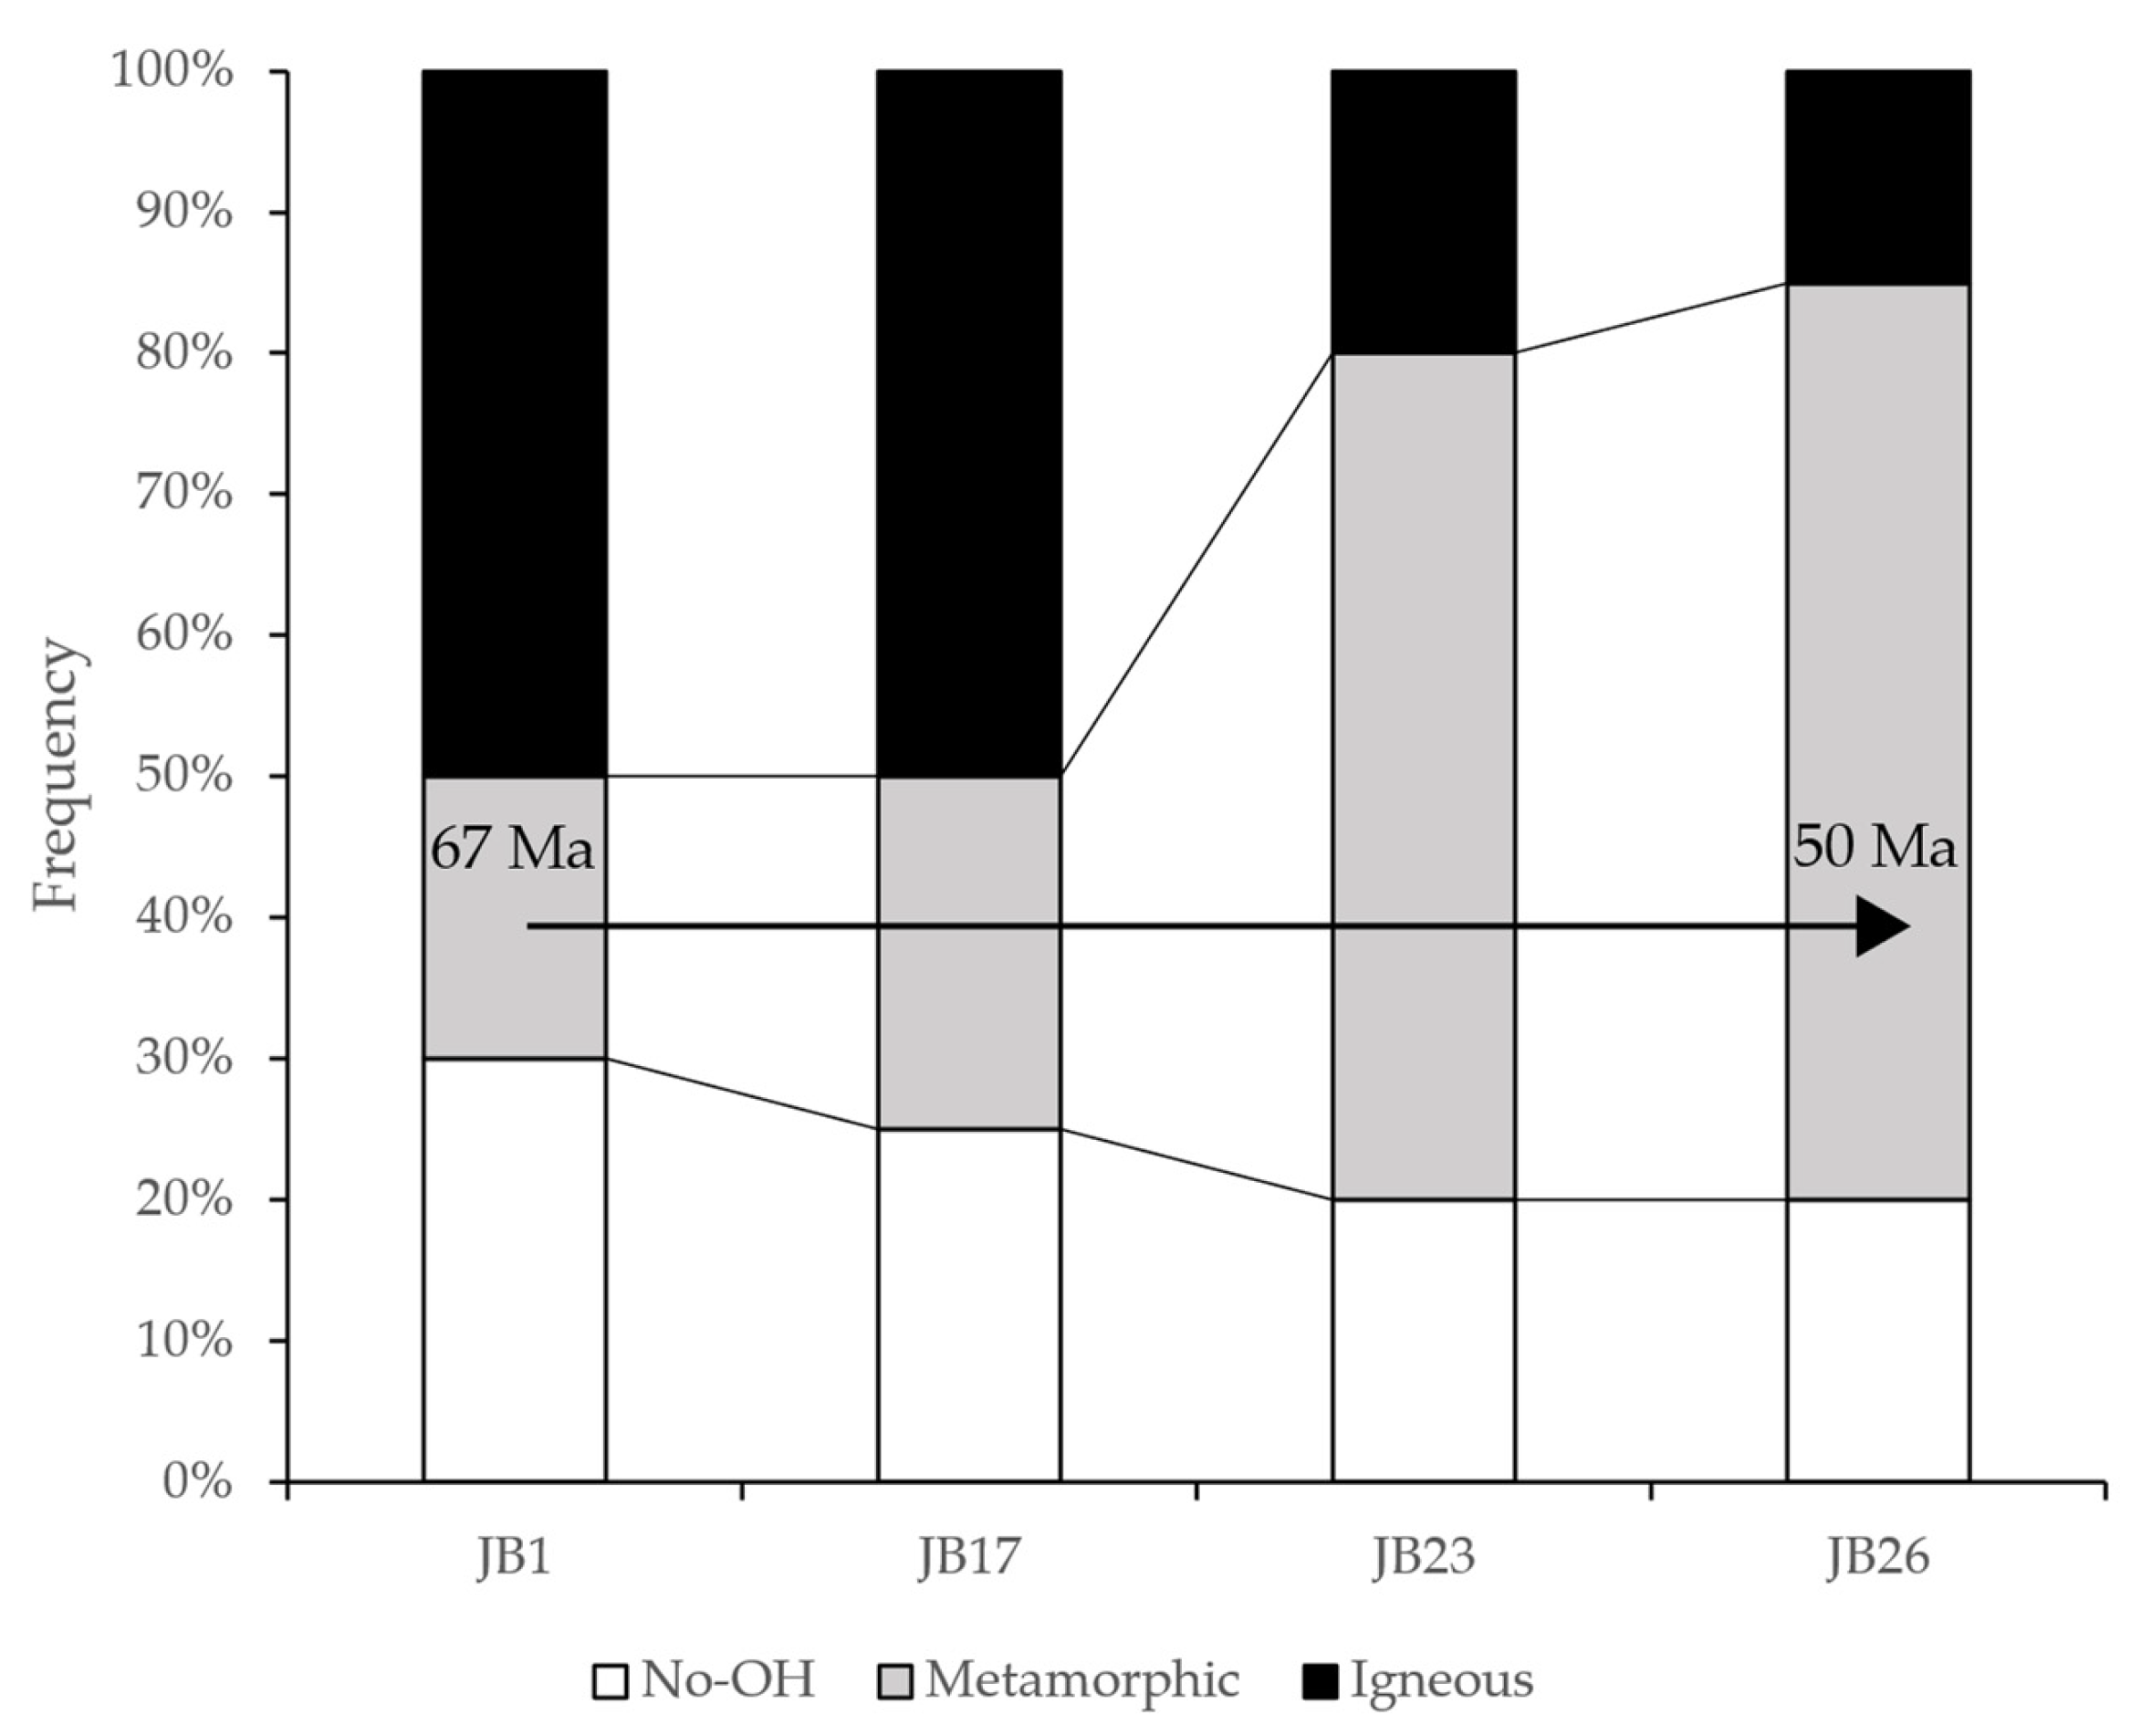
4. Discussion
5. Conclusions
Author Contributions
Funding
Data Availability Statement
Acknowledgments
Conflicts of Interest
Appendix A

| Sample | Thickness | Wavenumber | Absorption Integration | Density | ε | H2O ppm [34] | ε | H2O ppm [25] | Defect |
|---|---|---|---|---|---|---|---|---|---|
| JB1_001 | 215 | 3375 | 1.44 | 2.65 | 89,000 | 10 | 93,220 | 9.8 | Al |
| JB1_002 | 230 | ND | ND | 2.65 | 89,000 | ND | ND | ND | - |
| JB1_003 | 260 | ND | ND | 2.65 | 89,000 | ND | ND | ND | - |
| JB1_004 | 276 | ND | ND | 2.65 | 89,000 | ND | ND | ND | - |
| JB1_005 | 144 | 3585 | 0.25 | 2.65 | 89,000 | 2.6 | 41,430 | 5.7 | 4H+ |
| JB1_006 | 171 | 3370 | 0.56 | 2.65 | 89,000 | 5.0 | 94,450 | 4.7 | Al |
| JB1_007 | 147 | 3371 | 2.81 | 2.65 | 89,000 | 29 | 94,200 | 28 | Al |
| JB1_008 | 175 | 3368 | 0.49 | 2.65 | 89,000 | 4.3 | 94,940 | 4.0 | Al |
| JB1_009 | 181 | 3369 | 1.34 | 2.65 | 89,000 | 11 | 94,690 | 11 | Al |
| JB1_010 | 146 | ND | ND | 2.65 | 89,000 | ND | ND | ND | - |
| JB1_011 | 254 | 3380 | 0.41 | 2.65 | 89,000 | 2.5 | 91,980 | 2.4 | Al |
| JB1_012 | 73 | 3379 | 0.60 | 2.65 | 89,000 | 13 | 92,230 | 12 | Al |
| JB1_013 | 179 | ND | ND | 2.65 | 89,000 | ND | ND | ND | - |
| JB1_014 | 153 | 3374 | 1.66 | 2.65 | 89,000 | 17 | 93,460 | 16 | Al |
| JB1_015 | 63 | 3370 | 0.52 | 2.65 | 89,000 | 13 | 94,450 | 12 | Al |
| JB1_016 | 128 | 3368 | 1.89 | 2.65 | 89,000 | 23 | 94,940 | 21 | Al |
| 3480 | 0.21 | 2.65 | 89,000 | 2.5 | 67,320 | 3.3 | Li | ||
| JB1_017 | 187 | 3365 | 0.83 | 2.65 | 89,000 | 6.8 | 95,680 | 6.3 | Al |
| JB1_018 | 158 | 3364 | 0.59 | 2.65 | 89,000 | 5.7 | 95,930 | 5.3 | Al |
| JB1_019 | 280 | 3378 | 0.52 | 2.65 | 89,000 | 2.8 | 92,480 | 2.7 | Al |
| 3595 | 0.09 | 2.65 | 89,000 | 0.5 | 38,960 | 1.1 | B | ||
| JB1_020 | 218 | 3380 | 0.73 | 2.65 | 89,000 | 5.1 | 91,980 | 5.0 | Al |
| JB17_001 | 251 | 3379 | 1.09 | 2.65 | 89,000 | 6.6 | 92,230 | 6.4 | Al |
| JB17_002 | 189 | ND | ND | 2.65 | 89,000 | ND | ND | ND | - |
| JB17_003 | 107 | 3371 | 0.21 | 2.65 | 89,000 | 3.0 | 94,200 | 0.3 | Al |
| 3585 | 0.01 | 2.65 | 89,000 | 0.1 | 41,430 | 0.3 | 4H+ | ||
| JB17_004 | 162 | 3367 | 22.75 | 2.65 | 89,000 | 214 | 95,190 | 200 | Al |
| 3480 | 1.04 | 2.65 | 89,000 | 9.8 | 67,320 | 13 | Li | ||
| JB17_005 | 180 | 3370 | 0.75 | 2.65 | 89,000 | 6.4 | 94,450 | 6.0 | Al |
| JB17_006 | 104 | ND | ND | 2.65 | 89,000 | ND | ND | ND | - |
| JB17_007 | 165 | 3376 | 1.46 | 2.65 | 89,000 | 14 | 92,970 | 13 | Al |
| 3480 | 0.2 | 2.65 | 89,000 | 1.9 | 67,320 | 2.5 | Li | ||
| JB17_008 | 197 | 3372 | 0.23 | 2.65 | 89,000 | 1.8 | 93,960 | 1.7 | Al |
| JB17_009 | 237 | 3371 | 0.25 | 2.65 | 89,000 | 1.6 | 94,200 | 1.5 | Al |
| JB17_010 | 149 | ND | ND | 2.65 | 89,000 | ND | ND | ND | - |
| JB17_011 | 224 | 3368 | 0.33 | 2.65 | 89,000 | 2.3 | 94,940 | 2.1 | Al |
| 3595 | 0.02 | 2.65 | 89,000 | 0.1 | 38,960 | 0.3 | B | ||
| JB17_012 | 110 | 3377 | 0.57 | 2.65 | 89,000 | 7.9 | 92,720 | 7.6 | Al |
| JB17_013 | 200 | ND | ND | 2.65 | 89,000 | ND | ND | ND | - |
| JB17_014 | 207 | 3365 | 0.23 | 2.65 | 89,000 | 1.7 | 95,680 | 1.6 | Al |
| JB17_015 | 221 | 3378 | 1.49 | 2.65 | 89,000 | 10 | 92,480 | 9.9 | Al |
| JB17_016 | 144 | 3371 | 10.55 | 2.65 | 89,000 | 112 | 94,200 | 106 | Al |
| 3585 | 0.09 | 2.65 | 89,000 | 1.0 | 41,430 | 2.1 | 4H+ | ||
| JB17_017 | 162 | 3363 | 14.91 | 2.65 | 89,000 | 140 | 96,170 | 130 | Al |
| 3480 | 1.58 | 2.65 | 89,000 | 15 | 67,320 | 20 | Li | ||
| 3595 | 0.06 | 2.65 | 89,000 | 0.6 | 38,960 | 1.3 | B | ||
| JB17_018 | 171 | ND | ND | 2.65 | 89,000 | ND | ND | ND | - |
| JB17_019 | 233 | 3369 | 12.05 | 2.65 | 89,000 | 79 | 94,690 | 74 | Al |
| 3480 | 1.27 | 2.65 | 89,000 | 8.3 | 67,320 | 11 | Li | ||
| 3595 | 0.08 | 2.65 | 89,000 | 0.5 | 38,960 | 1.2 | B | ||
| JB17_020 | 177 | 3370 | 0.74 | 2.65 | 89,000 | 6.4 | 94,450 | 6.0 | Al |
| JB23_001 | 283 | 3373 | 0.21 | 2.65 | 89,000 | 1.1 | 93,700 | 1.1 | Al |
| JB23_002 | 129 | 3362 | 0.3 | 2.65 | 89,000 | 3.6 | 96,420 | 3.3 | Al |
| JB23_003 | 206 | 3373 | 0.32 | 2.65 | 89,000 | 2.4 | 93,710 | 2.3 | Al |
| JB23_004 | 251 | 3371 | 0.27 | 2.65 | 89,000 | 1.6 | 94,200 | 1.6 | Al |
| JB23_005 | 242 | ND | ND | 2.65 | 89,000 | ND | ND | ND | - |
| JB23_006 | 199 | ND | ND | 2.65 | 89,000 | ND | ND | ND | - |
| JB23_007 | 279 | 3372 | 0.39 | 2.65 | 89,000 | 2.1 | 93,960 | 2.0 | Al |
| JB23_008 | 238 | 3364 | 0.53 | 2.65 | 89,000 | 3.4 | 95,930 | 3.2 | Al |
| 3585 | 0.14 | 2.65 | 89,000 | 0.9 | 41,430 | 1.9 | 4H+ | ||
| JB23_009 | 186 | 3367 | 0.79 | 2.65 | 89,000 | 6.5 | 95,190 | 6.1 | Al |
| JB23_010 | 245 | 3365 | 0.14 | 2.65 | 89,000 | 0.9 | 95,680 | 0.8 | Al |
| JB23_011 | 215 | 3368 | 0.15 | 2.65 | 89,000 | 1.1 | 94,940 | 1.0 | Al |
| JB23_012 | 167 | 3373 | 0.78 | 2.65 | 89,000 | 7.1 | 93,710 | 6.8 | Al |
| JB23_013 | 93 | ND | ND | 2.65 | 89,000 | ND | ND | ND | - |
| JB23_014 | 179 | 3369 | 0.34 | 2.65 | 89,000 | 2.9 | 94,690 | 2.7 | Al |
| JB23_015 | 197 | 3375 | 0.3 | 2.65 | 89,000 | 2.3 | 93,220 | 2.2 | Al |
| JB23_016 | 167 | 3367 | 0.41 | 2.65 | 89,000 | 3.8 | 95,190 | 3.5 | Al |
| 3480 | 0.07 | 2.65 | 89,000 | 0.6 | 67,320 | 0.9 | Li | ||
| JB23_017 | 206 | 3374 | 0.14 | 2.65 | 89,000 | 1.0 | 93,460 | 1.0 | Al |
| JB23_018 | 162 | 3373 | 0.71 | 2.65 | 89,000 | 6.7 | 93,710 | 6.4 | Al |
| JB23_019 | 191 | 3375 | 1.09 | 2.65 | 89,000 | 8.7 | 93,220 | 8.3 | Al |
| 3480 | 0.03 | 2.65 | 89,000 | 0.2 | 67,320 | 0.3 | Li | ||
| JB23_020 | 202 | ND | ND | 2.65 | 89,000 | ND | ND | ND | - |
| JB26_001 | 209 | 3375 | 0.11 | 2.65 | 89,000 | 0.8 | 93,220 | 0.8 | Al |
| JB26_002 | 211 | 3372 | 0.94 | 2.65 | 89,000 | 6.8 | 93,960 | 6.4 | Al |
| 3480 | 0.02 | 2.65 | 89,000 | 0.1 | 67,320 | 0.2 | Li | ||
| JB26_003 | 197 | 3372 | 0.36 | 2.65 | 89,000 | 2.8 | 93,960 | 2.6 | Al |
| JB26_004 | 186 | 3377 | 1.63 | 2.65 | 89,000 | 13 | 92,720 | 13 | Al |
| JB26_005 | 287 | 3367 | 0.3 | 2.65 | 89,000 | 1.6 | 95,190 | 1.5 | Al |
| JB26_006 | 233 | ND | ND | 2.65 | 89,000 | ND | ND | ND | - |
| JB26_007 | 270 | 3369 | 0.47 | 2.65 | 89,000 | 2.7 | 94,690 | 2.5 | Al |
| JB26_008 | 223 | ND | ND | 2.65 | 89,000 | ND | ND | ND | - |
| JB26_009 | 186 | ND | ND | 2.65 | 89,000 | ND | ND | ND | - |
| JB26_010 | 256 | ND | ND | 2.65 | 89,000 | ND | ND | ND | - |
| JB26_011 | 252 | 3376 | 0.34 | 2.65 | 89,000 | 2.1 | 92,970 | 2.0 | Al |
| JB26_012 | 242 | 3366 | 0.24 | 2.65 | 89,000 | 1.5 | 95,430 | 1.4 | Al |
| JB26_013 | 104 | 3362 | 0.29 | 2.65 | 89,000 | 4.3 | 96,420 | 4.0 | Al |
| JB26_014 | 181 | 3374 | 0.15 | 2.65 | 89,000 | 1.3 | 93,460 | 1.2 | Al |
| JB26_015 | 218 | 3374 | 0.31 | 2.65 | 89,000 | 2.2 | 93,460 | 2.1 | Al |
| JB26_016 | 270 | 3374 | 1.41 | 2.65 | 89,000 | 8.0 | 93,460 | 7.6 | Al |
| JB26_017 | 235 | 3367 | 0.36 | 2.65 | 89,000 | 2.3 | 95,190 | 2.2 | Al |
| JB26_018 | 90 | 3374 | 0.16 | 2.65 | 89,000 | 2.7 | 93,460 | 2.6 | Al |
| JB26_019 | 140 | 3362 | 0.24 | 2.65 | 89,000 | 2.6 | 96,420 | 2.4 | Al |
| JB26_020 | 163 | 3370 | 0.39 | 2.65 | 89,000 | 3.7 | 94,450 | 3.4 | Al |
| 3585 | 0.02 | 2.65 | 89,000 | 0.2 | 41,430 | 0.4 | 4H+ |
References
- Doglioni, C.; Flores, G. An Introduction to the Italian Geology; LAMISCO: Potenza, Italy, 1997. [Google Scholar]
- Robertson, A.H.F.; Karamata, S. The role of subduction-accretion processes in the tectonic evolution of the Mesozoic Tethys in Serbia. Tectonophysics 1994, 234, 73–94. [Google Scholar] [CrossRef]
- Channell, J.E.T.; Kozur, H.W. How many oceans? Meliata, Vardar, and Pindos oceans in Mesozoic Alpine paleogeography. Geology 1997, 25, 183–186. [Google Scholar] [CrossRef]
- Venturini, S.; Tunis, G. La composizione dei conglomerati cenozoici del Friuli: Dati preliminari. Stud. Geol. Camerti 1992, 2, 285–295. [Google Scholar]
- Ogorelec, B.; Šribar, L.; Buser, S. On lithology and biostratigraphy of Volce Limestone. Geologija 1976, 19, 126–151. [Google Scholar]
- Tunis, G.; Pirini Radrizzani, C. Flyschoid deposits of Goriska Brda (Collio) between Soča (Isonzo) River and Idrija (Iudrio) River —Facies and paleoenvironments. Geologija 1987, 30, 123–148. [Google Scholar]
- Pavlovec, R.; Knez, M.; Drobne, K.; Pavšic, J. Profiles: Košana, Sv. Trojica and Leskovec; the disintegration of the carbonate platform. In Field Trip Guidebook. ICGP Project 286—Early Paleogene Benthos; UNESCO: Paris, France, 1991; pp. 69–72. [Google Scholar]
- Tunis, G.; Venturini, S. L’Eocene delle Prealpi Carniche, dell’altipiano di Brkini e dell’Istria: Precisazioni biostratigrafiche e paleoambientali. Nat. Nascosta 1996, 13, 40–49. [Google Scholar]
- Magdalenić, Z. Sedimentology of Central Istra Flysch deposits. Acta Geol. Zagreb 1972, 7, 71–100, (In Croatian with English Summary). [Google Scholar]
- Miklavić, B.; Rožić, B. The onset of Maastrichtian basinal sedimentation on Mt. Matajur, NW Slovenia. RMZ—Mater. Geoenvironment 2008, 55, 199–214. [Google Scholar]
- De Min, A.; Rosset, A.; Tunis, G.; Kocmann, C.; Tosone, A.; Lenaz, D. Igneous rock clasts from the Maastrichtian Bovec flysch (Slovenia): Petrology and geodynamic aspects. Geol. Carpath. 2007, 58, 169–179. [Google Scholar]
- Velicogna, M. Zircon Dating and Trace Element Content of Transparent Heavy Minerals in Sandstones from the NE Alps and Outer Dinarides Flysch Basins. Ph.D. Thesis, University of Trieste, Trieste, Italy, 2020. [Google Scholar]
- Lenaz, D.; Kamenetsky, V.S.; Crawford, A.J.; Princivalle, F. Melt inclusions in detrital spinel from SE Alps (Italy-Slovenia): A new approach to provenance studies of sedimentary basins. Contrib. Mineral. Petrol. 2000, 139, 748–758. [Google Scholar] [CrossRef]
- Lenaz, D.; Mazzoli, C.; Velicogna, M.; Princivalle, F. Trace and Rare Earth Elements chemistry of detrital garnets in the SE Alps and Outer Dinarides flysch basins: An important tool to better define the source areas of sandstones. Mar. Pet. Geol. 2018, 98, 653–661. [Google Scholar] [CrossRef]
- Lenaz, D.; Princivalle, F. Detrital high pressure—Low temperature minerals in Lower Eocene deep-sea turbidites of the Julian Alps (NE Italy). Period. Mineral. 2002, 71, 127–135. [Google Scholar] [CrossRef]
- Lenaz, D.; Princivalle, F. The crystal chemistry of detrital chromian spinel from the Southeastern Alps and Outer Dinarides: The discrimination of supplies from areas of similar tectonic setting? Canad. Mineral. 2005, 43, 1305–1314. [Google Scholar] [CrossRef]
- De Min, A.; Princivalle, F.; Lenaz, D. Geochemistry of the Late Mesozoic—Early Cenozoic turbidites from the NE part of Adria microplate. Period. Mineral. 2014, 83, 141–158. [Google Scholar] [CrossRef]
- Stalder, R. OH-defects content in detrital quartz grains as an archive for crystallisation conditions. Sediment. Geol. 2014, 307, 1–6. [Google Scholar] [CrossRef]
- Stalder, R.; Konzett, J. OH defects in quartz in the system quartz-albite-water and granite-water between 5 and 25 kbar. Phys. Chem. Miner. 2012, 39, 817–827. [Google Scholar] [CrossRef]
- Stalder, R. OH point defects in quartz—A review. Eur. J. Mineral. 2021, 33, 145–163. [Google Scholar] [CrossRef]
- Bambauer, H.U. Spurenelementgehalte und γ-Farbzentren in Quartzen aus Zerrklüften der Schweizen Alpen. Schweiz. Miner. Petrogr. Mitt. 1961, 41, 335–369. [Google Scholar]
- Kats, A. Hydrogen in alpha quartz. Philips Res. Rep. 1962, 17, 133–279. [Google Scholar]
- Aines, R.D.; Rossman, G.R. Water in minerals? A peak in the infrared. J. Geophys. Res. 1984, B89, 4059–4071. [Google Scholar] [CrossRef]
- Aines, R.D.; Kirby, S.H.; Rossman, G.R. Hydrogen speciation in synthetic quartz. Phys. Chem. Miner. 1984, 11, 204–212. [Google Scholar] [CrossRef]
- Libowitzky, E.; Rossman, G. An IR absorption calibration for water in minerals. Am. Mineral. 1997, 82, 1111–1115. [Google Scholar] [CrossRef]
- Müller, A.; Koch-Müller, M. Hydrogen speciation and trace elements contents of igneous, hydrothermal and metamorphic quartz from Norway. Mineral. Mag. 2009, 73, 569–583. [Google Scholar] [CrossRef]
- Stalder, R.; Neuser, R.D. OH-defects in detrital quartz grains: Potential for application as tool for provenance analysis ad overview over crustal average. Sediment. Geol. 2013, 294, 118–126. [Google Scholar] [CrossRef]
- Stalder, R.; Potrafke, A.; Billström, K.; Skogby, H.; Meinhold, G.; Gögele, C.; Berberich, T. OH defects in quartz as monitor for igneous, metamorphic, and sedimentary processes. Am. Mineral. 2017, 102, 1832–1842. [Google Scholar] [CrossRef]
- Potrafke, A.; Breiter, K.; Ludwig, T.; Neuser, R.D.; Stalder, R. Variations of OH defects and chemical impurities in natural quartz within igneous bodies. Phys. Chem. Miner. 2020, 47, 24. [Google Scholar] [CrossRef]
- Stalder, R.; von Eynatten, H.; Costamoling, J.; Potrafke, A.; Dunkl, I.; Meinhold, G. OH in detrital quartz grains as tool for provenance analysis: Case studies on various settings from Cambrian to Recent. Sediment. Geol. 2019, 389, 121–126. [Google Scholar] [CrossRef]
- Jaeger, D.; Stalder, R.; Masago, H.; Strasser, M. OH defects in quartz as a provenance tool: Application to fluvial and deep marine sediments from SW Japan. Sediment. Geol. 2019, 338, 66–80. [Google Scholar] [CrossRef]
- Paterson, M.S. The determination of hydroxyl by infrared absorption in quartz, silicate glasses and similar material. Bull. Minéral. 1982, 105, 20–29. [Google Scholar] [CrossRef]
- Rossman, G.R. Analytical methods for measuring water in nominally anhydrous minerals. In Water in Nominally Anhydrous Minerals; Reviews in Mineralogy and Geochemistry; Keppler, H., Smyth, J.R., Eds.; Mineralogical Society of America: Boulder, CO, USA, 2006; Volume 62, pp. 1–28. ISBN 0-939950-74-X. [Google Scholar]
- Thomas, S.M.; Koch-Müller, M.; Reichart, P.; Rhede, D.; Thomas, R.; Wirth, R.; Matsyuk, S. IR calibrations for water determination in olivine, r-GeO2, and SiO2 polymorphs. Phys. Chem. Miner. 2009, 36, 489–509. [Google Scholar] [CrossRef]
- Kamenetsky, V.; Crawford, A.J.; Meffre, S. Factors controlling chemistry of magmatic spinel: An empirical study of associated olivine, Cr-spinel and melt inclusions from primitive rocks. J. Petrol. 2001, 42, 655–671. [Google Scholar] [CrossRef]
- Lenaz, D.; Kamenetsky, V.S.; Princivalle, F. Cr-spinel supply in the Brkini, Istrian and Krk Island flysch basins (Slovenia, Italy and Croatia). Geol. Mag. 2003, 140, 335–342. [Google Scholar] [CrossRef]
- Mange, M.A.; Morton, A.C. Geochemistry of heavy minerals. In Heavy Minerals in Use; Developments in Sedimentology; Mange, M.A., Wright, D.T., Eds.; Elsevier: Amsterdam, The Netherlands, 2007; Volume 58, pp. 345–391. [Google Scholar] [CrossRef]
- Šarić, K.; Cvetković, V.; Romer, R.L.; Christofides, G.; Koroneos, A. Granitoids associated with East Vardar ophiolites (Serbia, F.Y.R. of Macedonia and northern Greece): Origin, evolution and geodynamic significance inferred from major and trace element data and Sr-Nd-Pb isotopes. Lithos 2009, 108, 131–150. [Google Scholar] [CrossRef]
- Lawrence, S.R.; Tari-Kovačić, V.; Gjukić, B. Geological evolution model of the Dinarides. Nafta 1995, 46, 103–113. [Google Scholar]
- Breiter, K.; Ďurišová, J.; Dosbaba, M. Chemical signature of quartz from S- and A-type rare-metal granites—A summary. Ore Geol. Rev. 2020, 125, 103674. [Google Scholar] [CrossRef]


Publisher’s Note: MDPI stays neutral with regard to jurisdictional claims in published maps and institutional affiliations. |
© 2022 by the authors. Licensee MDPI, Basel, Switzerland. This article is an open access article distributed under the terms and conditions of the Creative Commons Attribution (CC BY) license (https://creativecommons.org/licenses/by/4.0/).
Share and Cite
Bernardi, F.; Skogby, H.; Lenaz, D. OH-Defects in Detrital Quartz Grains from the Julian Basin (NE Italy and Slovenia): A Fourier Transform Infrared Study. Geosciences 2022, 12, 90. https://doi.org/10.3390/geosciences12020090
Bernardi F, Skogby H, Lenaz D. OH-Defects in Detrital Quartz Grains from the Julian Basin (NE Italy and Slovenia): A Fourier Transform Infrared Study. Geosciences. 2022; 12(2):90. https://doi.org/10.3390/geosciences12020090
Chicago/Turabian StyleBernardi, Francesco, Henrik Skogby, and Davide Lenaz. 2022. "OH-Defects in Detrital Quartz Grains from the Julian Basin (NE Italy and Slovenia): A Fourier Transform Infrared Study" Geosciences 12, no. 2: 90. https://doi.org/10.3390/geosciences12020090