Article

Geophysical and Societal Dimensions of Floods in Manitoba, Canada: A Social Vulnerability Assessment of the Rural Municipality of St. Andrews

by
C. Emdad Haque
1,*,
Khandakar Hasan Mahmud
2,
David Walker
3 and
Jobaed Ragib Zaman
1
1
Natural Resources Institute, University of Manitoba, Winnipeg, MB R3T 2M6, Canada
2
Department of Geography and Environment, Jahangirnagar University, Savar 1340, Bangladesh
3
Department of Environment and Geography, University of Manitoba, Winnipeg, MB R3T 2M6, Canada
*
Author to whom correspondence should be addressed.
Geosciences 2022, 12(2), 56; https://doi.org/10.3390/geosciences12020056
Submission received: 5 December 2021 / Revised: 15 January 2022 / Accepted: 19 January 2022 / Published: 24 January 2022
(This article belongs to the Special Issue Scientific Assessment of Recent Natural Hazard Events)

Abstract

:
Being strongly influenced by the landscape of the Red River Valley, geophysical and a variety of sociodemographic and economic factors, the characteristics of floods are complex in the Province of Manitoba, Canada, which causes substantial loss and damage to lives and properties. The primary objectives of this study are two-fold: (i) to identify the geophysical and human-induced conditions of floods, and examine the trend in flood loss and damage in the Province of Manitoba, Canada; and (ii) to analyze the social vulnerability perspectives of floods in the Rural Municipality of St. Andrews, as a local community case study. Using the Delphi technique, primary data were procured from the field for community-level vulnerability analysis. Secondary data for a provincial-level analysis were collected from various public domains, including governmental departments and other non-government sources. The results reveal that a nested set of geophysical and societal factors determine the degree of vulnerability of individual community members. In Manitoba, it was found that socioeconomic damages caused by floods have increased considerably over time despite undertaking costly structural flood mitigation measures. We conclude that minimization of flood damages requires complementing structural measures with knowledge-sharing, collaboration among pertinent institutions, and the adoption of an interactive flood management system approach.

1. Introduction

The Province of Manitoba is called “The Keystone Province” because of its central position in the Canadian confederation; much of its land surface is taken up by the Canadian shield. The southern region of the province forms the eastern part of the Canadian Prairies and the northern extension of the American Great Plains [1]. The climate of Manitoba is extreme, explainable in large measure by its position on the North American continent. Manitoba is subjected to natural hazards, including tornados, thunderstorms, droughts, floods, wildfires, and winter storms, of which floods are most the prominent, causing deaths, injury, and socioeconomic losses. For example, in the flood of 1997, over 27 thousand inhabitants south of Winnipeg were evacuated, and damages exceeded CAD $750 million [2].
The peoples of Manitoba have been coping with the floods since the areas was first inhabited by First Nations. However, later settlement by the Europeans, which also included the addition of less mobile capital infrastructure, resulted in the first records of flood losses and flood extent in the early 19th Century [3]. Because of its physiography, south-central Manitoba is highly vulnerable to Red River and Assiniboine River flooding [4]. Although regular inundation and normal floods are important for floodplain ecology and biodiversity [5], the frequent and often extreme flooding events cause an immense adverse impact on the life and livelihood systems in Manitoba [4]. Flood hazard is a serious threat to south-middle Manitoba. Multiple floods causing substantial damage have occurred along the Red and Assiniboine Rivers during the past two centuries. The most devastating floods recorded were in the years 1826, 1852, 1861, 1950, 1979, 1997, 2009, and 2011, and exemplify the nature of the physical exposure and vulnerability of peoples living in the Red River valley.
In consideration of these contexts, the objectives of the present study are two-fold: (i) to identify the geophysical and human-induced conditions of floods, and examine the trend in flood loss and damage in the Province of Manitoba, Canada; and (ii) to analyze the social vulnerability perspectives of floods in the Rural Municipality of St. Andrews, as a local-community case study. Social vulnerability, in general, refers to the potential adverse effects on communities caused primarily by social conditions and/or stressors. To achieve these objectives, both primary and secondary data were procured by field investigation and from various public domains, including governmental departments and other non-government sources.

2. The Context: Flood Problem in the Province of Manitoba, Canada

The Province of Manitoba has recorded major floods since the early 1800s, with the largest ever recorded to date occurring in 1826. Comparisons of major flood years since the 1826 flood in relation to natural spring peak discharges and natural spring peak stages measured at James Avenue, Winnipeg, are illustrated in Figure 1. In the past 60 years, the floods of 1950, 1997, 2009, and 2011 caused considerable damage, especially along the Red River and Assiniboine River Basins. Some historical highlights of the major floods are presented below to illustrate the overall trends in flooding and the salient features of each major extreme event.
In recent history, a major flood occurred in the Red River Valley of the Province in 1950, during April–June, with a devastating impact on the capital city of Winnipeg. The melting of heavy snow caused the Red River to reach flood levels in Winnipeg by 22 April. Heavy rainfall in early May caused the river to peak at a record 9.2 m (30.2 ft.) at James Avenue in Winnipeg. The levels stayed above the flood stage for 51 days. The water depth reached 4.6 m (15 ft.) in low-lying areas. A “state of emergency” was declared by the provincial authority, and the Canadian Army and Red Cross were brought in to help protect residents and property and help with evacuations. During the flood, 100,000 residents were evacuated from their homes—the largest evacuation in Canadian history (until the 1979 Mississauga train derailment).
The flood in the April–May 1997 period was the most severe in the history of Manitoba’s Red River valley since 1852 (and before that 1826). A dry summer in 1996 was followed by heavy rain in the fall that increased soil moisture considerably, creating the possibility of flooding. There were four blizzards with high winds and heavy snow. Consequently, the basin precipitation from the start of the winter to near the crest of the Red River in early May, totaled 221 mm (8.9 in), well above the norm of 130 mm (5 in). The gradual spring melting started in late March. A ‘Colorado Low’ from the south in the USA at the beginning of April brought a major snowfall of up to 90 mm (3.5 in) to the Red River Valley. Melting resumed in mid-April and happened much quicker than the norm.
The spring runoff volume for the Red River at Emerson (up to 15 June) was 6.75 million acre-feet (8.33 million cubic decameters), representing an average runoff depth of 135 mm (5.3 in). This was almost identical to the 1950 runoff volume. The runoff in the spring of 1997 was particularly higher in several areas: where the Red River starts near Halstad, North Dakota (USA); in the lower Pembina River Watershed; and on most eastern tributaries of the Red River in Manitoba. Many streams in these areas had record or near-record high water flow. The Red River crested at approximately 7.5 m (24.5 ft.) at the James Avenue Pumping Station in Winnipeg. With the help Canadian federal government, during the 1997 flood, over 7000 military personnel were deployed for 36 days to help prevent flood damage and relocate 25,450 evacuees.
The 2009 spring flood, since 1826, was the fourth-highest extreme event of its kind in the Red River Valley. Spring precipitation was close to average, and the melt rate followed the usual pattern. A heavy rainstorm in the first week of November 2008 was a major factor in the 2009 flood. The high level of ground frost, due to the cold winter, kept the ground from absorbing much of the spring runoff. An above-average snowpack in the USA portion of the watershed also contributed to the flood. Flooding in the Red River watershed was worse because of unusual ice conditions, which caused blocks in the drainage system and raised river levels beyond what would have occurred under normal conditions.
The 2011 flood featured the highest water levels and flows in modern history across parts of Manitoba and Saskatchewan (although a lower flood extent than 1826 for the Red River valley as a whole). Statistically, the flooding on the Assiniboine River in 2011 was estimated to be at levels experienced once in 330 years. In late October 2010, southern Manitoba was within one mm of having its wettest year on record when a super-charged ‘weather bomb’ dumped 50 to 100 mm of rain and snow. At the season’s midpoint, the snowfall total was at a 15-year high. When spring arrived, cold temperatures slowed the melt and delayed expected flooding. In April, the water level climbed steadily on several rivers, including the Red, Assiniboine, Souris, Pembina, and Qu’Appelle, and on several lakes. The Red River peaked in Winnipeg on 7 April, when an ice jam drove up water levels. The high stage ranked third largest in the past 150 years. The Assiniboine River crested just days later. On 9 May 2011, the Government of Manitoba declared a province-wide “state of emergency”, issuing evacuation notices for several municipalities along the Assiniboine River. Although the geographical spread of the 2009 and 2011 floods was considerably less than in 1997, these two floods caused much higher economic losses and damages to the residents of Manitoba

3. Materials and Methods

The present research adopted a two-tier approach in its methodology. First, an extensive review of existing literature was carried out to analyze the trends in historical floods, identify and categorize the flood forming conditions, and examine the trends in flood loss and damages in the Province of Manitoba, Canada. Several search engines, including Science Explorer, Geological Survey of Canada, Google, and Microsoft Bing were used with ‘Flooding in Manitoba’, ‘Flood History of Manitoba’, and ‘Geological Causes of Flooding in Manitoba.’ Further, archival materials were procured from the Government of Manitoba websites. Exclusion criteria were used to eliminate all materials that were not directly relevant to the thematic areas. Thus, data inventories were created based on these secondary sources, which formed the basis of analysis in the earlier sections of the paper.

3.1. Determination of Geophysical Vulnerability

Two sets of information were required for the analysis of geophysical vulnerability of the study area: hazard frequency and hazard zone delineation. For flood frequency analysis, historical flood data were collected as part of the data-sharing agreement between the University of Manitoba and the Province of Manitoba. The Disaster Financial Assistance Agreement (DFAA) archival materials of Manitoba Emergency Measures Organization (EMO) between 1997 and 2013 have been compiled and found differential flood frequencies in different parts of the study area. Second, primary data on recent flood experiences and perceived vulnerability by the local community members and stakeholders were collected by adopting the Delphi Technique [6]. A community ‘case study’ was conducted in the Rural Municipality (RM) of St. Andrews, Manitoba, Canada, which is located between Lake Winnipeg and the Provincial Capital City of Winnipeg where Red River demarcates the eastern boundary of the RM (Geographically the RM is located between 50°01′43″ to 50°30′23″ North Latitude and 97°06′57″ to 96°49′20″ West Longitude; Figure 2). To achieve the objectives of the research work, the community’s vulnerability to floods was determined and analyzed. The concept was derived from the hazards-of-place model developed by Cutter [7]. The hazards-of-place model combines both the traditional view of geophysical vulnerability and the emerging concept of social vulnerability.
The RM of St. Andrews occupies an area of 752.70 sq. km. with a population density of 16 people per sq. km. Its north-south and east-west extents are 53 km and 20 km, respectively. The average population growth between the last two censuses was approximately 4.5% [8]. The high influx of floodwater discharges through the Red River Floodway at Lock Port, followed by ice jams that frequently occur downstream where the Red River enters the Netley-Libau marsh, creates extremely vulnerable flooding conditions for the St. Andrews community. Many devastating floods have occurred in recent history in St. Andrews because of ice jams caused when ice carried in the high flow discharge of the Red River, and Floodway accumulates, as the current slows entering the marsh and river outlet on Lake Winnipeg [9].
The research focused on recording the community experiences of flooding and their preparedness for future floods through mitigation and other measures in the RM of St. Andrews. The Delphi technique [6] was applied to capture the community experience on recent flood loss and their perception of vulnerability. This included collecting data on opinions of the community members and stakeholders, their experience of flood fighting, as well as data refinement by applying the Delphi technique iteratively. The Delphi technique is a widely used and accepted method for achieving convergence of opinion from primary and secondary stakeholders [6,10,11,12]. This research work followed a three-step iteration process. An outline of the three iterations of this research work is depicted in Figure 3.
With support from the chief administrative officer of the RM of St. Andrews, a list of participants was prepared for the Delphi process. A total of 10 residents of the RM of St. Andrews, representing all of the 6 wards from the municipality, directly participated in the Delphi process. Among the 10 participants, 6 were males and 4 were females. All 10 participants were present in all three sessions. The field survey strictly followed ethical research guidelines approved by the University of Manitoba (Research Ethics and Compliance Protocol # J2014:135).
Round 1 (Idea generation phase) of the Delphi process emphasized the experience of the St. Andrews community to past floods and recovery processes. After receiving responses from the participants, a well-structured questionnaire was developed, and it was delivered to all participants as the survey instrument for Round 2 (Interview phase). Some questions required the participants to rank order priorities in dealing with flood-related issues. As a result of this prioritization, areas of agreement and disagreement were identified by the researchers. In the third and final round (Validation phase), the synthesized answers based on respondent percentages, weightages, and ranking in the second round were discussed for a generalized consensus. This round provided the final opportunity to evaluate and revise the second round outcomes based on the community consensus.

3.2. Measuring Social Vulnerability

While ‘vulnerability’ to flood hazard generally implies the potential for loss [13], social vulnerability refers more specifically to the potential for loss by flood disaster due to social conditions and/or stressors. Hence, social vulnerability is partially the outcome of social inequalities—the social factors that affect or shape the susceptibility of various segments in society to harm and that also profoundly influence their ability to respond [13,14,15]. Because vulnerability is not directly measurable, several methods have been put forward to estimate it, including vulnerability indicators and indices. Recent discourse on the validation of social vulnerability indices in the context of natural hazards such as floods is extensively elaborated in Fekete [14], de Brito et al. [15], and Bakkensen et al.’s [16] studies in Europe, Latin America, and North America.
For identifying social vulnerability in the RM of St. Andrews, demographic (e.g., age, gender, race/ethnicity, income levels) and housing (e.g., building value) characteristics were considered [17,18,19] and used in the calculation of the Social Vulnerability Index (SVI). It was postulated that these variables might have played influential roles in increasing or reducing the overall vulnerability of a community to flood and other natural hazards.

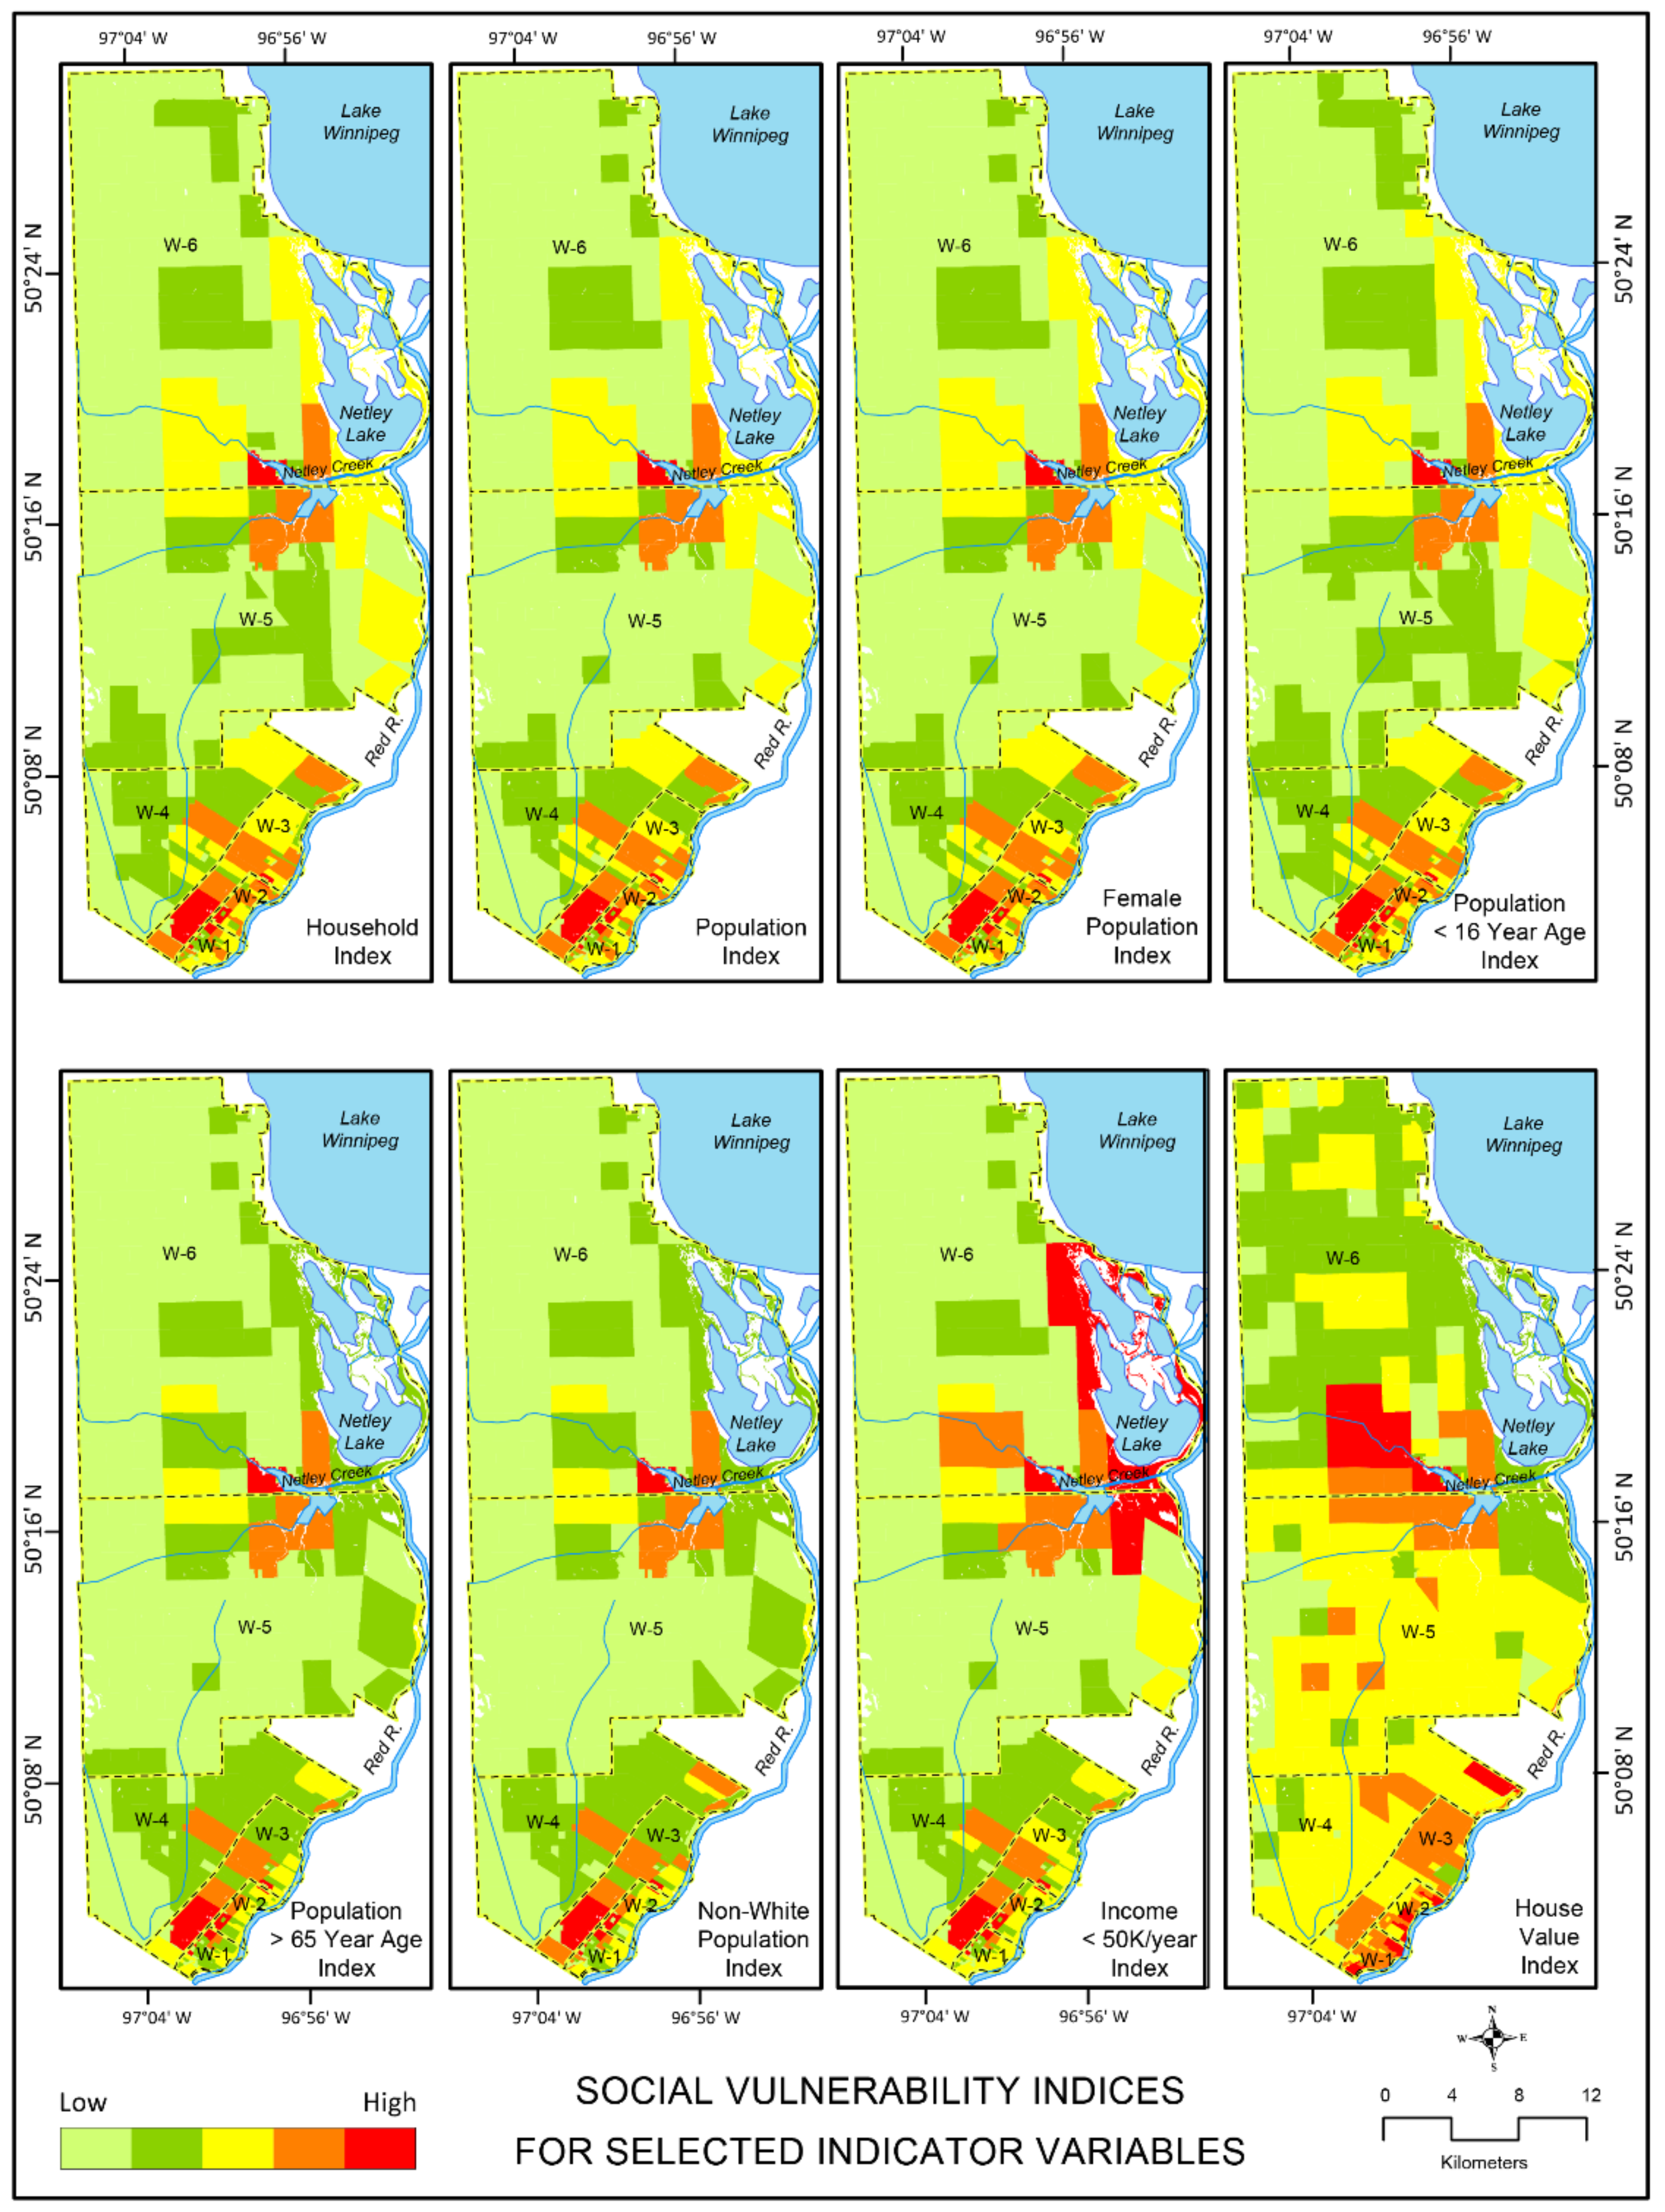
3.2.1. Calculating Individual Indicator Variables for Social Vulnerability Index (SVI)

Early development of the SVI standardized each indicator by percentage [20] because absolute values are generally not suitable for a direct comparison. Several analysts criticized this approach, as standardizing the data eliminates the effect of magnitude and suggested a different approach [17]. Instead of using simple percentages of the indicator variables, in subsequent research by Susan Cutter and her colleagues [17], each of the variables was standardized by first determining the ratio of that indicator variable to the total number of the variables in the geographical unit (here the municipality). The ratio of each of the variables was then computed by dividing the variable value by the total value of the same variable in the whole unit (in this case, the municipality) [see Equation (1) below].
The calculated ratios were then obtained by dividing the maximum ratio value of the same variable to create an index that ranges from 0 to 1.00. The higher the index value, the higher is the vulnerability. However, in the case of standardizing mean house values, there could be a possibility of negative values. Therefore, the differences in the absolute value between census block and municipality as a whole were calculated. In the standardization process, the positive and negative values would not have any implication due to the fact that a ratio is eventually calculated between the value difference and maximum value within the column.
To remove the negative values, following Cutter et al.’s [17] application, the absolute value of the “value difference” column was added to create the “new house value” column (see column 5 in Appendix A Table A8 for details). Finally, the ratios of the new house value were procured by dividing the maximum ratio value of the same variable to create an index value [see Equation (2) below and Appendix A Table A8 for details).
The formula for calculating Social Vulnerability Index (other than the “Housing Value” indicator variable) was:
Z = x y max   ( x y )
where Z = Social Vulnerability Index and xy = Ratio of the individual indicator variable, which could be derived by:
x y = X Y
where X = Number of individual indicator variables in Census Block, and Y = Number of individual indicator variables in the entire Rural Municipality.
The formula for calculating the Social Vulnerability Index (only for the “Housing Value” indicator variable) was:
Z = x 2 y 2 max   ( x 2 y 2 )  
where Z = Social Vulnerability Index and x 2 y 2 = Ratio of the individual indicator variable, which was derived as:
x 2 y 2 = x 1 y 1 max   ( x 1 y 1 )
where x 1 y 1 = Value difference between Census Block Level and Rural Municipality Average, which was derived as:
x 1 y 1 = X Y
where X = Average house value at Census Block Level, and Y = Average house value at Rural Municipality Level

3.2.2. Calculating Composite Indicator Variables for Social Vulnerability Index (SVI)

The individual indicator variable mosaics were combined together to produce a composite social vulnerability index for the RM. The index values of each of the variables were summed and averaged to produce the composite index. These index values represent an aggregate measure of social vulnerability in the rural municipality by ward. Both of the individual indicator indices and the composite index values were classified and visually presented in GIS using the Natural Break classification scheme in GIS.

4. Results

4.1. Results: Provincial Level Analysis

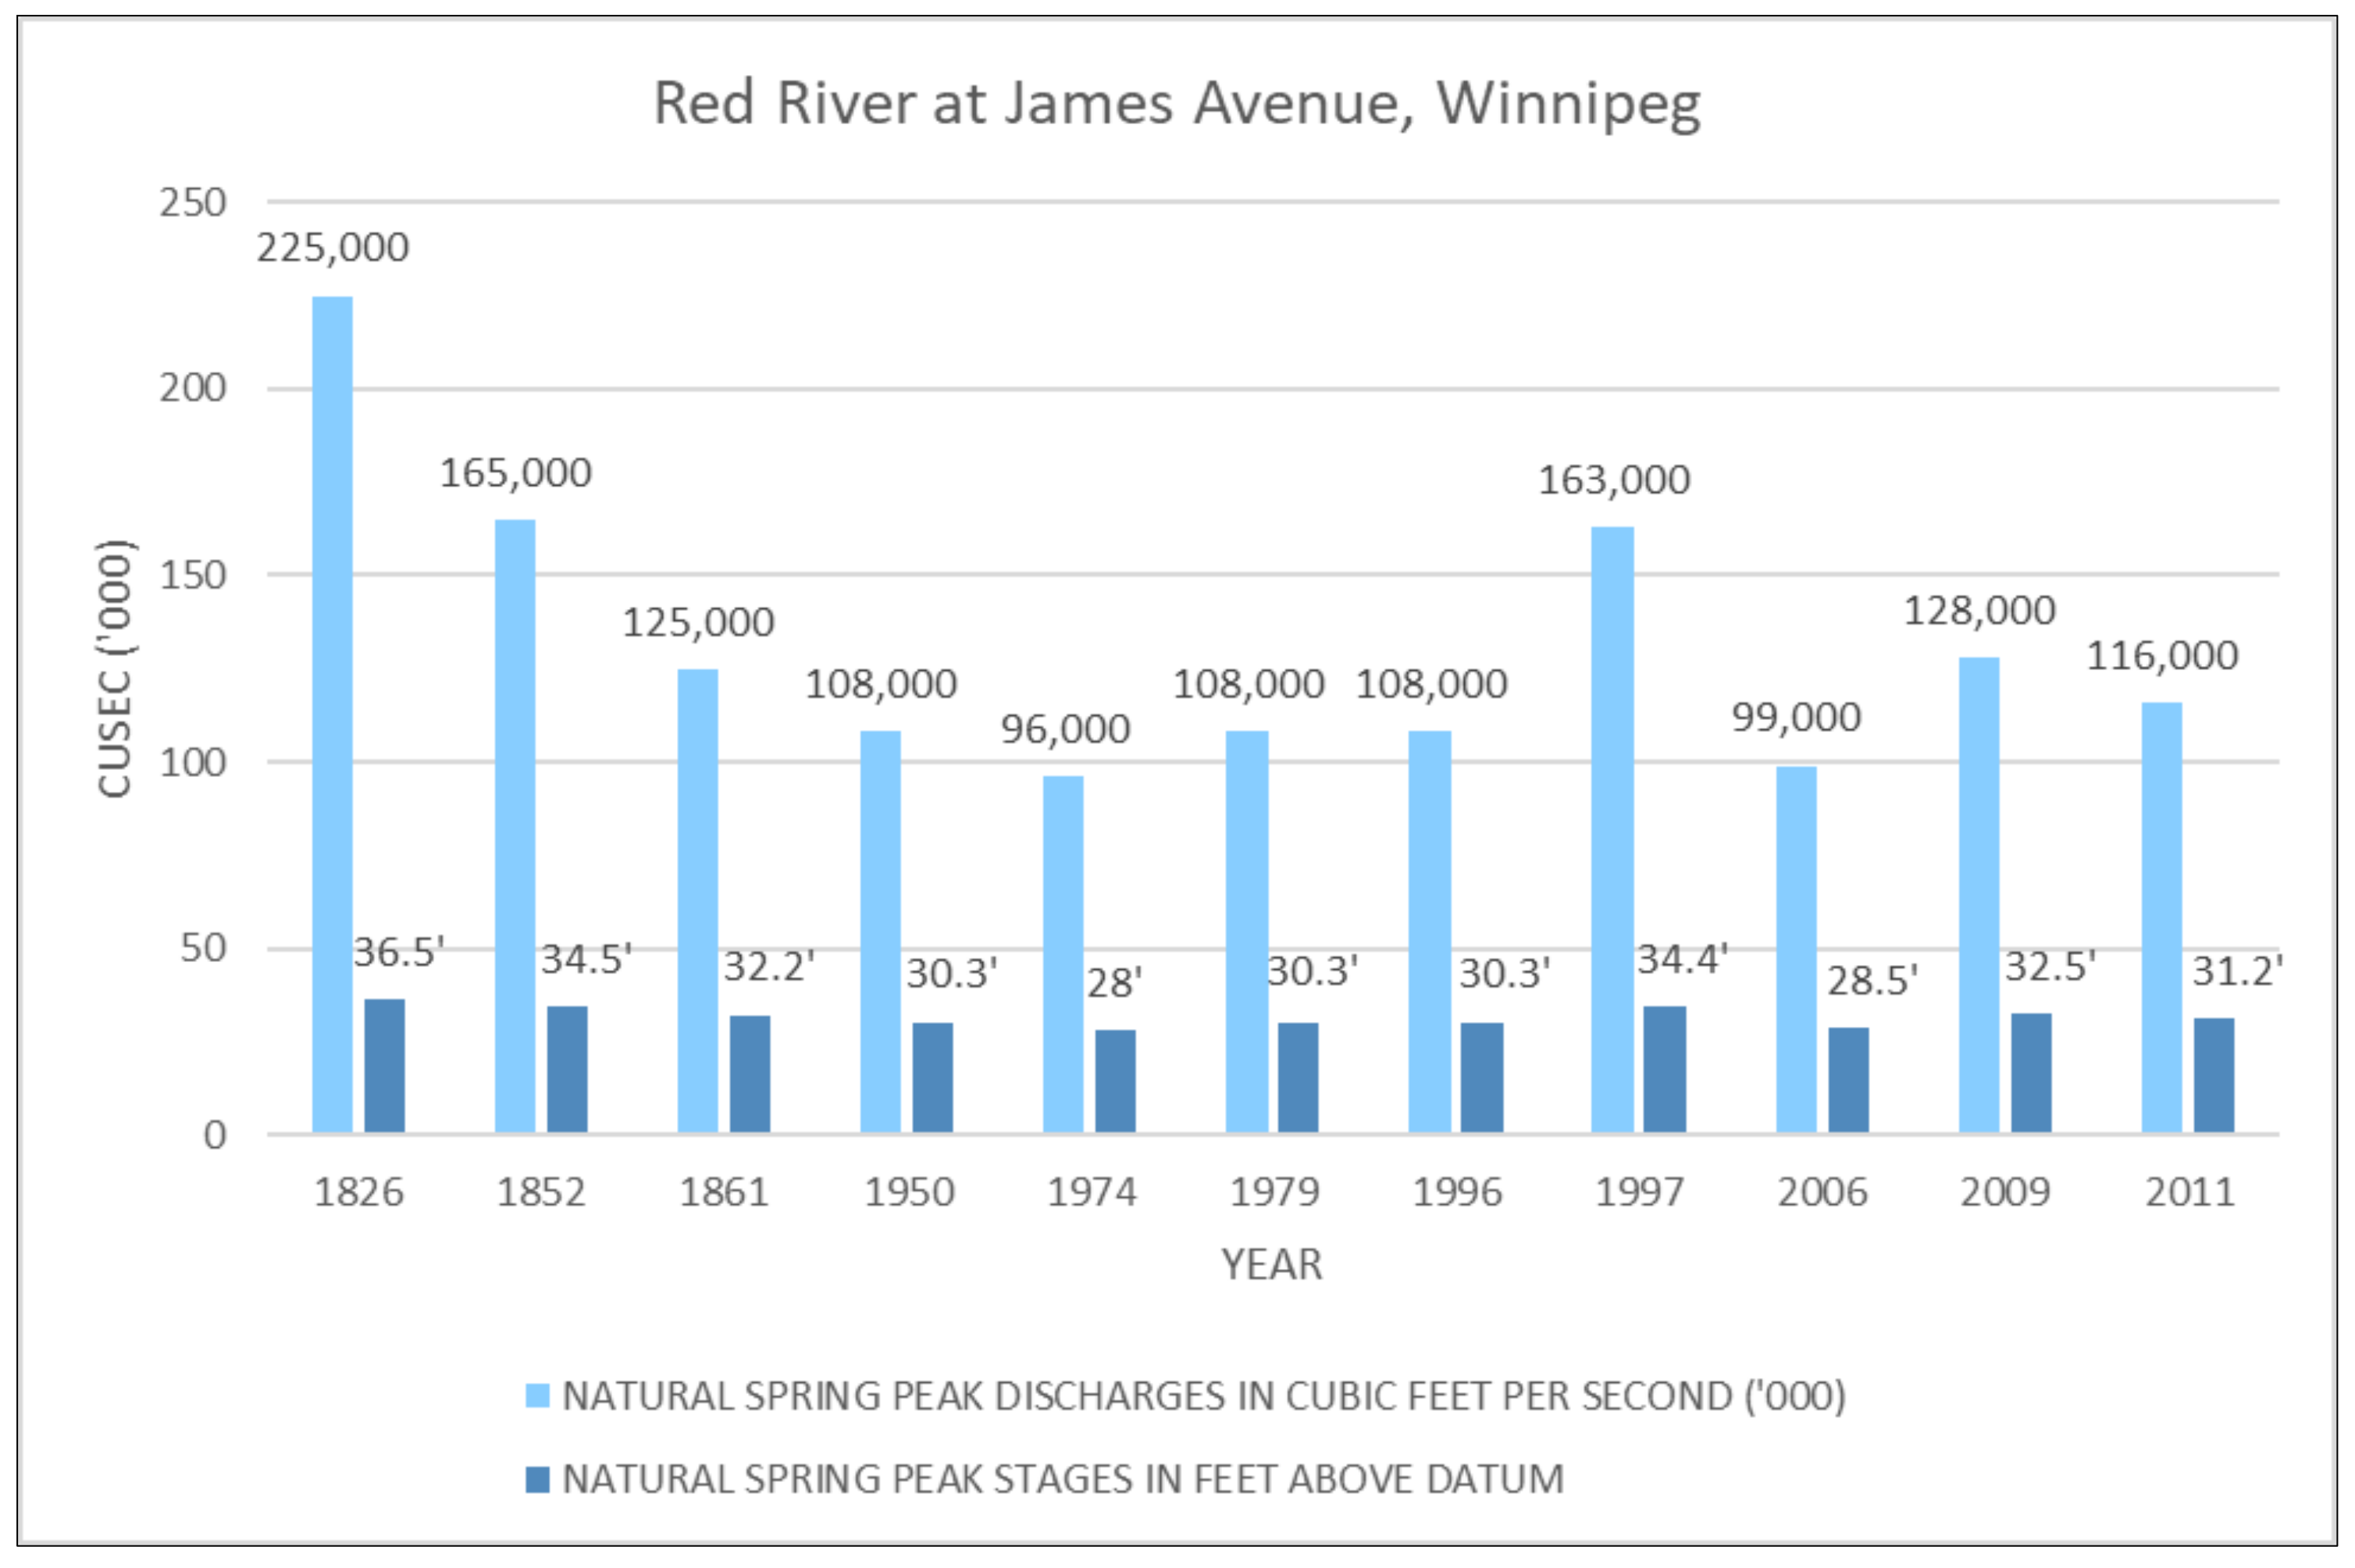
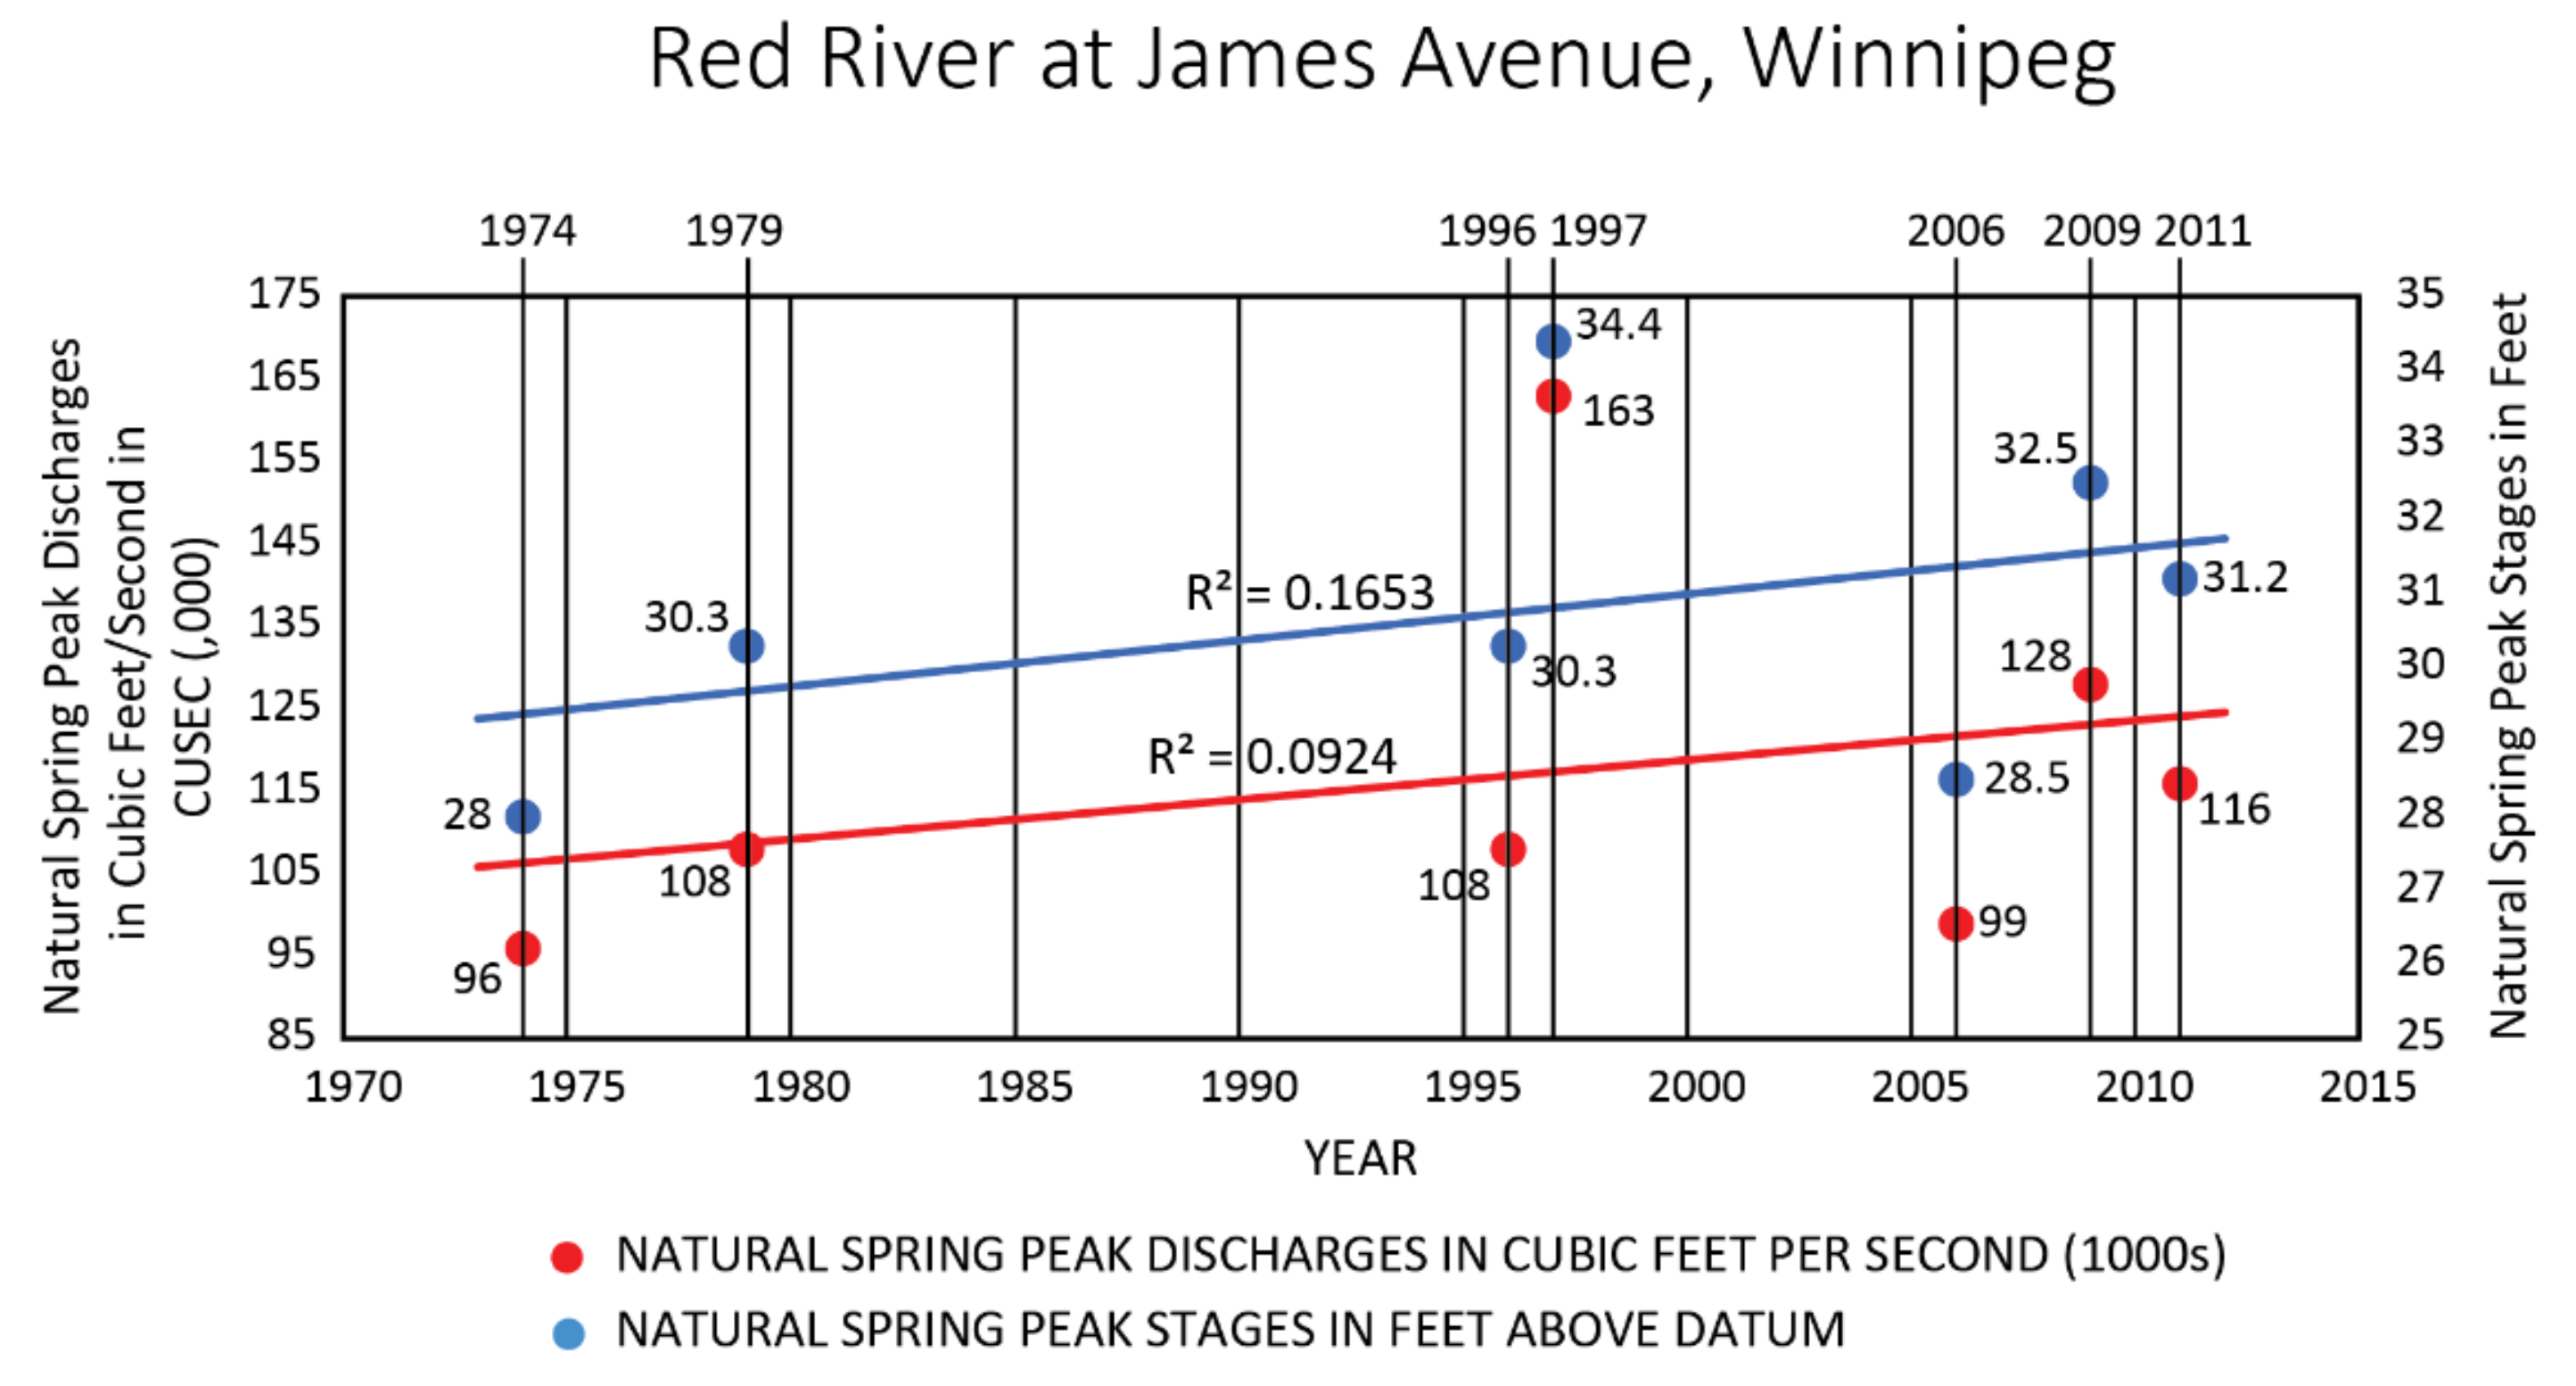
4.1.1. Flood Forming Conditions in Manitoba

An ideal physiographic, geotectonic, and geological setting, followed by favorable meteorological conditions, has caused Manitoba to be highly vulnerable to flooding [21]. In this regard, a discussion on flood forming conditions can be synthesized under three broad categories: (i) geological and physiographic conditions for flooding; (ii) hydrometeorological conditions, and (iii) human/societal factors.
(i) The physiographic/geologic conditions: Three major factors under this category are identified, which are as follows:
(a) Glacial Lake Plain: Manitoba is one of the greatest sinuous and incised shallow valleys in the world and was formed as the floor of Glacial Lake Agassiz [21,22]. One of the major factors contributing to the flooding of the Red River basin is this low-lying topography (Figure 4). The flatness of the region means there is very slow drainage of the waters, which also limits the formation of large natural water reservoirs. The water can stay there for days and even weeks before receding and lead to extensive surface flooding at great distances from the river channel [23,24].
(b) Gradual gradient decreasing south to north: The unusual physiographic orientation of the Red River’s flow from the south to the north with gradual gradient decline in the topography (Figure 4) contributes to the flooding in Manitoba at a large scale [21,22]. In effect, the upstream water being situated to the south thaws out before the downstream part of the river in Manitoba, thus creating ice jams, blocking the passage of the water, and increasing local flooding. When a slow rate of snowmelt in Manitoba coincides with heavy spring rainfall and rapid snow thawing in North Dakota, the flooding scenario further worsens [23,24].
(c) Isostatic rebound: The isostatic rebound process is responsible for the rise of landmasses to the north of Manitoba and tilting towards the south on a geologic time scale. This happens due to the depression of the immense weight of ice sheets during the last glacial period. The glacial Tyrell Sea was raised at a notable height to form the present-day Hudson Bay, and the process is still continuing. Remarkable shoreline changes and Lake Winnipeg’s movement southwards confirms the ongoing process of Isostatic rebound in Manitoba [25,26,27]. In the longer term, the increasing height of northern Manitoba, and especially at Lake Winnipeg, increases flood risk in the Red River valley. Eventually, this river system will reverse its flow, and Lake Winnipeg will expand into the existing river valley surrounding the City of Winnipeg. Although the south-north orientation of Red River flow will cease and no longer be a factor in flooding, devastating flooding scenarios will continue to be experienced in the future.
(ii) Hydrometeorological conditions: Periodically, weather conditions exist, which promote widespread flooding through both the Red River valley and the Assiniboine River basin. As shown in the data presented in Table 1, in some years, all meteorological conditions function simultaneously, resulting in extreme flood levels. For example, 1826, 1950, and 1997 floods have all had favorable meteorological conditions for flooding.
The line of fit, as presented in Figure 5 with the R-Squared value, shows the extent of variance in peak stages (dependent variable) that is explained by peak discharge (independent variable). Two separate lines of fit are predicted here—one for river discharge in different flooding years and the other is for river stages in the same flooding years. The trend reveals that both peak stage and peak discharge have been increasing since 1970. The R-Squared values for these variables (0.0924 and 0.1653) reveal that they are positively correlated.
(iii) Human/societal factors: Flooding is not solely caused by the physical landscape and hydrometeorological parameters; it is also impacted by the scale and magnitude of human-induced economic development activities. In the Prairie provinces of Canada, vast wetland areas were converted to farmland; consequently, by 1970, a total of 1.2 million hectares of wetland had been converted to farmland [28]. The Red River basin has lost 98% of its total wetlands since the start of European agricultural practices in Manitoba [29]. With southern Manitoba losing about 100,000 hectares of wetlands since 1950 [30].
In prairie grasslands, dense native grasses were removed in favor of lower cover agricultural crops. This reduces the interception of rain and the retention of water in the soil. In combination with tilling practices and the development of surface drains, more water flows as surface runoff, and at a faster rate, during heavy precipitation events, increasing flooding magnitude. At the same time, the flat topography and removal of wetlands allow for the creation of extensive surface ponding causing local flooding, often at a great distance from drains and at higher elevations than the main river channel.
The population of Manitoba increased from 25,228 in 1871 to 1,351,482 (estimated) in 2021 [31], contributing to the conversion of open space to paved areas and the development of capital infrastructure. Effects of urbanization are twofold—impermeable surfaces reduce infiltration of water and accelerate runoff, and mitigation to protect infrastructure also favors rapid diversion of water into rivers and streams. This increases the ‘pulse’ of water following spring melt and summer storms. Notably, the Red River Floodway, designed to protect Winnipeg, increases the capacity of the River by diverting water around the city but returns those waters back to the historic river channel just north of the City, increasing the flood risk in St. Andrews. Development activities (and geophysical engineering) along the river and floodplains thus have been altering the capacity of the rivers to convey water and increase the height of the water surface corresponding to a given discharge [32].

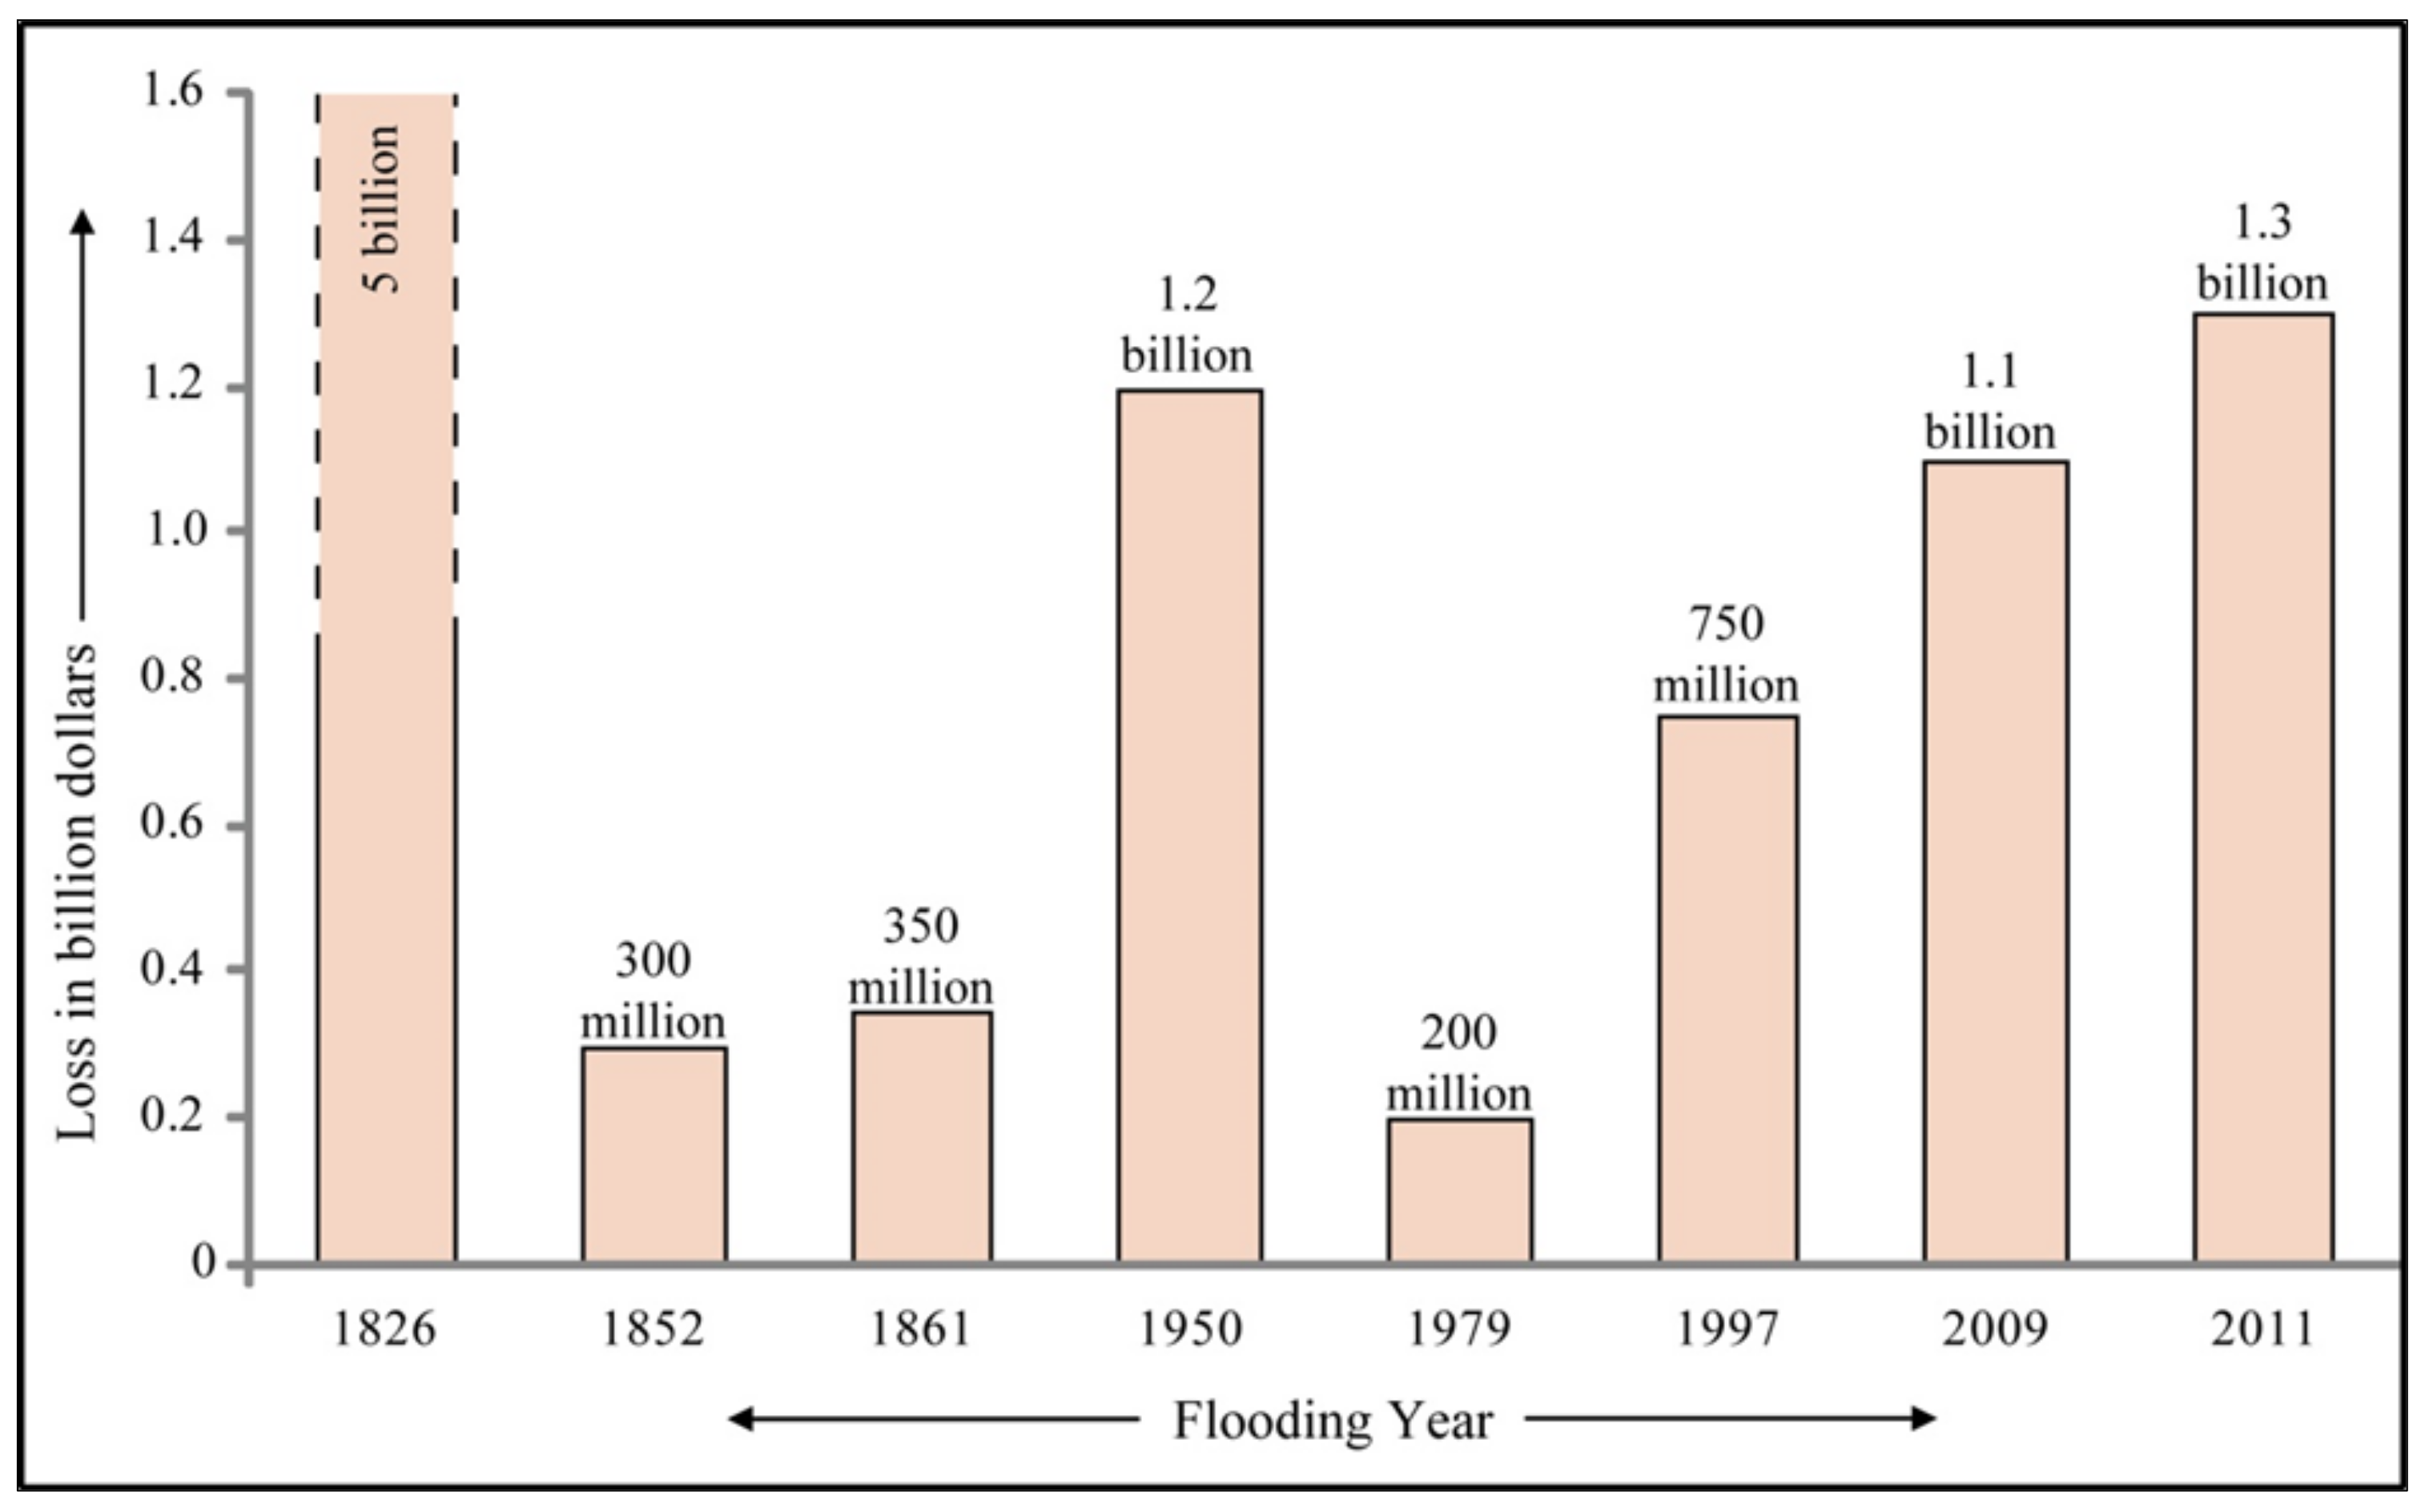
4.1.2. Flood Loss and Policy Interventions

In the Province of Manitoba, continuous large-scale flooding has been threatening existing flood control measures and the traditional response and recovery measures through the Disaster Finance Assistance Agreement (DFAA) as the compensation cost from the government have increased astronomically [4,33]. In the 1970s, it was noticed that the sizeable financial involvement for structural mitigation measures was not successful enough and the DFAA cost continued to rise, forcing the Federal government to adopt a National Flood Damage Reduction Program (FDRP) for identifying the flood risk areas through flood mapping. Despite the provincial and federal joint program interventions, flood loss and damages continued to rise in the Province of Manitoba (Figure 6).
The data presented in Figure 6 allows one to make a plausible comparison with a normalized or adjusted dollar figure, which shows a trend of increasing major loss: $750 million in 1997, $1.1 billion in 2009, and $1.3 billion in 2011. This increasing flood loss trend is attributed to several human-induced factors: concentration of infrastructure and physical capital in close clusters (in cities and large towns); increase in population and settlements; and more importantly, flooding had been occurring in previously unknown geographical locations due to excessive precipitation.

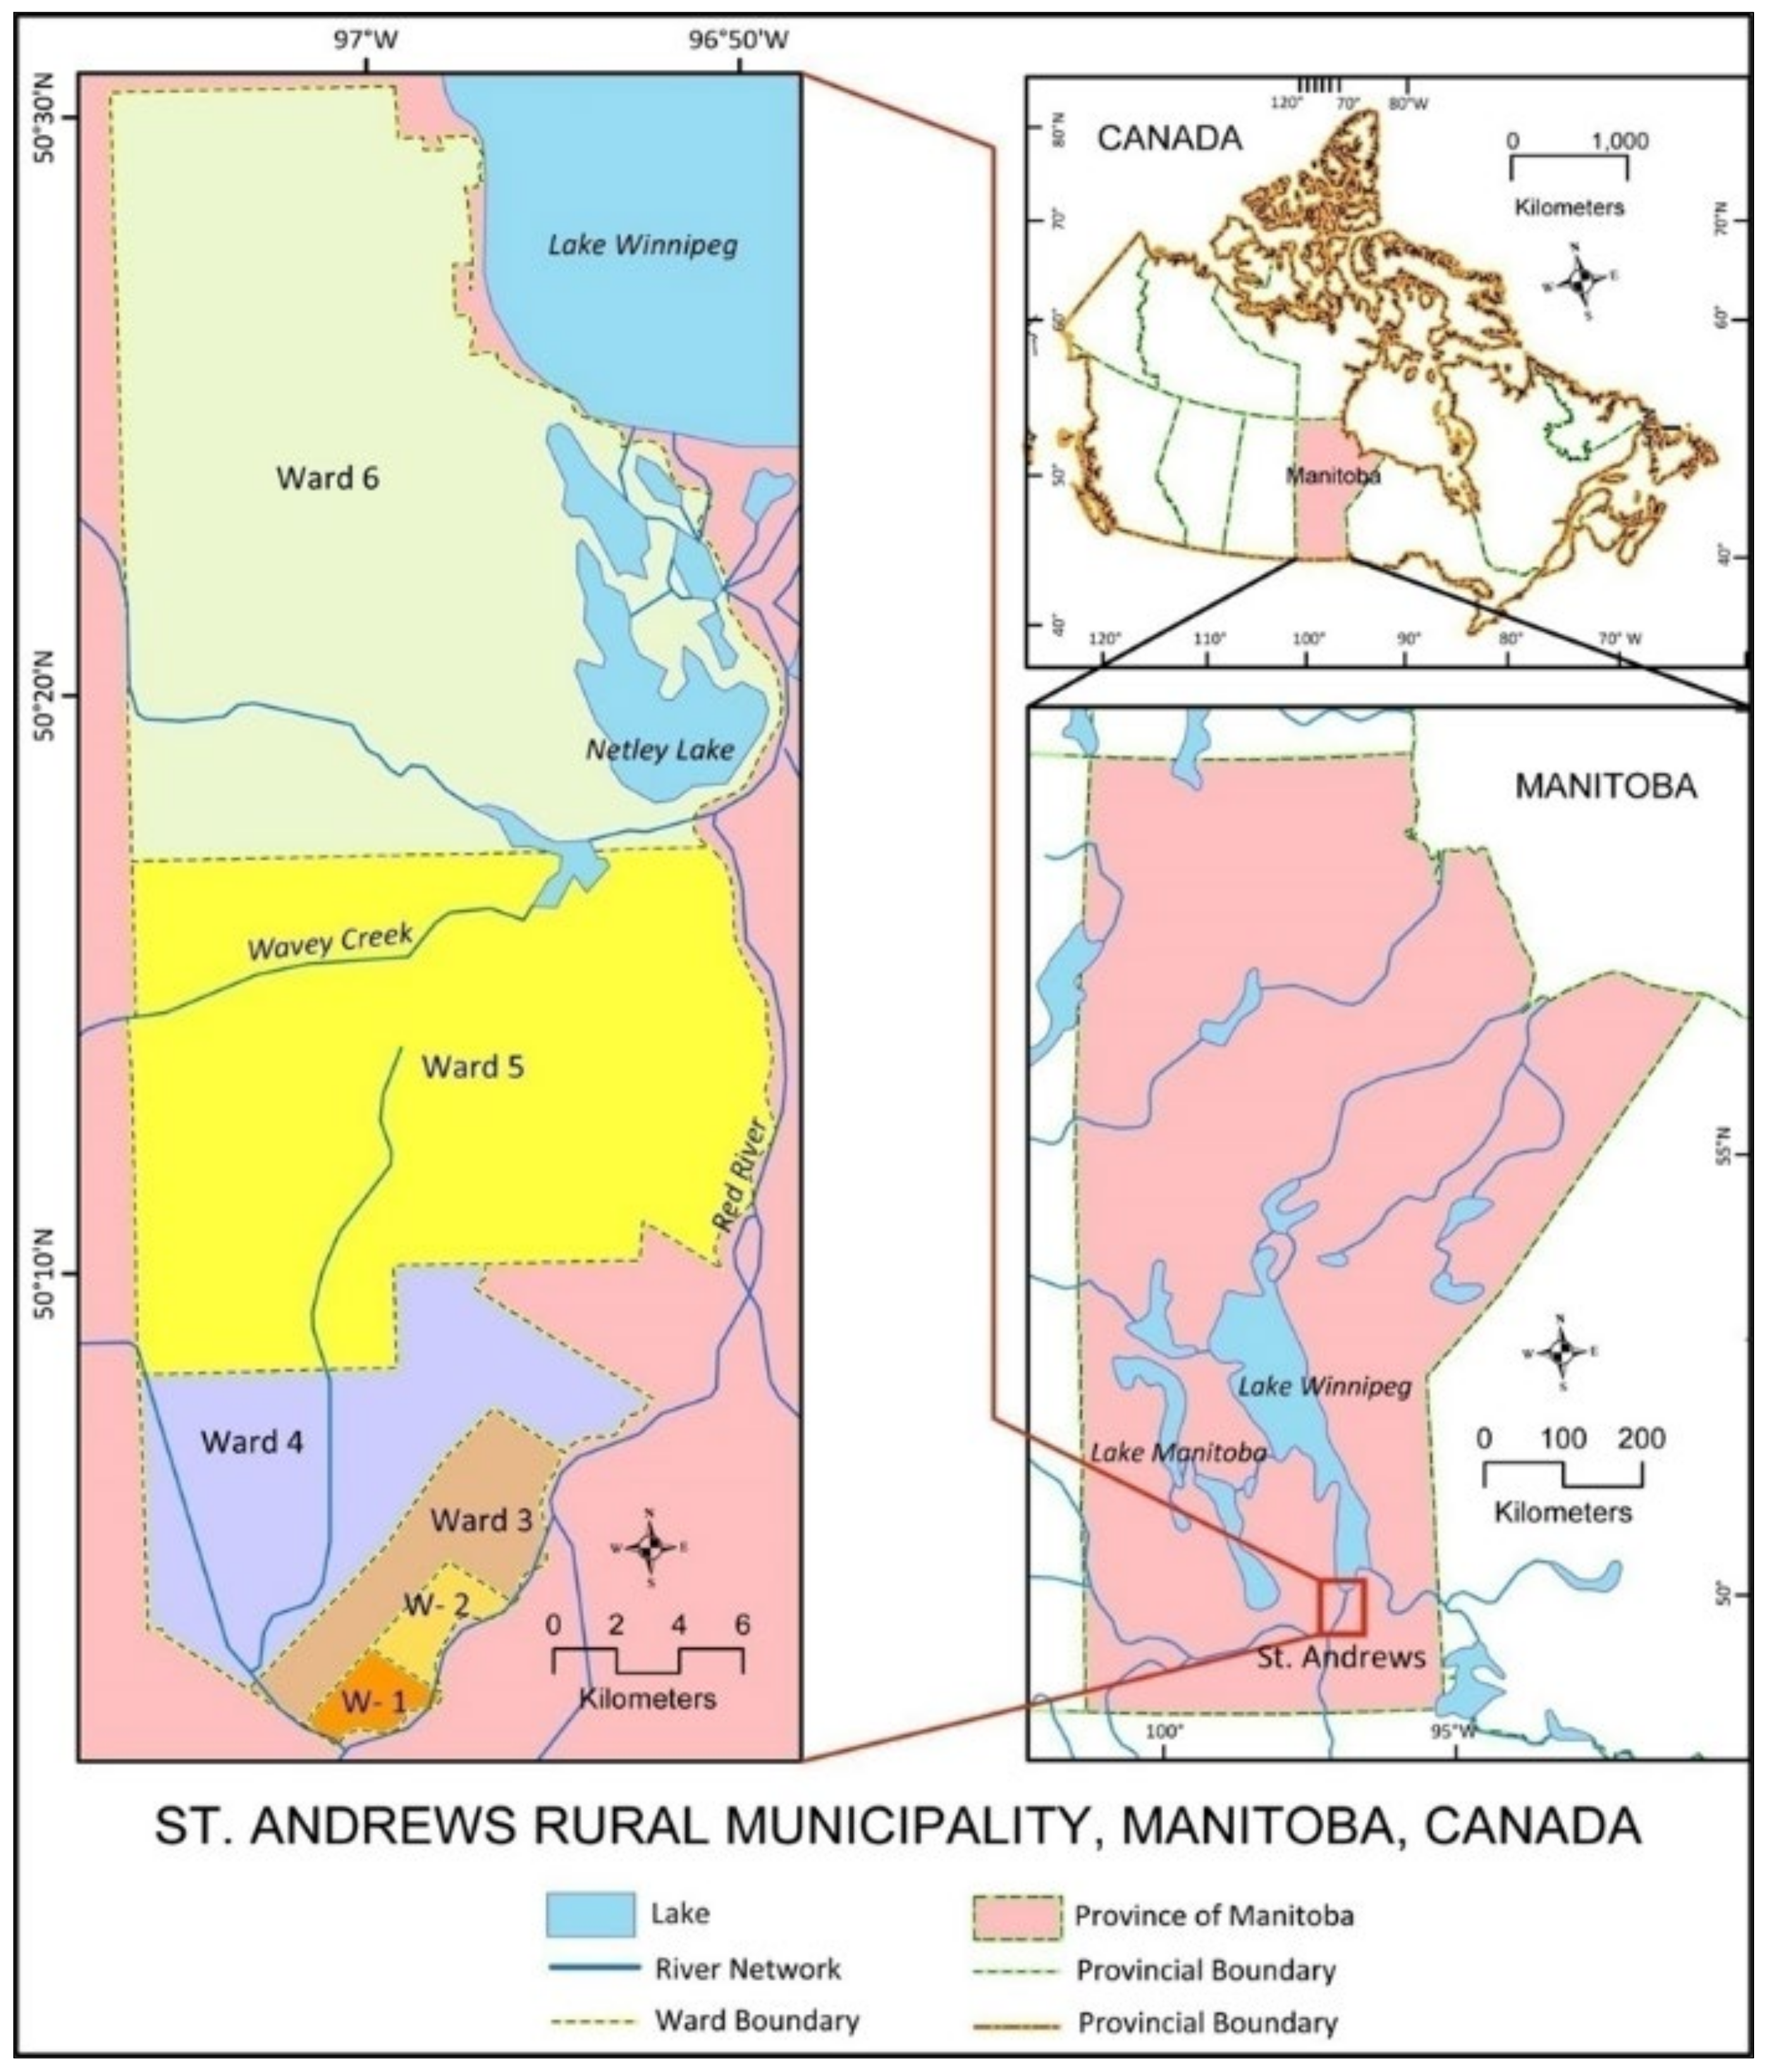
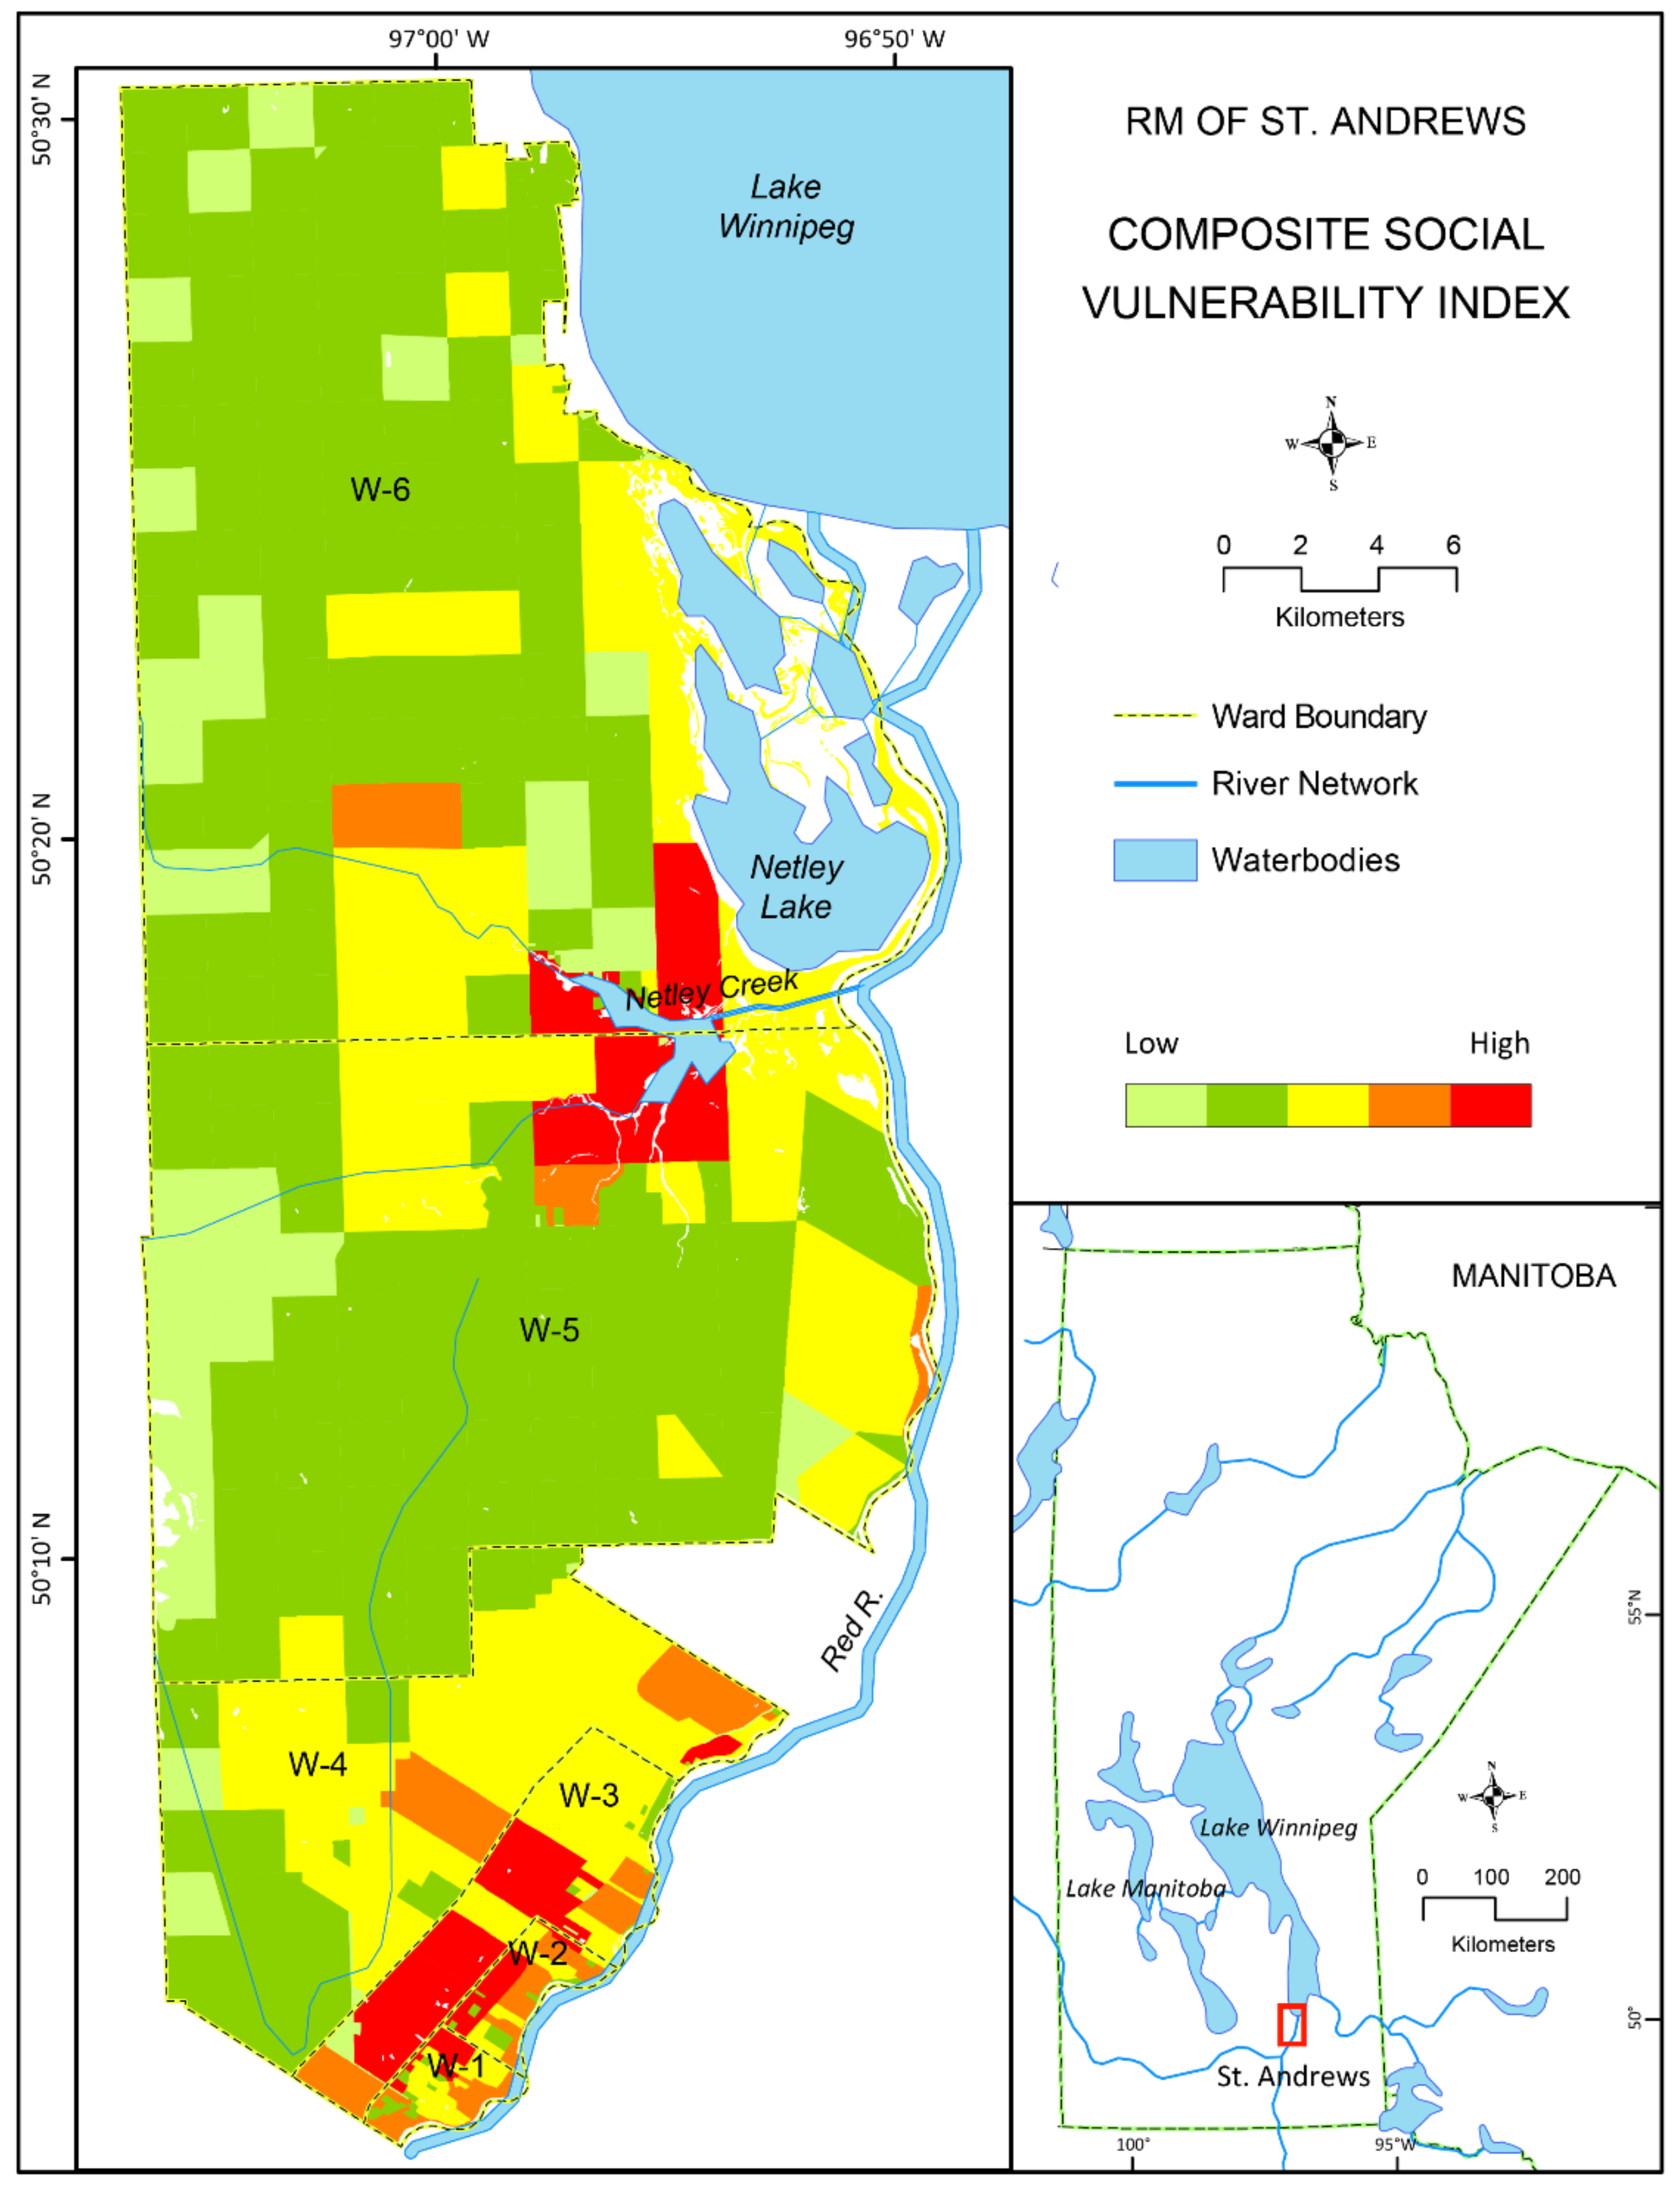
4.2. Results: Vulnerability of Rural Municipality (RM) of St. Andrews to Flood Hazards

Over the years, flood devastation in Manitoba has continued, which has forced the Provincial government to find alternative strategies to enhance community resilience to cope efficiently and sustainably to flood events. Communities with an understanding and comprehensive assessment of vulnerable sectors and elements could prepare themselves better and could also help respond appropriately as well as recover quickly from any flood disasters. Hence, assessing local vulnerability and mainstreaming the findings with communities’ existing capacity could play a vital role in dealing with the flood disaster.

4.2.1. Geophysical and Social Vulnerability of Community Members

The geophysical vulnerability of a place refers to the physical exposure to natural hazards, which is generally characterized by the magnitude, duration, and frequency of hazards [34]. The higher frequency and higher magnitude or impact of the flood hazard increase the vulnerability of a place; moreover, the extended duration of the flood event may worsen the conditions much more than expected. Along with this, the geographical and geotectonic settings of a place also affect the degree of vulnerability [35,36,37,38,39].
The identification of perturbations (extreme natural events, e.g., cyclone, flood, etc.) and stresses (slowly degraded environment, e.g., soil erosion, water pollution, etc.), their frequencies, and locational impacts are the most important components in presenting geophysical vulnerability [17,18,40]. For the purpose of this research work, we are considering here single events of perturbation, i.e., flood.
Two sets of information were required to analyze the geophysical vulnerability of the study area: hazard frequency and hazard zone delineation. In addition, a community experience and perception-based flood map was prepared during the field visit, which is compiled and presented in Figure 7; this flood map is a generalized representation showing flood exposure along the Red River and Netley Creek area. Most of the settlements of the study municipality that were concentrated along the Red River had higher geophysical exposure to flooding. The map is classified into three flood zones based on the frequency and community perception:
(a)
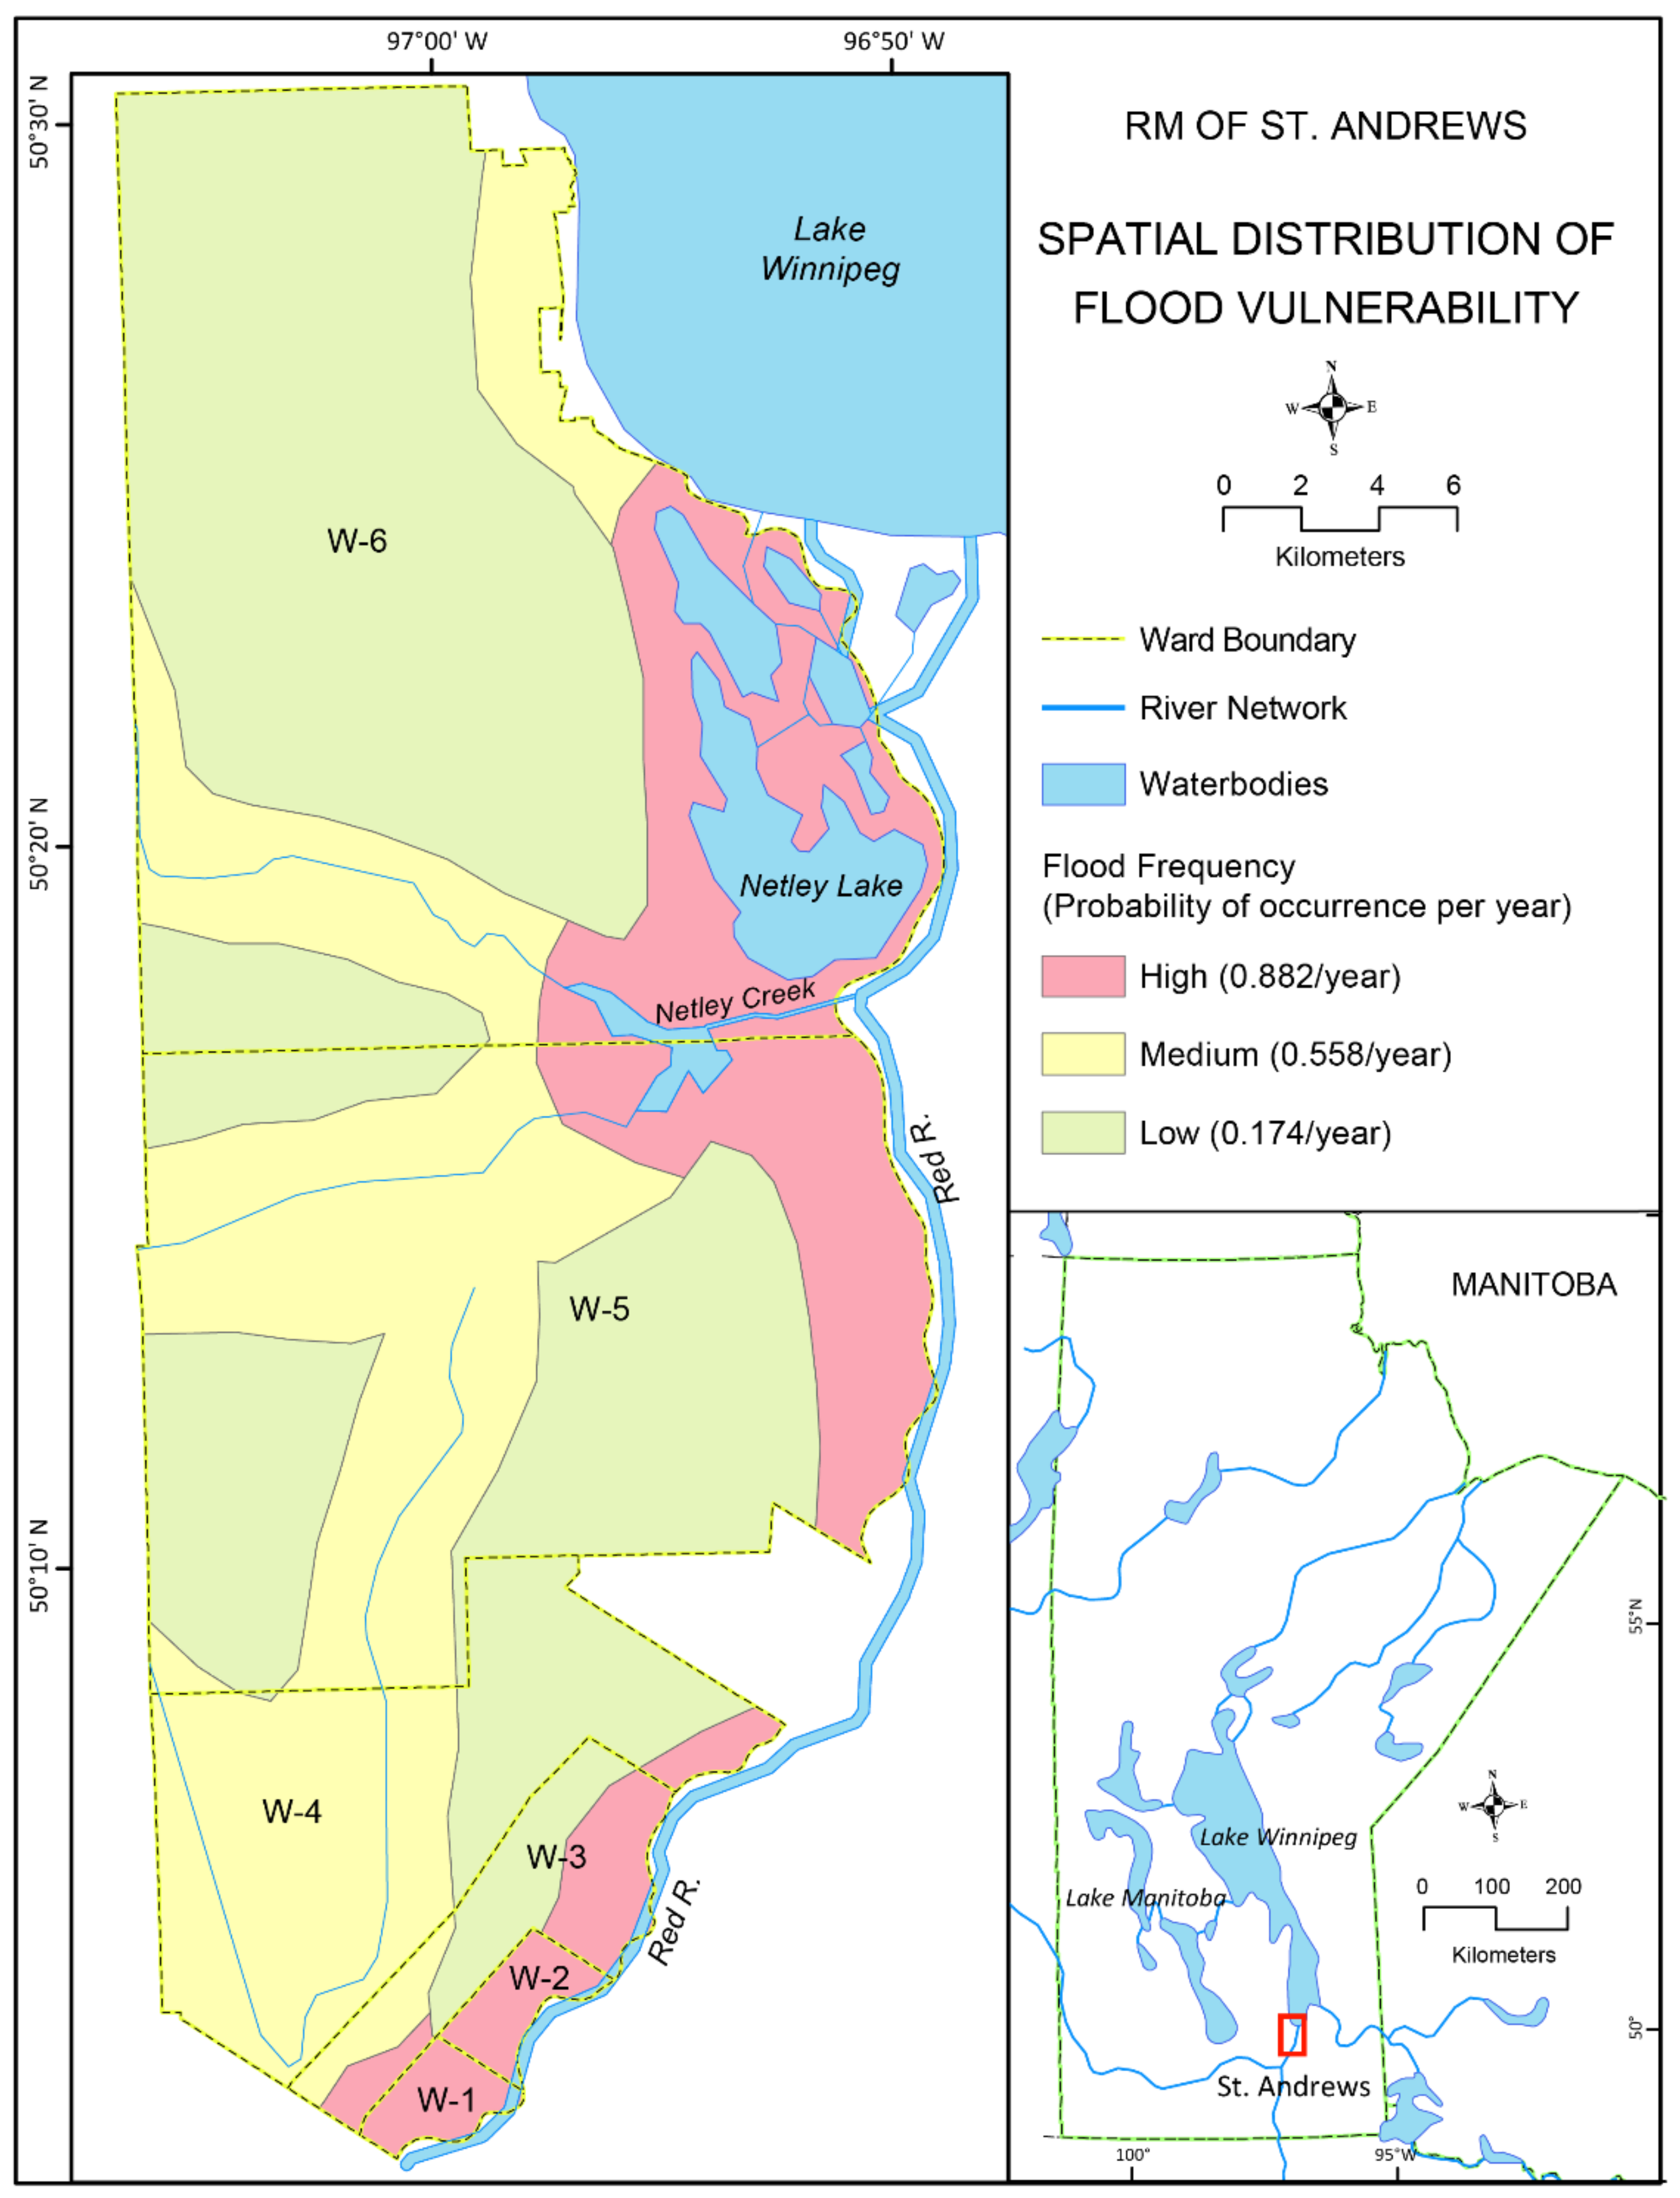
Regularly flooded (affects with almost every flooding event that occurs here): Community members identified that the areas around the Netley Creek, Breezy Point, Petersfield, Little Britain, Lockport, St. Andrews, Less Crossing are prone to regular flooding. According to the DFAA database, since 1997, the RM has faced a total of 15 flood events. Since 1997, the flood frequency for these parts of the municipality has been 15/17 or 0.882 per year.
(b)
Flooded sometimes (affects periodically): Parkdale, Rosedale, Matlock, and areas along the creeks are those areas in the municipality which were flooded during floods like 1997, 2000, 2001, 2004, 2005, 2007, 2009 (twice in this year), 2010, and 2011 since 1997, 10/17, or 0.588 per year.
(c)
Flooded rarely (affects during severe events only): Extreme floods like 1997, 2009, and 2011 have the potentiality to inundate the entire municipality. The flooding rate for the remaining parts of the municipality is calculated to be 0.174 per year.
Disaster vulnerability is a process of geophysical hazard, but the social context has the utmost importance in determining the internal characteristics of disasters [41,42]. Although different groups of a society may share a similar geophysical exposure, they also have diverging capacities and abilities that vary over the geographical space [43,44].
As noted in the method section, for the identification of social vulnerability in the RM of St. Andrews, certain demographic and housing characteristics (e.g., age, race/ethnicity, income levels, gender, building quality, public infrastructure) were considered, which were hypothesized to play an influential role in increasing or reducing the overall vulnerability of a community to flood hazards [18,19].
The list of selected indicators to characterize the status of the vulnerability of inhabitants of the RM of St. Andrews is presented in Table 2. In Table 3, the indicator values by ward in the RM of St. Andrews are shown. These data were extracted from the Canadian version of HAZUS MH 2.1. This version of Canadian HAZUS includes the 2011 National Census of Canada that has been inbuilt with the software package.
The computed values of the indicator variables of the social vulnerability are presented in Appendix A Table A1 (for total household index), Table A2 (for total population index), Table A3 (for female population index), Table A4 (for population < 16 years of age index), Table A5 (for population > 65 years of age index), Table A6 (for total non-white population index), Table A7 (for income less than 50 K/year index), and Table A8 (for average house value index). These calculated index values range from 0 to 1.00. The higher the index value, the greater the vulnerability. Each individual indicator variable of social vulnerability can be examined independently [44,45]. The spatial distribution of each of the individual index values can also be depicted on a map (Figure 8).
Human-induced factors like population and housing density and pattern can account for higher vulnerability [46]. A higher population density can also reduce the community’s sensitivity to deal with disasters [47]. With the highest household and population size, Ward-5 has the maximum housing (1.00) and population vulnerability index (1.00), while Ward-6, with housing and population indices of 0.618 and 0.600, respectively, possess the lowest social vulnerability for these two indicator variables (Table 2 and Table 3). Considering these two indices, Figure 8 (housing index and population index portion) also represents that areas close to Netley Creek in Ward-5 and areas close to Red River in Ward-1, 2, and 3 are more susceptible to being socially vulnerable to flood disaster.
Gender affects vulnerability on a large scale [48]. During and after the disaster period, females tend to be more vulnerable than males because of their social responsibility of being a mother and towards family. Women also suffer the impacts of a disaster disproportionately because of lower job status in the economy, which often disappears or even augments after a disaster strikes [49]. Gender effects show a similar pattern as the other factors with a higher risk in denser populated areas.
Children and the elderly population of a community might not be as resilient and could be at greater risk during and after the disaster period [48,50]. Disaster disruptions can significantly affect the psychological and physical health of children [47,50]. The elderly population is likely to suffer major health-related consequences and may not recover quickly [49]. Because of physical mobility challenges, the elderly population is also generally more reluctant to evacuate and tends to be distressed by the prospect of leaving their homes [51], and trends in St. Andrews follow a similar pattern [52].
Racial and ethnic minorities and Indigenous peoples tend to be more vulnerable to natural hazards because the minority population is more likely to be poor [53,54]. In particular, property rights and housing discrimination may confine or force minority groups to live in certain hazard-prone areas [20]. During the disaster and post-recovery period, language difficulties of the immigrant population can also increase disaster vulnerability [51]. The male-female population ratio, children and elderly population, and the minority groups of non-white composition in the RM of St. Andrews are evenly distributed over the municipality, which is also reflected in similar patterns of index values (Appendix A Table A3, Table A4, Table A5 and Table A6 and Figure 8). These factors thereby create a similar type of social vulnerability for these indicator variables in the studied municipality.
People with a lower income level are typically more vulnerable to disasters than those in higher-income groups [54]. Low-income groups have much less scope to spend on disaster preparedness [20]. Poor people suffer from higher mortality rates [34] and face greater housing damage during disasters [49]. Unlike the previously described factors, income vulnerability extends beyond the more densely populated areas along the rivers to also include areas adjacent to marsh and lake shorelines, which are also susceptible to flooding.
Average house price, similar to income, has a broader landscape spatial dispersion than the population and demographic factors. Although the cost of damage to housing and other resources may be much higher for the wealthier people, in relative terms, the losses sustained by the poor are far more devastating [49]. In the present study, average house price was used as a surrogate for wealth and thus could be interpreted as an indicator of better resiliency capability (relative to poor people). However, it is not always valid that higher-priced houses are structurally less vulnerable than lower-priced houses. Several other factors are also responsible for housing vulnerability [17]. For example, riverfront lots in Ward-1 in St. Andrews have the highest flood exposure and vulnerability but also have some of the highest appraised values in the RM. From the index values of Appendix A Table A7 and Table A8, it is clearly demonstrated that Ward-6 has the highest degree of income vulnerability (income less than 50 K/year index of 1.00) while it has the lowest housing vulnerability (house value index of 0.00) as these houses are relatively cheaper. Much richer people live in Ward-1 with the highest housing vulnerability (Figure 8). Appendix A Table A7 and Table A8 and Figure 8 also demonstrate a north-south orientation of increasing (housing vulnerability)/decreasing (income vulnerability) orientation, and thus there is a complex spatial and statistical relationship between housing and income vulnerability.
The individual variable mosaics are combined to produce a composite index for the RM (Table 4). It produces a broad overview of the spatial distribution of social vulnerability within the municipality, which plays a significant role in disaster management for both the RM administration (for generalized information) and local people (for specific information) [36]. Figure 9 visually represents that there are two major zones of socially vulnerable groups in the RM of St. Andrews—one is along the Netley Creek area, and another one is at the southeast portion of the municipality. Both of these two areas are inhabited by a large number of minority groups. The southeast portion of the RM faces much more vulnerability because of the higher population and building densities, while the vulnerability of the Netley Creek area is largely driven by lower incomes.

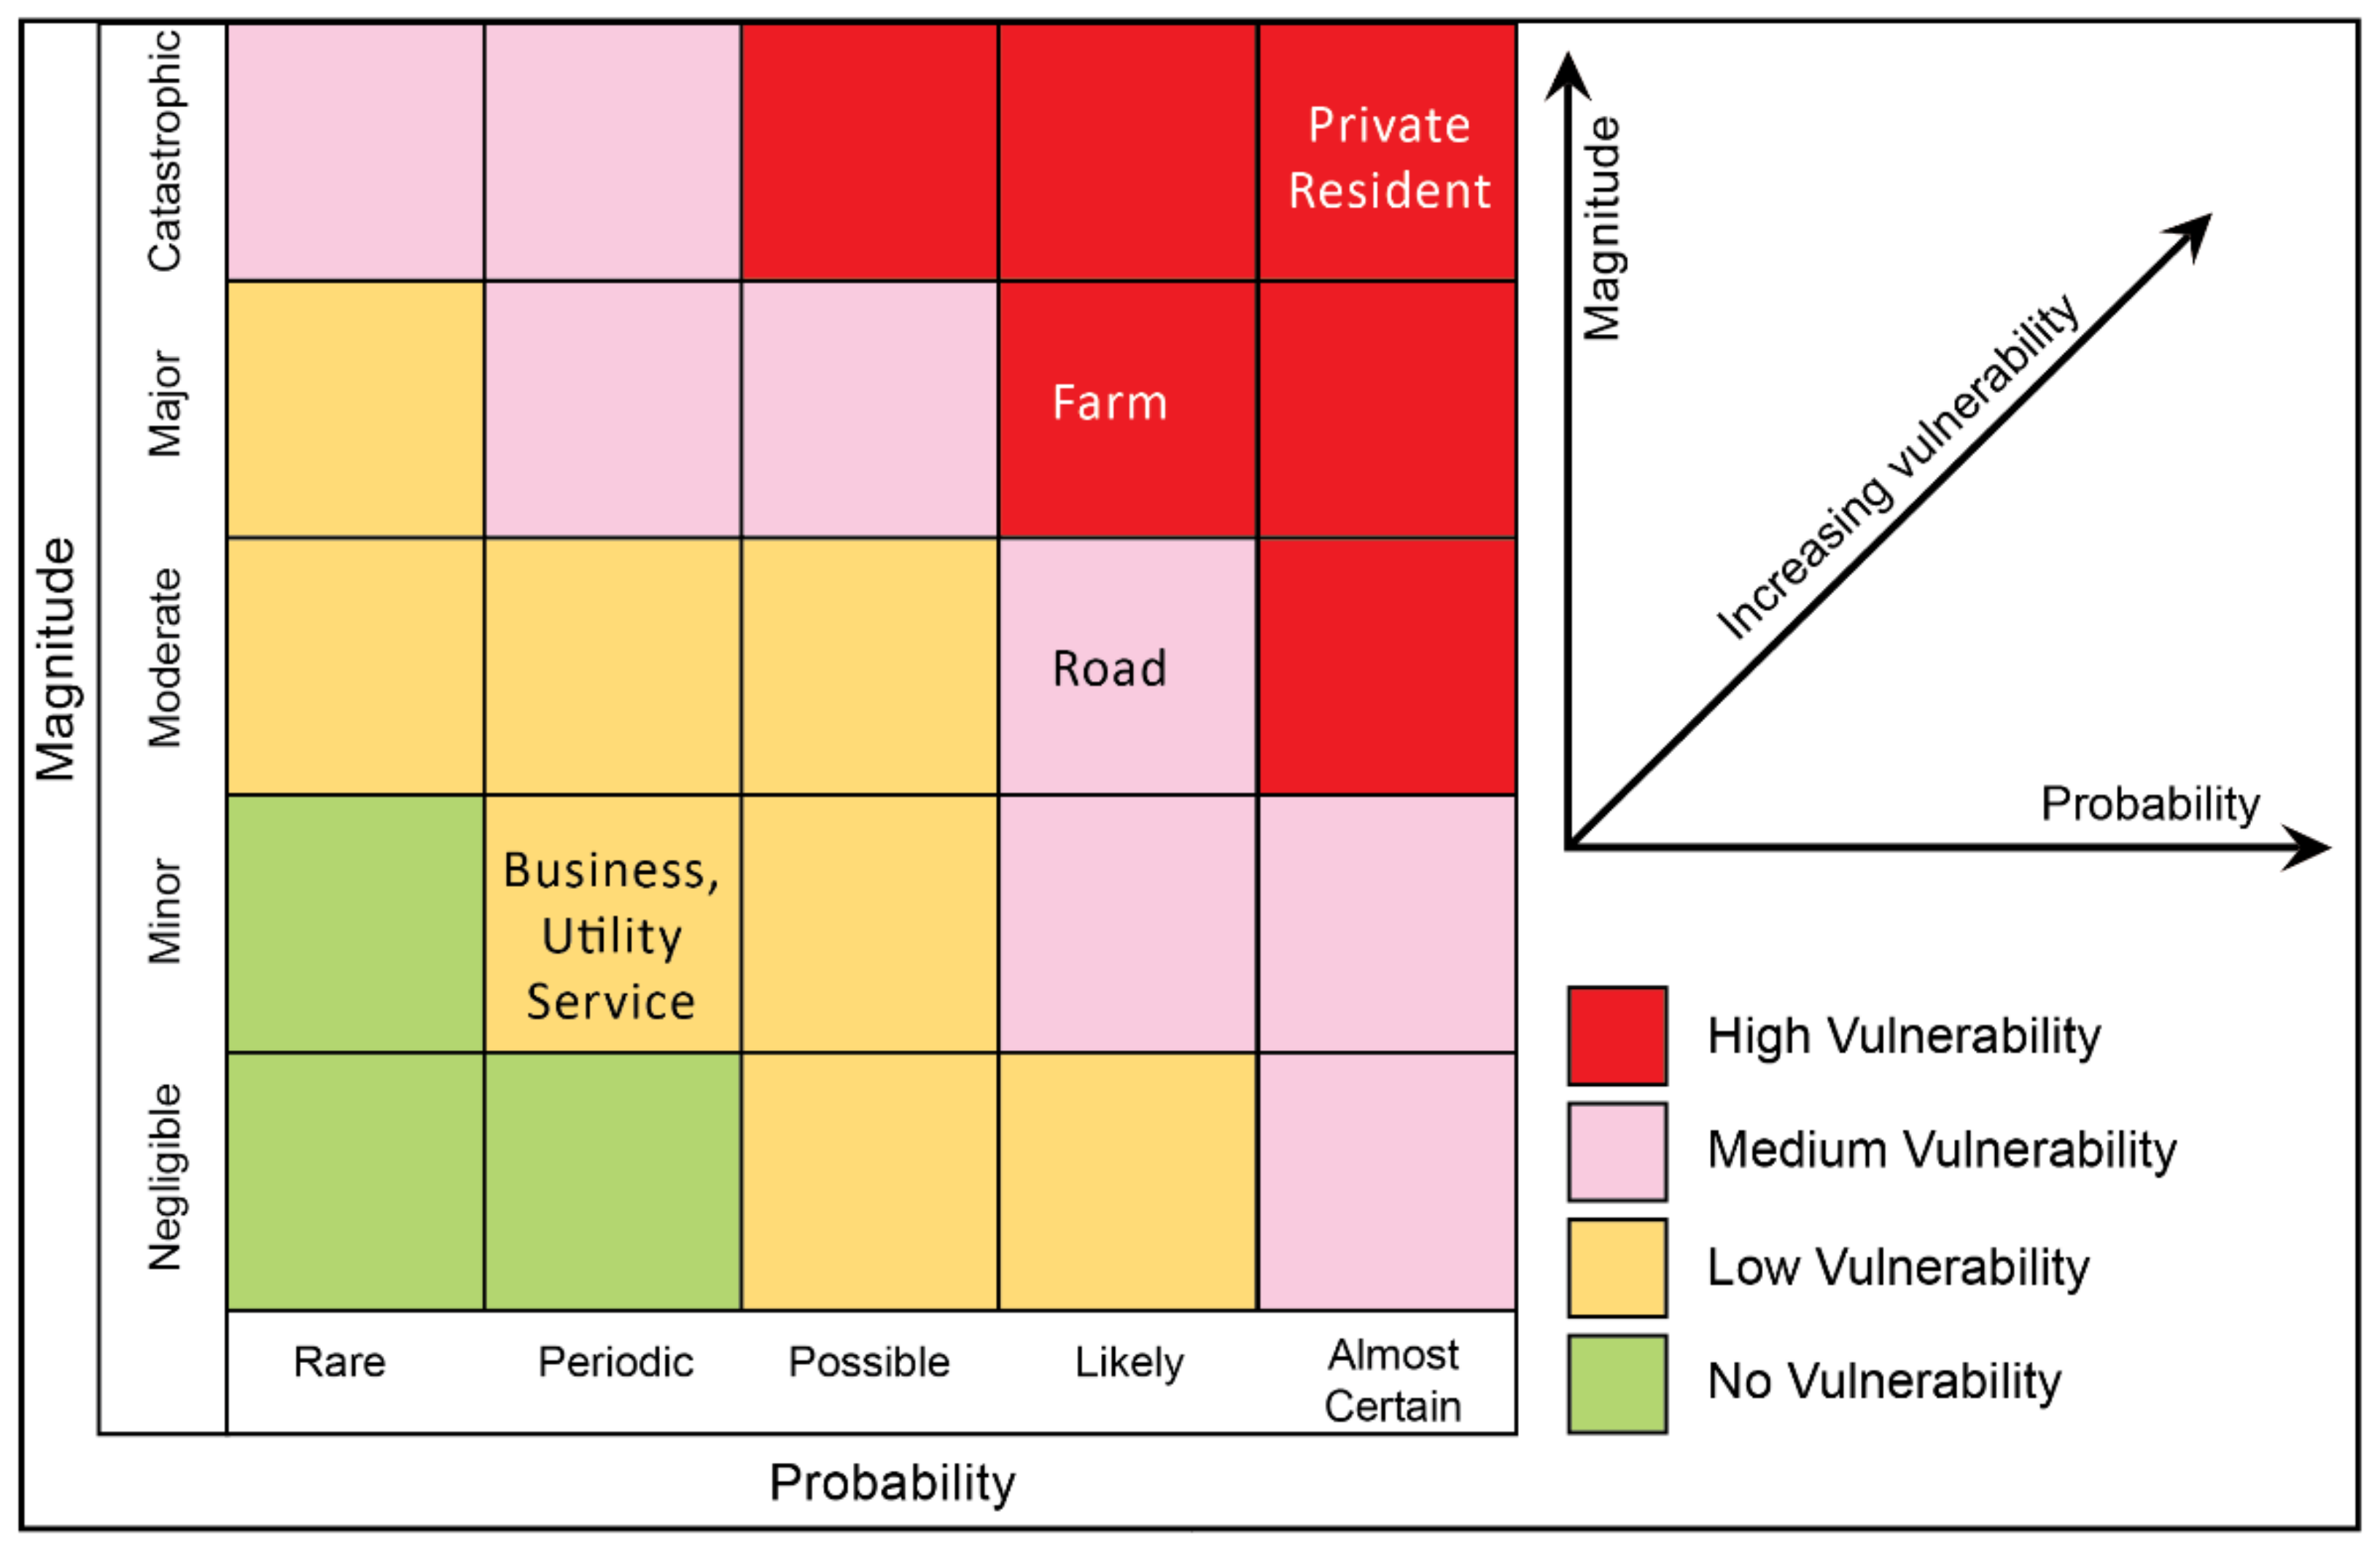
4.2.2. Geophysical Exposure of Community Elements at Risk

Drawing on the idea generated by Hewitt and Burton [34], the geophysical exposure of community elements has been identified and presented in Figure 10. According to this concept, vulnerability is the function of magnitude, duration, and frequency. The definitions for the magnitude and probability dimensions used in Figure 10 are provided in Table 5. The consequences of the flood impact have been categorized into five classes to identify the level of flood magnitude in the study area. These consequence classes that represent the magnitude of the event are: catastrophic, major, moderate, minor, and negligible. The probability of flooding also has been categorized in five classes as: ‘almost certain’, ‘likely’, ‘possible’, ‘periodic’ and ‘rare’. Respondents were asked to rate the event based on their past and present experience of flooding.
Respondent’s experience of flooding presented in Figure 10 reveals that private residents were highly vulnerable to flooding in the municipality. This implies serious vulnerability to damage to capital assets, followed by family displacement, risk of life and livelihood, critical health injury, and mental trauma. Being a predominantly agriculture-based region, farms were ranked as the second ‘impacted community element’ following flooding. The extended duration of flooding increases the vulnerability for both housing and the crops in the field. An extended duration of flood with a higher magnitude could damage farming equipment. As roads are built at a relatively higher elevation, they were not severely affected during normal flooding events. However, a higher magnitude flood with an extended duration could adversely impact the road network of the municipality. Business and utility services like electricity and internet services were the least vulnerable elements and had only been affected during the exceptionally high magnitude floods locally, such as those in 1997, 2009, and 2011.

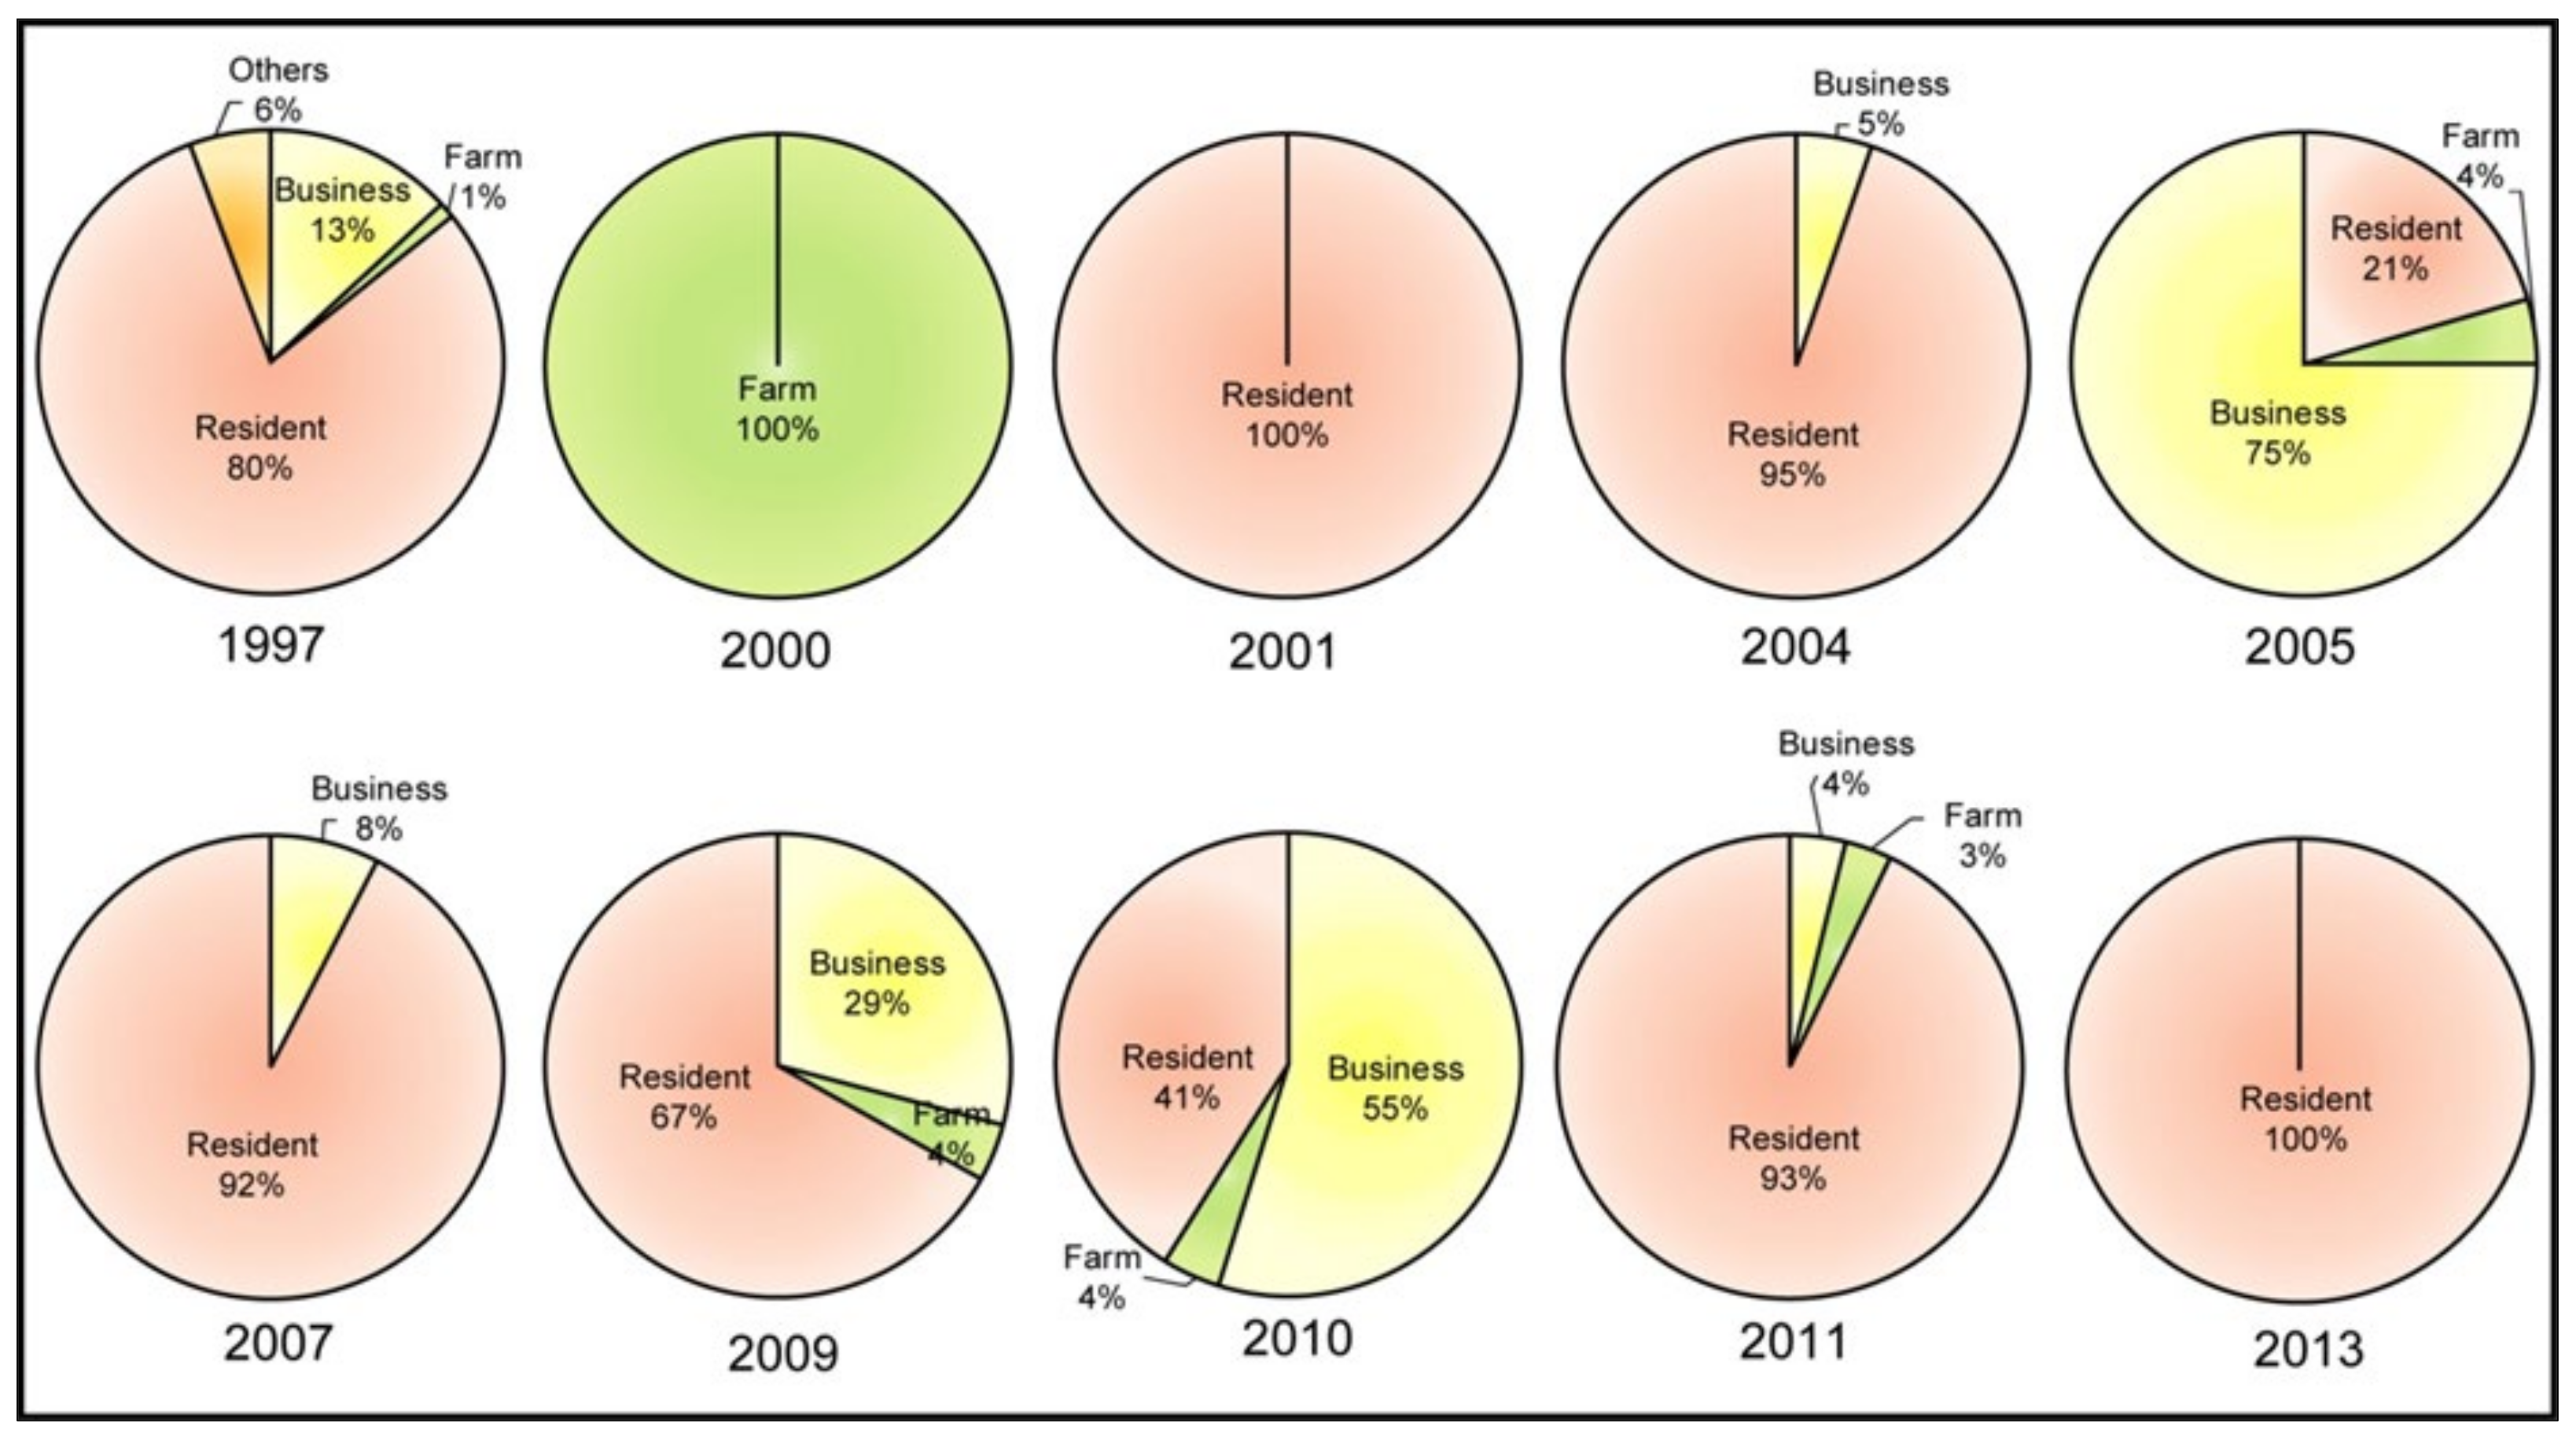
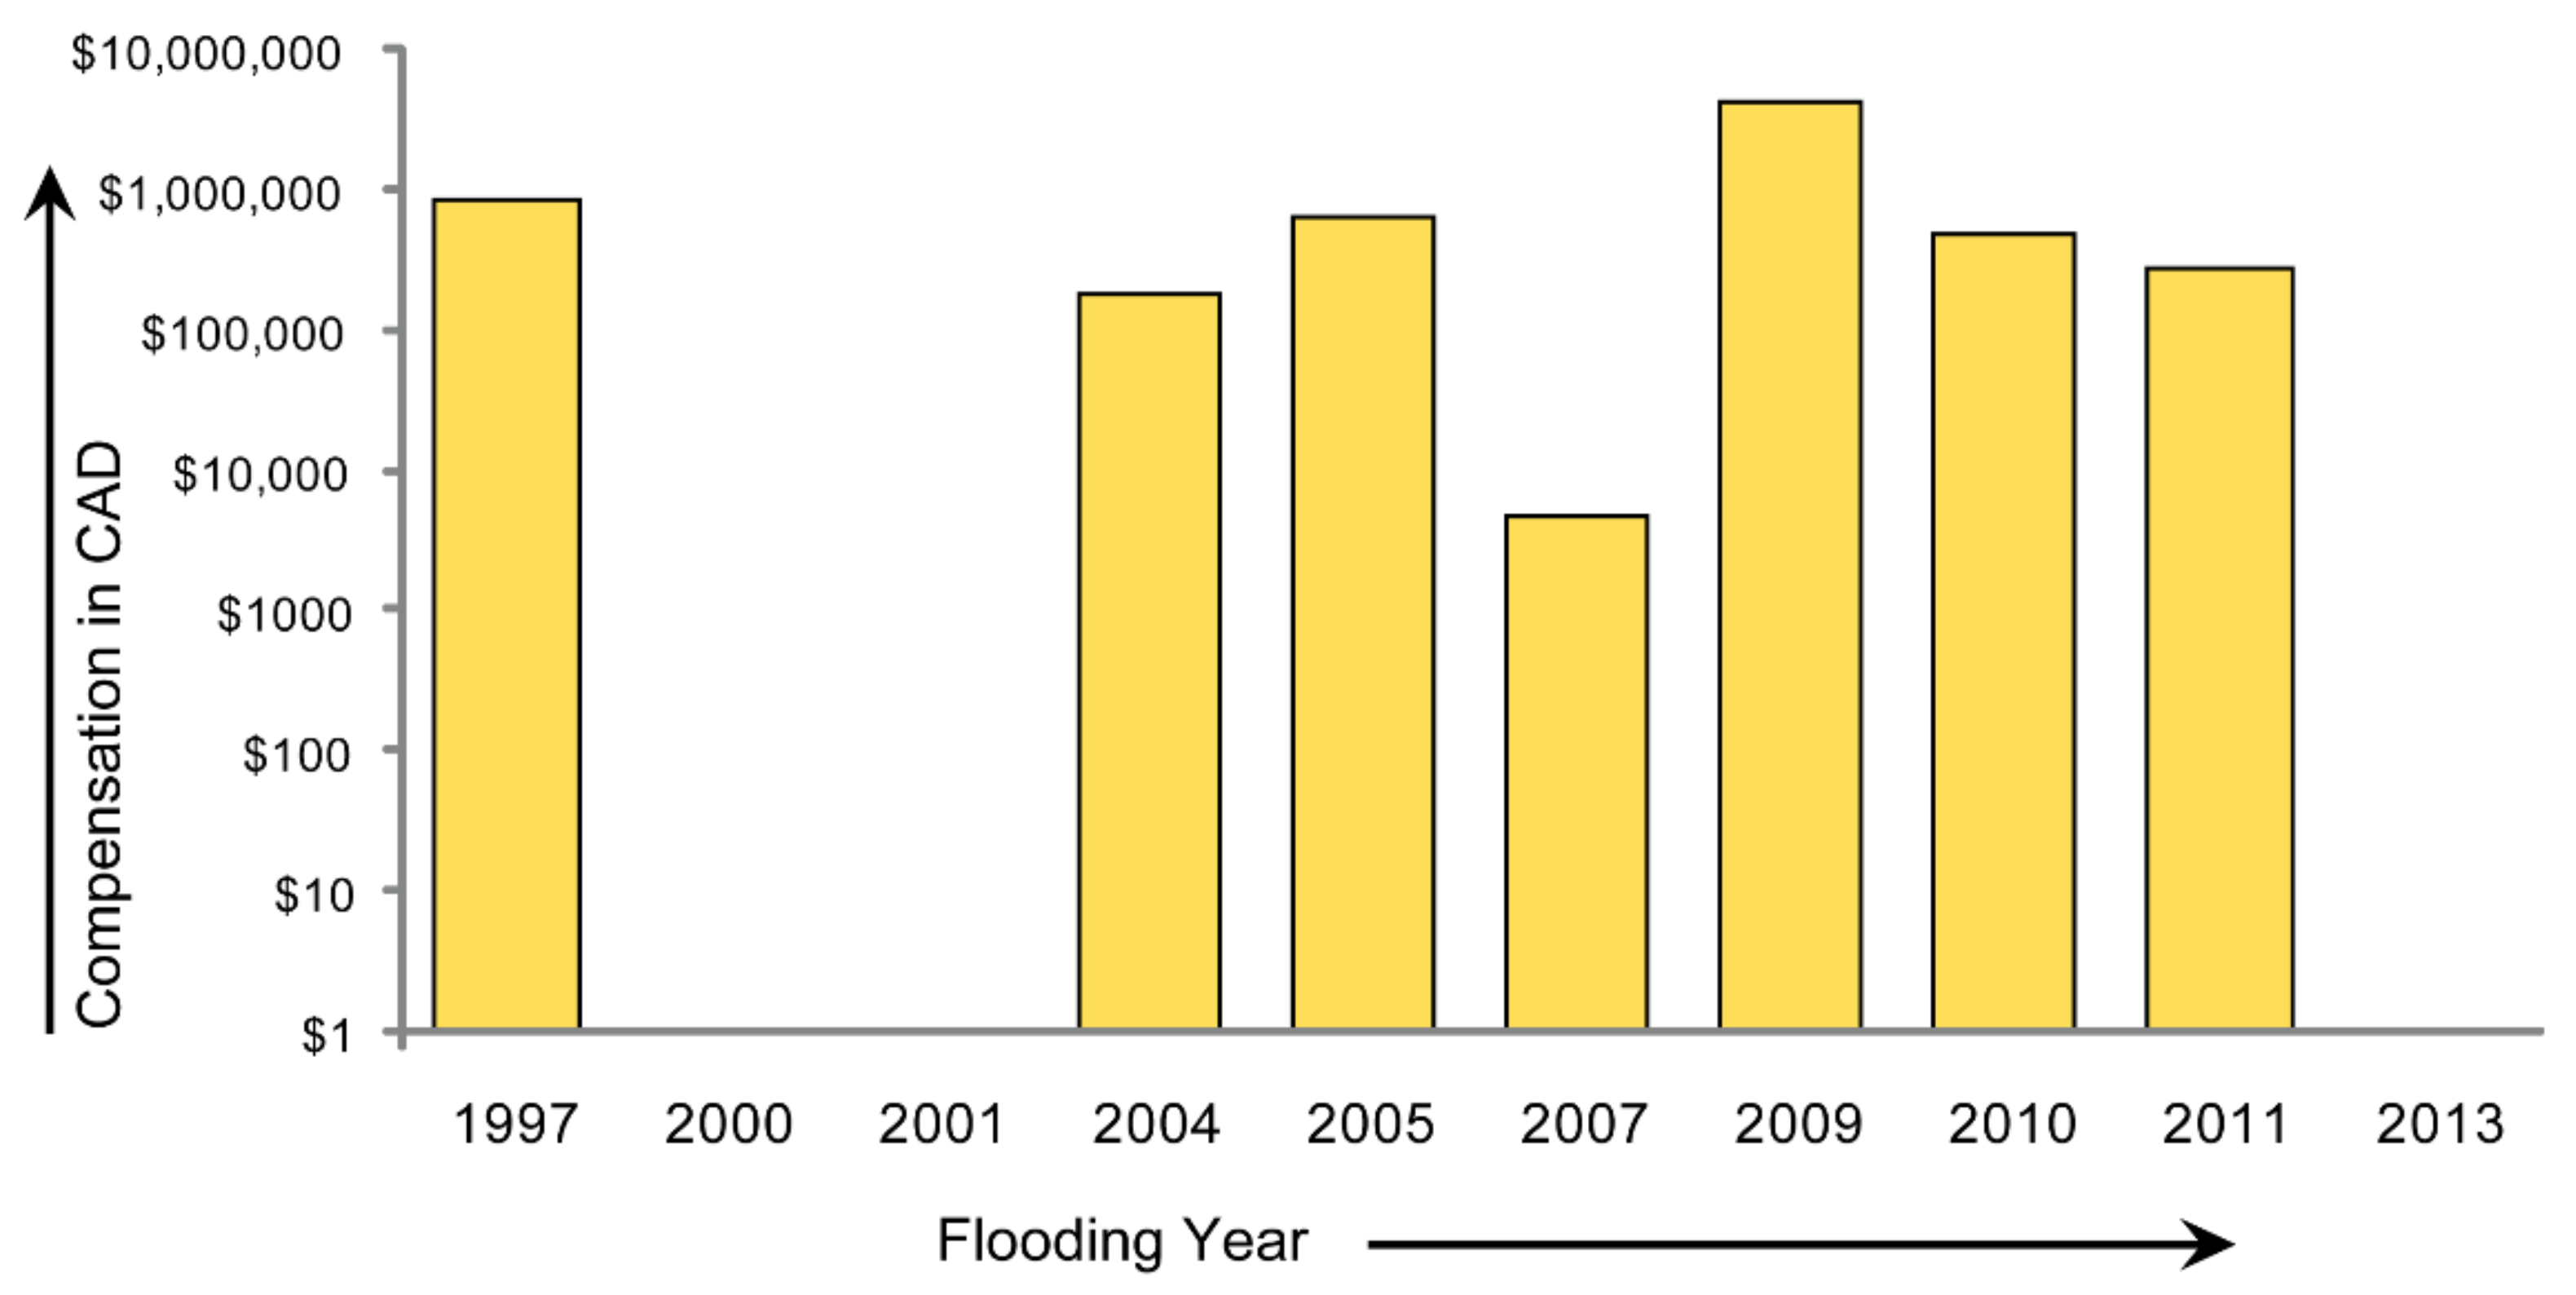
4.2.3. Recent Flood-Loss and Damages of Community Elements

Since 1997, the RM of St. Andrews has faced ten major floods; a detailed inventory and comparative analysis of DFAA data for the RM of St. Andrews has been presented in Figure 11. These indicate that during these flood events, private homes were generally impacted and thereby subsequently compensated by the Provincial government. Following the 1997 and 2009 floods, there were 90 ($611,132) and 88 ($621,587) successful claims in the RM, respectively (in constant dollars). In 1997, governmental compensation to private residents was $489,491, which was 80% of the total fund allocated to the municipality. In 2009, the residents’ claims accounted for 67% of the total, costing $415,828 to the Province. In 2005, flood loss mainly affected the business sector of the municipality, which accounted for a compensation of 75% of the total at a cost of $106,374.
Although the stakeholders interviewed for this study ranked farms as facing a higher degree of vulnerability than the business sector, because of the market and infrastructural values of the latter, businesses received more compensation. The RM also received some compensation for public assets (Figure 12). Reconstruction of damaged roads, culverts, emergency evacuation, management of dikes, and construction of temporary sandbag-based dikes fall under this category. Municipal infrastructure was seriously impacted by the floods of 1997, 2004, 2005, 2009, 2010, and 2011. Among these, the 2009 flood compensation is the highest, with a total sum of $4,208,273. Although there were major floods in 2000, 2001, and 2013 in the RM of St. Andrews, the municipality did not experience much damage to its infrastructure; hence, there was no provincial compensation towards the public sector in these years.
Along with economic flood loss and damage in the rural municipality, there was also some indirect and uncalculated cost of flooding that was identified during the field visits. Among the respondents, 90% agreed that during and after flooding, they passed through higher stress and anxiety. With a higher magnitude of floods, there is always the possibility of eroding the physical capital of community members considerably–which threatens their livelihood security. A total of 80% of the respondents commented on the adverse flooding impact on the psychology of their children in the long term. They argued that this could lead to further mental trauma; 60% also mentioned weakened or reduced emergency medical care capacity and spread of large-scale water-borne diseases during the post-flood periods.
There has been a major shift in the flood-loss risk pattern of the RM of St. Andrews in the recent past, especially after the construction of the Red River floodway. All respondents believe that the additional volume of water with the Red River floodway that discharges at St. Andrews near Lockport increases the flood loss multifold.

5. Conclusions

Because of the vulnerable geophysical setting, flooding is a common phenomenon in the south-central region of the Province of Manitoba, Canada. The current study’s landscape-level analysis revealed that both geophysical factors (flat glacial lake plain, gradual gradient decreasing from south to north, and isostatic rebound) along with human-induced factors (such as population settlement concentration in large towns, flood plain occupancy, land, and other natural resource use patterns) were the major elements contributing to flooding risk and catastrophic flood hazards and their adverse effects on the economy and society. It is noticeable that, despite undertaking costly structural flood mitigation measures, the economic damages and the volume of public compensation have been increasing in Manitoba.
The community interviews in the RM of St. Andrews have revealed a high degree of flood vulnerability, both in terms of geophysical exposure and varied social structure. The geophysical vulnerability perspectives by and large overlap with the social vulnerability indices in the study area; however, there are also areas of interest where social structure alone could generate adverse flood effects to community members. In this case, the social capital and capacity of the community play an important role in determining the vulnerability and the propensity of loss and quick recovery. Social indicators like wealth, education, and population composition have had a significant impact on developing the community’s resilience capability to flood hazards. Thus, the spatial distribution of social structure in St. Andrews produces differential place vulnerability with differential resilience capacity to flood.
Based on the findings of the research work, the following recommendations are suggested:
(i)
As there was no up-to-date real-time flood map for the study area available at the time of field investigation, it is highly recommended that the local municipality should make efforts to develop real-time flooding maps. They could use several benchmarks on the ground to measure the flooding depth and extent during the flooding period. Support from geo-informatics tools can be actively taken from the provincial departments. For example, in 2020, lidar was collected for this purpose, and a DEM was developed and published in August 2021.
(ii)
The local government, through engaging the most vulnerable groups, should nourish social networking more actively. Although the rural municipality is presently arranging regular public meetings, the participation of the most vulnerable groups, for example, the minority groups and low-income groups, is still nominal; the RM authority should engage these vulnerable groups more in the discussion sessions and plan emergency policies based on their requirements.
(iii)
All local governments in the Province should develop the essential facility and lifeline databases, and provincial departments like Manitoba Infrastructure should integrate this information into a single GIS database for Province-wide planning for flood mitigation and risk reduction.

Author Contributions

Conceptualization, C.E.H. and K.H.M.; methodology, K.H.M., D.W. and C.E.H.; software, K.H.M. and D.W.; validation, C.E.H., K.H.M. and D.W.; formal analysis, K.H.M. and C.E.H.; investigation, K.H.M. and C.E.H.; resources, C.E.H.; data curation, K.H.M. and D.W.; writing—original draft preparation, C.E.H., K.H.M. and J.R.Z.; writing—review and editing, C.E.H. and D.W.; visualization, C.E.H. and K.H.M.; supervision, C.E.H. and D.W.; project administration, C.E.H.; funding acquisition, C.E.H. All authors have read and agreed to the published version of the manuscript.

Funding

This research was funded by the Social Science and Humanities Research Council (SSHRC), Ottawa, ON, Canada, InSight Grant #435-2018-552.

Institutional Review Board Statement

The study was conducted in accordance with the Declaration of Helsinki, and was approved by the Joint Research Ethics Board of the University of Manitoba, Canada (HS 17307—J2014: 135), dated 15 March 2015)” for studies involving humans.

Informed Consent Statement

Informed consent was obtained from all subjects involved in the study.

Data Availability Statement

The datasets used and/or analyzed during the present study are available from the corresponding author on reasonable request.

Acknowledgments

The authors are thankful to the Social Science and Humanities Research Council (SSHRC), Ottawa, ON, Canada (InSight Grant #435-2018-552) for funding this research. We are also thankful to Jeremy Angus, Deputy Minister, Manitoba Infrastructure, for his interest in our research and help, and to the community participants from the Rural Municipality of St. Andrews, Manitoba, Canada, for their kind collaboration with the fieldwork.

Conflicts of Interest

The authors declare no conflict of interest. The funders had no role in the design of the study, in the collection, analyses, or interpretation of data, in the writing of the manuscript, or in the decision to publish the results.

Appendix A

Table A1. Household index in RM of St. Andrews by ward.
Ward No.Households in Census Block (X)Households in RMHouseholds Ratio
(xy = X/Y)
Households Index
(Z = xy/max(xy)
Ward-171842820.1680.802
Ward-283442820.1950.932
Ward-361742820.1440.689
Ward-466542820.1550.743
Ward-589542820.2091.000
Ward-655342820.1290.618
Source: HAZUS Canada, 2014.
Table A2. Population index in RM of St. Andrews by ward.
Ward No.Population in Census Block
(X)
Population in RM
(Y)
Population Ratio
(xy = X/Y)
Population Index
(Z = xy/max(xy)
Ward-1194211,3590.1710.838
Ward-2231911,3590.2041.000
Ward-3162011,3590.1430.699
Ward-4180411,3590.1590.779
Ward-5227211,3590.2000.980
Ward-6140211,3590.1230.605
Source: HAZUS Canada, 2014.
Table A3. Female population index in RM of St. Andrews by ward.
Ward No.Female Population in Census Block
(X)
Female Population in RM
(Y)
Female Population Ratio
(xy = X/Y)
Female Population Index
(Z = xy/max(xy)
Ward-196956080.1730.847
Ward-2114456080.2041.000
Ward-380856080.1440.706
Ward-488356080.1570.772
Ward-5111356080.1980.973
Ward-669156080.1230.604
Source: HAZUS Canada, 2014.
Table A4. Population < 16 year index in RM of St. Andrews by ward.
Ward No.Population < 16 Years in Census Block
(X)
Population < 16 Years in RM
(Y)
Population < 16 Years Ratio
(xy = X/Y)
Population < 16 Year Index
(Z = xy/max(xy)
Ward-137621630.1740.836
Ward-243721630.2020.971
Ward-331621630.1460.702
Ward-434421630.1590.765
Ward-545021630.2081.000
Ward-624021630.1110.533
Source: HAZUS Canada, 2014.
Table A5. Population > 65 year index in RM of St. Andrews by ward.
Ward No.Population > 65 Years in Census Block
(X)
Population > 65 Years in RM
(Y)
Population > 65 Years Ratio
(xy = X/Y)
Population 65 Years Index
(Z = xy/max(xy)
Ward-124514400.1700.830
Ward-228514400.1980.965
Ward-320914400.1450.708
Ward-422714400.1580.769
Ward-529514400.2051.000
Ward-617914400.1240.606
Source: HAZUS Canada, 2014.
Table A6. Non-White index in RM of St. Andrews by ward.
Ward No.Non-White Population in Census Block
(X)
Non-White Population in RM
(Y)
Non-White Population Ratio
(xy = X/Y)
Non-White Population
Index
(Z = xy/max(xy)
Ward-126715780.1690.821
Ward-230715780.1950.944
Ward-322915780.1450.704
Ward-424915780.1580.766
Ward-532515780.2061.000
Ward-620115780.1270.618
Source: HAZUS Canada, 2014.
Table A7. Income < 50 K/year index in RM of St. Andrews by ward.
Ward No.Income < 50 K/year in Census Block
(X)
Income < 50 K/year in RM
(Y)
Income < 50 K/year Ratio
(xy = X/Y)
Income < 50 K/year Index
(Z = xy/max(xy)
Ward-1272940.0920.265
Ward-2242940.0820.235
Ward-3272940.0920.265
Ward-4382940.1290.372
Ward-5762940.2590.745
Ward-61022940.3471.000
Source: HAZUS Canada, 2014.
Table A8. House value index in RM of St. Andrews by ward.
Ward No.Average House Value in Census Block
(X)
Average House Value in RM
(Y)
Value Difference
x1y1 = (XY)
New House Value
x2y2 = (x1y1 + max x1y1)
House Value Index
Z = x2y2/max x2y2
Ward-1201,795152,95748,838107,4051.000
Ward-2181,876152,95728,91987,4860.815
Ward-3172,106152,95719,14977,7160.724
Ward-4163,823152,95710,86669,4330.646
Ward-5103,750152,957−49,20793600.087
Ward-694,390152,957−58,56700.000
Source: RM of St. Andrews, 2014.

References

  1. Corkery, M.T. Geology and landforms of Manitoba. In The Geography of Manitoba: Its Land and Its People; Welsted, W., Everitt, J., Stadel, C., Eds.; The University of Manitoba Press: Winnipeg, MN, Canada, 1996; pp. 11–30. [Google Scholar]
  2. Rannie, W. The 1997 flood event in the Red River basin: Causes, assessment and damages. Can. Water Resour. J. Rev. Can. Des Ressour. Hydriques. 2016, 41, 45–55. [Google Scholar] [CrossRef]
  3. Welsted, W.; Everitt, J.; Stadel, C. Manitoba: Geographical identity of a Prairie Province. In The Geography of Manitoba: Its Land and Its People; Welsted, W., Everitt, J., Stadel, C., Eds.; The University of Manitoba Press: Winnipeg, MN, Canada, 1996; pp. 3–7. [Google Scholar]
  4. Rannie, W.F. The 1997 Red River Flood in Manitoba, Canada. Prairie Perspect. Geogr. Essays 1998, 1, 1–24. [Google Scholar]
  5. Haque, C.E. Risk assessment, emergency preparedness and response to hazards: The case of the 1997 Red River Valley flood, Canada. Nat. Hazards 2000, 21, 225–245. [Google Scholar] [CrossRef]
  6. Linstone, H.A.; Turoff, M. (Eds.) The Delphi Method: Techniques and Applications; Addison-Wesley: Boston, MA, USA, 1975; Volume 29. [Google Scholar]
  7. Cutter, S.L. Vulnerability to Environmental Hazards. Prog. Hum. Geogr. 1996, 20, 529–539. [Google Scholar] [CrossRef]
  8. StatCan. Population of Manitoba: 2011Census. 2011. Available online: http://www12.statcan.gc.ca/census-recensement/2011/dp-pd/prof/details/page.cfm?Lang=E&Geo1=CSD&Code1=4613043&Geo2=PR&Code2=46&Data=Count&SearchText=St.%20Andrews&SearchType=Begins&SearchPR=01&B1=All&Custom= (accessed on 21 July 2020).
  9. RM of St. Andrews. Rural Municipality of St. Andrews Report. 2014. Available online: http://www.rmofstandrews.com/main.asp?cat_ID=2 (accessed on 12 July 2019).
  10. Dalkey, N.; Helmer, O. An experimental application of the Delphi method to the use of experts. Manag. Sci. 1963, 9, 458–467. [Google Scholar] [CrossRef]
  11. Young, S.J.; Jamieson, L.M. Delivery methodology of the Delphi: A comparison of two approaches. J. Park Recreat. Adm. 2001, 19, 42–58. [Google Scholar]
  12. Hsu, C.C.; Sandford, B.A. The Delphi technique: Making sense of consensus. Pract. Assess. Res. Eval. 2007, 12, 10. [Google Scholar]
  13. Cutter, S.L.; Boruff, B.J.; Shirley, W.L. Social vulnerability to environmental hazards. Soc. Sci. Q. 2003, 84, 242–261. [Google Scholar] [CrossRef]
  14. Fekete, A. Validation of a social vulnerability index in context to river-floods in Germany. Nat. Hazards Earth Syst. Sci. 2009, 9, 393–409. [Google Scholar] [CrossRef] [Green Version]
  15. De Brito, M.M.D.; Evers, M.; Almoradie, A.D.S. Participatory flood vulnerability assessment: A multi-criteria approach. Hydrol. Earth Syst. Sci. 2018, 22, 373–390. [Google Scholar] [CrossRef] [Green Version]
  16. Bakkensen, L.A.; Fox-Lent, C.; Read, L.; Linkov, I. Validating resileince and vulnerability indices in the context of natural disasters. Risk Anal. 2017, 37, 982–1004. [Google Scholar] [CrossRef] [PubMed] [Green Version]
  17. Cutter, S.L.; Mitchell, J.T.; Scott, M.S. Revealing the vulnerability of people and places: A case study of Georgetown County, South Carolina. Ann. Assoc. Am. Geogr. 2000, 90, 713–737. [Google Scholar] [CrossRef]
  18. Blaikie, P.; Cannon, T.; Davis, I.; Wisner, B. At Risk: Natural Hazards, People’s Vulnerability and Disasters, 2nd ed.; Routledge: London, UK, 2014. [Google Scholar]
  19. Tobin, G.A. Natural Hazards: Explanation and Integration; Guilford Press: New York, NY, USA, 1997. [Google Scholar]
  20. Clark, G.; Moser, S.C.; Ratick, S.J.; Dow, K.; Meyer, W.B.; Emani, S.; Jin, W.; Kasperson, J.X.; Kasperson, R.E.; Schwarz, H.E. Assessing the vulnerability of coastal communities to extreme storms: The case of Revere, MA, USA. Mitig. Adapt. Strateg. Glob. Change 1998, 3, 59–82. [Google Scholar] [CrossRef]
  21. Bluemle, J.P. The Face of North Dakota: The Geological Story. Educational Series 11, North Dakota Geological Survey. 1977. Available online: https://www.dmr.nd.gov/ndgs/documents/publication_list/pdf/educationseries/ed-11.pdf (accessed on 12 November 2014).
  22. Kalssen, R.W. Quaternary geology and geomorphology of Assiniboine and Qu’appelle valleys of Manitoba and Saskatchewan. Bull. Geol. Surv. Can. Dep. Energy Mines Resour. Can. 1975, 228, 61–69. [Google Scholar]
  23. Brooks, N. Vulnerability, Risk and Adaptation: A Conceptual Framework; Tyndall Centre Working Paper No. 38; Tyndall Centre for Climate Change Research: Norwich, UK, 2003; pp. 1–16. [Google Scholar]
  24. Brooks, G.R.; Thorleifsonl, L.H.; Lewis, C.M. Influence of loss of gradient from postglacial uplift on Red River flood hazard, Manitoba, Canada. Holocene 2005, 15, 347–352. [Google Scholar] [CrossRef]
  25. Matile, G.L.D.; Lewism, C.F.M.; Nelson, E.; Thorleifson, L.H.; Todd, B.J. Holocene evolution of the Manitoba great lakes region. In Manitoba Energy and Mines, Geological Services, Open File Report OF96-98, 1 Sheet; Department of Manitoba Energy and Mines: Winnipeg, MN, Canada, 1996. [Google Scholar]
  26. McNeely, R.; Nelson, E.; Morlan, R.E. Manitoba radiocarbon dates: Geological radiocarbon dates (section 1), archaeological radio carbon dates (section II). In Manitoba Industry, Trade and Mines, Manitoba Geological Survey, Open File Report OF2000-1; Department of Manitoba Energy and Mines: Winnipeg, MN, Canada, 2000. [Google Scholar]
  27. Manitoba, H. Influencing Factors on Water Levels-Lake Winnipeg. 2000. Available online: https://www.hydro.mb.ca/corporate/water_regimes/lake_wpg_facts_fiction.shtml (accessed on 11 December 2020).
  28. Adams, G.D. Wetlands of the Prairies of Canada; National Wetlands Working Group Ecological Land Classification Series, No. 24; Sustainable Development Branch, Environment Canada: Ottawa, ON, Canada; Polyscience Publications Inc.: Montreal, QC, Canada, 1988. [Google Scholar]
  29. Sierra Club. Red River Valley: Future Flooding or Sensible Solutions? How Basin Wide Coordination and Wetlands Protection Can Reduce The Risk of Flooding in the Red River Valley. A Rep. Agassiz Basin Group Sierra Club 1998, cited in Juliano, K. and Simonovic, S.P. The Impact of Wetlands on Flood Control in the Red River Valley of Manitoba, Final Report to International Joint Commission, The University of Manitoba, Winnipeg, Canada. 1999. Available online: http://citeseerx.ist.psu.edu/viewdoc/download?rep=rep1&type=pdf&doi=10.1.1.37.9662 (accessed on 4 December 2021).
  30. Ducks Unlimited Canada. Now Is the Time for a Wetland Policy in Manitoba. 2011. Available online: http://www.ducks.ca/assets/2012/07/Now-is-the-Time-for-a-Wetland-Policy-in-Manitoba.pdf?9d7bd4 (accessed on 19 December 2019).
  31. StatCan. Population estimation of Manitoba, 2020–2021. 2021. Available online: https://www.statista.com/statistics/569878/population-estimates-manitoba-canada/ (accessed on 13 November 2021).
  32. Konard, C.P. Effects of Urban Development on Flood. USGS Geological Survey, Fact Sheet 076-03. 2014. Available online: http://pubs.usgs.gov/fs/fs07603/ (accessed on 12 July 2014).
  33. Government of Manitoba. Manitoba Flood Facts. 2014. Available online: http://www.gov.mb.ca/flooding/historical_facts.html (accessed on 15 December 2020).
  34. Hewitt, K.; Burton, I. Hazardousness of a Place: A Regional Ecology of Damaging Events; Res. Publ. 6; Department of Geography, University of Toronto: Toronto, ON, Canada, 1971. [Google Scholar]
  35. Gabor, T.; Griffith, T.K. The assessment of community vulnerability to acute hazardous materials incidents. J. Hazard. Mater. 1980, 3, 323–333. [Google Scholar] [CrossRef] [Green Version]
  36. Timmerman, P. Vulnerability Resilience and Collapse of Society: A Review of Models and Possible Climatic Applications; Institute for Environmental Studies, University of Toronto: Toronto, ON, Canada, 1981. [Google Scholar]
  37. Pijawka, K.D.; Radwan, A.E. The transportation of hazardous materials: Risk assessment and hazard management. Hazard. Mater. 1980, 3, 323–333. [Google Scholar]
  38. Mitchell, J.K.; Devine, N.; Jagger, K. A Contextual model of natural hazard. Geogr. Rev. 1989, 79, 391–409. [Google Scholar] [CrossRef]
  39. Watts, M.J.; Bohle, H.G. The space of vulnerability: The causal structure of hunger and famine. Prog. Hum. Geogr. 1993, 17, 33–67. [Google Scholar] [CrossRef]
  40. Wu, S.Y.; Yarnal, B.; Fisher, A. Vulnerability of coastal communities to sea-level rise: A case study of Cape May county, New Jersey, USA. Clim. Res. 2002, 22, 255–270. [Google Scholar] [CrossRef] [Green Version]
  41. Hewitt, K. (Ed.) Interpretations of Calamity from the Viewpoint of Human Ecology (No. 1); Taylor & Francis: Abingdon, UK, 1983. [Google Scholar]
  42. Nelson, K.S.; Abkowitz, M.D.; Camp, J.V. A method for creating high resolution maps of social vulnerabilityinnthe content of environmental hazards. Appl. Geogr. 2015, 63, 89–100. [Google Scholar] [CrossRef]
  43. Mileti, D. Disasters by Design: A Reassessment of Natural Hazards in the United States; Joseph Henry Press: Washington, DC, USA, 1999. [Google Scholar]
  44. Rygel, L.; O’sullivan, D.; Yarnal, B. A method for constructing a social vulnerability index: An application to hurricane storm surges in a developed country. Mitig. Adapt. Strateg. Glob. Change 2006, 11, 741–764. [Google Scholar] [CrossRef]
  45. Drakes, O.; Tate, E.; Rainey, J.; Brody, S. Social vulnerability and short-term disaster assistance in the United States. Int. J. Disaster Risk Reduct. 2021, 53, 102010. [Google Scholar] [CrossRef]
  46. Pielke, R.A., Jr.; Landsea, C.W. Normalized hurricane damages in the United States: 1925-95. Weather Forecast 1998, 13, 621–631. [Google Scholar] [CrossRef]
  47. Cicone, R.; Parris, T.M.; Way, D.S.; Chiesa, C. Geospatial modeling to identify populations vulnerable to natural hazards. In Proceedings of the International Symposium on Remote Sensing of Environment, Honolulu, HI, USA, 10–14 November 2003. [Google Scholar]
  48. Enarson, E.; Morrow, B.H. A gendered perspective: The voices of women. In Hurricane Andrew: Ethnicity, Gender, and the Sociology of Disasters; Peacock, W.G., Morrow, B.H., Gladwin, H., Eds.; Routledge: London, UK, 1997; pp. 116–139. [Google Scholar]
  49. Morrow, B.H. Identifying and mapping community vulnerability. Disasters 1999, 23, 1–18. [Google Scholar] [CrossRef]
  50. Makwana, N. Disaster and its impact on mental health: A narrative review. J. Fam. Med. Prim. Care 2019, 8, 3090–3095. [Google Scholar] [CrossRef]
  51. Bianchi, S.M.; Spain, D. Women, work, and family in America. Popul. Bull. 1996, 51, 1–48. [Google Scholar]
  52. Gladwin, H.; Peacock, W.G. Warning and evacuation: A night for hard houses. In Hurricane Andrew: Ethnicity, Gender, and the Sociology of Disasters; Peacock, W.G., Morrow, B.H., Gladwin, H., Eds.; Routledge: London, UK, 1997; pp. 52–74. [Google Scholar]
  53. Fothergill, A.; Maestas, E.G.; Darlington, J.D. Race, ethnicity and disasters in the United States: A review of the literature. Disasters 1999, 23, 156–173. [Google Scholar] [CrossRef]
  54. Fothergill, A.; Peek, L.A. Poverty and disasters in the United States: A review of recent sociological findings. Nat. Hazards 2004, 32, 89–110. [Google Scholar] [CrossRef]
Figure 1. Comparison of flood years in relation to natural spring peak discharges and natural spring peak stages measured at James Avenue, Winnipeg. (Source: Government of Manitoba website, 2019). Source of Data: Manitoba Conservation and Water Stewardship, 2014. Note: Natural discharges of 1974, 1979, 1996, 1997, 2006, 2009, and 2011 were computed without the use of Red River Floodway, Portage Diversion, and Shellmouth Dam.
Geosciences 12 00056 g001
Figure 2. Local community study area map—Rural Municipality (RM) of St. Andrews, Manitoba, Canada. Source: Compiled after Manitoba Land Initiative and Natural Resource Canada, 2014.
Geosciences 12 00056 g002
Figure 3. Conceptual flow diagram of implemented Delphi process.
Geosciences 12 00056 g003
Figure 4. South–north unusual orientation of Red River with a glacial lake plain topography. Source: Compiled after Musée du Fjord, 2002 (Note that image is not to scale).
Geosciences 12 00056 g004
Figure 5. Relationships between Red River peak discharges and peak stages at James Avenue, Winnipeg, Manitoba.
Geosciences 12 00056 g005
Figure 6. Flood loss trend in Manitoba (cost normalized at 2014 Canadian dollars).
Geosciences 12 00056 g006
Figure 7. Geophysical vulnerability in RM of St. Andrews, Manitoba, Canada. Source: Compiled after, RM of St. Andrews, 2014, MLI, 2014; Field Survey 2014–15.
Geosciences 12 00056 g007
Figure 8. Calculated individual Social Vulnerability Indices for indicator variables. Source: Data compiled from HAZUS Canada, 2014, and RM of St. Andrews, 2014.
Geosciences 12 00056 g008
Figure 9. Calculated composite social vulnerability index. Source: Data compiled from HAZUS Canada, 2014, RM of St. Andrews, 2014.
Geosciences 12 00056 g009
Figure 10. Identification of physically exposed community elements with respective vulnerability (see Table 5 for definitions for Magnitude and Probability). Source: Data collected from field survey, 2014–2015; Concept derived from Hewitt and Burton, 1974.
Geosciences 12 00056 g010
Figure 11. DFAA compensation for the private sector in the RM of St. Andrews. Source: EMO, 2014.
Geosciences 12 00056 g011
Figure 12. Year-wise DFAA compensation of flooding in RM of St. Andrews for the public sector. Source: Manitoba Conservation, 2014.
Geosciences 12 00056 g012
Table 1. Meteorological conditions for the major historical floods in Manitoba, Canada.
Meteorological ConditionsFlooding Year
18261852186119501979199720092011
Heavy precipitation in the previous yearx
Very cold and long winterxxxx
Substantial snowfall in Winterxx
Snowfall/blizzard in late winter xx
Quick melting of ice upstreamxxxx
Heavy early spring precipitationx
Late and sudden thawing xx
Ice jam conditionx
Source: Data compiled from Royal Commission Report, 1958; Welsted, 1996; Rennie, 1998; 2002; Bumsted, 2000; Manitoba Water Stewardship, 2006; Government of Manitoba, 2009 and 2013; Manitoba Infrastructure and Transportation, 2013 and Environment Canada 2013.
Table 2. Indicators considered for social vulnerability analysis.
CharacteristicsVariable
Population and housing
  • Number of households
  • Total number of population
Differential access to resources/greater susceptibility to hazards due to physical weakness
  • Number of female population
  • Number of non-adult population (age < 16 years)
  • Number of the aged population) age > 65 years)
  • Number of non-white population
Economy and wealth
  • Income less than 50K per year
  • Average house value
Table 3. Values for indicators in St. Andrews RM.
IndicatorsWard Number
W-1W-2W-3W-4W-5W-6
Total household718834617665895553
Total Population194223191620180422721402
Female Population96911448088831113691
Population (< 16 years)376437316344450240
Population (65+ years)245285209227295179
Non-White Population267307229249325201
Income < 50K/year2724272876102
Avg. house value (CAD)201,795181,876172,106163,823103,75094,390
Source: HAZUS Canada, 2014 and RM of St. Andrews, 2014.
Table 4. Composite SVI in RM of St. Andrews by ward.
WardHH
Index
Pop
Index
Female Pop IndexPop < 16 Year IndexPop > 65 Year IndexNon White Pop IndexIncome < 50 K/year IndexHouse Value
Index
Composite
SVI
10.8020.8150.8150.8360.8300.8210.2651.0000.773
20.9320.9470.9480.9710.9650.9440.2350.8150.845
30.6890.6930.6920.7020.7080.7040.2650.7240.647
40.7430.7510.7490.7650.7690.7660.3720.6460.695
51.0001.0001.0001.0001.001.0000.7450.0870.854
60.6180.6000.6030.5330.6060.6181.0000.0000.572
Source: HAZUS Canada, 2014 and RM of St. Andrews, 2014.
Table 5. Definitions for the magnitude and probability dimensions are used in Figure 10.
Dimension Definition
Magnitude
Catastrophic=Severe damage that requires external assistance/resources. Community unable to function in the right way.
Major=Significant damage requiring external assistance. Community functioning with difficulty.
Moderate=Significant damage. Some community disruption.
Minor=Some damage. Little disruption to the community.
Negligible=Some damage.
Probability
Almost Certain=Must happen with every flood event
Likely=May happen with every flood
Possible=May happen on every 1–3 flood event
Unlikely=May happen on every 3–5 flood event
Rare=Might happen on every 5 or more flood event
Publisher’s Note: MDPI stays neutral with regard to jurisdictional claims in published maps and institutional affiliations.

