

Discrimination of Clinozoisite–Epidote Series by Raman Spectroscopy: An application to Bengal Fan Turbidites (IODP Expedition 354)


Abstract
:
1. Introduction
2. Epidote Group Minerals
2.1. The Epidote–Clinozoisite Series
2.2. Raman Analysis of Epidote Group Minerals
3. Materials and Methods
3.1. SEM–EDS Mineral Chemistry
3.2. Raman Spectroscopy
4. SEM–EDS and Raman Analyses of Mineral Standards
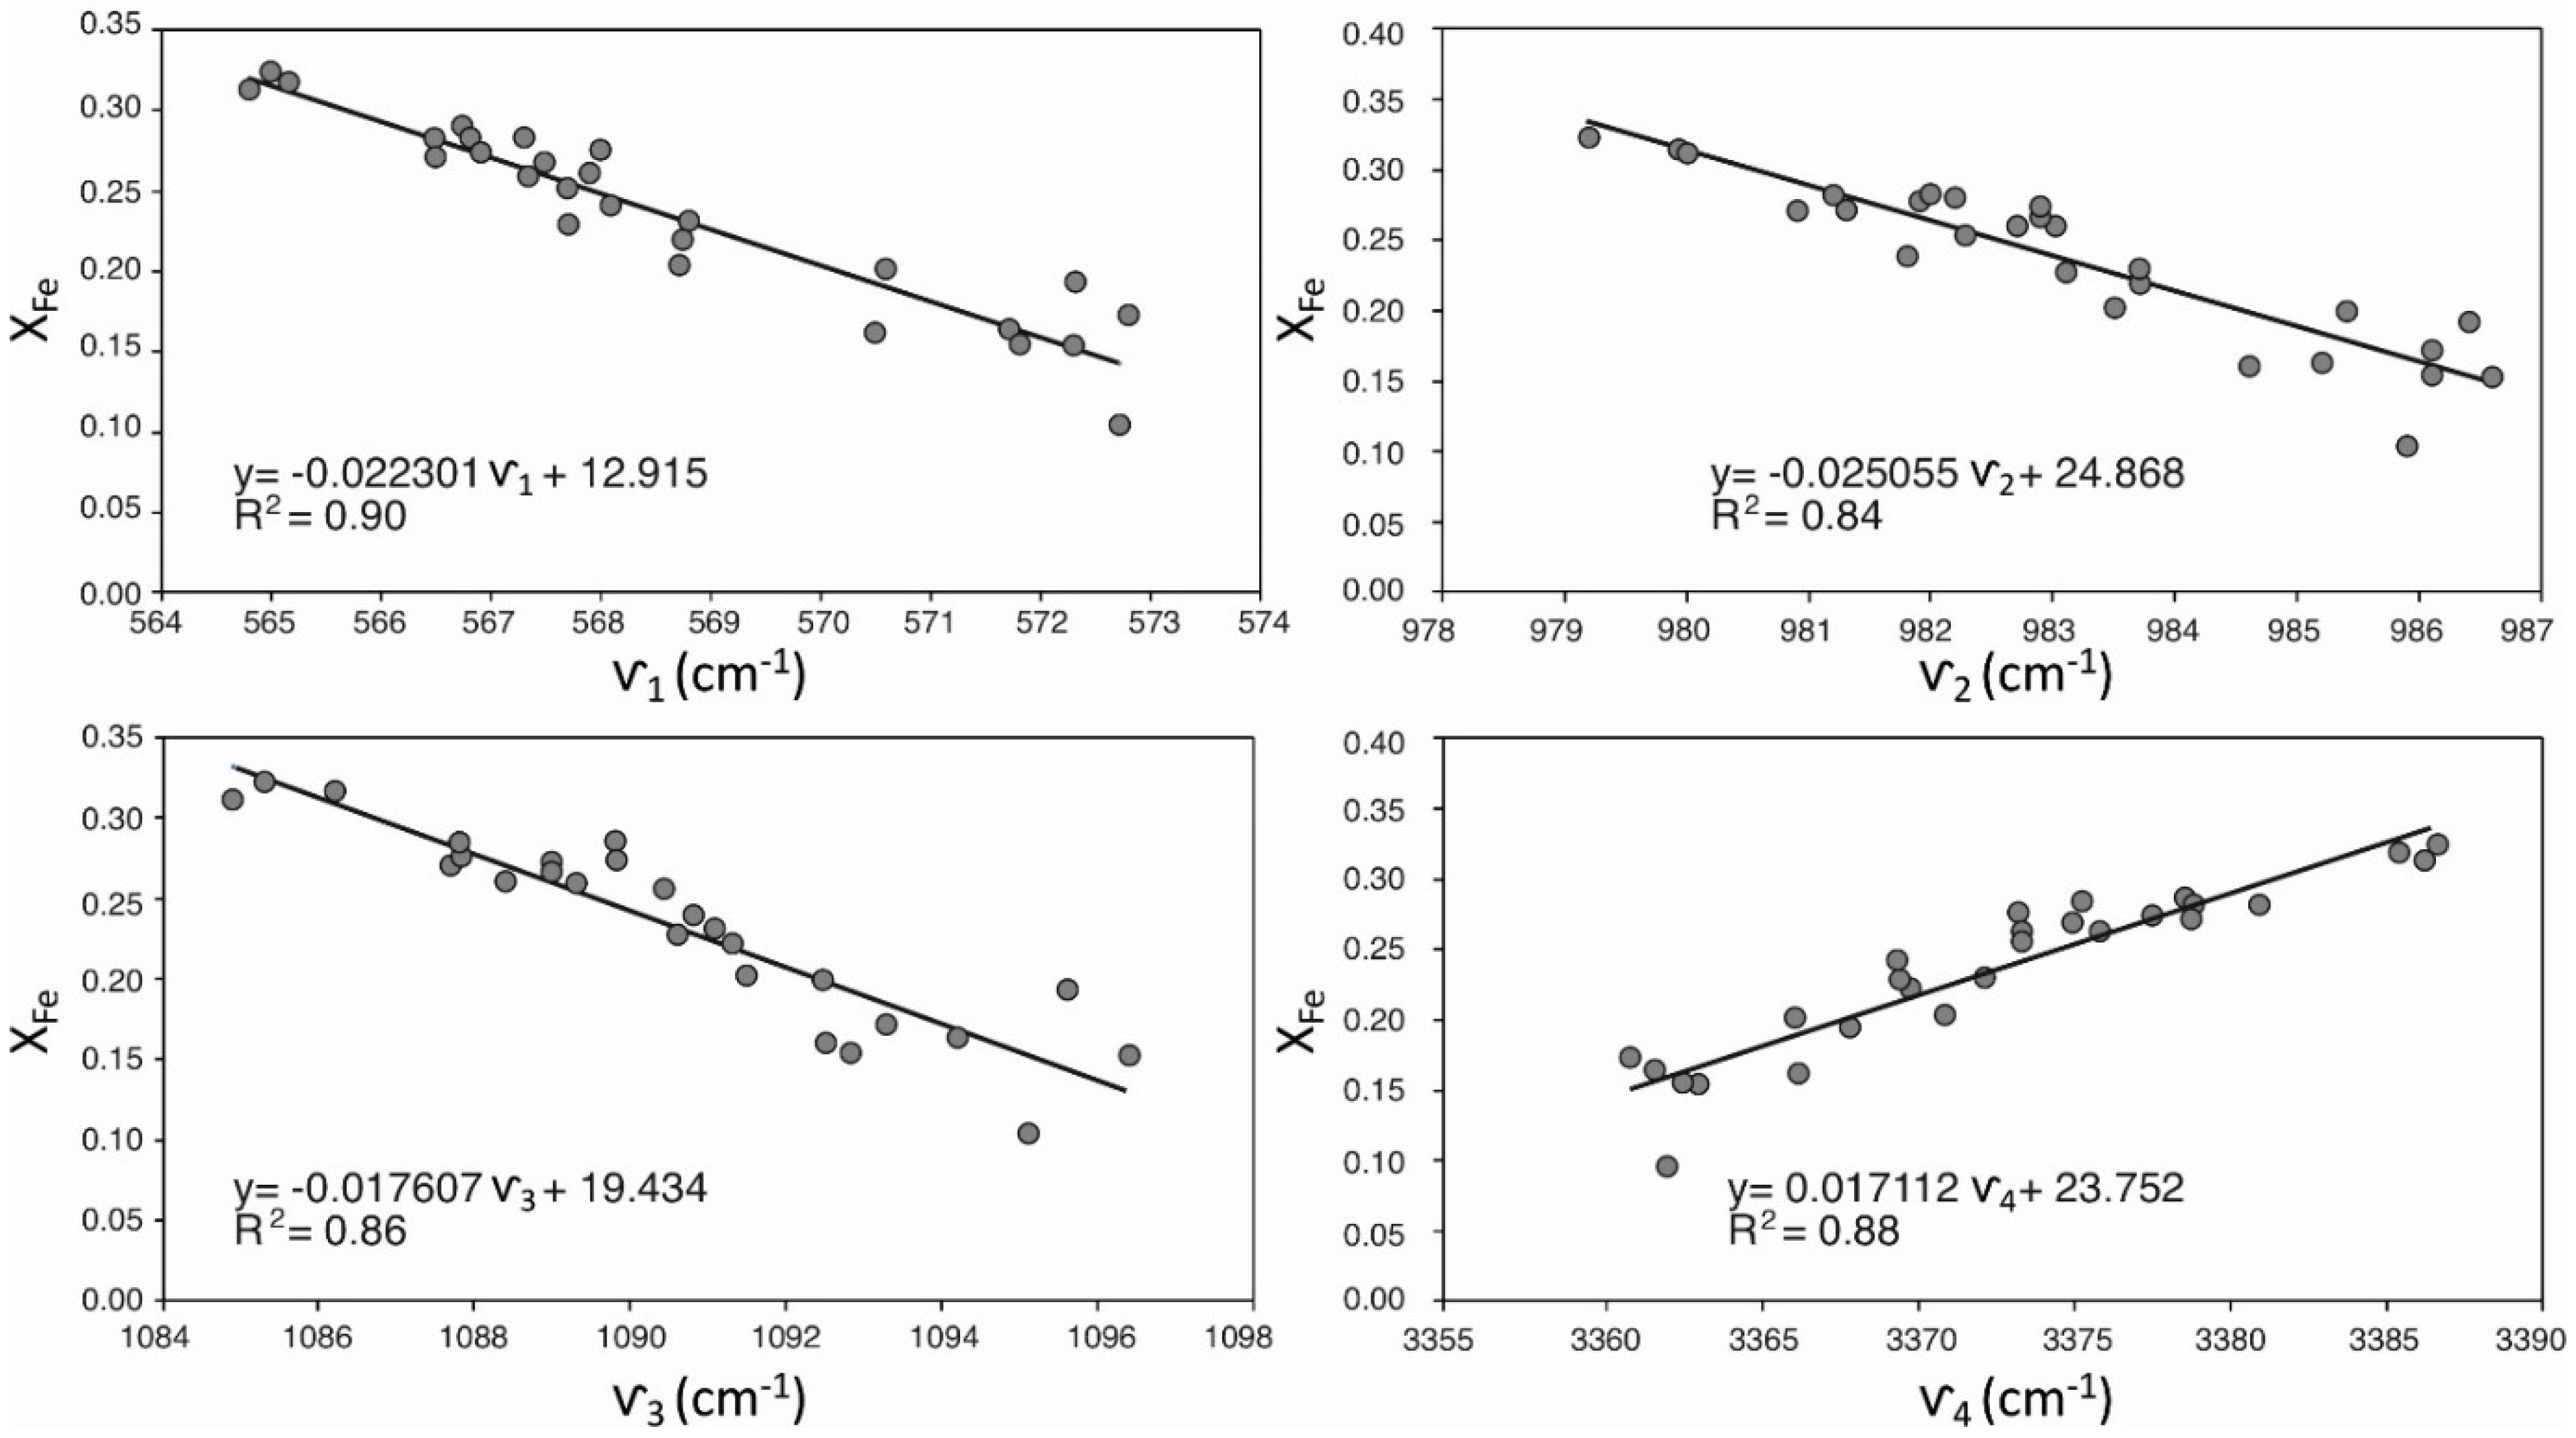
4.1. How to Calculate XFe in the Epidote–Clinozoisite Series
4.2. Distinguishing Epidote from Clinozoisite
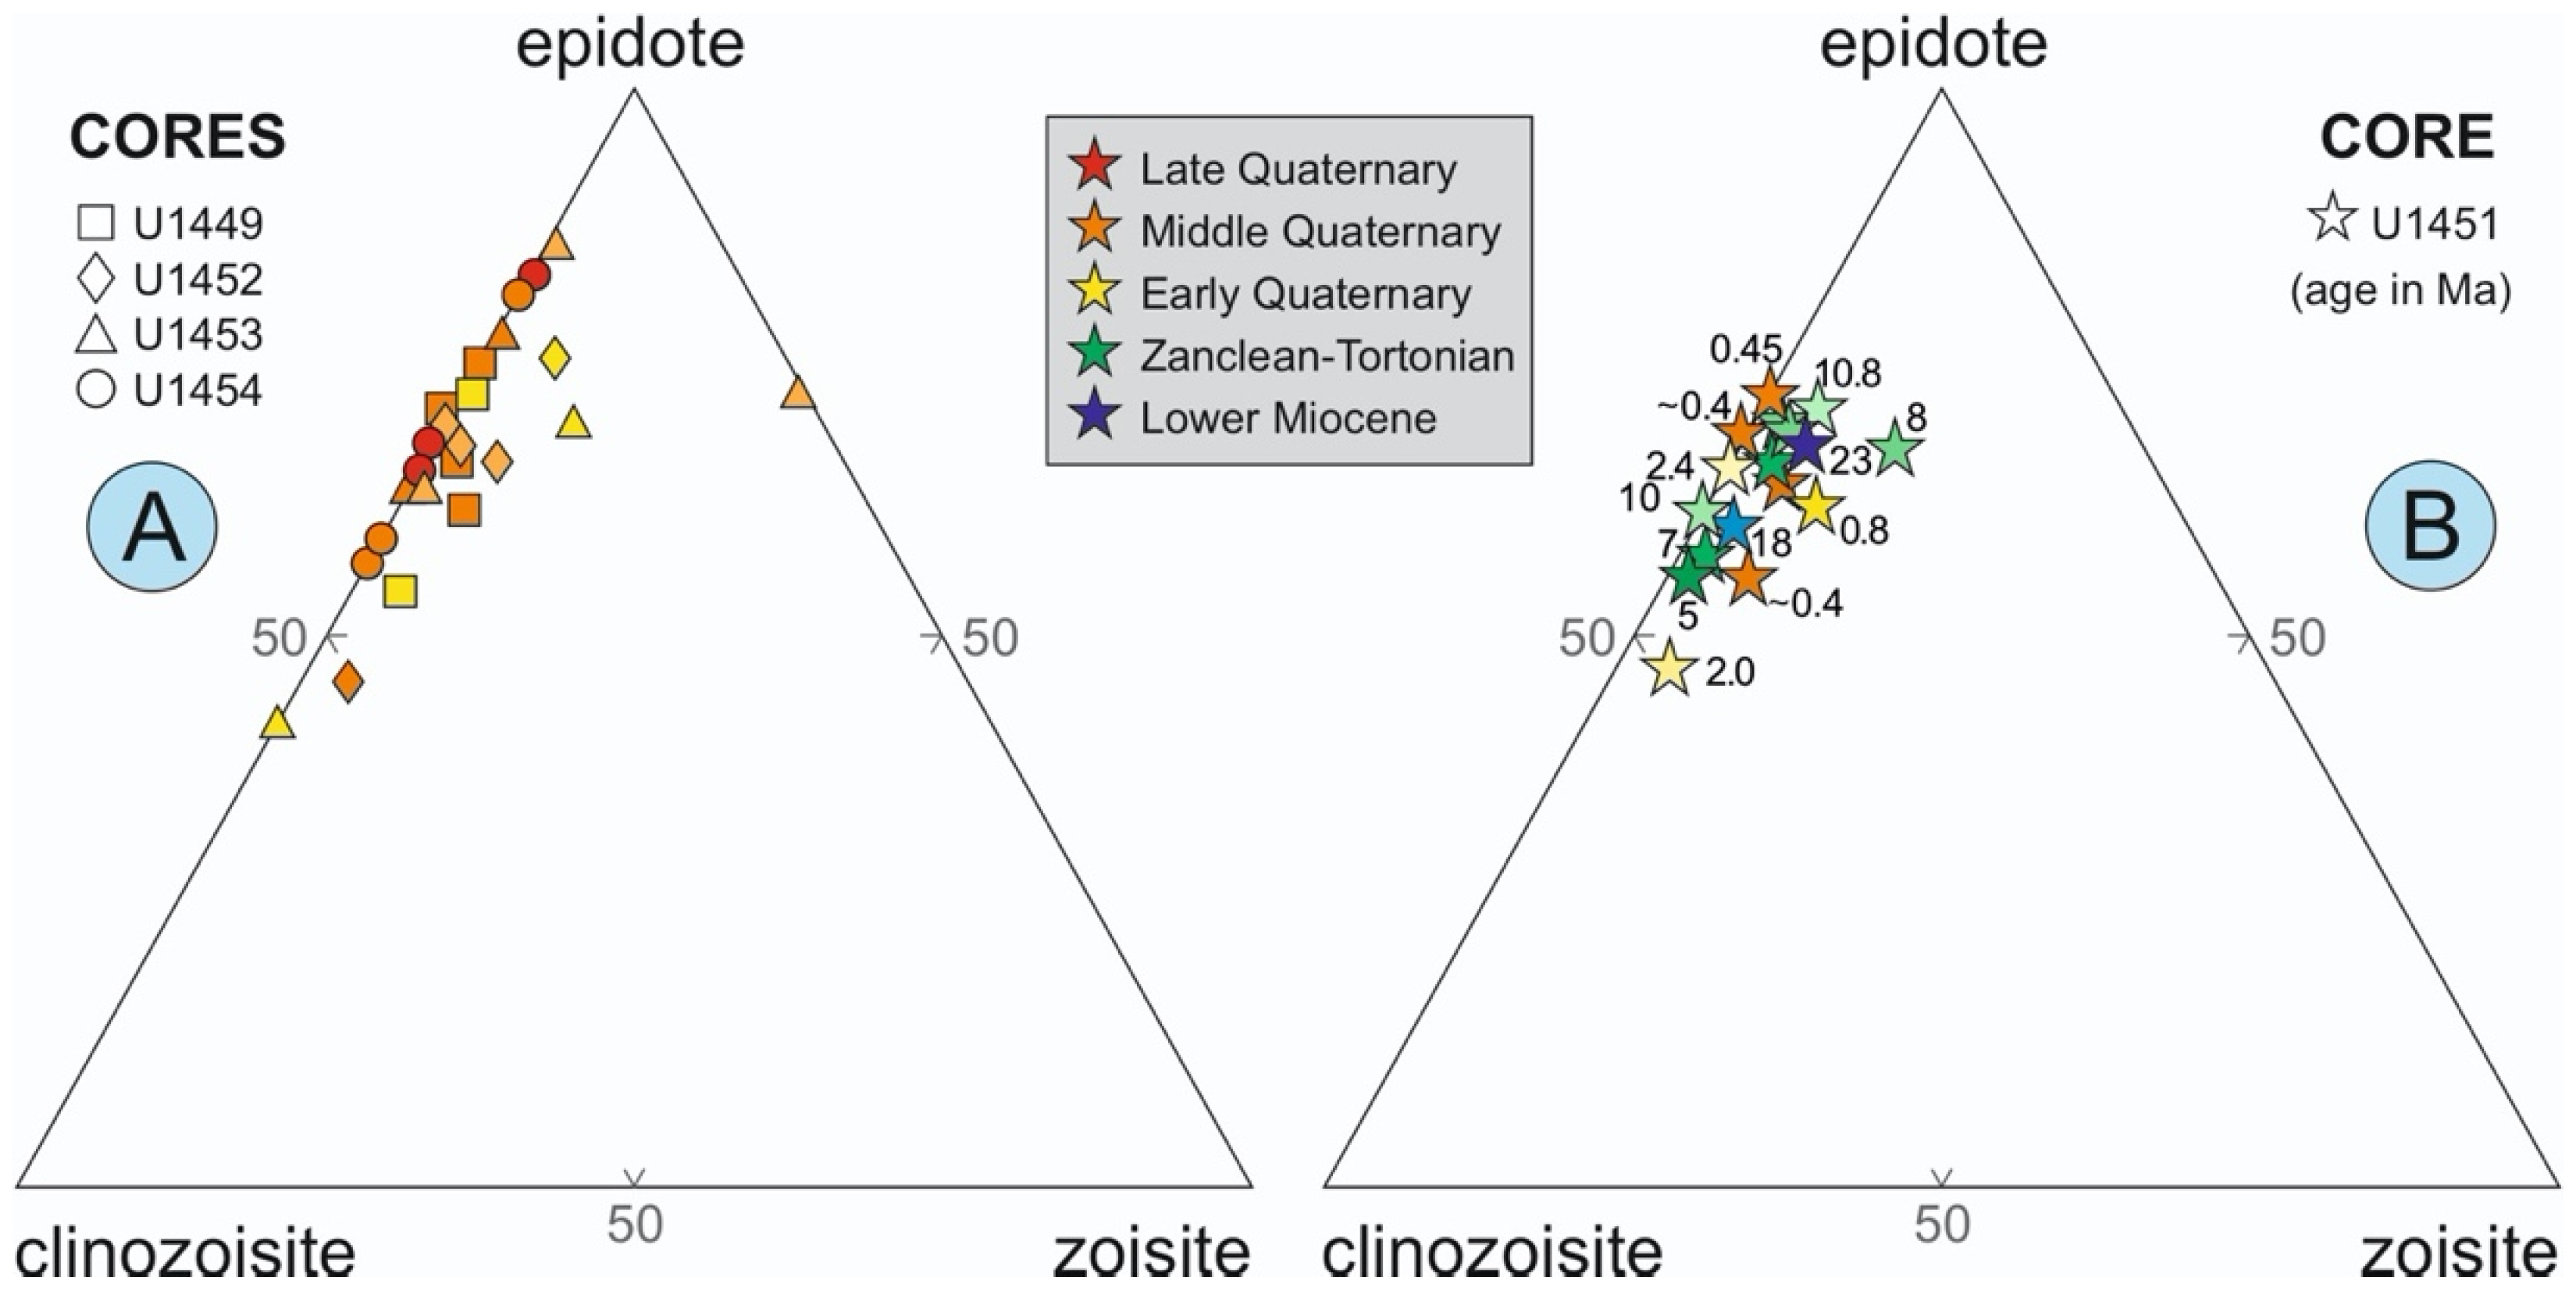
5. Epidote Group Minerals in the Bengal Fan
6. Conclusions
Supplementary Materials
Author Contributions
Funding
Acknowledgments
Conflicts of Interest
References
- Mange, M.A.; Maurer, H.F.W. Heavy Minerals in Colour; Chapman & Hall: London, UK, 1992; p. 147. [Google Scholar]
- Morton, A.C.; Hallsworth, C.R. Processes controlling the composition of heavy mineral assemblages in sandstones. Sediment. Geol. 1999, 124, 3–29. [Google Scholar] [CrossRef]
- von Eynatten, H.; Dunkl, I. Assessing the sediment factory: The role of single grain analysis. Earth Sci. Rev. 2012, 115, 97–120. [Google Scholar]
- Worobiec, A.; Stefaniak, E.A.; Potgieter-Vermaak, S.; Sawlowicz, Z.; Spolnik, Z.; Van Grieken, R. Characterisation of concentrates of heavy mineral sands by micro-Raman spectrometry and CC-SEM/EDX with HCA. Appl. Geochem. 2007, 22, 2078–2085. [Google Scholar] [CrossRef]
- Andò, S.; Garzanti, E. Raman spectroscopy in heavy-mineral studies. Geol. Soc. 2014, 386, 395–412. [Google Scholar] [CrossRef]
- Delmonte, B.; Paleari, C.I.; Andò, S.; Garzanti, E.; Andersson, P.S.; Petit, J.R.; Crosta, X.; Narcisi, B.; Baroni, C.; Salvatore, M.C.; et al. Causes of dust size variability in central East Antarctica (Dome B): Atmospheric transport from expanded South American sources during Marine Isotope Stage 2. Quat. Sci. Rev. 2017, 168, 55–68. [Google Scholar] [CrossRef] [Green Version]
- Borromeo, L.; Andò, S.; France-Lanord, C.; Coletti, G.; Hahn, A.; Garzanti, E. Provenance of Bengal shelf sediments: 1. Mineralogy and geochemistry of silt. Minerals 2019, 9, 640. [Google Scholar] [CrossRef] [Green Version]
- Griffith, W.P. Raman studies on rock-forming minerals. Part I. Orthosilicates and cyclosilicates. J. Chem. Soc. A Inorg. Phys. Theoret. 1969, 192, 1372–1377. [Google Scholar] [CrossRef]
- Hope, G.A.; Woods, R.; Munce, C.G. Raman microprobe mineral identification. Miner. Eng. 2001, 14, 1565–1577. [Google Scholar] [CrossRef]
- Bersani, D.; Andò, S.; Vignola, P.; Moltifiori, G.; Marino, I.G.; Lottici, P.P.; Diella, V. Micro-Raman spectroscopy as a routine tool for garnet analysis. Spectrochim. Acta A Mol. Biomol. Spectrosc. 2009, 73, 484–491. [Google Scholar] [CrossRef]
- Vermeesch, P.; Garzanti, E. Making geological sense of ‘Big Data’ in sedimentary provenance analysis. Chem. Geol. 2015, 409, 20–27. [Google Scholar] [CrossRef]
- Vermeesch, P.; Rittner, M.; Petrou, E.; Omma, J.; Mattinson, C.; Garzanti, G. High throughput petrochronology and sedimentary provenance analysis by automated phase mapping and LAICPMS. Geochem. Geophys. Geosystems 2017, 18, 4096–4109. [Google Scholar] [CrossRef]
- Schulz, B.; Gerhard, M.; Jens, G. Automated SEM mineral liberation analysis (MLA) with generically labelled EDX spectra in the mineral processing of rare earth element ores. Minerals 2019, 9, 527. [Google Scholar] [CrossRef] [Green Version]
- Bersani, D.; Andò, S.; Scrocco, L.; Gentile, P.; Salvioli-Mariani, E.; Fornasini, L.; Lottici, P.P. Composition of amphiboles in the tremolite–ferro–actinolite series by Raman Spectroscopy. Minerals 2019, 9, 491. [Google Scholar] [CrossRef] [Green Version]
- Borromeo, L.; Andò, S.; Bersani, D.; Garzanti, E.; Gentile, P.; Mantovani, L.; Tribaudino, M. Detrital orthopyroxene as a tracer of geodynamic setting: A Raman and SEM-EDS provenance study. Chem. Geol. 2022, 596, 120809. [Google Scholar] [CrossRef]
- Heller, B.M.; LüNsdorf, N.K.; Dunkl, I.; Molnár, F.; von Eynatten, H. Estimation of radiation damage in titanites using Raman spectroscopy. Am. Mineral. J. Earth Planet. Mater. 2019, 104, 857–868. [Google Scholar] [CrossRef]
- Lünsdorf, N.K.; Kalies, J.; Ahlers, P.; Dunkl, I.; von Eynatten, H. Semi-automated heavy-mineral analysis by Raman spectroscopy. Minerals 2019, 9, 385. [Google Scholar] [CrossRef] [Green Version]
- Liebscher, A. Spectroscopy of epidote minerals. Rev. Mineral. Geochem. 2004, 56, 125–170. [Google Scholar] [CrossRef]
- Qin, F.; Wu, X.; Wang, Y.; Fan, D.; Qin, S.; Yang, K.; Townsend, J.P.; Jacobsen, S.D. High-pressure behavior of natural single-crystal epidote and clinozoisite up to 40 GPa. Phys. Chem. Miner. 2016, 43, 649–659. [Google Scholar] [CrossRef]
- Varlamov, D.A.; Ermolaeva, V.N.; Chukanov, N.V.; Jančev, S.; Vigasina, M.F.; Plechov, P.Y. New Data on Epidote-Supergroup Minerals: Unusual Chemical Compositions, Typochemistry, and Raman Spectroscopy. Geol. Ore Depos. 2019, 61, 827–842. [Google Scholar] [CrossRef]
- Coccato, A.; Bersani, D.; Caggiani, M.C.; Mazzoleni, P.; Barone, G. Raman studies on zoisite and tanzanite for gemmological applications. J. Raman Spectrosc. 2021, 53, 550–562. [Google Scholar] [CrossRef]
- Spiegel, C.; Siebel, W.; Frisch, W.; Berner, Z. Nd and Sr isotopic ratios and trace element geochemistry of epidote from the Swiss Molasse Basin as provenance indicators: Implications for the reconstruction of the exhumation history of the Central Alps. Chem. Geol. 2002, 189, 231–250. [Google Scholar] [CrossRef]
- Liang, W.; Garzanti, E.; Andò, S.; Gentile, P.; Resentini, A. Multimineral fingerprinting of Transhimalayan and Himalayan sources of Indus-derived Thal Desert sand (central Pakistan). Minerals 2019, 9, 457. [Google Scholar] [CrossRef] [Green Version]
- Huber, B.; Bahlburg, H. The provenance signal of climate–tectonic interactions in the evolving St. Elias orogen: Framework component analysis and pyroxene and epidote single grain geochemistry of sediments from IODP 341 sites U1417 and U1418. Int. J. Earth Sci. 2021, 110, 1477–1499. [Google Scholar] [CrossRef]
- Frei, D.; Liebscher, A.; Franz, G.; Dulski, P. Trace element geochemistry of epidote minerals. Rev. Mineral. Geochem. 2004, 56, 553–605. [Google Scholar] [CrossRef]
- Enami, M.; Liou, J.G.; Mattinson, C.G. Epidote minerals in high P/T metamorphic terranes: Subduction zone and high-to ultrahigh-pressure metamorphism. Rev. Mineral. Geochem. 2004, 56, 347–398. [Google Scholar] [CrossRef]
- Grapes, R.H.; Hoskin, P.W. Epidote group minerals in low–medium pressure metamorphic terranes. Rev. Mineral. Geochem. 2004, 56, 301–345. [Google Scholar] [CrossRef]
- Mange, M.A.; Morton, A.C. Geochemistry of heavy minerals. In Developments in Sedimentology; Mange, M., Wright, D.T., Eds.; Elsevier: Amsterdam, The Nederlands, 2007; Volume 58, pp. 345–391. [Google Scholar]
- Armbruster, T.; Bonazzi, P.; Akasaka, M.; Bermanec, V.; Chopin, C.; Gieré, R.; Heuss-Assbichler, S.; Liebscher, A.; Menchetti, S.; Pan, Y.; et al. Recommended nomenclature of epidote-group minerals. Eur. J. Mineral. 2006, 18, 551–567. [Google Scholar] [CrossRef] [Green Version]
- Garzanti, E.; Andò, S. Plate tectonics and heavy mineral suites of modern sands. In Developments in Sedimentology; Mange, M., Wright, D.T., Eds.; Elsevier: Amsterdam, The Nederlands, 2007; Volume 58, pp. 741–763. [Google Scholar]
- Milliken, K.L. Provenance and diagenesis of heavy minerals, Cenozoic units of the northwestern Gulf of Mexico sedimentary basin. In Developments in Sedimentology; Mange, M., Wright, D.T., Eds.; Elsevier: Amsterdam, The Nederlands, 2007; Volume 58, pp. 247–261. [Google Scholar]
- Morton, A.C.; Hallsworth, C. Stability of detrital heavy minerals during burial diagenesis. In Developments in Sedimentology; Mange, M., Wright, D.T., Eds.; Elsevier: Amsterdam, The Nederlands, 2007; Volume 58, pp. 215–245. [Google Scholar]
- Limonta, M.; Resentini, A.; Carter, A.; Bandopadhyay, P.C.; Garzanti, E. Provenance of Oligocene Andaman sandstones (Andaman–Nicobar Islands): Ganga–Brahmaputra or Irrawaddy derived? Geol. Soc. Lond. Mem. 2017, 47, 141–152. [Google Scholar] [CrossRef]
- Garzanti, E.; Andò, S.; Limonta, M.; Fielding, L.; Najman, Y. Diagenetic control on mineralogical suites in sand, silt, and mud (Cenozoic Nile Delta): Implications for provenance reconstructions. Earth Sci. Rev. 2018, 185, 122–139. [Google Scholar] [CrossRef]
- Garzanti, E.; Andò, S. Heavy mineral concentration in modern sands: Implications for provenance interpretation. In Developments in Sedimentology; Mange, M., Wright, D.T., Eds.; Elsevier: Amsterdam, The Nederlands, 2007; Volume 58, pp. 517–545. [Google Scholar]
- Gottschalk, M. Thermodynamic properties of zoisite, clinozoisite and epidote. Rev. Mineral. Geochem. 2004, 56, 83–124. [Google Scholar] [CrossRef]
- Schmidt, M.W.; Poli, S. Magmatic epidote. Rev. Mineral. Geochem. 2004, 56, 399–430. [Google Scholar] [CrossRef]
- Deer, W.A.; Howie, R.A.; Zussman, J. (Eds.) Rock-Forming Minerals: Disilicates and Ring Silicates, 2nd ed.; Geological Society: London, UK, 1997; Volume 1B. [Google Scholar]
- Pichler, H.; Schmitt-Riegraf, C. Rock-Forming Minerals in Thin Section; Springer Science & Business Media: Berlin/Heidelberg, Germany, 1997. [Google Scholar]
- Exley, R.A. Microprobe studies of REE-rich accessory minerals: Implications for Skye granite petrogenesis and REE mobility in hydrothermal systems. Earth Planet. Sci. Lett. 1980, 48, 97–110. [Google Scholar] [CrossRef]
- Brooks, C.K.; Henderson, P.; Rønsbo, J.G. Rare-earth partition between allanite and glass in the obsidian of Sandy Braes, Northern Ireland. Mineral. Mag. 1981, 44, 157–160. [Google Scholar] [CrossRef] [Green Version]
- Gromet, L.P.; Silver, L.T. Rare earth element distributions among minerals in a granodiorite and their petrogenetic implications. Geochim. Cosmochim. Acta 1983, 47, 925–939. [Google Scholar] [CrossRef]
- Ercit, T.S. The mess that is “allanite”. Can. Mineral. 2002, 40, 1411–1419. [Google Scholar] [CrossRef]
- Gieré, R.; Sorensen, S.S. Allanite and other REE-rich epidote-group minerals. Rev. Mineral. Geochem. 2004, 56, 431–493. [Google Scholar] [CrossRef]
- Dunkl, I.; von Eynatten, H.; Andò, S.; Lünsdorf, K.; Morton, A.; Alexander, B.; Aradi, L.; Augustsson, C.; Bahlburg, H.; Barbarano, M.; et al. Comparability of heavy mineral data–The first interlaboratory round robin test. Earth Sci. Rev. 2020, 211, 103210. [Google Scholar] [CrossRef]
- Winkler, H.G.F. Petrogenesis of Metamorphic Rocks; Springer: New York, NY, USA, 1976; p. 334. [Google Scholar]
- Franz, G.; Liebscher, A. Physical and Chemical Properties of the Epidote Minerals–An Introduction. Rev. Mineral. Geochem. 2004, 56, 1–81. [Google Scholar] [CrossRef]
- Hörmann, P.K.; Raith, M. Optische Daten, Gitterkonstanten, Dichte und magnetische Suszeptibilität von Al-Fe (III)-Epidoten. N. Jahrb. Mineral Abh. 1971, 116, 41–60. [Google Scholar]
- Wang, A.; Han, J.; Guo, L.; Yu, J.; Zeng, P. Database of standard Raman spectra of minerals and related inorganic crystals. Appl. Spectrosc. 1994, 48, 959–968. [Google Scholar] [CrossRef]
- Huang, E. Raman spectroscopic study of 15 gem minerals. J. Geol. Soc. China 1999, 42, 301–318. [Google Scholar]
- Nagashima, M.; Armbruster, T.; Nishio-Hamane, D.; Mihailova, B. The structural state of Finnish Cr-and V-bearing clinozoisite: Insights from Raman spectroscopy. Phys. Chem. Miner. 2021, 48, 1–14. [Google Scholar] [CrossRef]
- Antofilli, M.; Borgo, E.; Palenzona, A. I Nostri Minerali. Geologia e Mineralogia in Liguria; SAGEP Editrice: Genova, Italia, 1985. [Google Scholar]
- Seemann, R. Famous mineral localities: Knappenwand, Untersulzbachtal (Austria). Mineral. Rec. 1986, 17, 167–181. [Google Scholar]
- Bedogné, F.; Montrasio, A.; Sciesa, E. I Minerali della Provincia di Sondrio: Valmalenco; Bettini: Sondrio, Italia, 1993; p. 275. [Google Scholar]
- Piccoli, G.C.; Maletto, G.; Bosio, P.; Lombardo, B. Minerali del Piemonte e della Valle d’Aosta; L’Artigiana: Alba, Italy, 2007; p. 607. [Google Scholar]
- Marty, F. The Trimouns quarry, Luzenac, Ariège, France. Mineral. Rec. 2004, 35, 225–247. [Google Scholar]
- France-Lanord, C.; Spiess, V.; Klaus, A.; Schwenk, T.; Adhikari, T.T.; Adhikari, S.K.; Bahk, J.J.; Baxter, A.T.; Cruz, J.W.; Das, S.K.; et al. Expedition 354 summary. In International Ocean Discovery Program 354 Preliminary Report; IODP: College Station, TX, USA, 2016; pp. 1–35. [Google Scholar]
- Andò, S. Heavy Minerals: Methods & Case Histories; MDPI: Basel, Switzerland, 2020. [Google Scholar]
- Garzanti, E.; Andò, S. Heavy minerals for junior woodchucks. Minerals 2019, 9, 148. [Google Scholar] [CrossRef]
- Garzanti, E. The maturity myth in sedimentology and provenance analysis. J. Sediment. Res. 2017, 87, 353–365. [Google Scholar] [CrossRef]
- Hubert, J.F. A zircon-tourmaline-rutile maturity index and the interdependence of the composition of heavy mineral assemblages with the gross composition and texture of sandstones. J. Sediment. Petrol. 1962, 32, 440–450. [Google Scholar]
- Limonta, M.; Garzanti, E.; Resentini, A. Petrology of Bengal Fan turbidites (IODP Expeditions 353 and 354): Provenance versus diagenetic control. J. Sediment. Res. 2023; in press. [Google Scholar]
- Tröger, W.E. Optical determination of rock-forming minerals, Part I; Bambauer, H.U., Ed.; Schweizerbart Science Publishers: Stuttgart, Germany, 1979. [Google Scholar]
- Makreski, P.; Jovanovski, G.; Kaitner, B.; Gajović, A.; Biljan, T. Minerals from Macedonia. Vib. Spectrosc. 2007, 1, 162–170. [Google Scholar] [CrossRef]


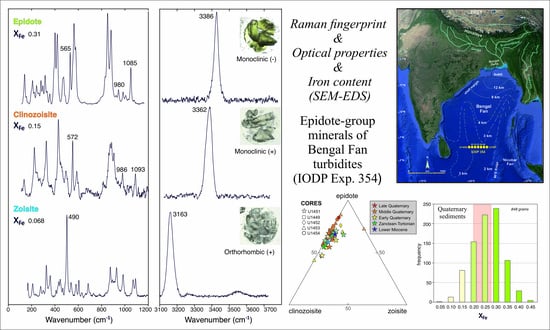
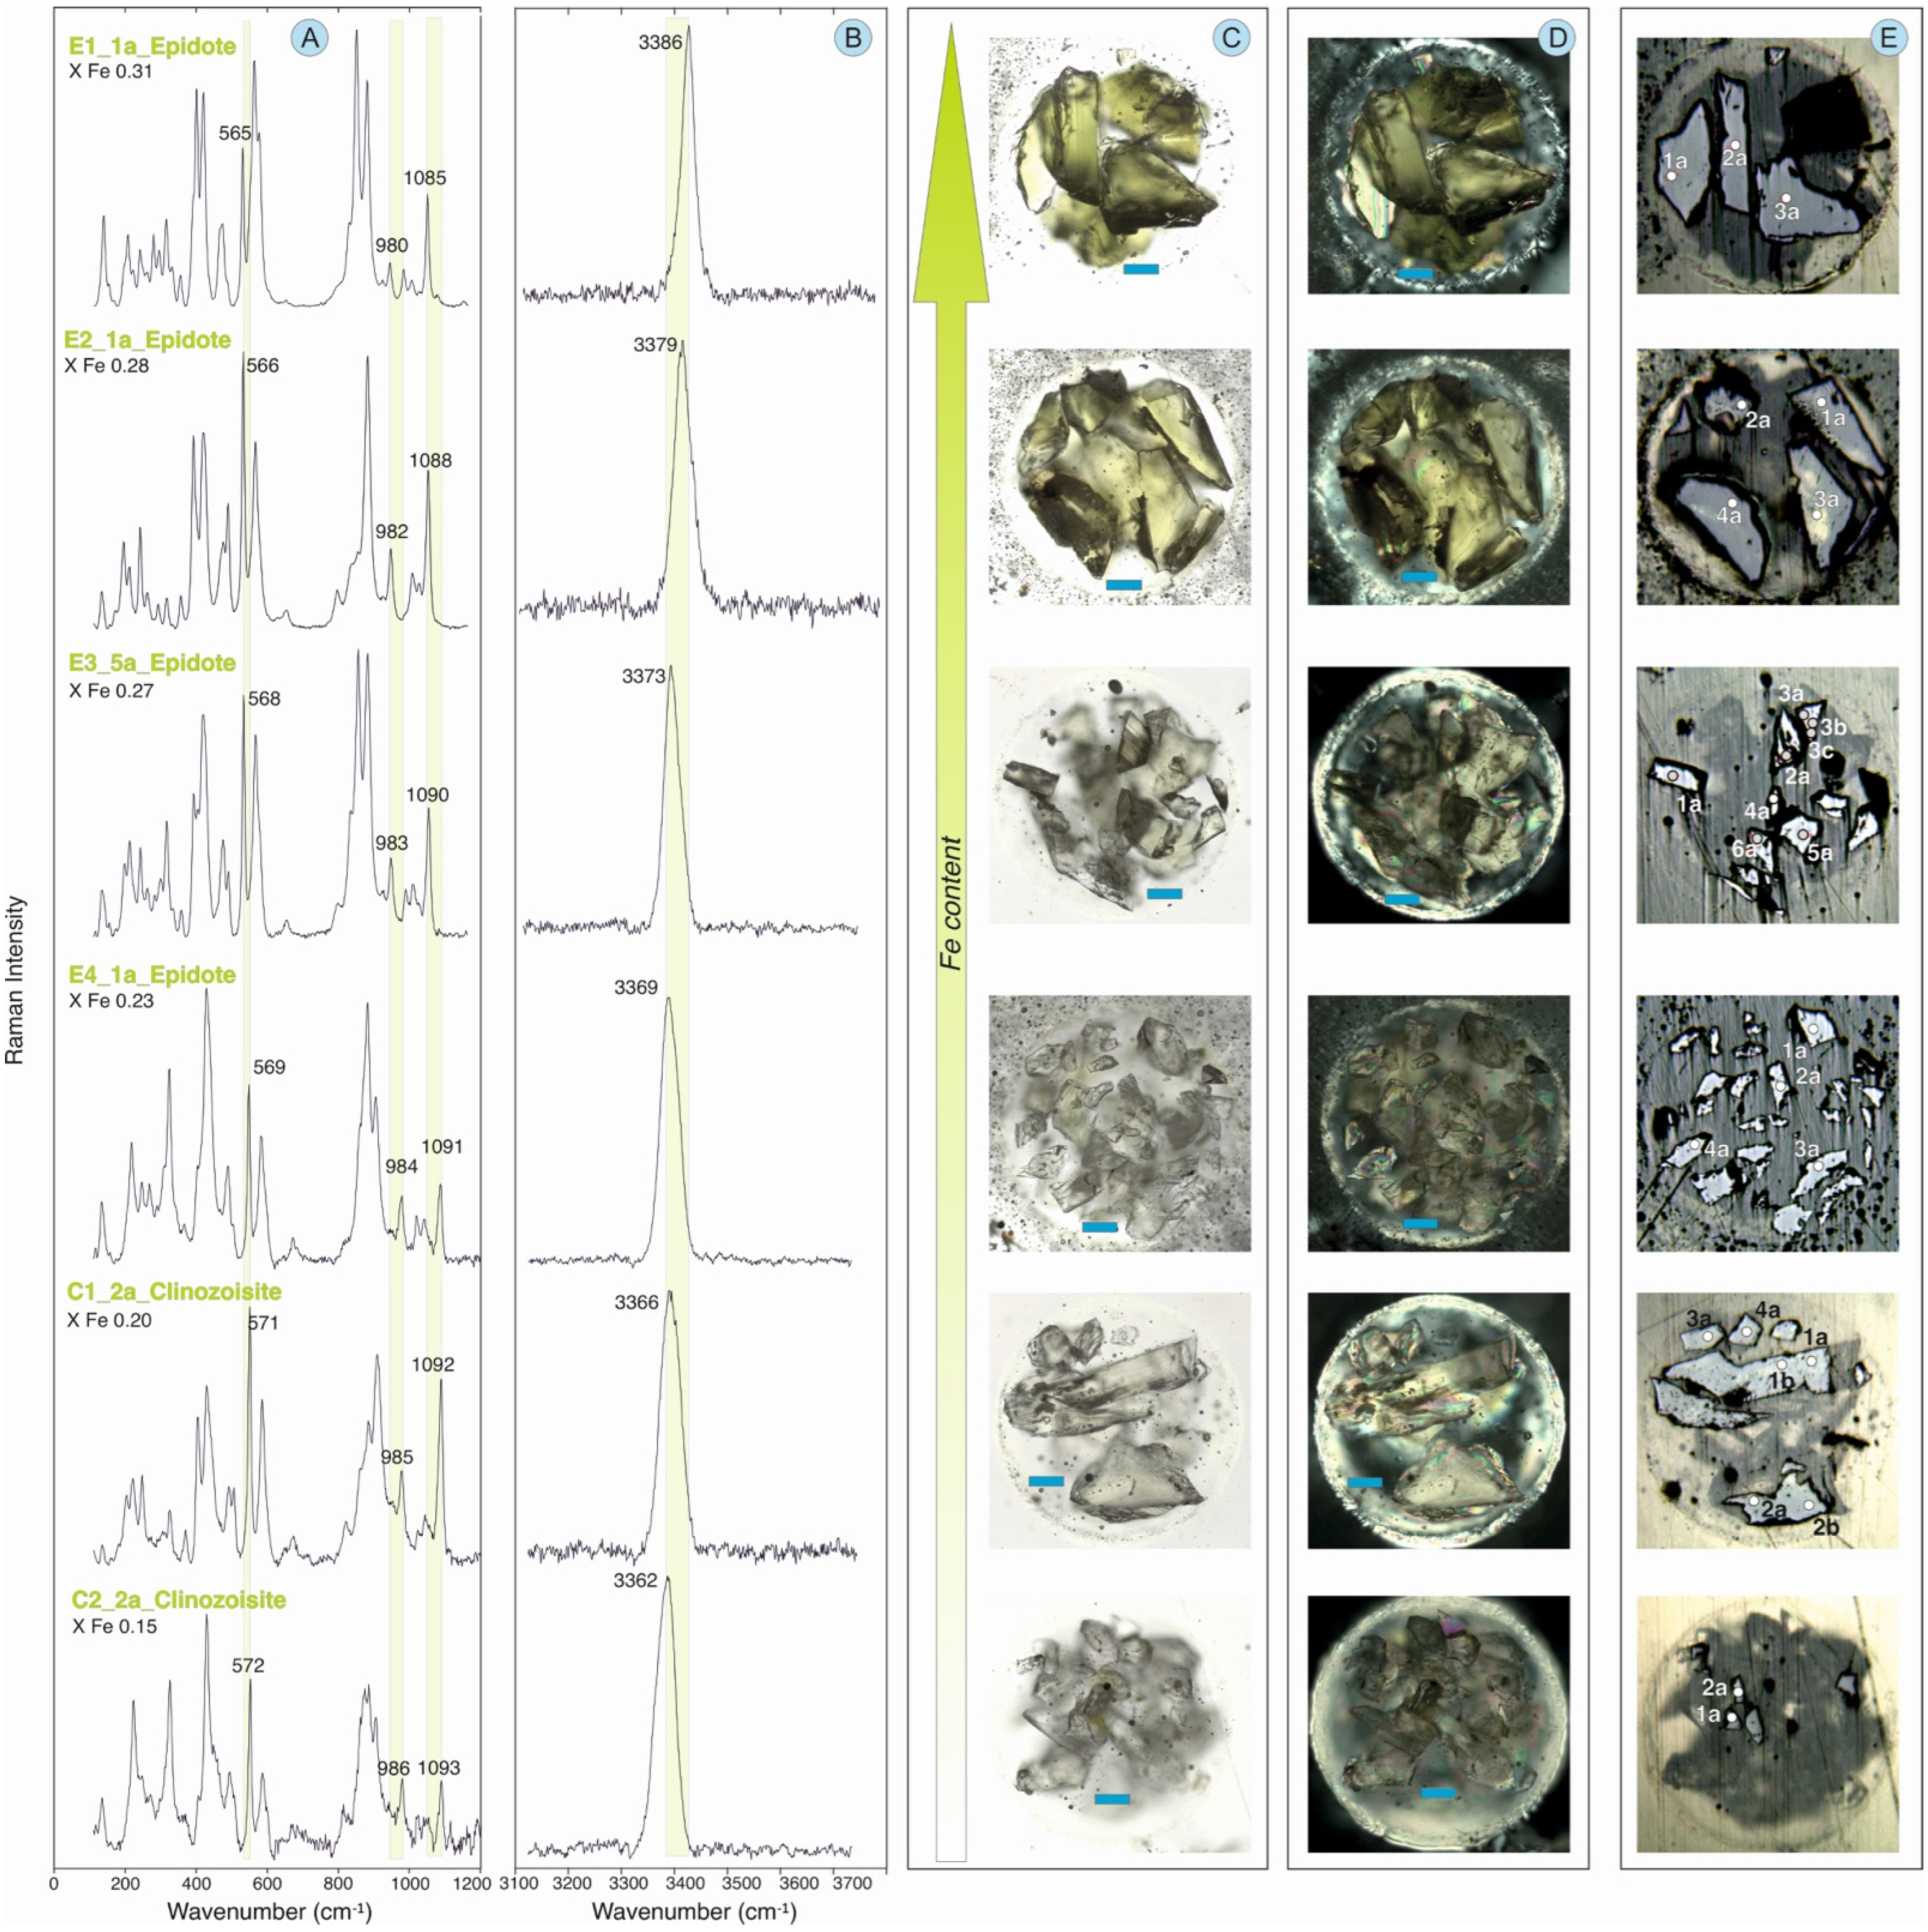
| Sample | FeOt | XFe | v1 (cm−1) | v2 (cm−1) | v3 (cm−1) | v4 (cm−1) |
|---|---|---|---|---|---|---|
| E1 | 13.5–14.0 | 0.31–0.32 | 565 | 979–980 | 1085–1086 | 3385–3386 |
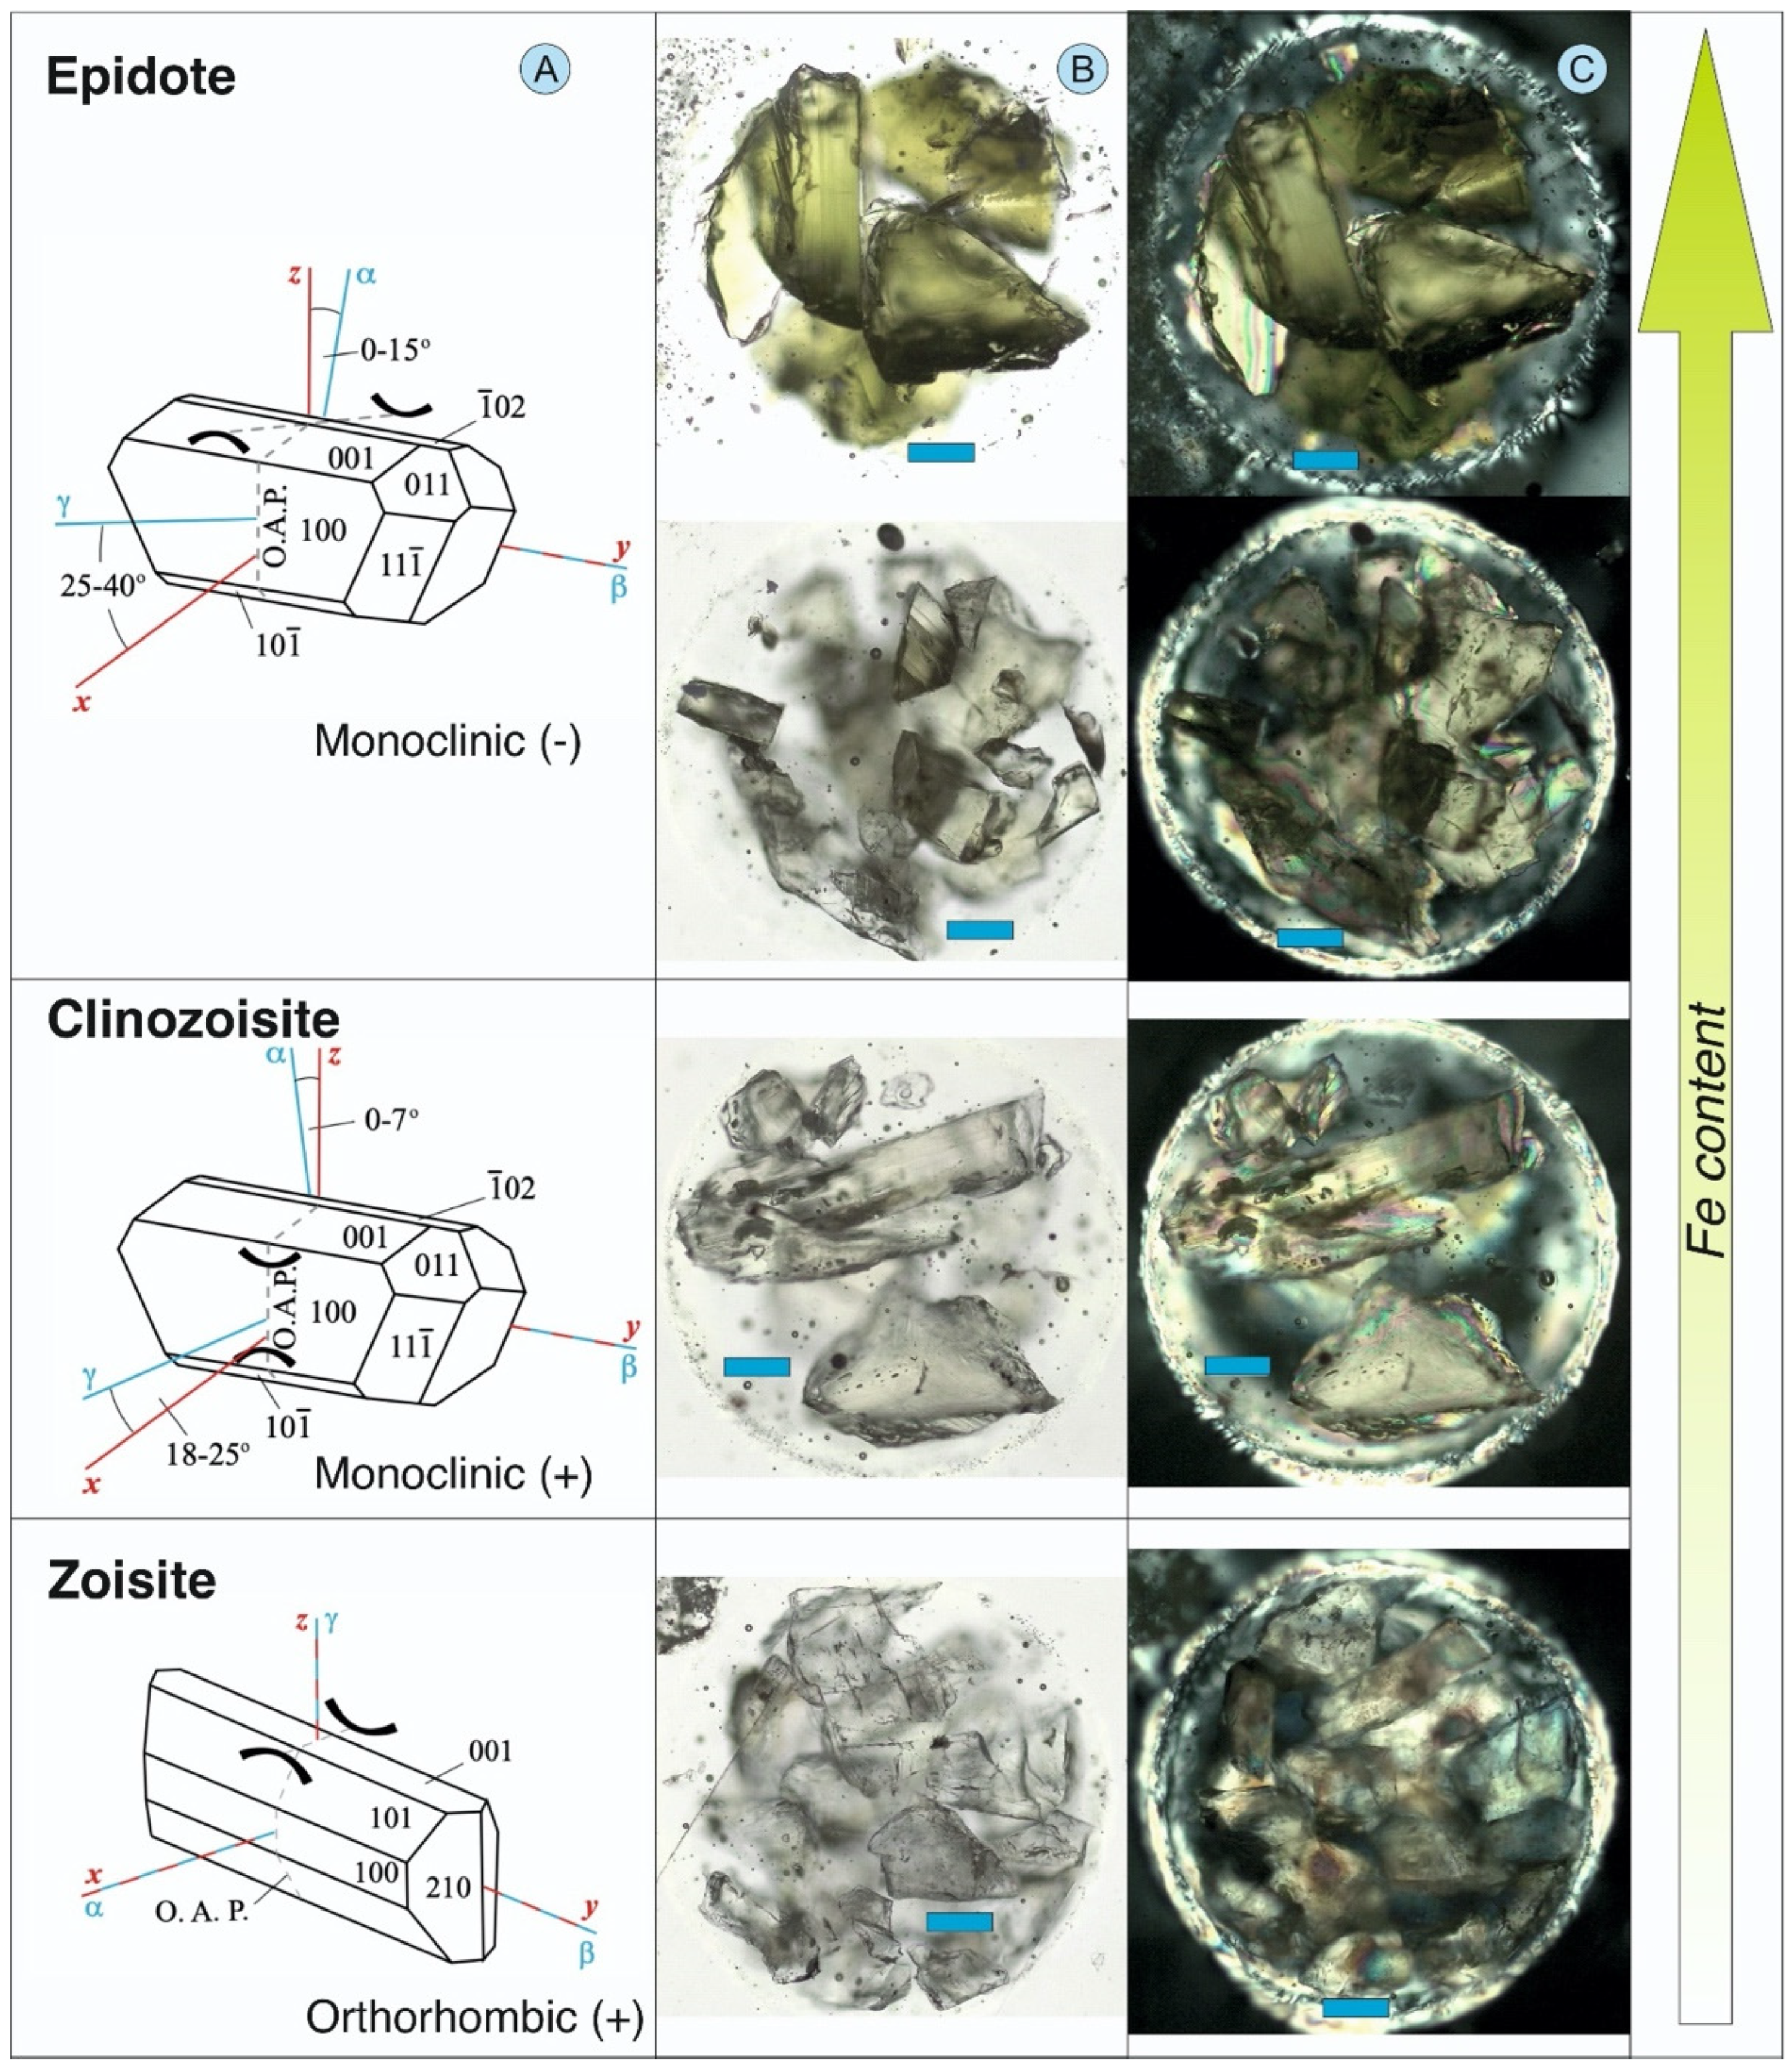
| E2 | 11.7–11.9 | 0.27–0.29 | 566–567 | 981–982 | 1088 | 3379–3381 |
| E3 | 10.6–11.9 | 0.23–0.28 | 567–568 | 981–983 | 1088–1091 | 3372–3378 |
| E4 | 9.2–10.0 | 0.20–0.24 | 568–569 | 982–984 | 1091–1092 | 3369–3371 |
| C1 | 6.3–7.9 | 0.15–0.16 | 570–572 | 985–986 | 1092–1093 | 3362–3366 |
| C2 | 4.5–8.0 | 0.10–0.20 | 571–573 | 985–987 | 1094–1096 | 3361–3368 |
| Core Site | Depth (m) | Age | n° | tHM% | % EpGM | %Ep | %Czo | %Zo | %Aln | %Ep RF | XFe |
|---|---|---|---|---|---|---|---|---|---|---|---|
| U1454B | 30-160 | Quaternary | 203 | 6.3 | 16 | 65 | 28 | 1 | 3 | 3 | 0.24 |
| 3.6 | 6 | 7 | 12 | 2 | 4 | 4 | 0.06 | ||||
| U1453A | 20-190 | Quaternary | 177 | 3.8 | 12 | 66 | 26 | 7 | 1 | 0 | 0.24 |
| 1.0 | 1 | 14 | 19 | 10 | 2 | 0 | 0.06 | ||||
| U1452B | 50-190 | Quaternary | 160 | 4.8 | 15 | 64 | 30 | 2 | 2 | 2 | 0.24 |
| 1.6 | 1 | 12 | 10 | 3 | 2 | 4 | 0.07 | ||||
| U1449A | 8-208 | Quaternary | 212 | 3.5 | 17 | 68 | 31 | 1 | 1 | 0 | 0.24 |
| 0.9 | 2 | 9 | 6 | 2 | 1 | 0 | 0.06 | ||||
| U1451A | 25-117 | Quaternary | 167 | 4.0 | 12 | 63 | 33 | 3 | 1 | 0 | 0.24 |
| 0.6 | 4 | 9 | 6 | 3 | 1 | 0 | 0.06 | ||||
| U1451A | 161 | Pliocene | 49 | 1.7 | 25 | 57 | 41 | 2 | 0 | 0 | 0.21 |
| 0.05 | |||||||||||
| U1451AB | 200-658 | Late Miocene | 340 | 1.7 | 24 | 66 | 31 | 2 | 1 | 0 | 0.24 |
| 0.8 | 3 | 4 | 6 | 1 | 2 | 0 | 0.07 | ||||
| U1451B | 969 | Early Miocene | 36 | 0.7 | 18 | 61 | 36 | 3 | 0 | 0 | 0.23 |
| 0.08 | |||||||||||
| U1451B | 1027 | Early Miocene | 62 | 0.6 | 30 | 63 | 26 | 3 | 8 | 0 | 0.26 |
| 0.07 |
Publisher’s Note: MDPI stays neutral with regard to jurisdictional claims in published maps and institutional affiliations. |
© 2022 by the authors. Licensee MDPI, Basel, Switzerland. This article is an open access article distributed under the terms and conditions of the Creative Commons Attribution (CC BY) license (https://creativecommons.org/licenses/by/4.0/).
Share and Cite
Limonta, M.; Andò, S.; Bersani, D.; Garzanti, E. Discrimination of Clinozoisite–Epidote Series by Raman Spectroscopy: An application to Bengal Fan Turbidites (IODP Expedition 354). Geosciences 2022, 12, 442. https://doi.org/10.3390/geosciences12120442
Limonta M, Andò S, Bersani D, Garzanti E. Discrimination of Clinozoisite–Epidote Series by Raman Spectroscopy: An application to Bengal Fan Turbidites (IODP Expedition 354). Geosciences. 2022; 12(12):442. https://doi.org/10.3390/geosciences12120442
Chicago/Turabian StyleLimonta, Mara, Sergio Andò, Danilo Bersani, and Eduardo Garzanti. 2022. "Discrimination of Clinozoisite–Epidote Series by Raman Spectroscopy: An application to Bengal Fan Turbidites (IODP Expedition 354)" Geosciences 12, no. 12: 442. https://doi.org/10.3390/geosciences12120442