1. Introduction
Deposits of gas hydrates arouse much theoretical and practical interest. Gas hydrates are metastable ice-like solid compounds that form from water and low-molecular gas under certain thermobaric conditions [
1] and consist of molecules of natural gas (mainly methane) encaged in a crystal structure of ice. As the pressure and temperature change, hydrates can dissociate, and the bound gas becomes free and is released into the atmosphere. Methane hydrates existing in shallow crust constitute a rich potential source of natural gas [
2,
3,
4], but, on the other hand, methane is the second source of greenhouse gases, after carbon dioxide, contributing to climate change. Methane has 28 to 36 times greater contribution to the 100-year global warming potential than carbon dioxide [
5,
6,
7,
8]. Gas hydrates in subsea and onshore permafrost are prone to dissociation as the permafrost is degrading as a result of climate warming. The issues of gas hydrate accumulation and dissociation, as well as the related gas emission, have been studied quite extensively. Estimates of global methane flux are available for high-latitude tundra, lakes, and ponds [
9] and for the East Siberian shelf [
10]. However, the methane flux from the Arctic oceans and landmasses may be underestimated [
11,
12] as methane concentration in the Northern Hemisphere increases in summer due to rapid gas hydrate dissociation. Some methane flux estimates were obtained in field experiments [
13,
14,
15,
16].
The available research includes gas hydrate dissociation upon warming and decompression [
17,
18], 1D models of hydrate dissociation in porous media [
19], and variations of porosity and permeability during hydrate formation [
20,
21,
22]. Gas released at low rates at some depths was found to migrate toward the surface, and the gas flow may produce zones of overpressure under certain conditions. As the gas pressure reaches a critical value, the rocks above fail, and the emission may be explosive. Explosive gas emission, which produces craters in the seabed and on the land [
23], was simulated for the Arctic conditions [
24,
25]. The model [
24,
25] was based on crater field observations in the Yamal Peninsula and implied decomposition of gas hydrates under changed P-T conditions. Immediately before the explosion, the liberated gas was supposed to fill a cavity confined under a permafrost lid, which was originally saturated with water.
We present numerical and laboratory experiments to study the effect of increasing gas flow rate on the process as another mechanism that may be responsible for explosive emission (blowout) of methane flowing through friable sediments.
2. Mathematical Model
The numerical experiments simulated two related successive processes: gas flow through porous sediments and gas blowout as a result of pressure increase. The models of isothermal single-phase gas flow in an isotropic porous medium are based on the mass conservation and momentum conservation (the Darcy law) principles and the pressure dependence of density, porosity, permeability, and viscosity. We used differential equations for ideal gas flow in rocks obtained in the 1940s by Leonid Leibenson [
26,
27,
28]. The parabolic nonlinear differential equation for gas pressure is
The equation is valid under several assumptions: (i) the permeability and the porosity depend neither on temperature nor on pressure (i.e., the material is non-deformable); (ii) the viscosity is insensitive to pressure but depends on temperature; and (iii) gas flow is isothermal, and viscosity is constant at a given temperature.
Gas flowing through porous material blows out as its pressure reaches a critical value equal to overburden pressure (total weight of dry rock plus pore fluids):
where
and
are, respectively, the density and thickness of overlying material (overburden), and
is the gravity acceleration.
The Leibenson equation is applied to 1D single-phase gas flow in a porous medium. The modeling domain is a 1D vertical porous channel of the height
. The flow rate across the base of the channel (
) and the pressure on its top (
) are assumed to be constant, and the modeling domain is exposed to the known constant pressure
at
. The process is described by the system of equations:
where
is the cross-section area of the gas channel.
The gas flow equation can be rewritten as
The space–time domain
,
is divided by the finite-difference grid {
yi,
i = 0,1,2,…,
M;
tn,
n = 0,1,2,…,
N} with the grid spacing
, at a time step
. With the grid functions
,
, the system of equations becomes
3. Numerical Results
The modeling started with gas flow at parameters close to the real conditions [
1,
11,
12,
13,
14,
15,
16] (
Table 1).
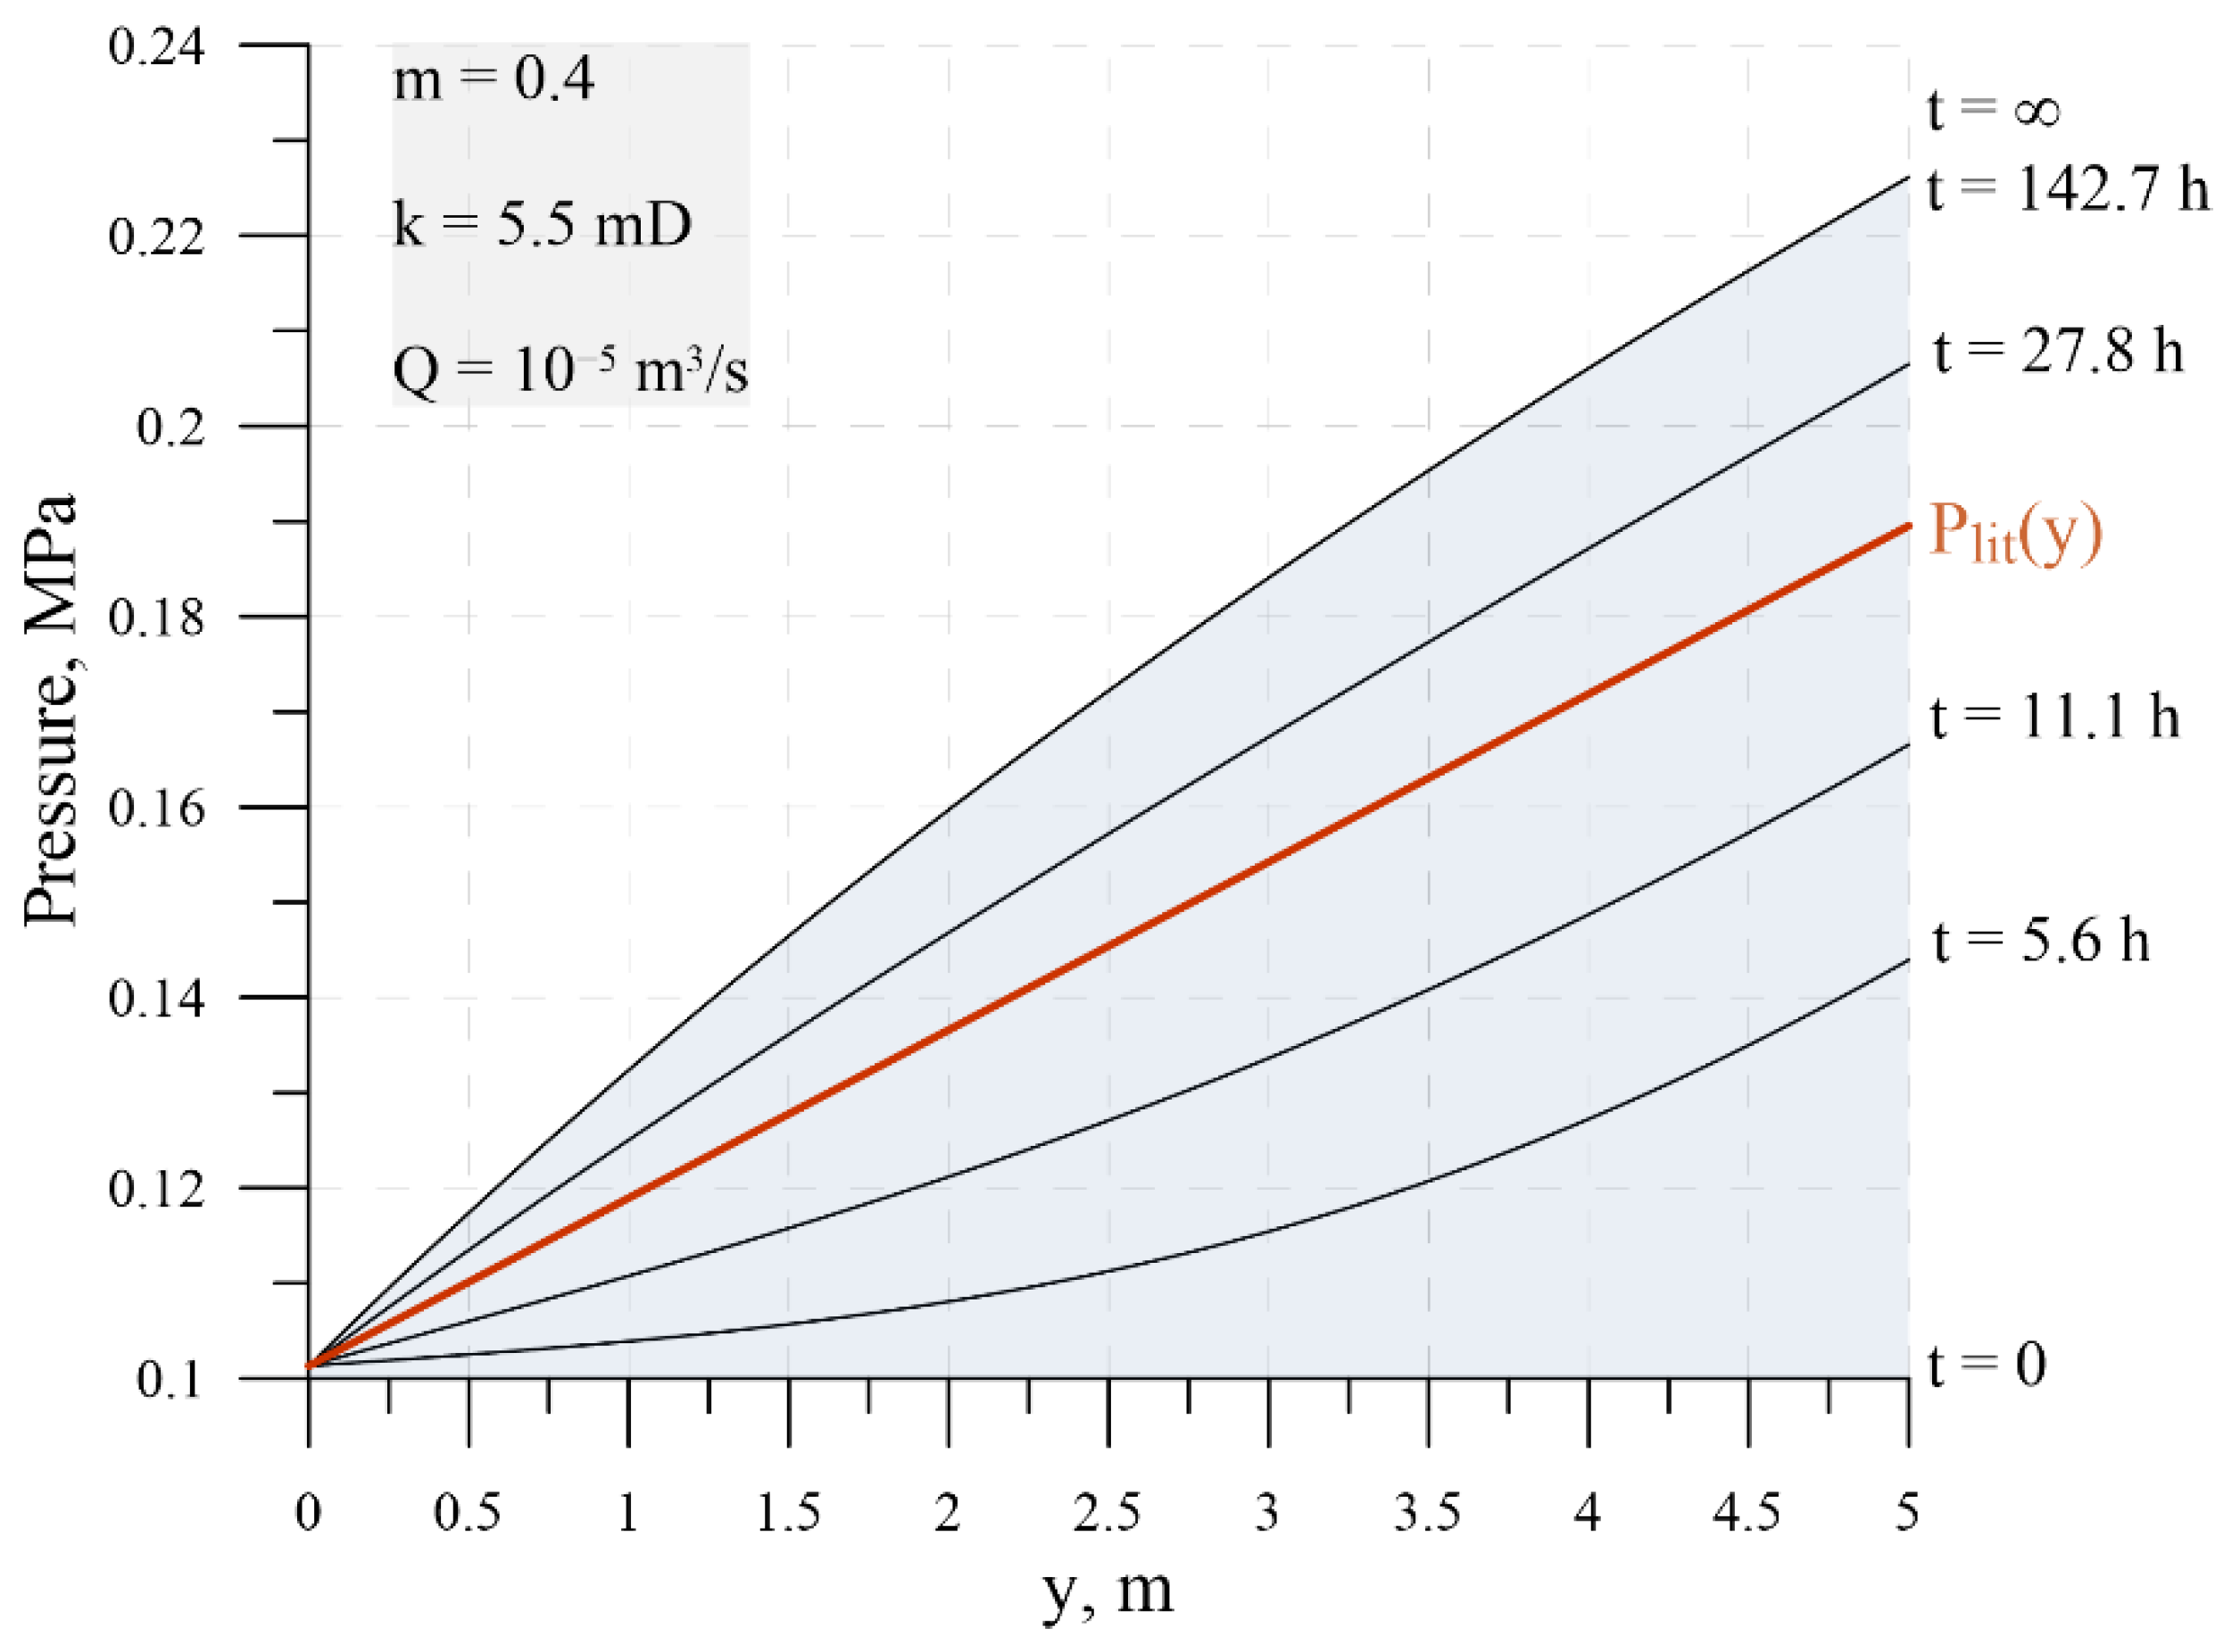
The depth profile of gas pressure was obtained assuming a constant pressure of 0.1013 MPa on the channel top and a constant gas flow across the base at the 5 m depth. The pressure first increases rapidly and then reaches a plateau (
Figure 1).
Gas pressure and overburden pressure
change with depth (
Figure 2), and blowout occurs as the gas pressure exceeds the overburden pressure.
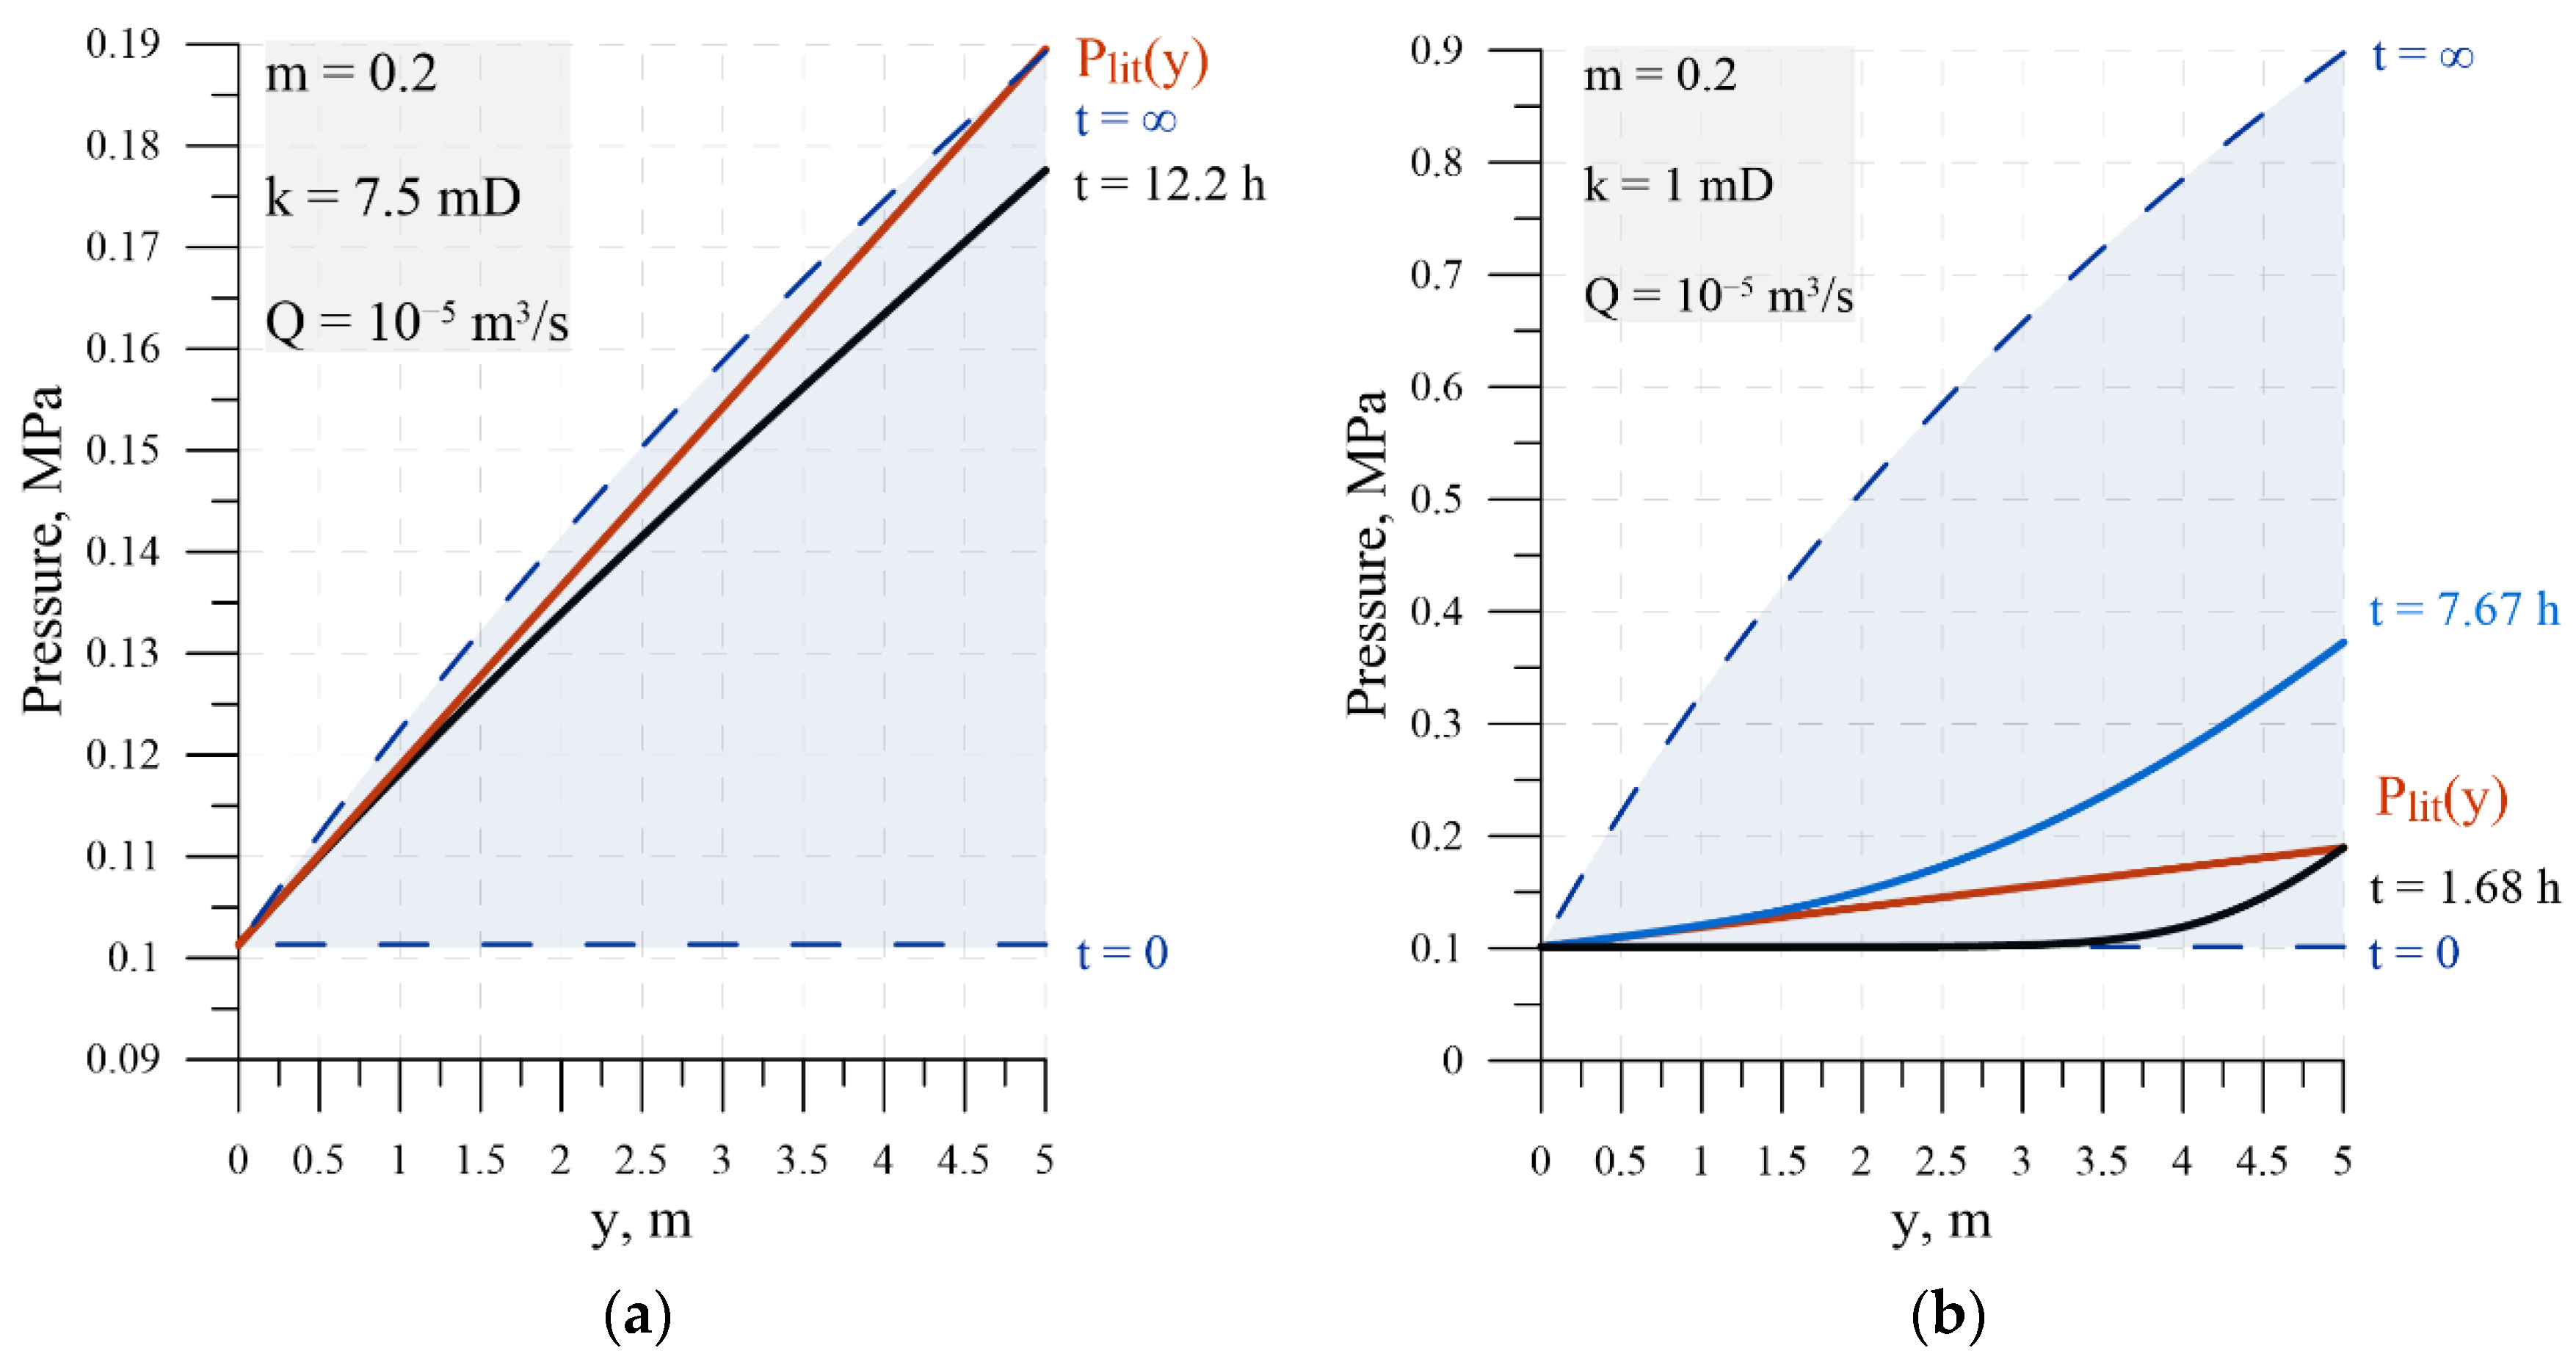
As the gas pressure reaches the critical value (black heavy line in
Figure 3), blowout may occur both on the upper (
Figure 3a) and lower (
Figure 3b) boundaries of the modeling domain, which differ in permeability by less than one order of magnitude.
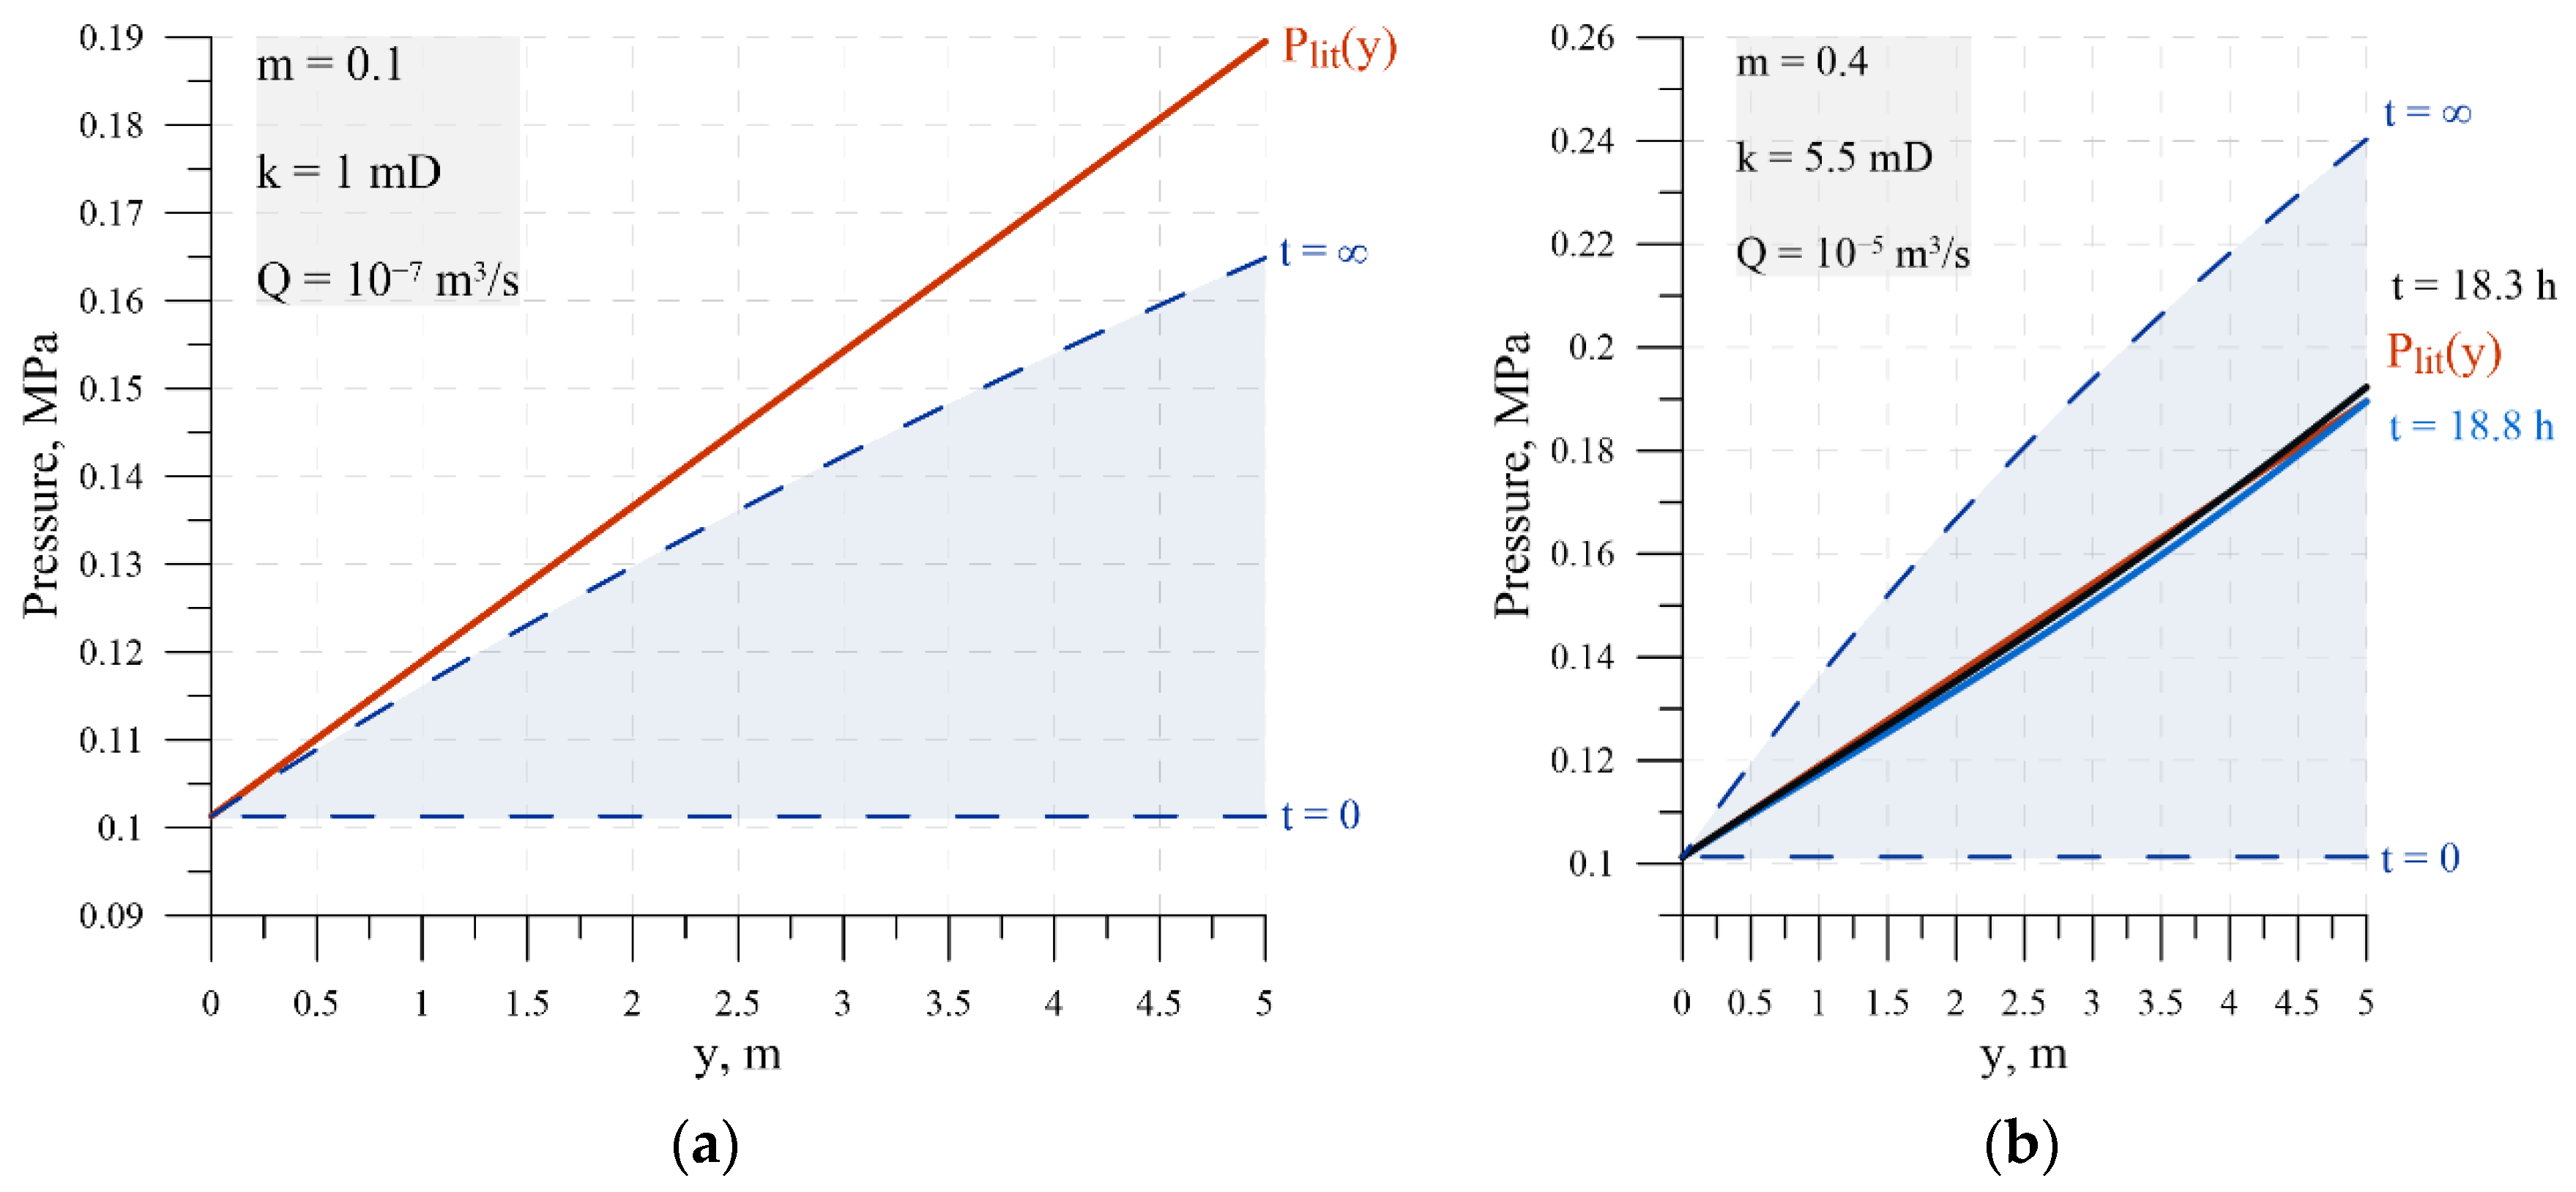
Gas pressure in the channel may never reach the overburden pressure (
Figure 4a), and no blowout will occur, or it may rise to the critical value all over the channel (
Figure 4b).
The time required for the gas pressure to reach the critical value depends on the gas flow rate and properties of the material at different depths (
Figure 5). Correspondingly, three scenarios of rock failure (gas blowout) are possible: it may start at the base or at the top of the gas channel, or synchronously all along the channel; or it may never occur.
4. Laboratory Experiment
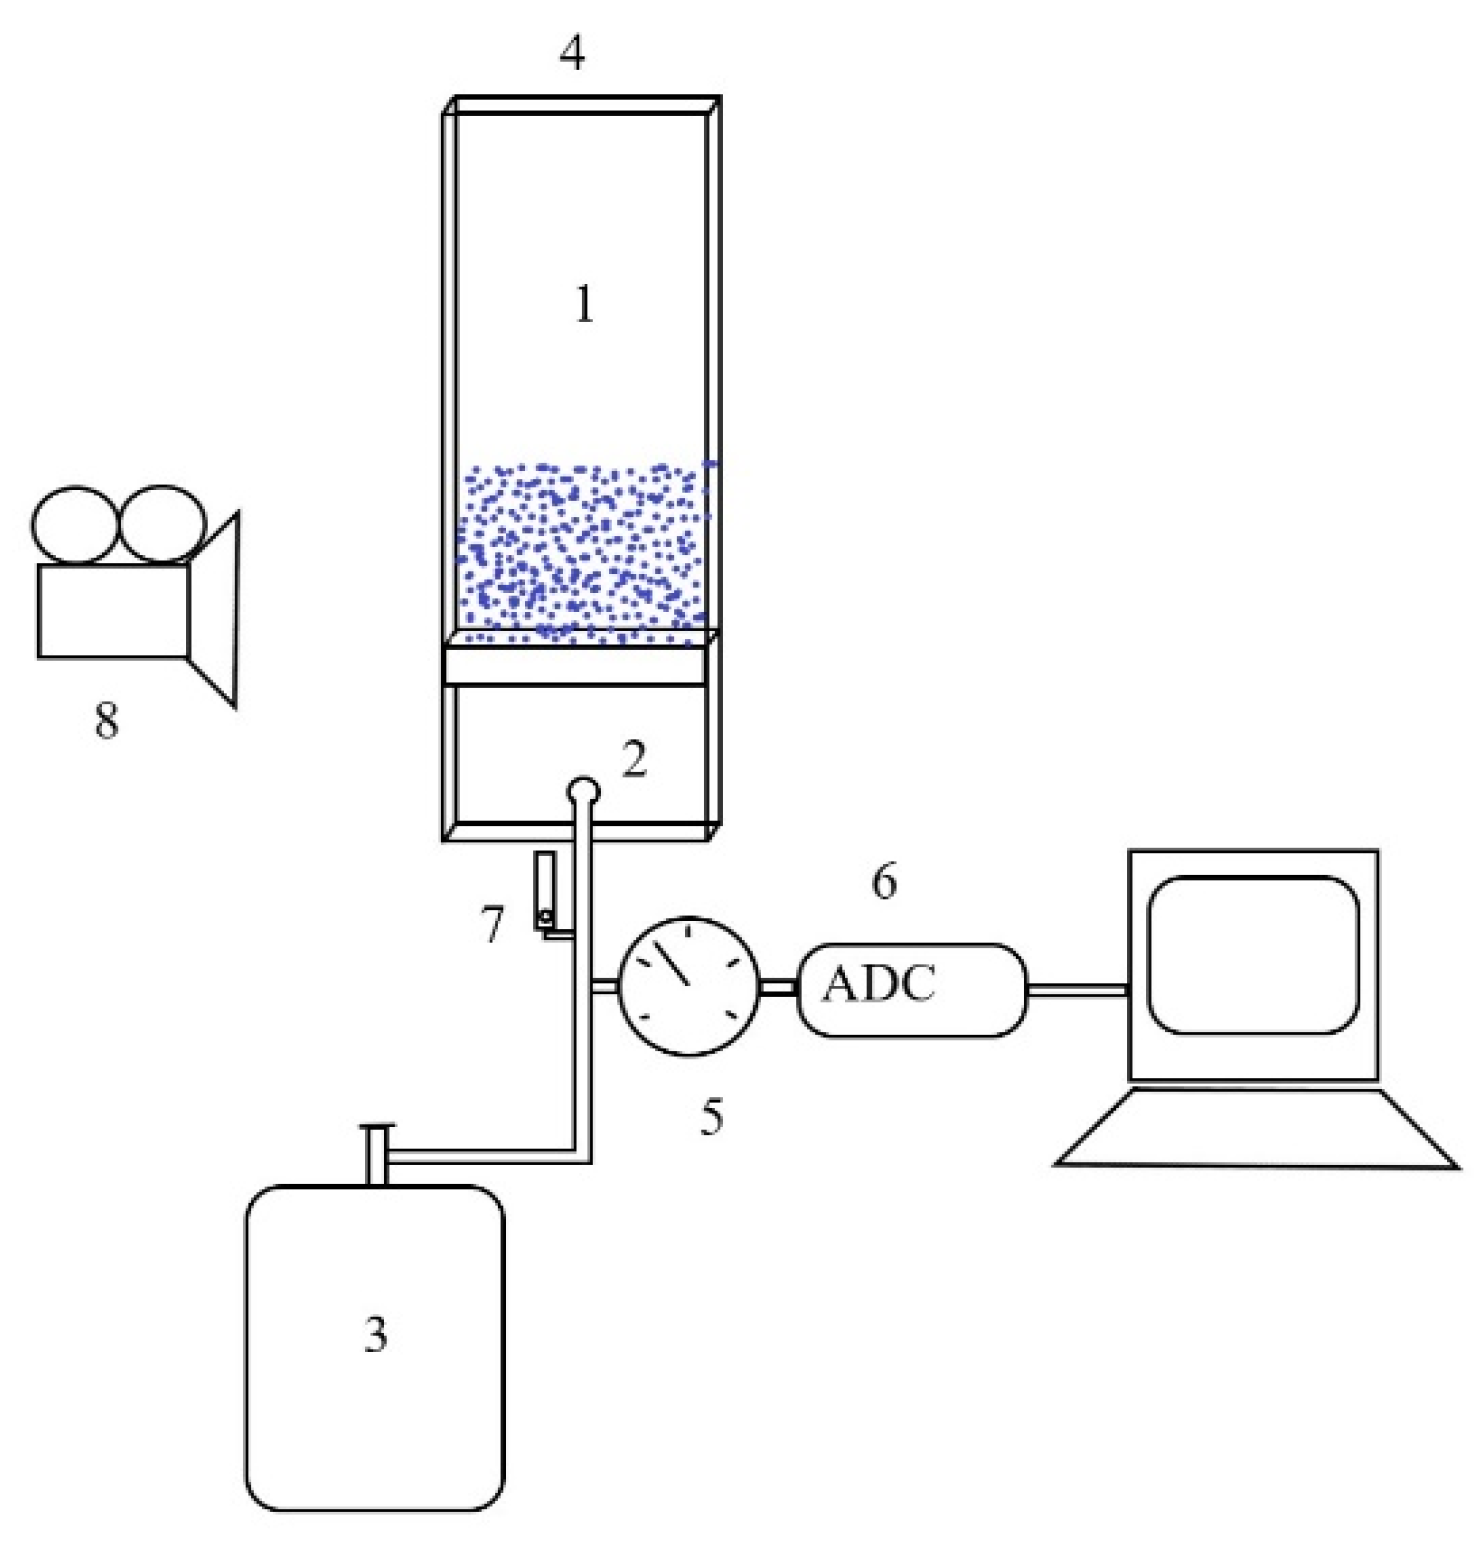
Laboratory modeling of gas flow was performed using a system of the type of Hele-Shaw cell (
Figure 6), with two vertically oriented plane-parallel glass panels 0.7 mm apart. The space between the panels was filled with glass balls 0.2–0.3 mm in diameter, to a height of 20 cm above the cell bottom. The spacing between the panels was large enough to accommodate a double-packed layer of balls. The required density of the ball pack (1.75 g/cm
3) was achieved by vibration compaction of balls poured in small batches.
The cell base (1) had a hole (2) for gas supply from a gas balloon (3), and the cell top was open to air (4). Gas pressure was measured with a transducer (5) connected to an ADC (6), gas flow rate was measured with a float-type meter (7), and changes in the material structure were recorded with a video camera (8).
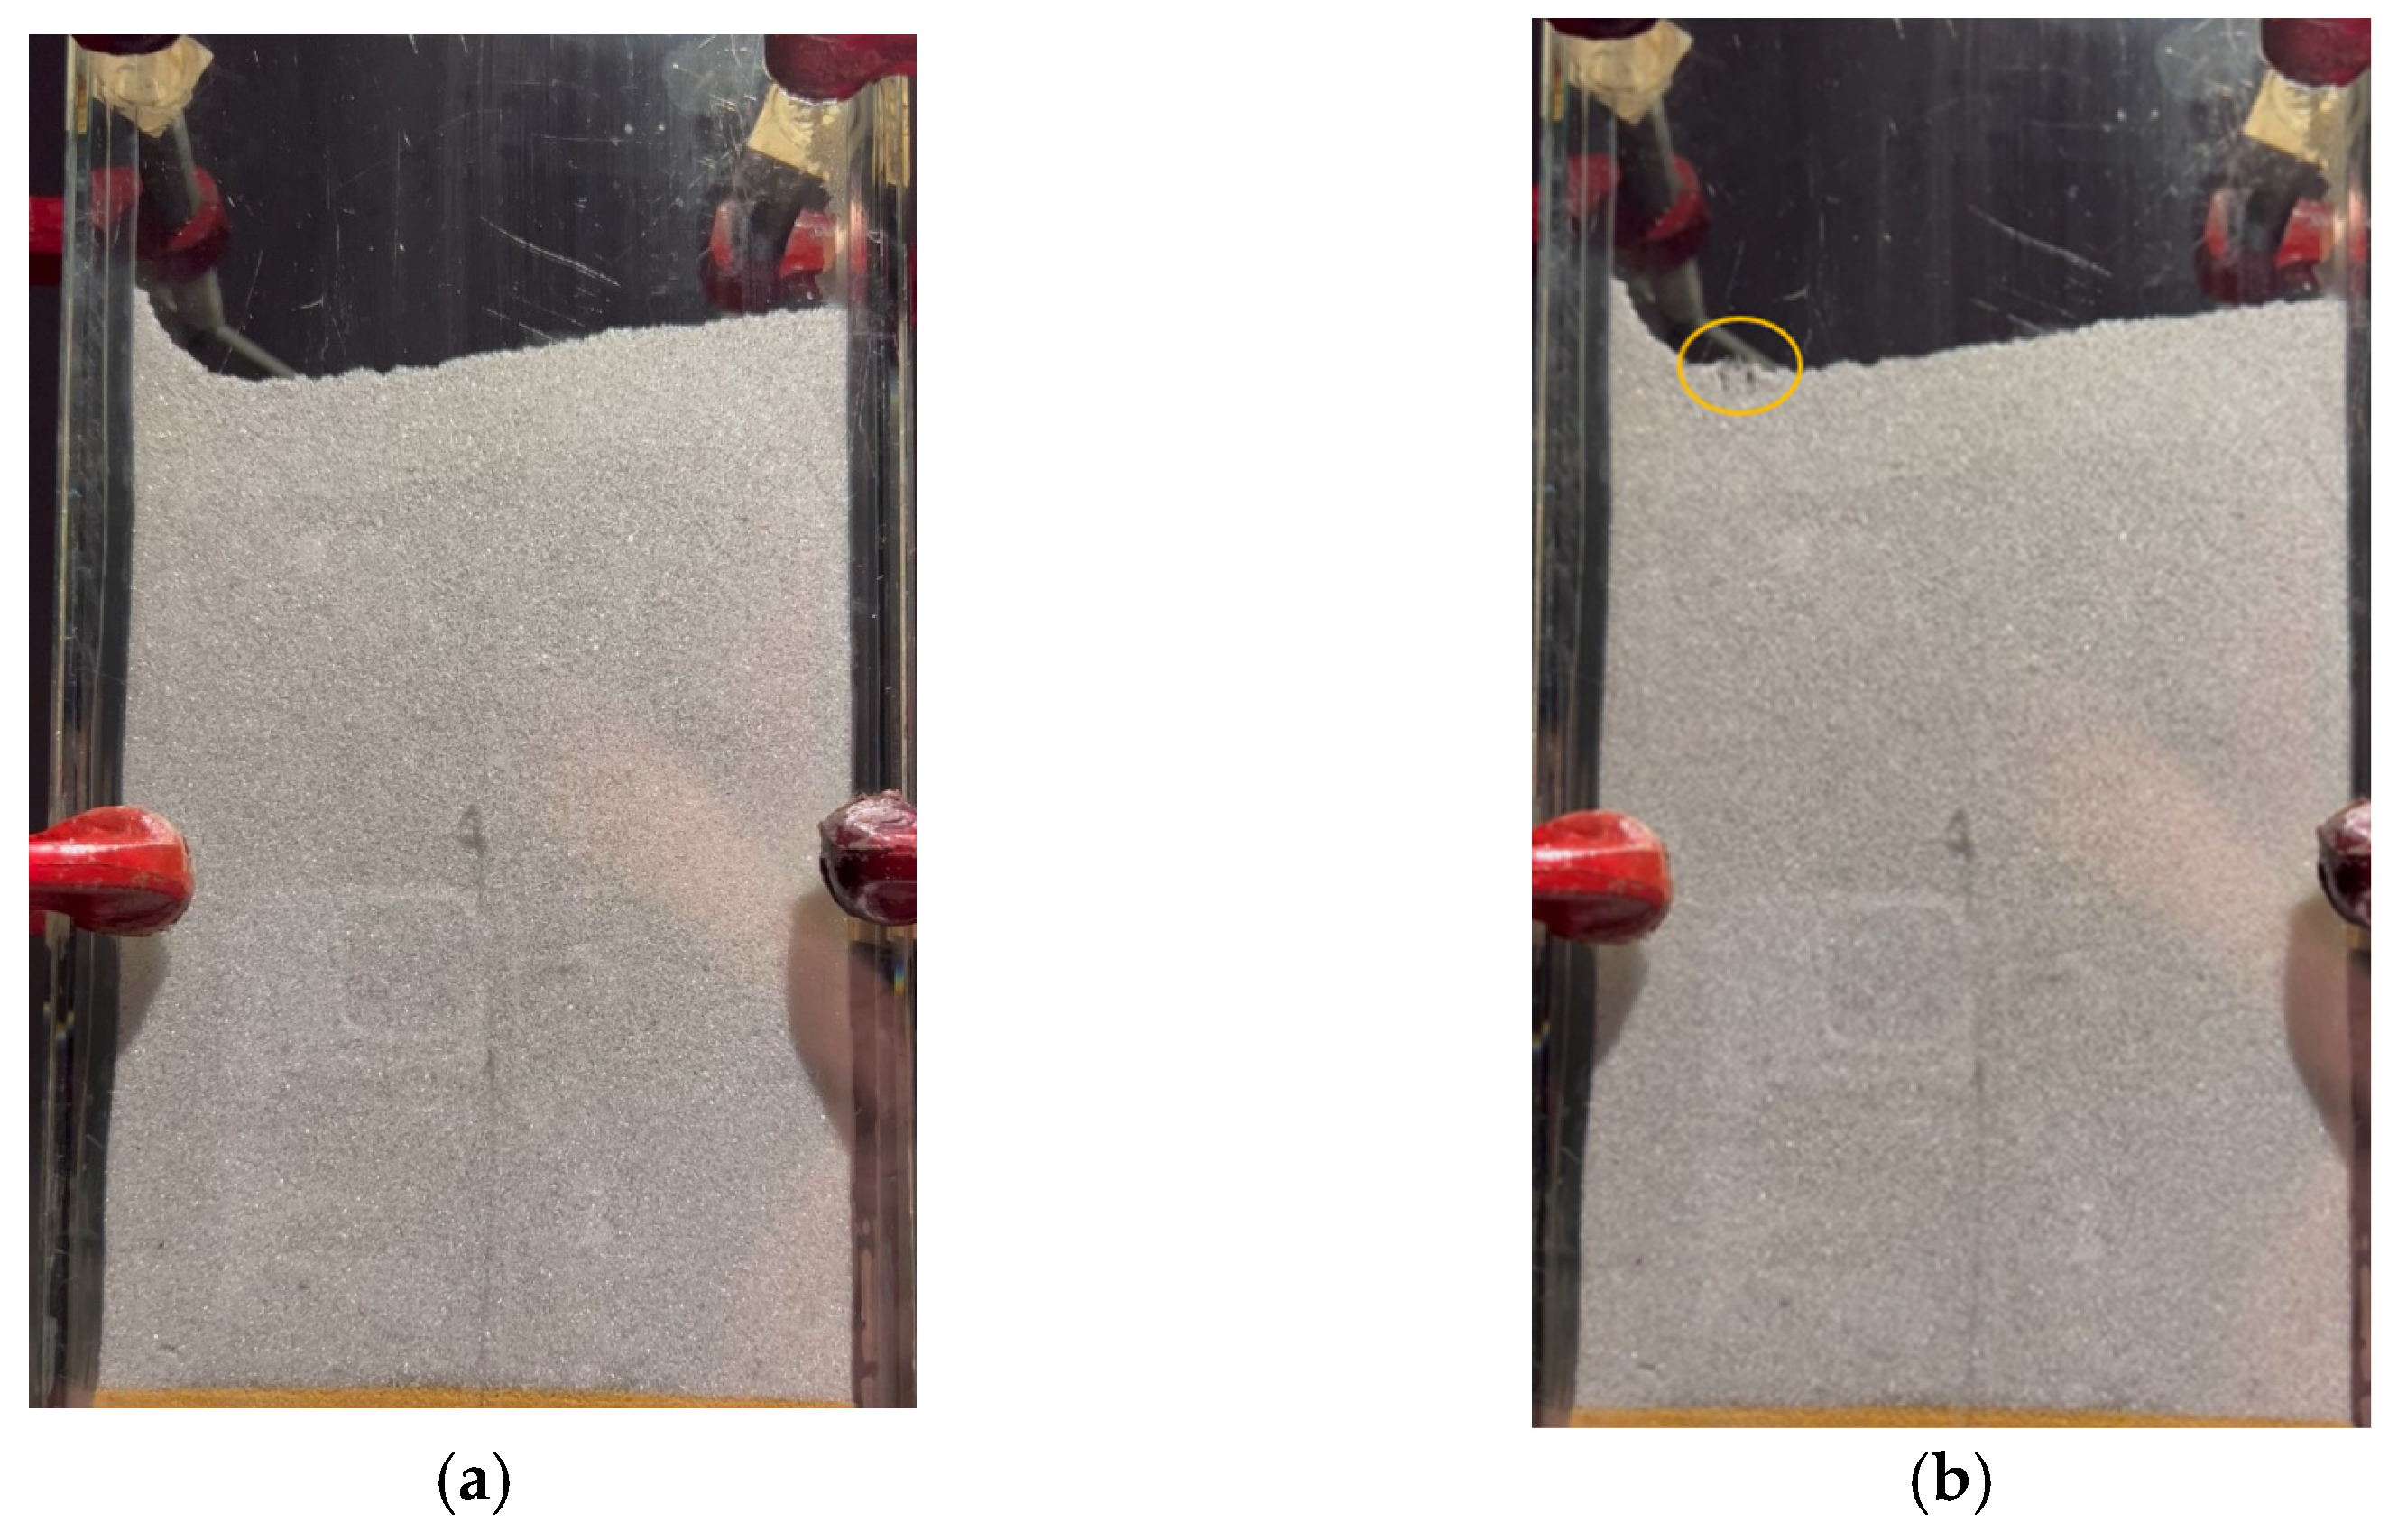
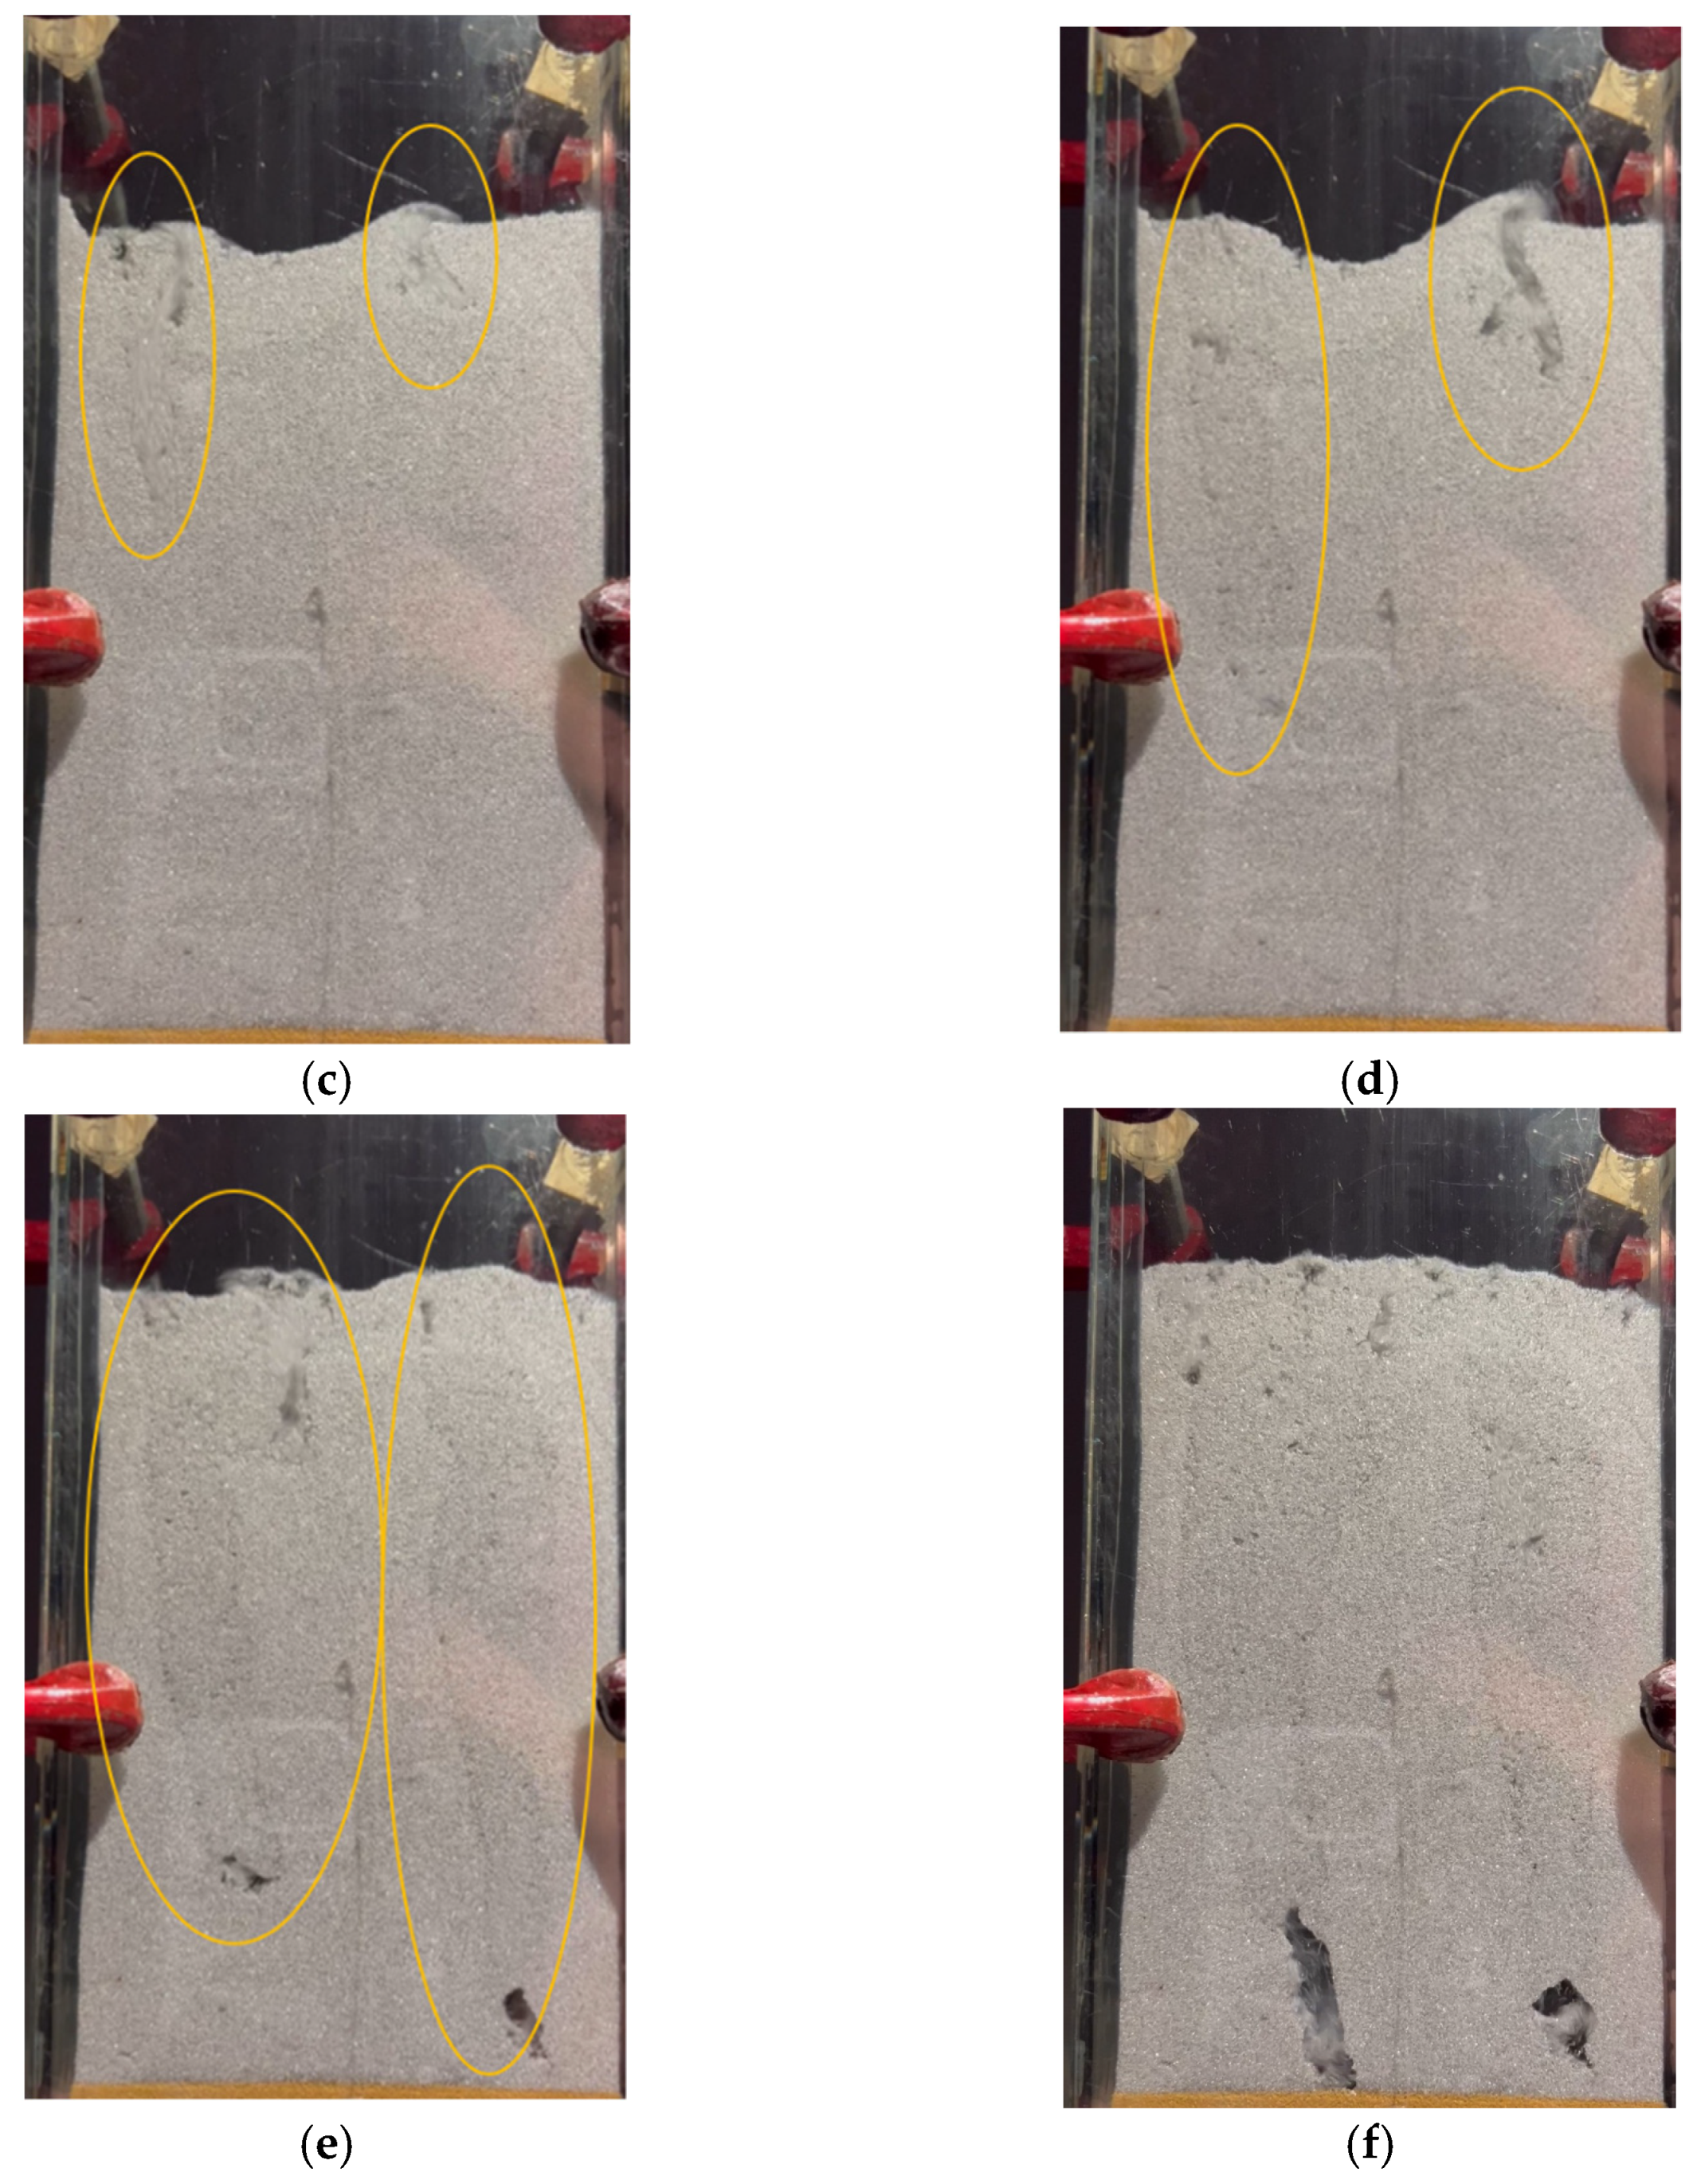
The experiment included several steps:
Gas flow through homogeneous material without change to its structure (
Figure 7a);
Formation of low-density zones propagating toward the cell bottom (
Figure 7b–e). First, a few balls formed a bump, and then, as pressure was increasing further, more balls accumulated and rose above the surface, while low-density zones appeared underneath;
Propagation of the low-density wave toward the cell bottom with loosening the whole ball mass (
Figure 7f).
5. Processing of Laboratory Data
The data collected in the laboratory experiment were processed assuming the parameters of systems and materials as in
Table 2.
Note that the boundary conditions included known pressure rather than gas flow rate at the model base. The pressure was constant on the top surface but increased with time at the cell bottom. Thus, the lower boundary condition was
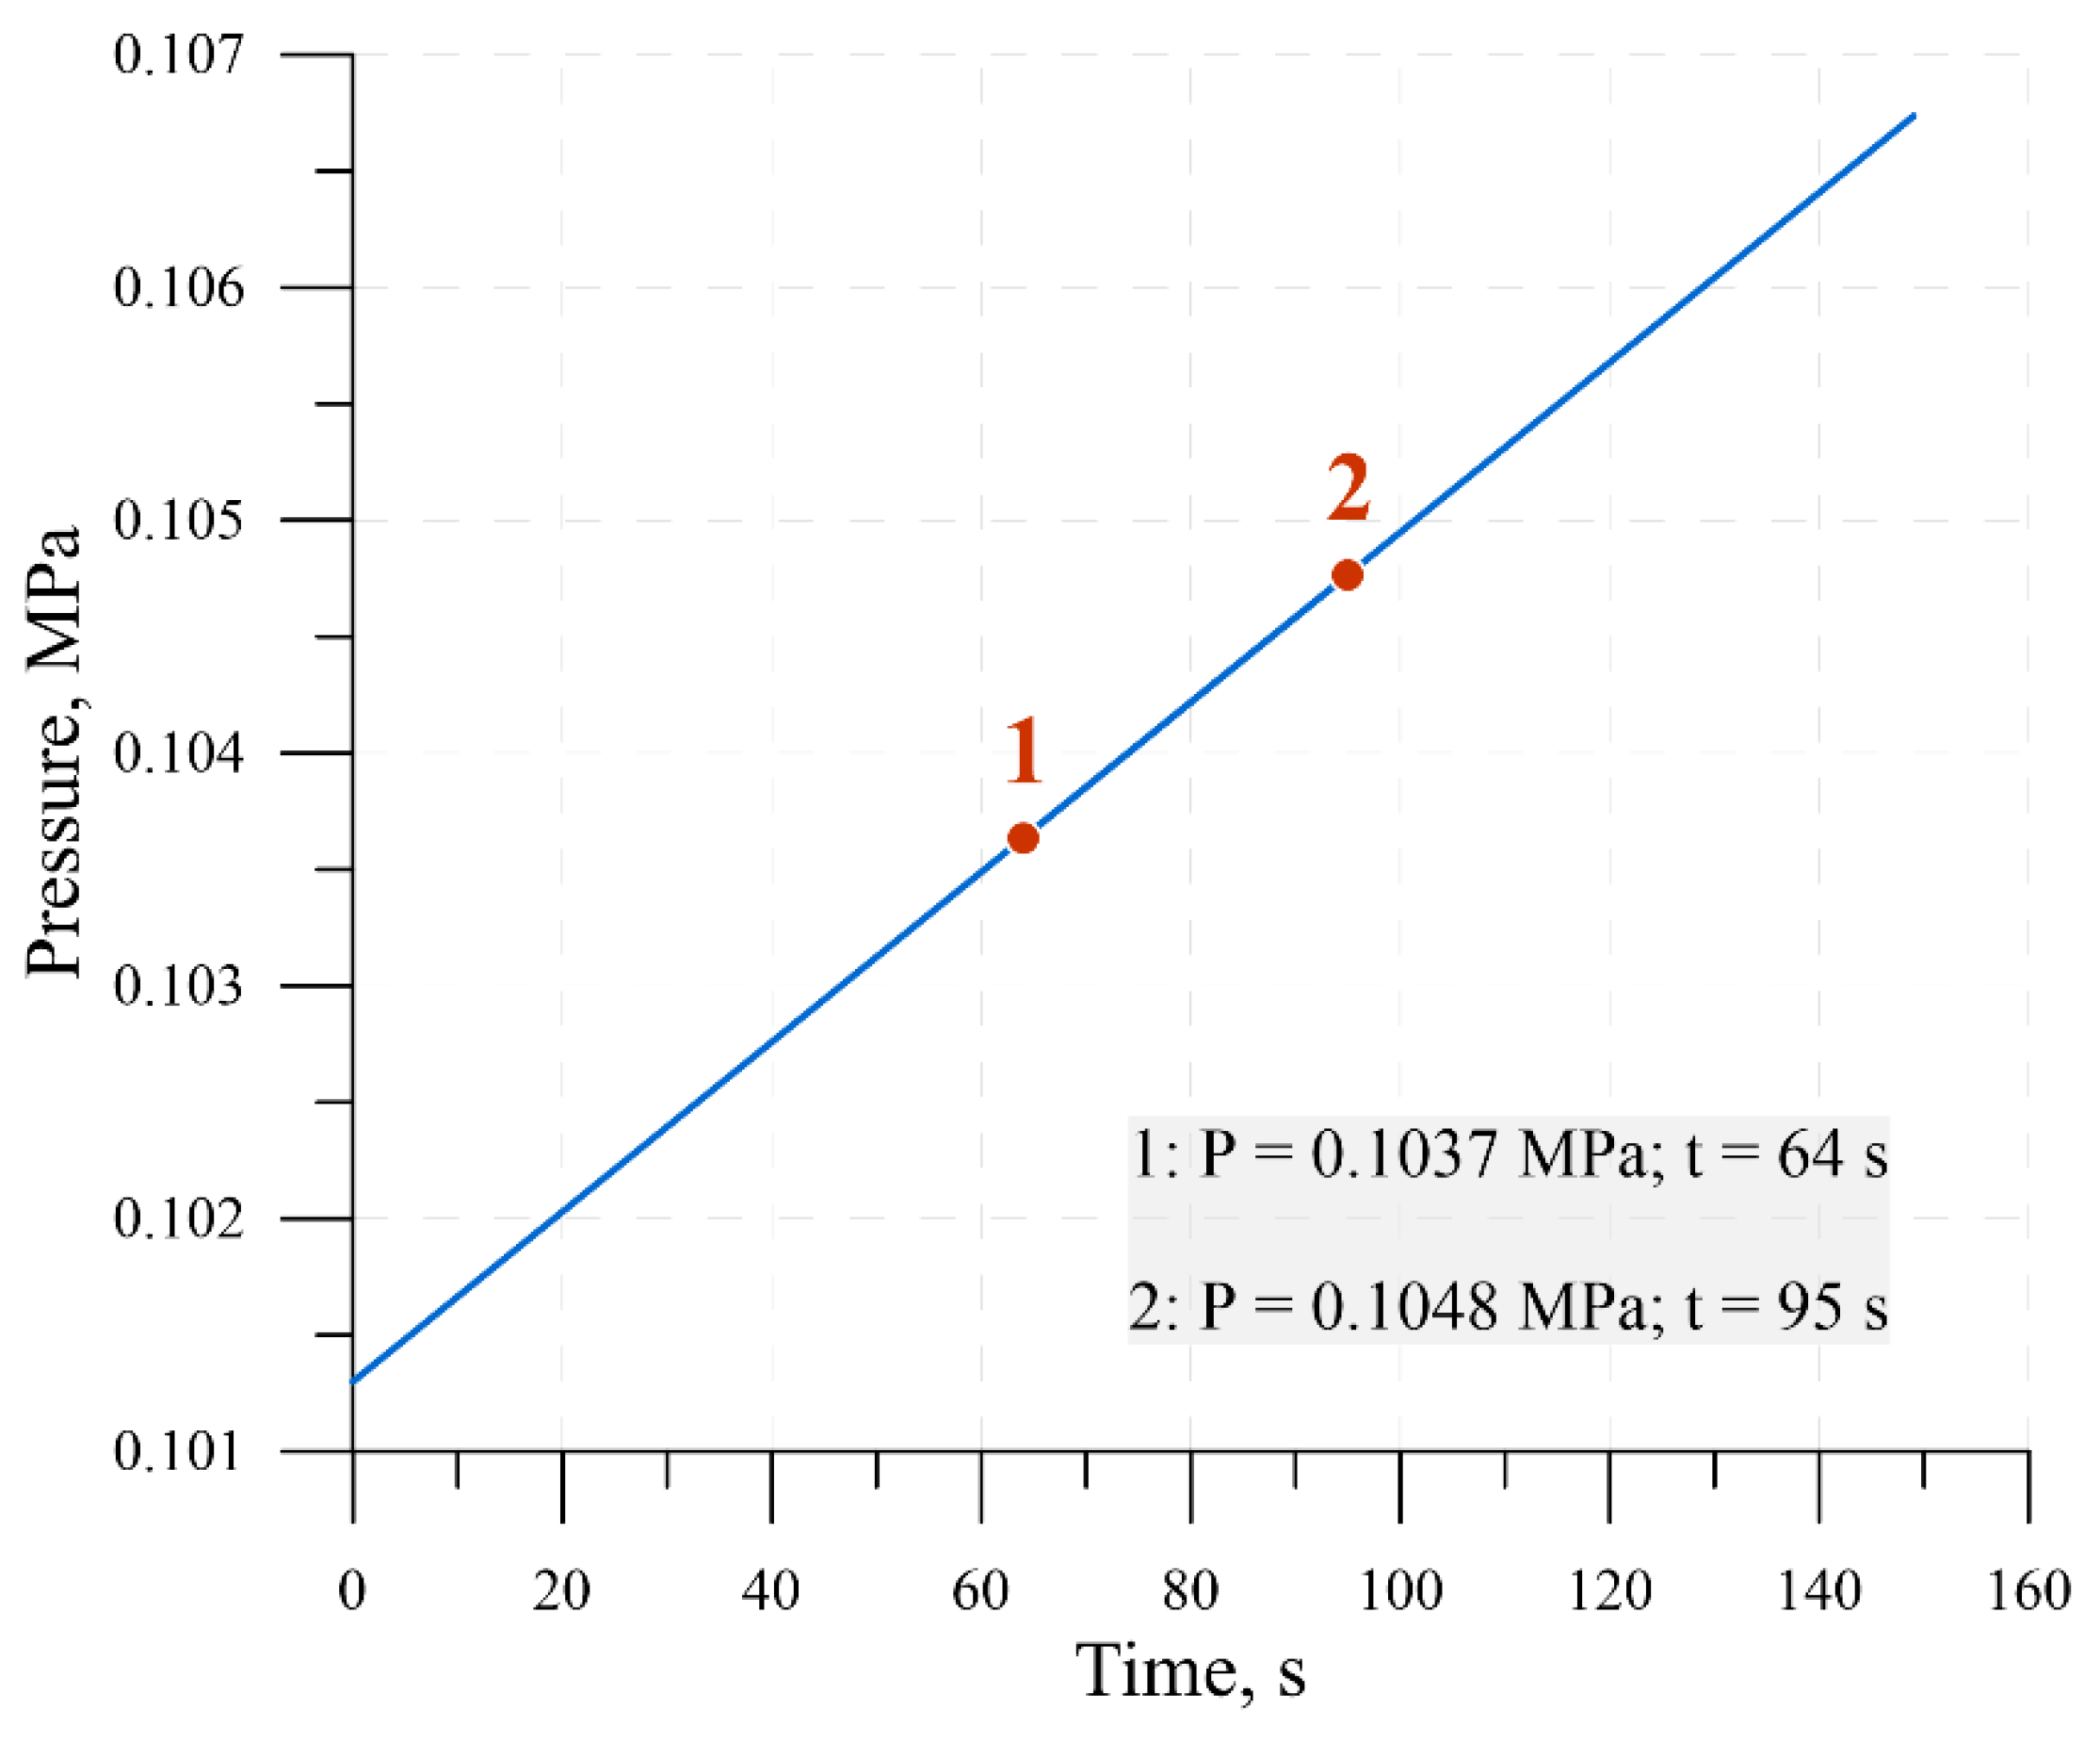
The pressure at the cell bottom was assumed to grow linearly from 0.1013 MPa until the critical level and the loss of stability. The calculations were based on empirical values of critical pressure at respective moments of time. The loss of stability began on the surface when the pressure at the cell bottom
pb(
t) reached 0.1037 MPa 64 s after
(
Figure 8).
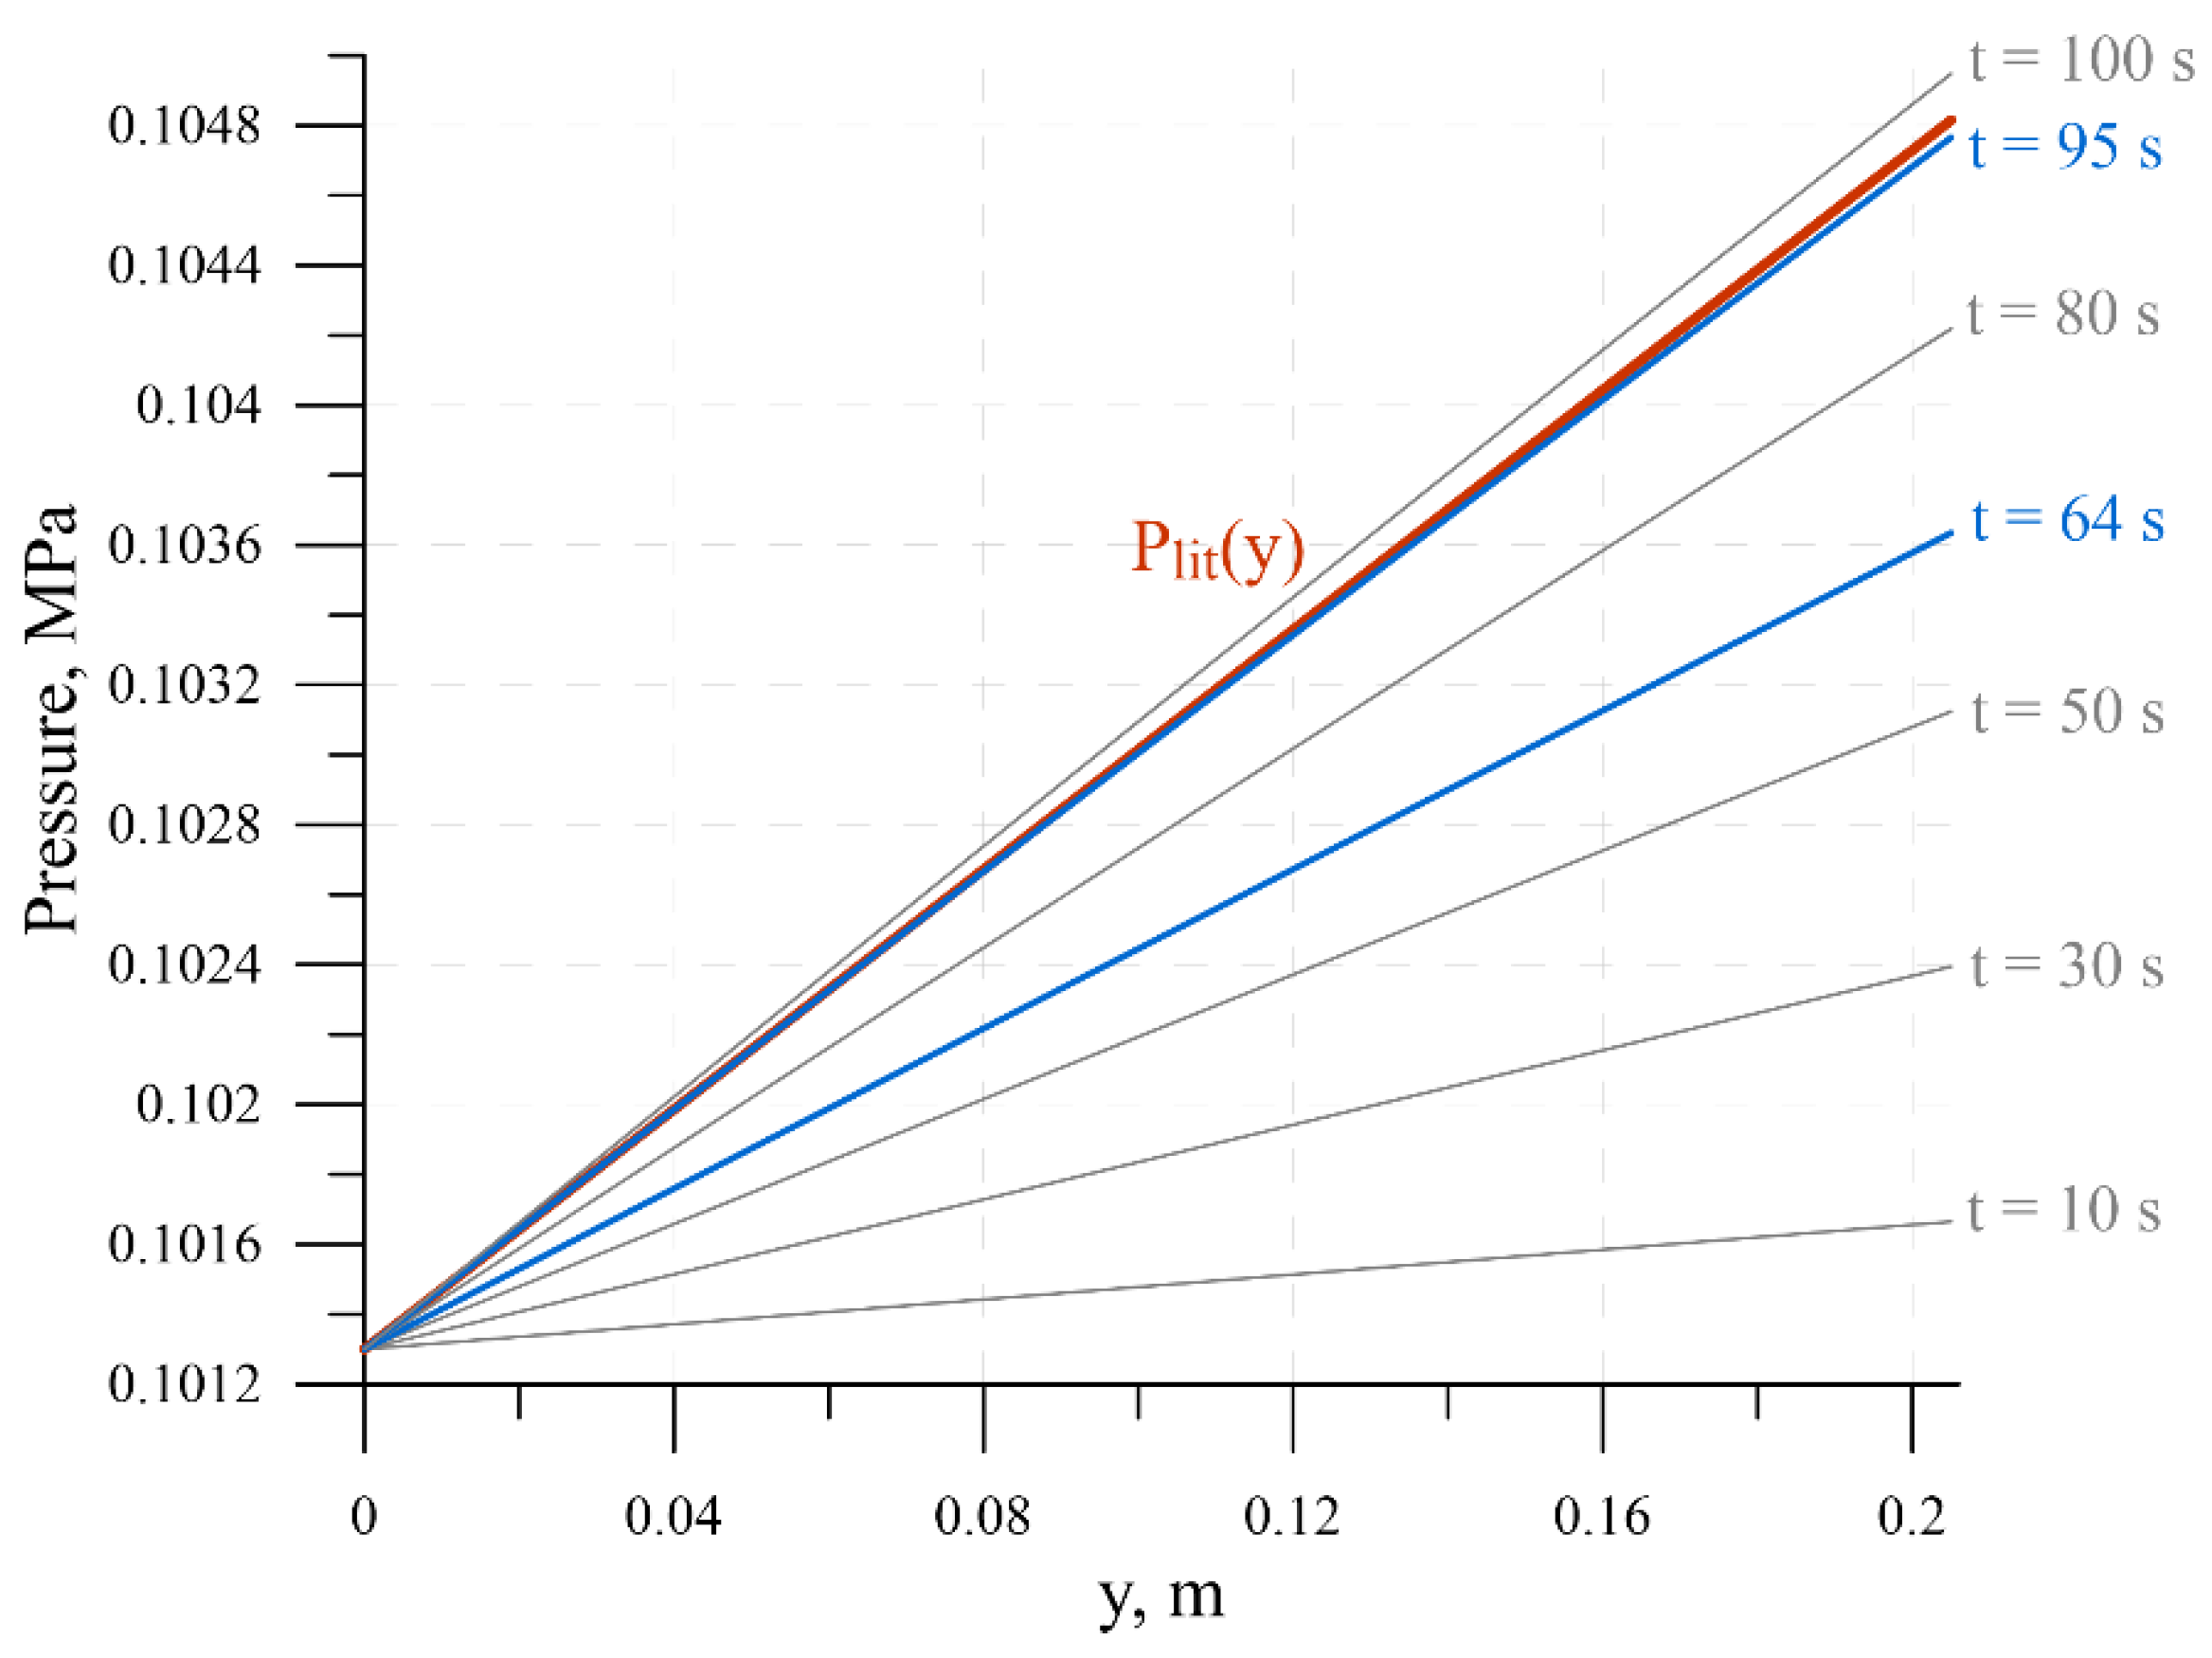
Note that the critical level of gas pressure in the laboratory experiment (point 1 in
Figure 8) corresponds to the absence of failure in the numerical model. The time-dependent pressure variations in the channel (
Figure 9) correlate with the overburden weight (red curve). The pressure in the channel does not exceed the overburden pressure until 64 s. At this permeability, the regime stabilizes immediately according to the new pressure at the cell bottom. That is, the curve with the new boundary condition either crosses the failure threshold immediately or the failure never occurs.
The numerical model predicts that failure starts as the critical pressure at the domain base reaches 0.1048 MPa, 95 s after . This value differs from that of the laboratory experiment, but the failure location is the same (on the top surface).
The time required for the density loss to propagate until the cell bottom (transition from the setting of
Figure 7b to that of
Figure 7f) was 3 s in the numerical model and 4 s in the physical model.
In three out of four runs in the laboratory experiment, the pressure at the lower boundary changed abruptly until some constant value (0.1073 MPa), which led to failure all over the model length. This result agrees with the numerical prediction.
6. Discussion
Recently, there has been an increasing interest in studying the processes accompanying the decomposition of methanhydrates in the Arctic shelf [
11,
12,
13,
14,
15]. The released methane has a significant impact on the greenhouse effect [
5,
6,
7,
8]. Observations of increasingly powerful and frequent methane breakthroughs in the zones of gas hydrate make it relevant to study the mechanism of these methane breakthroughs caused by its flow changes in the upper horizons of the Arctic permafrost. In this article, we consider the possibility of methane and sedimental weak rock blowout with an increase in the methane flow at some depth.
The suggested modeling simulates gas flow through porous material with possible blowout. In the numerical model, the gas flow is described by the equation of Leibenson. Blowout occurs as the pore gas pressure exceeds the overburden pressure. A more correct formulation of the failure (blowout) condition requires taking into account the strength of the material. However, it will not change much the resulting pressure pattern at the first approximation as the strength is included as an added constant variable which will only increase the critical pore pressure.
In the laboratory experiments, glass balls were used as a friable material, and its strength was not important. In a way, friction of balls at contact with other balls and with the cell walls may be an analog of strength. However, the calculated pressure critical for the failure was higher than that in the physical model of gas flow and blowout, and friction was neglected. The empirical and calculated critical pressure values were different possibly because the equation of Leibenson does not include changes to porosity and permeability at the pressure level above the overburden. In general, more experimental work is required, with varied properties of materials and system parameters. Such experiments are planned for the future, together with the development of the numerical model for 2D formulation and checking other criteria of gas blowout.
Note that the simple formulation of the gas flow problem and the choice of failure criterion demonstrated that the suggested mechanism of blowout triggered by gas flow rate increases as a result of gas hydrate dissociation is physically plausible and that the gas–rock system may develop instability.
It is important to discuss the differences between the presented model and the real situation. The model represents only one side of the complex process of gas emissions during the decomposition of gas hydrates. The model does not consider the process of dissociation of gas hydrates and does not consider phase transitions. The material in the experiments is a loose body, while in reality, it is not. Accounting for strength will not change the distribution of pore pressure but will allow a more accurate description of real processes. The performed study should be considered as the first approximation to the solution to the problem of gas emissions in granular media. In the next studies, it is necessary to take into account the effect of dry friction between particles. Dry friction should lead to the appearance of localization of movements in the loose mass, which are observed in reality.
7. Conclusions
We demonstrated that the suggested mechanism of methane blowout triggered by gas flow rate increase as a result of gas hydrate dissociation in the upper horizons of the Arctic permafrost is physically plausible, though more complicated models accounting for Arctic shelf conditions should be developed.
Methane flow in gas reservoirs and the conditions of gas blowout in shallow soft sediments were simulated with a problem formulation based on Leibenson’s equation.
Rock failure may follow different scenarios:
It may start at the base of the gas channel;
It may start at the top of the gas channel (free surface);
It may occur synchronously all along the channel; or
It may never occur.
The calculations show quite good agreement with the laboratory experiments, as both predict failure onset and propagation from the top surface. However, the theoretical and empirical results differ slightly in the critical pressure at the base of the modeling domain (0.1048 MPa against 0.1037 MPa) and in the time required for the failure to cover the whole domain length (3 s and 4 s). These are absolute values, and the causes of the difference can be better understood if more experimental data become available, for varied material properties and system parameters.
Author Contributions
Conceptualization, S.B.T.; methodology, S.B.T., A.A.T., and G.V.B.; software, P.M.S. and M.A.T.; validation, M.A.T.; formal analysis, S.B.T.; investigation, P.M.S., M.A.T., A.A.T., and N.A.I.; resources, S.B.T. and P.M.S.; data curation, A.A.T. and N.A.I.; writing—original draft preparation, P.M.S. and M.A.T.; writing—review and editing, S.B.T.; visualization, P.M.S.; supervision, S.B.T. All authors have read and agreed to the published version of the manuscript.
Funding
This research, in general, was funded by the Russian Science Foundation, grant No. 22-67-00025 (development of mathematical model, laboratory experiments, and comparative data analysis).
Institutional Review Board Statement
Not applicable.
Informed Consent Statement
Not applicable.
Data Availability Statement
Data available on request due to restrictions of privacy.
Conflicts of Interest
The authors declare no conflict of interest.
References
- Istomin, V.A.; Yakushev, V.S. Naturally Occurring Gas Hydrates; Nedra: Moscow, Russia, 1992; 235p. (In Russian) [Google Scholar]
- Makogon, Y.F. Gas hydrate. Historic background and development prospects. Geol. Polezn. Iskop. Mirovogo Okeana 2010, 2, 5–21. [Google Scholar]
- Makogon, Y.F. Operation of natural gas fields in permafrost. Gazov. Promyshlennost 1966, 9, 19. [Google Scholar]
- Sokur, O.N.; Gevorkiyan, V.K. Reserves of hydrocarbons in the 21st century. Methane hydrates of sea basins. Geol. Polezn. Iskop. Mirovogo Okeana 2006, 3, 52–61. [Google Scholar]
- Englezos, P.; Hatzikiriakos, S. Environmental aspects of clathrate hydrates. In Natural Gas Hydrates; Sloan, E.D., Jr., Happel, J., Hnatow, M., Eds.; Annals of the New York Academy of Sciences: New York, NY, USA, 1994; Volume 715, pp. 270–282. [Google Scholar]
- Savenko, V.S. Methan in the atmosphere: Estimates and predictions. In Scientific and Technical Aspects of Conservation; VINITI: Moscow, Russia, 1995; Issue 2, pp. 1–32. [Google Scholar]
- Stocker, T.F.; Qin, D.; Plattner, G.-K.; Tignor, M.; Allen, S.K.; Boschung, J.; Nauels, A.; Xia, Y.; Bex, V.; Midgley, P.M. (Eds.) IPCC: Climate Change: The Physical Science Basis. In Contribution of Working Group I to the Fifth Assessment Report of the Intergovernmental Panel on Climate Change; Cambridge University Press: Cambridge, UK; New York, NY, USA, 2013; 1535p. [Google Scholar]
- Masson-Delmotte, V.; Zhai, P.; Pirani, A.; Connors, S.L.; Péan, C.; Berger, S.; Caud, N.; Chen, Y.; Goldfarb, L.; Gomis, M.I.; et al. (Eds.) IPCC: Climate Change: The Physical Science Basis. In Contribution of Working Group I to the Sixth Assessment Report of the Intergovernmental Panel on Climate Change; Cambridge University Press: Cambridge, UK; New York, NY, USA, 2021; 2391p. [Google Scholar]
- Semiletov, I.P.; Pipko, I.I.; Pivovarov, N.Y.; Popov, V.V.; Zimov, S.A.; Voropaev, Y.V.; Daviodov, S.P. Atmospheric carbon emission from North Asian lakes: A factor of global significance. Atmos. Environ. 1996, 30, 1657–1671. [Google Scholar] [CrossRef]
- Sergienko, V.I.; Lobkovsky, L.I.; Semiletov, I.P.; Dudarev, O.V.; Dmitrevsky, N.N.; Shakhova, N.E.; Romanovsky, N.N.; Kosmach, D.A.; Nikolsky, D.N.; Nikiforov, S.L.; et al. The degradation of submarine permafrost and the destruction of hydrates on the shelf of East Arctic seas as a potential cause of the methane catastrophe: Some results of integrated studies in 2011. Doklady Earth Sci. 2012, 446, 1132–1137. [Google Scholar] [CrossRef]
- Adushkin, V.V.; Kudryavtsev, V.P.; Turuntaev, S.B. Global methane flux in the intergeospherical gas exchange. Doklady Earth Sci. 2003, 391, 914–916. [Google Scholar]
- Adushkin, V.V.; Kudryavtsev, V.P. Estimating the global flux of methane into the atmosphere and its seasonal variations. Izv. Atmos. Ocean. Phys. 2013, 49, 128–136. [Google Scholar] [CrossRef]
- Shakhova, N.; Semiletov, I.; Chuvilin, E. Understanding the permafrost–hydrate system and associated methane releases in the East Siberian Arctic Shelf. Geosciences 2019, 9, 251. [Google Scholar] [CrossRef] [Green Version]
- Steinbach, J.; Holmstrand, H.; Shcherbakova, K.; Kosmach, D.; Brüchert, V.; Shakhova, N.; Salyuk, A.; Sapart, C.J.; Chernykh, D.; Noormets, R.; et al. Source apportionment of methane escaping the subsea permafrost system in the outer Eurasian Arctic Shelf. Proc. Natl. Acad. Sci. USA 2021, 118, e2019672118. [Google Scholar] [CrossRef]
- Shakhova, N.; Semiletov, I.; Sergienko, V.; Lobkovsky, L.; Yusupov, V.; Salyuk, A.; Salomatin, A.; Chernykh, D.; Kosmach, D.; Panteleev, G.; et al. The East Siberian Arctic Shelf: Towards further assessment of permafrost-related methane fluxes and role of sea ice. Philos. Trans. A Math. Phys. Eng. Sci. 2015, 373, 20140451. [Google Scholar] [CrossRef]
- Shakhova, N.; Semiletov, I.; Gustafsson, O.; Sergienko, V.; Lobkovsky, L.; Dudarev, O.; Tumskoy, V.; Grigoriev, M.; Mazurov, A.; Salyuk, A.; et al. Current rates and mechanisms of subsea permafrost degradation in the East Siberian Arctic Shelf. Nat. Commun. 2017, 8, 15872. [Google Scholar] [CrossRef] [PubMed] [Green Version]
- Syrtlanov, V.R.; Shagapov, V.S. Gas hydrate dissociation in porous materials exposed to pressure decrease. PMTF 1995, 36, 120–130. [Google Scholar]
- Nigmatulin, R.I.; Shagapov, V.S.; Syrtlanov, V.R. Auto-model problem of gas hydrate dissociation in porous materials under pressure decrease and heating. PMTF 1998, 39, 111–118. [Google Scholar]
- Poveshchenko, Y.A.; Podryga, V.O.; Popov, I.V.; Popov, S.B.; Ragimli, P.I.; Kazakevich, G.I. 1D simulation of gas hydrate dissociation in porous materials. Bull. Kazan Univ. Ser. Fiz.-Mat. Nauk. 2019, 161, 205–229. [Google Scholar] [CrossRef]
- Chuvilin, E.M.; Grebenkin, S.I.; Davletshina, D.A.; Jmaev, M.V. Influence of hydrate formation on gas permeability variations in frozen sands. Earth’s Cryosphere 2020, 24, 34–40. [Google Scholar]
- Chuvilin, E.; Grebenkin, S.; Zhmaev, M. Gas permeability of sandy sediments: Effects of phase changes in pore ice and gas hydrates. Energy Fuels 2021, 35, 7874–7882. [Google Scholar] [CrossRef]
- Chuvilin, E.M.; Grebenkin, S.I. Dissociation of gas hydrates in frozen sands: Effect on gas permeability. Earth’s Cryosphere 2018, 22, 41–45. [Google Scholar]
- Bogoyavlensky, V.I. Origin of explosive gas emission and formation of giant craters in the Arctic: Fundamental aspects. Arkt. Ekol. Ekon. 2021, 11, 51–66. [Google Scholar]
- Chuvilin, E.M.; Sokolova, N.S.; Bukhanov, B.A.; Davletshina, D.A.; Spasennykh, M.Y. Formation of Gas-Emission Craters in Northern West Siberia: Shallow Controls. Geosciences 2021, 11, 393. [Google Scholar] [CrossRef]
- Bogoyavlensky, V.I.; Garagash, I.A. Explosive gas emission and formation of giant craters in the Arctic: Testing by mathematical modeling. Arkt. Ekol. Ekon. 2015, 3, 12–17. [Google Scholar]
- Leibenson, L.S. Flow of compressible liquid in porous media: General problem. Izv. Akad. Nauk. SSSR Seriya Geogr. Geophizicheskaya 1945, 9, 3–6. [Google Scholar]
- Leibenson, L.S. Main principle of liquid flow in porous media. Izv. Akad. Nauk. SSSR 1945, 47, 15–17. [Google Scholar]
- Leibenson, L.S. Flow of Natural Fluids and Gas in Porous Media; Gostekhizdat: Moscow/Saint Petersburg, Russia, 1947; 244p. [Google Scholar]
| Publisher’s Note: MDPI stays neutral with regard to jurisdictional claims in published maps and institutional affiliations. |
© 2022 by the authors. Licensee MDPI, Basel, Switzerland. This article is an open access article distributed under the terms and conditions of the Creative Commons Attribution (CC BY) license (https://creativecommons.org/licenses/by/4.0/).


 ,
, 


