Article

An Interactive WebGIS Integrating Environmental Susceptibility Mapping in a Self-Burning Waste Pile Using a Multi-Criteria Decision Analysis Approach

by
Lia Duarte
1,2,*,
Ana Cláudia Teodoro
1,2,
Patrícia Santos
1,2,
Cátia Rodrigues de Almeida
1,2,
Joana Cardoso-Fernandes
1,2 and
Deolinda Flores
1,2
1
Institute of Earth Sciences, University of Porto Pole, 4169-007 Porto, Portugal
2
Department of Geosciences, Environment and Spatial Planning, Faculty of Sciences, University of Porto, 169-007 Porto, Portugal
*
Author to whom correspondence should be addressed.
Geosciences 2022, 12(10), 352; https://doi.org/10.3390/geosciences12100352
Submission received: 30 July 2022 / Revised: 10 September 2022 / Accepted: 16 September 2022 / Published: 21 September 2022

Abstract

:
Mining activities promote resulting wastes, so coal mines are prone to release contaminants to the environment, namely to the soil and water. Therefore, the analysis of this type of risk is crucial in waste pile management. The São Pedro da Cova (Porto, Portugal) coal waste pile has been studied in recent years, with several data acquired from 2019–2021 under a research project using distinct methodologies. These results are now combined in a multi-approach method to estimate the environmental impacts of the waste pile and identify the contamination. With the integration of all the data in a Geographical Information System (GIS) environment, and to fulfill a scientific gap, this study aims: (i) to create a susceptibility map of contamination in the areas surrounding the self-burning coal waste pile in São Pedro da Cova, using Analytical Hierarchy Process (AHP) and Fuzzy AHP approaches; and (ii) to develop a webGIS application incorporating all the information acquired that can be useful for the residents of São Pedro da Cova and also to the decision-making public entities and researchers. The results obtained show that the contamination susceptibility is higher surrounding the abandoned mine, particularly along the waste piles and the corresponding runoff areas, which can be especially sensitive.

1. Introduction

Coal mining in Portugal was a significant economic activity until the closure of the last mine in 1994. This activity resulted in environmental liabilities as multiple industrial facilities are currently abandoned, with mine drainage discharges in the hydrographic systems and large amounts of mining residues stored.
Coal mining can release hazardous elements at potentially harmful levels to the environment, causing soil and water contamination, land degradation and ecological deterioration [1,2,3,4,5]. In Portugal, as in many other countries, the abandoned mining areas constitute a contamination focus [6,7,8,9,10,11].
The management of this type of risk of contamination represents an obstacle to the development of any region since such abandoned mines can cause environmental issues and decrease the health conditions of the surrounding areas. Consequently, the analysis of the environmental susceptibility of abandoned coal waste piles has become an important tool in their planning and management.
Several studies applied Multiple Criteria Decision Making (MCDM) methods to evaluate the risk of abandoned waste piles in several contexts. For instance, Alamanos and Papaioannou [12] presented an approach combining Geographical Information System (GIS) with multi-criteria analysis (MCA) to evaluate wetland effectiveness using multiple factors (geomorphological, climatological, hydrological and land use), in Grand River (Ontario, Canada). Qiaoxiu et al. [13] used a Fuzzy Analytic Hierarchy Process (FAHP) combined with a mathematic model based on Logarithmic Fuzzy Preference Programming (LFPP) method to estimate and rank several factors (environmental, human, management and technological, and equipment factors) to implement a management model and guide the safety managers in the mining process, in China. Choi et al. [14] performed a combination of factor analysis and fuzzy relations with GIS software to determine vulnerable locations to coal mine subsidence in Taebaek City, Korea. Rehman et al. [15] combined several methods, including fuzzy logic to analyze the mining subsidence susceptibility in Raniganj coalfield (India) using site-specific parameters. Dai et al. [16] used AHP to combine several factors to determine the risk of coal-floor water inrush in the Hacheng mine area, part of the southeastern margin of Ordos Basin in Shaanxi Province (China). Sahin et al. [17] also used AHP combined with GIS to investigate possible places of air pollution in four districts of Igdir city (Turkey). Chabok et al. (2020) used FAHP to select the optimum location for municipal solid waste in Ahvaz (Iran), combining environmental and socio-economic criteria. AHP has also been used with success for susceptibility modeling of landslide risk in North Macedonia [18]. From the literature consulted, it can be concluded that the use of GIS combined with MCDM evaluation could provide a better understanding and a strong and efficient database, and it can constitute a guide for policymakers and experts.
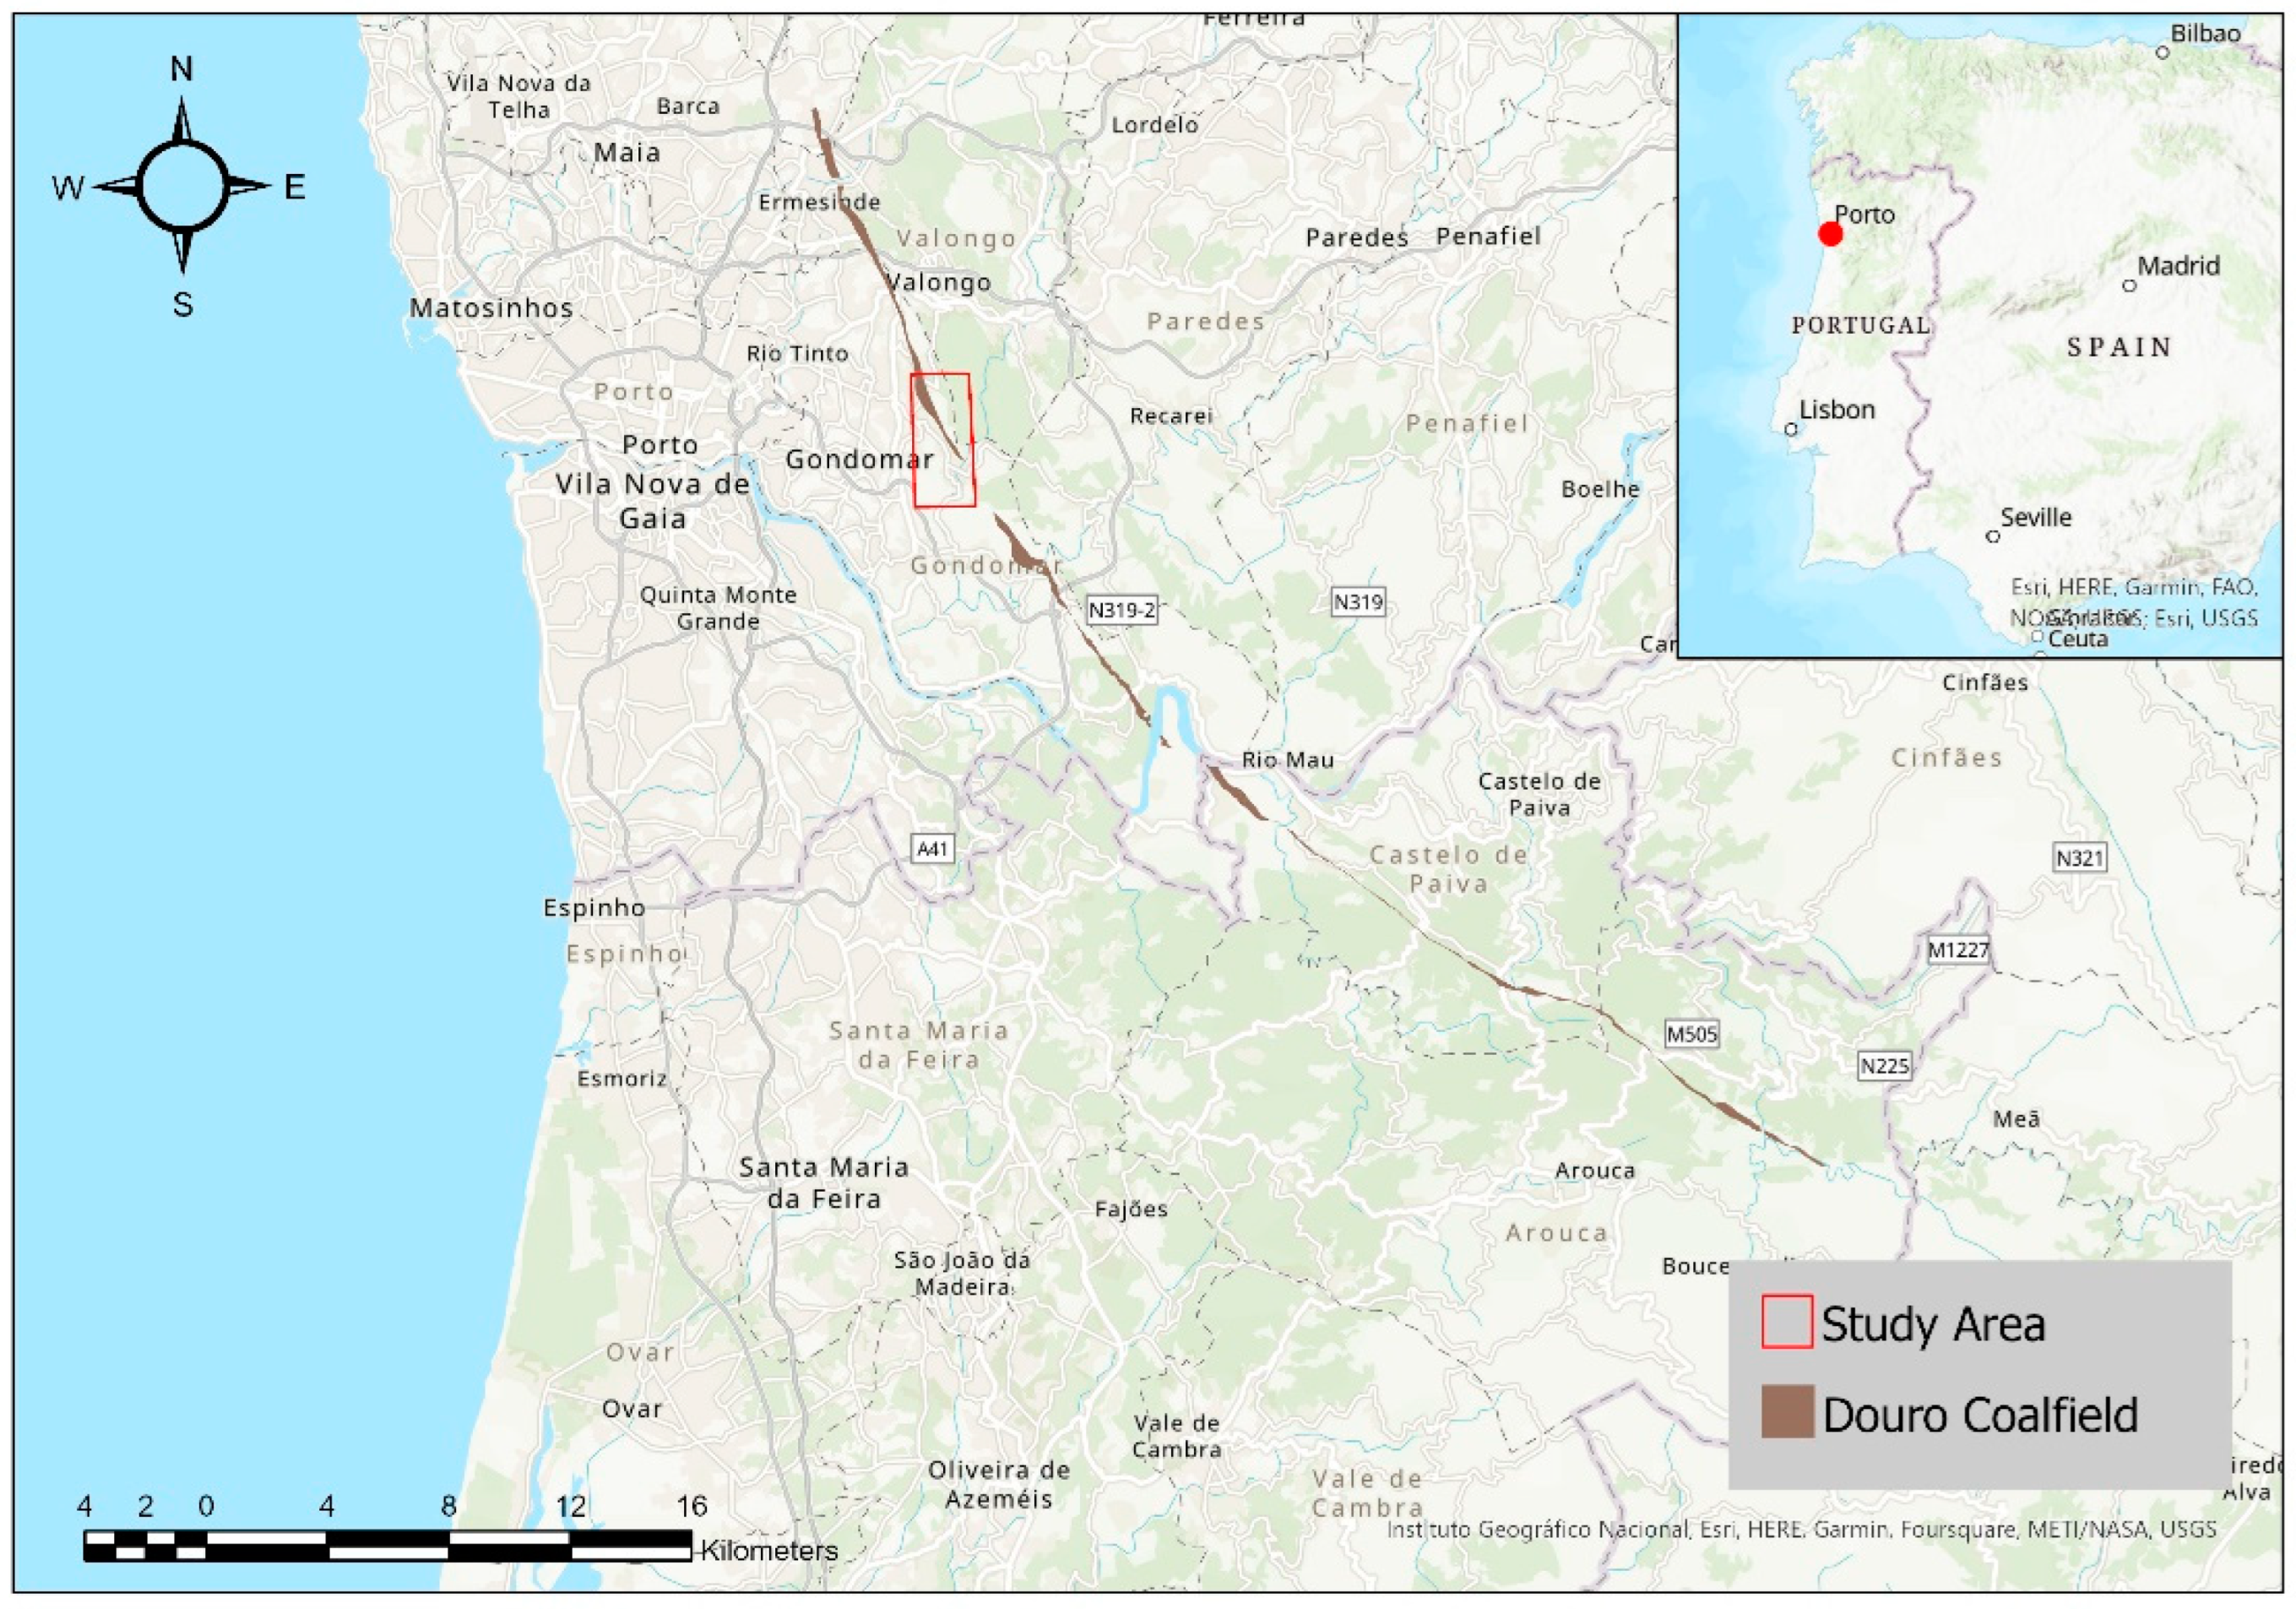
São Pedro da Cova (Porto, Portugal) coal waste pile has been studied in recent years because it has been self-burning since 2005 after being ignited by a forest wildfire. Due to its great importance, one international scientific research project named ECOAL (Ecological Management of Coal Waste Piles in Combustion) was implemented, aiming at the remote, multi-point, and continuous monitoring of gas emissions and combustion temperature in the self-burning coal waste pile using advanced optical fiber sensing technology [19]. The results allowed the study of the dynamic and evolution of the combustion process. A more recent project, named CoalMine, that started in 2018, aimed to characterize and quantify the environmental impacts caused by the self-burning of the coal waste pile, including the potential environmental impacts on ecosystems, including soils, waters, and human health (https://www.fc.up.pt/coalmine/, accessed on 22 July 2022). Previous studies proved to be of prime importance the environmental monitoring of the São Pedro da Cova coal waste pile, and as well as that, the identification of potential environmental impacts of the surrounding areas is of extreme relevance, including soils and waters [2,3,19,20,21,22,23,24,25,26,27]. Taking this into consideration, there is a great interest in the environmental susceptibility mapping of the São Pedro da Cova coal waste pile considering the contamination of the surrounding areas.
Collaborative effort for the improvement of a self-burning coal waste pile database is essential during the long-term contamination reduction process. In the São Pedro da Cova coal waste pile, several data were acquired from 2019–2021, through distinct methodologies combined in a multi-approach to estimate the environmental impacts of the waste pile. The information acquired by several techniques, namely in situ campaigns and remote sensing data, through satellite imagery and Unmanned Aerial Vehicle (UAV) sensors, were manipulated and integrated in a GIS open-source application (Coal Mine), developed for QGIS software, focused on describing the spatial distribution of the contaminated area and also characterizing the environmental and health risks [20].
As a result of the integration in a GIS environment of all the data acquired during the CoalMine project, and to fill a scientific gap, this study aims: (i) to create the susceptibility map of contamination in the areas surrounding the São Pedro da Cova self-burning coal waste pile; and, (ii) to develop the webGIS application incorporating all the information obtained in the project and that can be useful for the residents of São Pedro da Cova and also to the public entities and researchers. Specifically, it is mainly intended to publish and share data acquired between 2019 and 2021, in the São Pedro da Cova self-burning coal waste pile, through a freely available webGIS as open portal data.
As so, the adopted methodology was implemented considering the available data acquired in the field and a webGIS was developed constituting the final product of the project. The result is crucial to understand how the surrounding areas can be negatively affected by the waste pile contaminants.
The next sections are organized as follows: Section 2 describes the study area, the data inventory maps, and the methodology adopted to estimate the environmental susceptibility mapping in a self-burning coal waste pile using a GIS-based MCDM approach. Section 3 presents the methodology adopted to design and implement the webGIS, considering the architecture, software, and tools. Section 4 presents the results and discussion of the obtained environmental susceptibility map and the outcomes in terms of performance, user interface, and utility of the webGIS. Section 5 presents the conclusions and future work.

2. Materials and Methods

2.1. Study Area

The São Pedro da Cova coal mine is located in Gondomar Municipality, Porto district (41°09′25″ N; 8°30′06″ W; Figure 1). The mine is located near the urban center, in the vicinity of multiple services and infrastructures and where many families practice subsistence agriculture.
The São Pedro da Cova mine is one of the coal mines hosted in the Douro Coalfield, which is the most significant coal-bearing strata in Portugal of Upper Pennsylvanian age [28,29,30,31], with a length of 53 km from São Pedro de Fins to Janarde and a width that can be up to 250 m [32].

2.2. Coal Mine Inventory Map

In order to create a susceptibility map representing the areas that are prone to suffer contamination sourced from the abandoned mine, with particular highlight on the mine waste pile and the underground mining drainage discharge into the hydrographic network, the available environmental data obtained from different sources were incorporated in a GIS software (QGIS) using a MCDM approach to identify the potential zones where contaminants are deposited from the mining waste through multiple pathways such as gravity, wind, and water. The contamination potential was obtained through a Weighted Overlay Method (WOM) composed of five standardized parameters: (i) the waste pile location, (ii) runoff areas, (iii) downstream drainage, (iv) the distance from the waste pile, and (v) Normalized Difference Vegetation Index (NDVI). These parameters were selected based on their role in the transport of contaminants in the environment via different ways (e.g., aerial or aqueous) [5,33,34]. The parameters are detailed in Section 2.3. Each parameter was standardized through two techniques: using AHP and Fuzzy-AHP approaches. These two approaches were adopted mainly because: (i) both methods are widely used in studies similar to our study; (ii) both methods provide a simple and flexible model for any problem; (iii) it is possible to measure the consistency of decisionmaker‘s judgments, in both; and (iv) both can take into consideration the relative priorities of factors and represents the best alternative to use. The final parameter weights were determined using pairwise comparisons in the AHP method. Finally, the parameters were aggregated using the WOM method and the results were evaluated through the generation of the receiver operating characteristic (ROC) value and the area under the ROC curve (AUC).
The methodology adopted in this study was based on the available data for the São Pedro da Cova coal mine and on several approaches consulted in the literature [35,36]. The data were extracted from different sources and through several field campaigns (Figure 2). The knowledge about the field was critical in the definition of the inventory maps. The maps related to each parameter were projected in the European Terrestrial Reference System (ETRS89)-PTTM06 coordinate system (EPSG:3763) and resampled to 10 m of spatial resolution (the same resolution as satellite imagery), with the extension of the study area. Table 1 presents the source data used, which will be described in Section 2.3, and Figure 2 presents a flowchart with the data used and the methodology adopted.

2.2.1. Satellite Data

An image from 6 October 2021 from Sentinel-2B was obtained from the United States Geological Survey (USGS) website [37]. The Sentinel-2B operates in a polar-orbiting, sun-synchronous orbit along with the Sentinel-2A (Copernicus Sentinel-2 mission). They have a wide swath width (290 km), with a revisit time of 5 days (considering both satellites) [38]. Table 2 presents the complementary information about the satellite data and Table 3 presents the characteristics of the bands used.
The RGB true color composition (RGB:432) was used to analyze the variability of the land cover of the study area, where several classes were present, namely: streets, residences, industrial, soil bail, and trees. A false-color map was also created (RGB:843) to highlight the vegetation (in red due to the NIR band) and distinguish from areas with anthropic changes (such as streets, industries, residences, etc.) (Figure 3b) [39].

2.2.2. Streams and Drainage

A Digital Elevation Model (DEM) was obtained from Copernicus Land Monitoring Service [38]. It is a hybrid product based on Shuttle Radar Topography Mission (SRTM) and ASTER Global Digital Elevation Model (GDEM) data fused by a weighted averaging approach. The information is divided by tiles (1000 × 1000 km) and projected in ETRS89-LAEA projection (EPSG:3035) with 25 m of spatial resolution. In this study, the product DEM-v1.1-E20N20 was downloaded.
The drainage network affected by the abandoned coal mine was considered in this study. The temporary drainage lines were obtained using the r.stream.extract algorithm from Geographic Resources Analysis Support System (GRASS) in QGIS software, which allows extracting the stream network from the DEM. The permanent streams were manually digitized from the georeferenced aerial image, from ArcGIS software [40]. This parameter is relevant since it can be responsible for contaminants dissemination through aqueous media and suspension from the mine to the surrounding ecosystems. Two main drainage systems were considered in this study, the western lines drain material from the waste pile into Paradela Stream, and the eastern drain water and precipitates from underground mining galleries, leading Silveirinhos Stream that flows to Ferreira River (Figure 4).

2.3. Parameters Description

2.3.1. Waste Pile Delimitation

The waste pile delimitation was obtained manually, as a vector file, under the Google Earth base map. In the study area, the higher focus of contamination is the waste pile itself, so it was defined as the main parameter in the MCDM model. Previous studies characterized the materials deposited in the waste pile geochemically, identified the presence of different Potentially Toxic Elements (PTEs) as well as Polycyclic Aromatic Hydrocarbons (PAHs) [2,27,41] that can be hazardous to the environment and human health. The contaminants present in mine wastes are expected to follow two major pathways for dispersion aerial and leaching [42].

2.3.2. Proximity to Waste Pile

The proximity to the contaminant sources is critical in the evaluation of contaminant transport and dispersion [35]. The contamination by particulate matter and aerial transportation was considered in the model using the Euclidean distance algorithm (from ArcGIS software [40]).

2.3.3. Downstream Drainage

The pollutants may be transported via water through the existent mine drainage systems [35]. The overall quality of groundwater from mine drainage galleries from São Pedro da Cova revealed contamination; this water quality near the discharge points is not appropriate for agriculture irrigation and revealed organic substances as PAHs with carcinogenic compounds [43].
Several studies mention higher concentrations of contaminants closer to drainage system [5,43,44,45,46]. The downstream drainage system represents the pollutants transportation in the water through solution and suspension, from the contamination sources. In this case, the mining facilities and waste pile. A second drainage system can be considered after the underground water discharge of the mining effluents in Ribeiro de Silveirinhos (Figure 4). In this study, the stream network was manually digitized based on the results obtained from GIS tools. Then, a buffer of 50 m was applied to each streamline to consider the effects of flooding from the streams during winter and sedimentation particles along the margins. The drainage areas were subdivided according to the expected concentration of elements and substances sourced by the mine. The different segments were incorporated as reflex of the pollution dilution effects caused by the successive apport of fresh water from tributary water lines downstream. One segment includes the Silveirinhos Stream after the mining underground effluents discharges, until it meets the Ferreira River, which is then divided into another segment. Along the western drainage considered from the waste pile, a segment starting along the temporary water lines located downstream of the mine waste pile until meeting the Paradela Stream was considered, and another is traced when this tributary meets the Ferreira River.

2.3.4. Waste Pile Runoff Areas

The runoff areas are defined by the areas immediately downslope of the waste pile and mining facilities that collect the surface waters and materials that were eroded and/or leached from the waste pile and coal processing areas. Geographically, these areas are comprised between the contamination sources, the waste piles and mining facilities, following downslope until the surrounding drainage lines. In this study, the runoff areas were manually digitized, considering the waste pile and the stream drainage network mentioned in the previous point.
The runoff areas consider the direct transport of pollutant materials from the waste pile to areas downslope. Previous studies demonstrated that leaching tests results performed on the waste pile materials shown that the leachates generated have considerably different concentrations of major (Al, Fe, K, Na, Ca, Mg, Cl, SO4, F, NO3, NO2, NH4) and trace elements (As, Cd, Cr, Cu, Mn, Ni, Pb, Zn) [27,40].

2.3.5. Influence of Vegetation

Vegetation cover reduces the transport of contaminants through the wind, building a type of “barrier” [35]. The NDVI index [47] was adopted since it reflects the vegetation effects on the aerial dispersion of contaminants. It consists of a vegetation index that makes it possible to identify, classify and estimate the presence of vegetation/biomass at a study site [48,49]. In this study, the NDVI was estimated from the satellite image and the algorithm Raster Calculator (Equation (1)) was applied to the bands B4 and B8. The resulting map varies from 1 to −1. Values closer to 1 indicate that the vegetation is healthy, values close to 0 indicate that there is no presence of vegetation, and values close to −1, correspond to water bodies.
NDVI = (NIR − RED)/(NIR + RED)
where NIR is the B8 band and RED is the B4 of the Sentinel-2 image.
In the NDVI map, the residential and industrial areas were highlighted in neutral tones and the vegetation areas were in green color. Areas with higher vegetation density were highlighted in dark green color (Figure 5).

2.4. Susceptibility Analysis

2.4.1. Analytical Hierarchy Process (AHP)

In order to identify potentially contaminated zones through multiple pathways such as gravity, wind, and water, MCDM approaches can be considered. AHP is one of the best-known MCDM methods used to derive ratio scales from paired comparisons [50]. It is used to identify a decision problem, decompounding it into a hierarchy or a network structure to represent that problem and into pairwise comparisons to establish relations within the structure [50,51,52]. AHP assumes that criteria/alternatives are independent of one another. There are several types of dependencies including partial/all inner dependence among criteria/alternatives and partial/all outer dependence among criteria/alternatives. The correlation between two layers is a measure of dependency between the layers [53]. It is the ratio of the covariance between the two layers divided by the product of their standard deviations. In this study, the criteria chosen are independent of one another. Since the decisions are performed by the user, fuzziness and uncertainty are considered, and for that reason, AHP is usually combined with other methods [13]. AHP is based on: (i) the decomposition in different hierarchical levels; (ii) the pairwise comparison of the factors, where the user establishes priorities for the main criteria judging them in pairs for their relative importance; and (iii) the logical consistency is determined and if it is higher than 10%, the pairwise classifications must be revised until the consistency index is below 10% [50]. The relationship between different factors is based on a numerical value (Table 4).
According to Saaty [50], the Consistency Ratio (CR) is computed to describe the quality of the judgments (Equation (2)).
CR = CI/RI
where CI corresponds to the Consistency Index (CI), computed through Equation (3), and RI corresponds to the Random Index (RI), a tabulated value that depends on the order of the matrix presented in Table 5 [50].
CI = (λmax − n)/(n − 1)
where λmax corresponds to the maximum eigenvalue of the matrix and n corresponds to the order of the matrix.
In this study, the parameter weights were determined based on pairwise comparisons using the AHP process. Five parameters were considered in the mine contamination susceptibility modeling: (i) the waste pile, (ii) runoff areas, (iii) downstream drainage, (iv) the distance from the waste pile, and (v) the NDVI index.
Within the approach used in this study, the comparison of the contributions of each parameter was determined by an expert-based pairwise comparison matrix considering the previous knowledge of the study area, the availability of the data, and the experience of the researchers.
The pairwise comparisons decision matrix and the output parameter weights were based on the previous knowledge and perception of the existent contamination of soils and waters [20,27,41,43]. The most relevant parameter, with a higher contribution, was the waste pile areas as it is considered a primary source of contamination, followed by the runoff area and drainage network. These factors were considered as having higher significance, since the waste pile and the underground mining drainage galleries had been previously identified as the coal mine main contamination sources, concentrating multiple PTES and PAHs [20,41,43], that can be disseminated to the surrounding environment. It was considered that waste pile in pairwise comparison should present a higher rank since it represents a broader area of contaminants concentration subject to the atmospheric agents. Successive soil campaigns conducted in the end of rainy and dry season, on the surroundings of the mine, allowed us to understand the dispersion dynamics, pointing out that main transport of contaminants from the waste pile to surrounding soils in this area occurs under influence of water and surface drainage [20,41]. Therefore, in this model, the higher weights after the waste pile (where the pollutants are mostly concentrated) were given to the runoff areas. Regarding the drainage network weighting, was taken to account the distance to the respective contamination sources as well as the dilution effects caused by tributary water courses. In our case, the wind dispersion represents only a minor role on pollutants spreading. Very scarce particulate matter as fly ashes and rare magnetic spherules were found along the dominant wind direction. Aerial dispersion of contaminants from the studied waste pile does not seem as significant as water transportation, as from a first soil geochemical campaign, conducted at the end of the rainy season, to the second campaign, at the end of the dry season, there was a generalized trend for soils surrounding the waste pile to maintain or moderately reduce the concentrations of trace elements [20]. For this reason, lower weights were assigned to the waste pile Euclidean distance and to the NDVI index, which represent the contaminants dispersion by the winds and the presence of physical barriers to this dissemination as vegetation.

2.4.2. Fuzzy Logic AHP

Fuzzy membership has also been used for susceptibility estimations [13,14,15,54]. Fuzzy membership values reflect not only the relevance of each factor, but also the relative importance of each subgroup of each factor [55]. Fuzzy was introduced by Zadeh [56] and consists of a logic that all objects are considered as elements in a set where each element takes a value from 0 to 1. Several studies applied this method combined with AHP to improve the accuracy to produce susceptibility maps [13,14]. In this study, besides the AHP method, the fuzzy logic combined with AHP was used to compare and evaluate the most adequate method to generate the contamination susceptibility map. In this study, the fuzzy small algorithm (Fuzzify raster (small membership) from Raster Analysis (in QGIS software)) was used to transform input raster values to fuzzy membership values, where larger input values indicate a lower risk of contamination [35].

2.4.3. Weighted Overlay Method (WOM)

To combine the five parameters involved in the susceptibility map, the WOM was used [52]. The WOM was applied using the QGIS software to assign the ratings to each parameter and finally to sum all the parameters multiplied by the respective weights, providing the final susceptibility map (Equation (4)).
SM   =     Xi × Wi
where, SM corresponds to the final susceptibility map (SM), Xi corresponds to each parameter map associated with the respective rankings and Wi corresponds to the weight of the parameter. The rankings and weights were determined using the AHP method and the Fuzzy AHP.

2.5. Model Evaluation and Validation

The evaluation of the predictive performance of the final susceptibility map obtained with AHP and Fuzzy AHP modeling was achieved through the receiver operating characteristic (ROC) value and the area under the ROC curve (AUC) score [57], both implemented in Python programming language using the scikit-learn library. The ROC curve is a graphic tool that allows the performance of binary discrimination as a certain threshold (the susceptibility score in this case) to be varied. It consists of a plot of the true positive rate (TPR) or sensitivity vs. the false positive rate (FPR), i.e., the fraction of false positives out of all negative samples (1-specificity). The ideal ROC curve should be close to the top left of the plot. A better way to evaluate the ROC curve and model performance is to compute the AUC score, which ranges from 0.5 to 1 for a good fit, while values below 0.5 represent random guesses [57].
As aforementioned, data from previous soil sampling campaign performed in the surroundings of the São Pedro da Cova waste pile were used for validation purposes; one sample was recognized as having moderate ecological risk and four samples were trending toward moderate risk, according to Potential Ecological Risk Index [58]. These five samples for the validation process should represent “true positive” values (value 1). To complement the validation dataset, 15 random samples were selected over the final susceptibility map to represent “false positive” values (value 0) (Figure 6. This random sampling approach in areas where only true instances are known is fairly common in various applications from landslide susceptibility to mineral potential mapping [18,59]. The random samples were generated through Create Random Points algorithm from the System for Automated Geoscientific Analyses (SAGA) software.
To validate the susceptibility maps, the land cover map, estimated from two techniques (unsupervised image classification and using the Portugal official land cover map) was analyzed. Image classification is used to extract classes of information from remote sensing images [60]. Remote sensing data can be processed to obtain LULC using different approaches. All targets have their own spectral response and satellite sensors record the pixel value, enabling the data to be processed to understand the elements that make up its surface [61]. In this study, the LULC was analyzed using different band compositions of Sentinel-2B using ArcGIS Pro software [40]. The Classification Wizard tool available in ArcGIS software was used, considering the ISO Cluster classifier, which performs an unsupervised classification using the K-means method. In this case the bands B4, B3, B2 and B8 (RGB + NIR) were used. Land Use Land Cover (LULC) corresponds to physical material contained on the Earth’s surface and describes human activities [62]. With a map of LULC it is possible to understand the local dynamics, study phenomena and propose public policies [63,64,65]. The classifier was able to separate the data concerning anthropically altered areas from those with the presence of vegetation or exposed soil. Even so, the ability to segregate the classes was not so efficient when dealing with the streets and areas of mixture between vegetation and exposed soil, which can be better observed in the RGB maps and in the false color composition.
In Portugal, the official soil occupation chart is developed by Direção Geral do Território (DGT). In 2021, the COSSim, an experimental product, was created to provide complementary information to the DGT Land Use and Occupation Chart (COS), with a production frequency and annual update, in raster format and with a spatial resolution of 10 m (https://www.dgterritorio.gov.pt/Carta-de-Ocupacao-do-Solo-Simplificada-de-2021, accessed on 20 June 2022). It is produced through space technologies and Artificial Intelligence (AI), which includes machine learning algorithms and expert knowledge rules to classify multispectral and intra-annual series of Sentinel-2 satellite optical image data [66]. In this work, LULC and COSSim were overlapped in order to identify if the susceptibility areas of contamination can interfere with surrounding houses, i.e., to identify how close the houses are to contaminated areas.

3. WebGIS Development

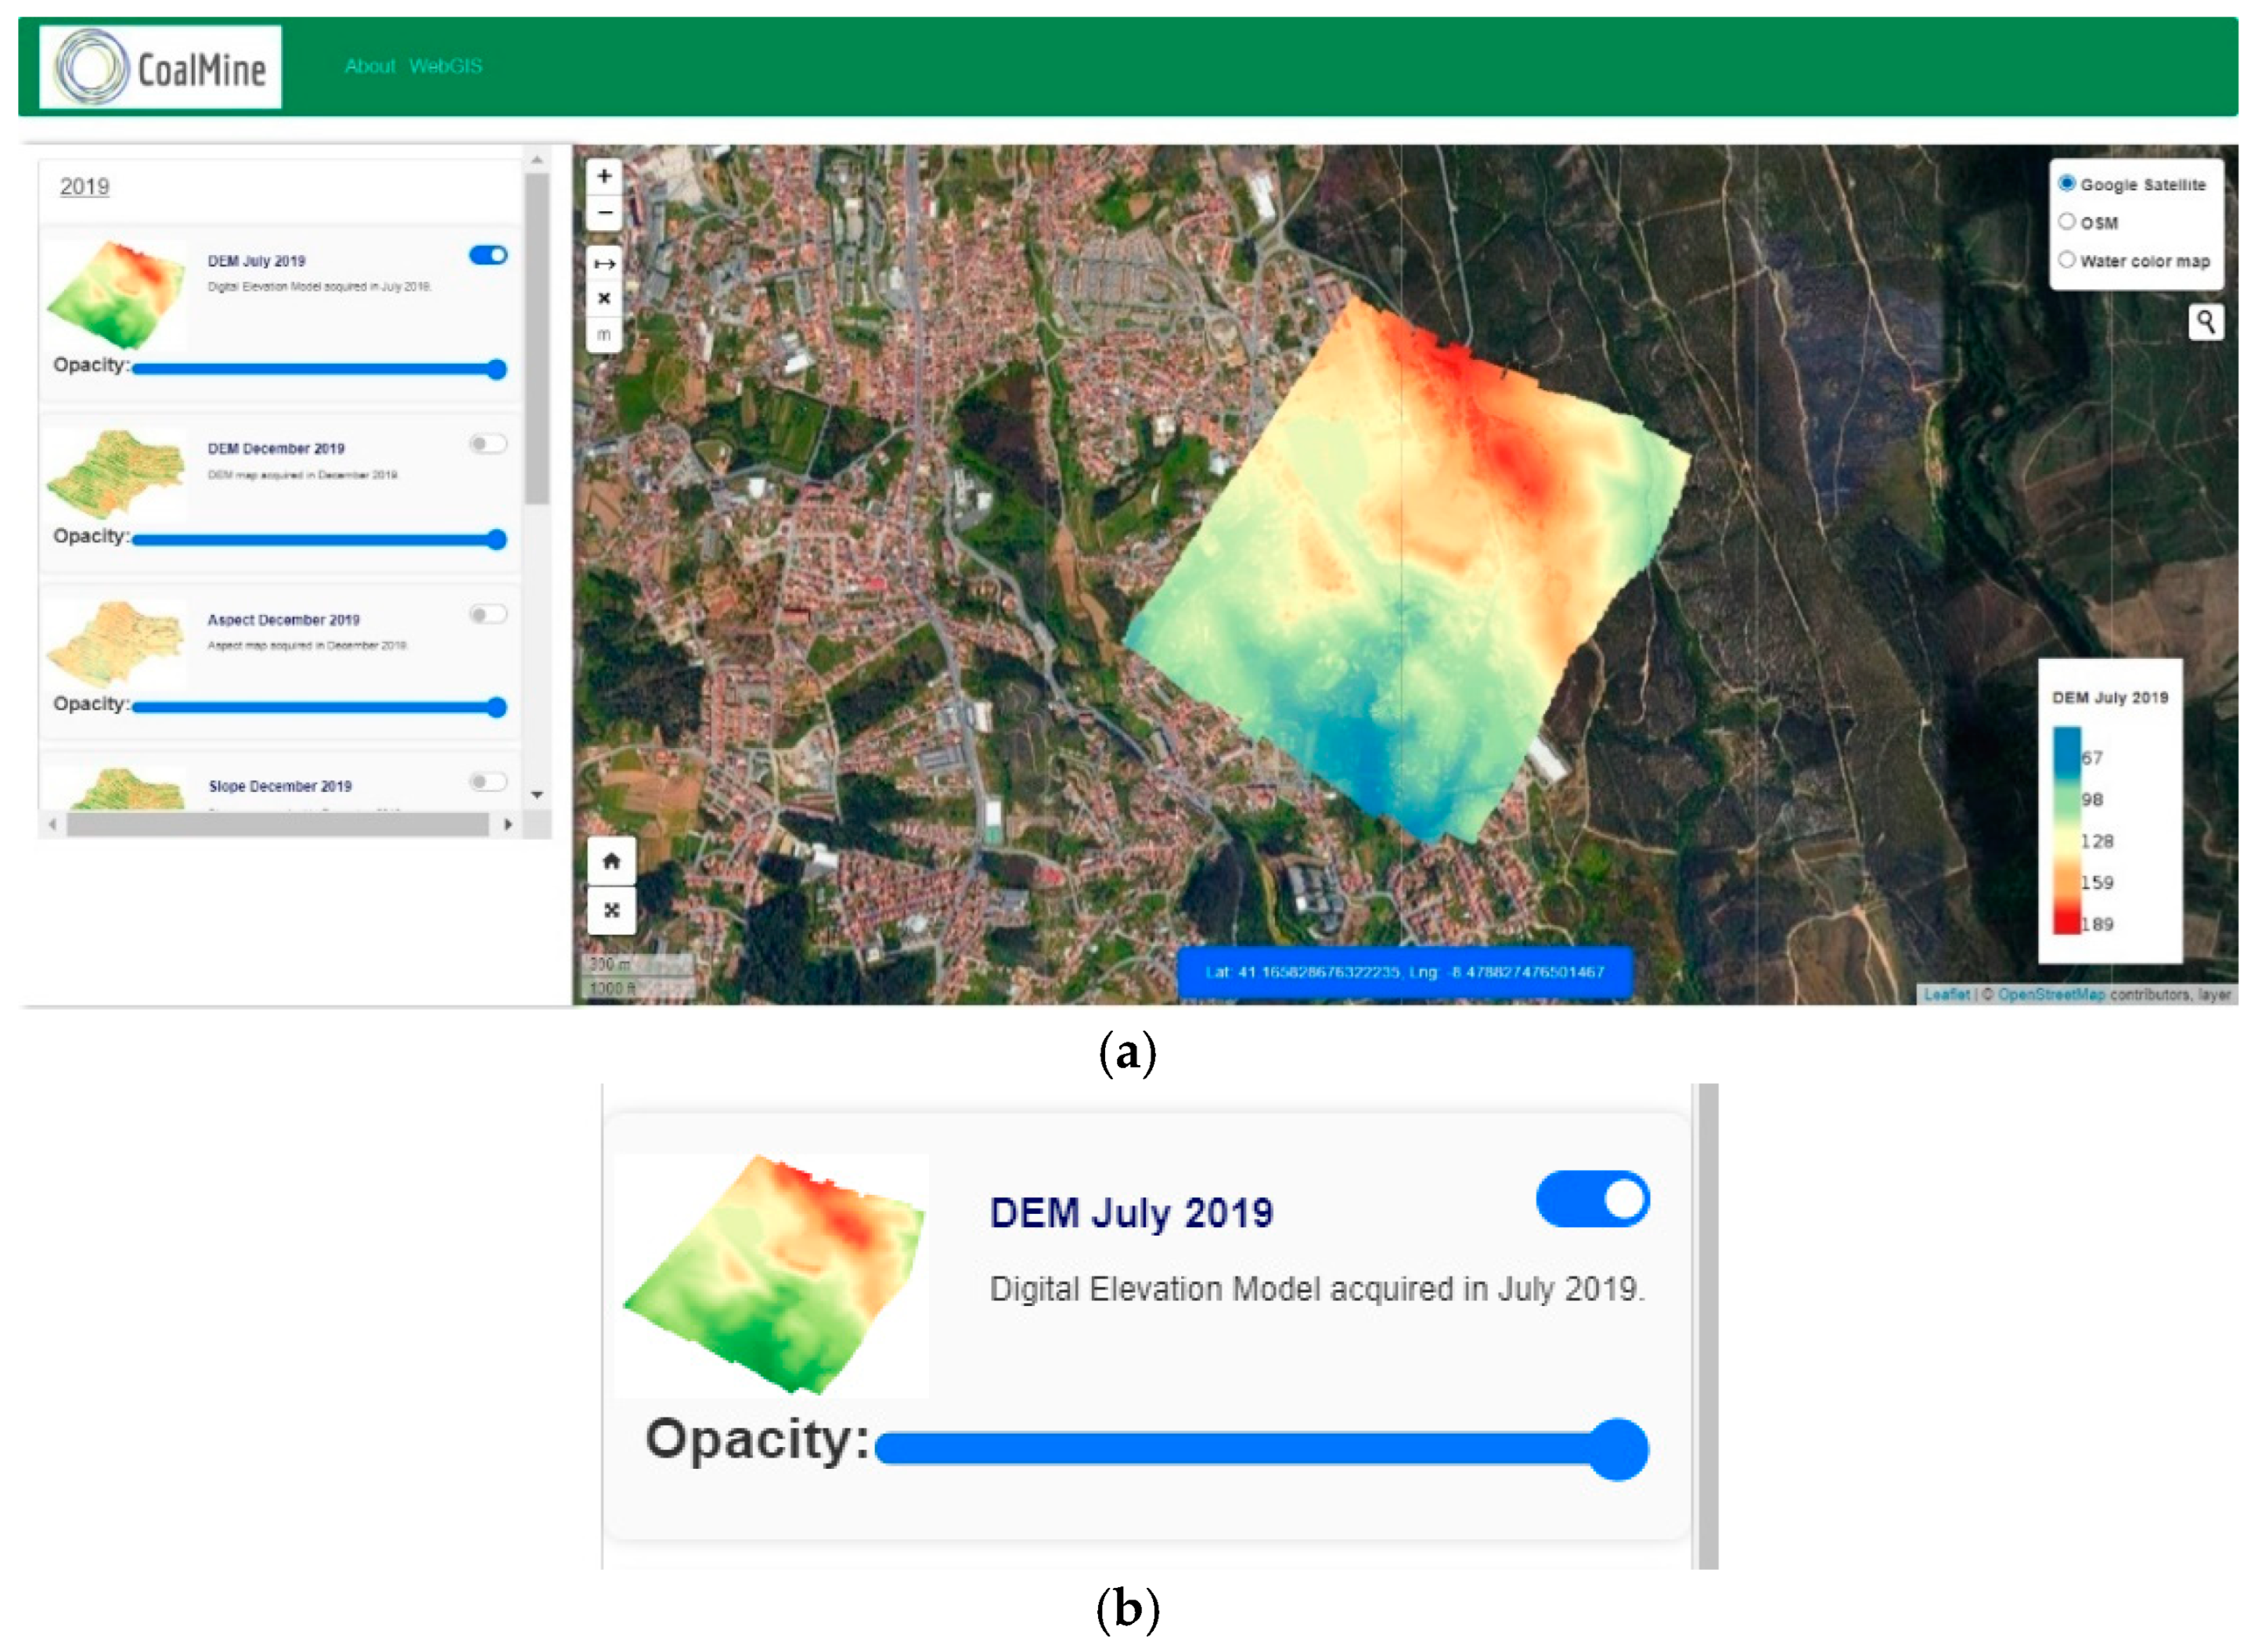
A webGIS application was developed in the context of the project of the São Pedro da Cova coal waste pile (Figure 7a; [20]). The webGIS is a user interaction interface that enables easy access and visualization of geographical data. The developed application was based on Python programming language and available to society from https://gis.up.pt/coalmine (accessed on 20 May 2022). In the frontend, an easy and intuitive graphic interface was created to configure the design of the application. For this, Hyper Text Markup Language (HTML), Cascading Style Sheets (CSS) and JavaScript were used. Bootstrap, a powerful, extensible, and feature-packed frontend toolkit, was also used (https://getbootstrap.com/, accessed on 30 May 2022) to create buttons, action widgets, among others. As the backend, the database was configured using the PostGIS database, an open-source database that is an extension of the PostgreSQL database [67]. A server was also used in this study, the Geoserver, an open-source server for sharing geospatial data (https://geoserver.org/, accessed on 30 January 2022). All the data were hosted in the PostGIS database and connected to Geoserver. Several standard functionalities were implemented: (i) zoom in/out; (ii) measure buttons (m, km, mi); (iii) selection of three different base maps (Google Satellite, Open Street Map (OSM) and Water Color Map) in a radio button; (iv) search button for a specific location; (v) the presentation of the geographical coordinates of the position of the cursor; (vi) a home button to zoom to the layers of the project; (vii) the full-screen view, which extends the canvas to all the screen; (viii) the scale according to the zoom; (ix) a collapsible navigation bar composed of two links (About and WebGIS) that allows changing the pages between information about the project (About) and the webGIS application; and (x) a panel group with scroll action composed by collapsed headings with the years of the project (2019, 2020 and 2021), besides the water and soil samples. In this panel group, when the user clicks on a year, a set of maps appears defined in cards. These cards are composed of the title of the map, the description of the map, an illustrative image, and two horizontal sliders: the top small slider allows us to turn on/off the map on the canvas and the bottom slider (Opacity) allows applying transparency to the map, giving the possibility to overlap raster files with different information (Figure 7b).
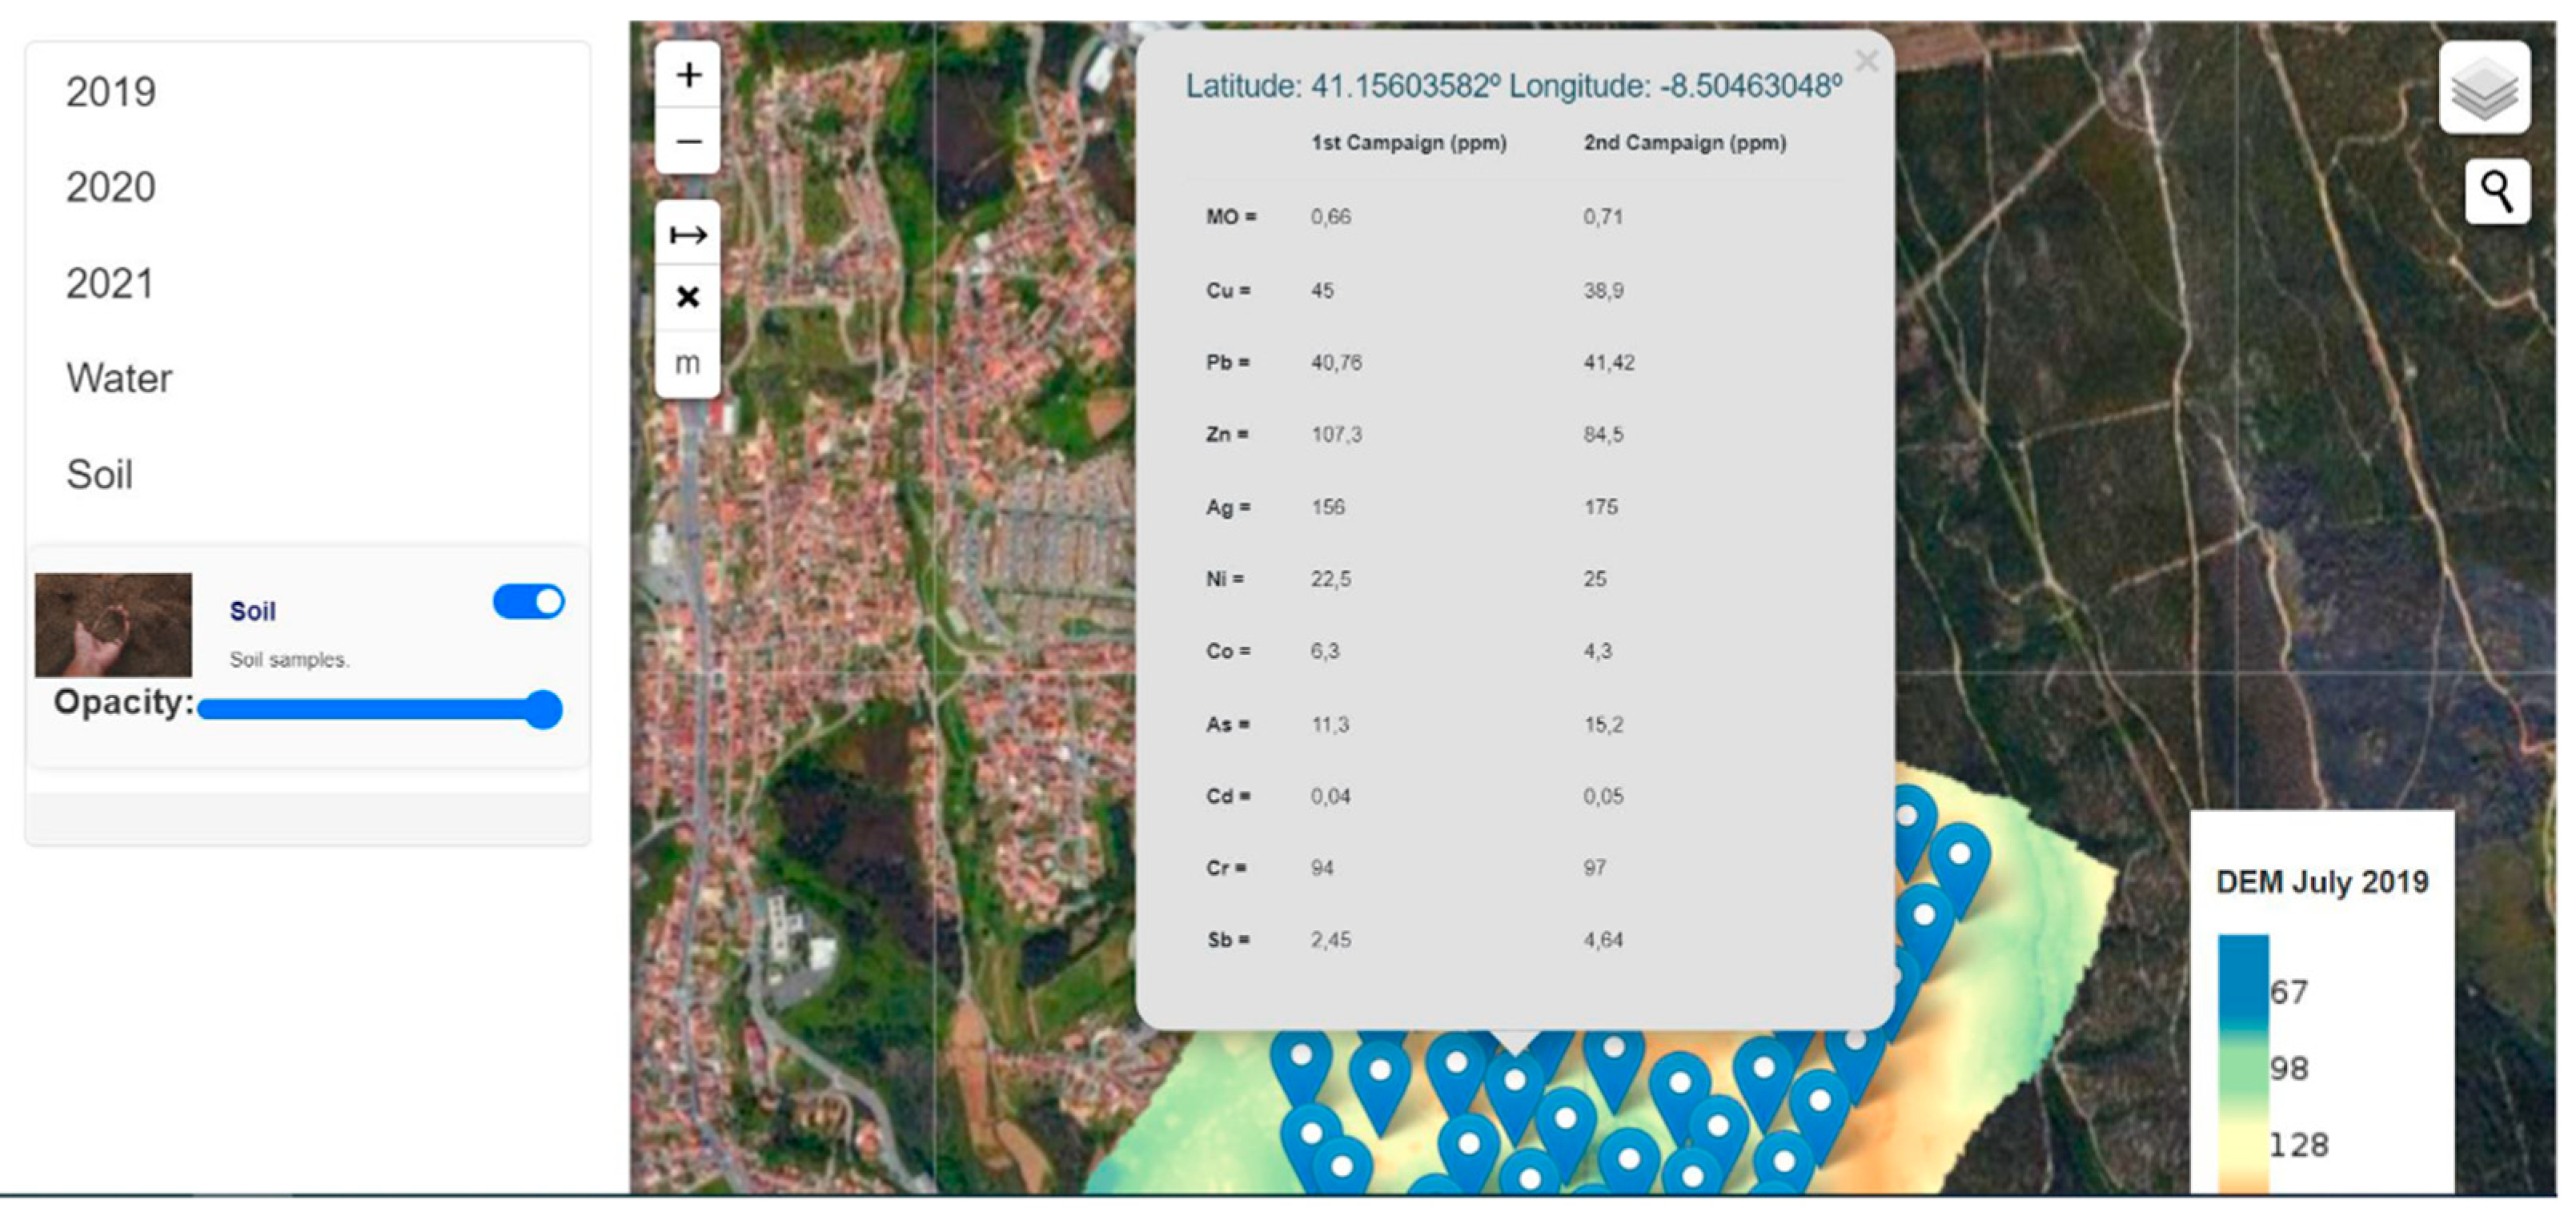
The maps were generated in raster format, except for water and soil samples, which were created in vector format (points). In these two layers, an additional functionality was applied. At each point, when clicked by the user, a table appears with the information on the hydrogeochemical and soil characterization [20], along with the geographical coordinates of each point (Figure 8). In the future, the webGIS will be continuously maintained and updated when new data are collected. In the About link, all the information about the data and procedures, as well as the contacts, are provided.

4. Results and Discussion

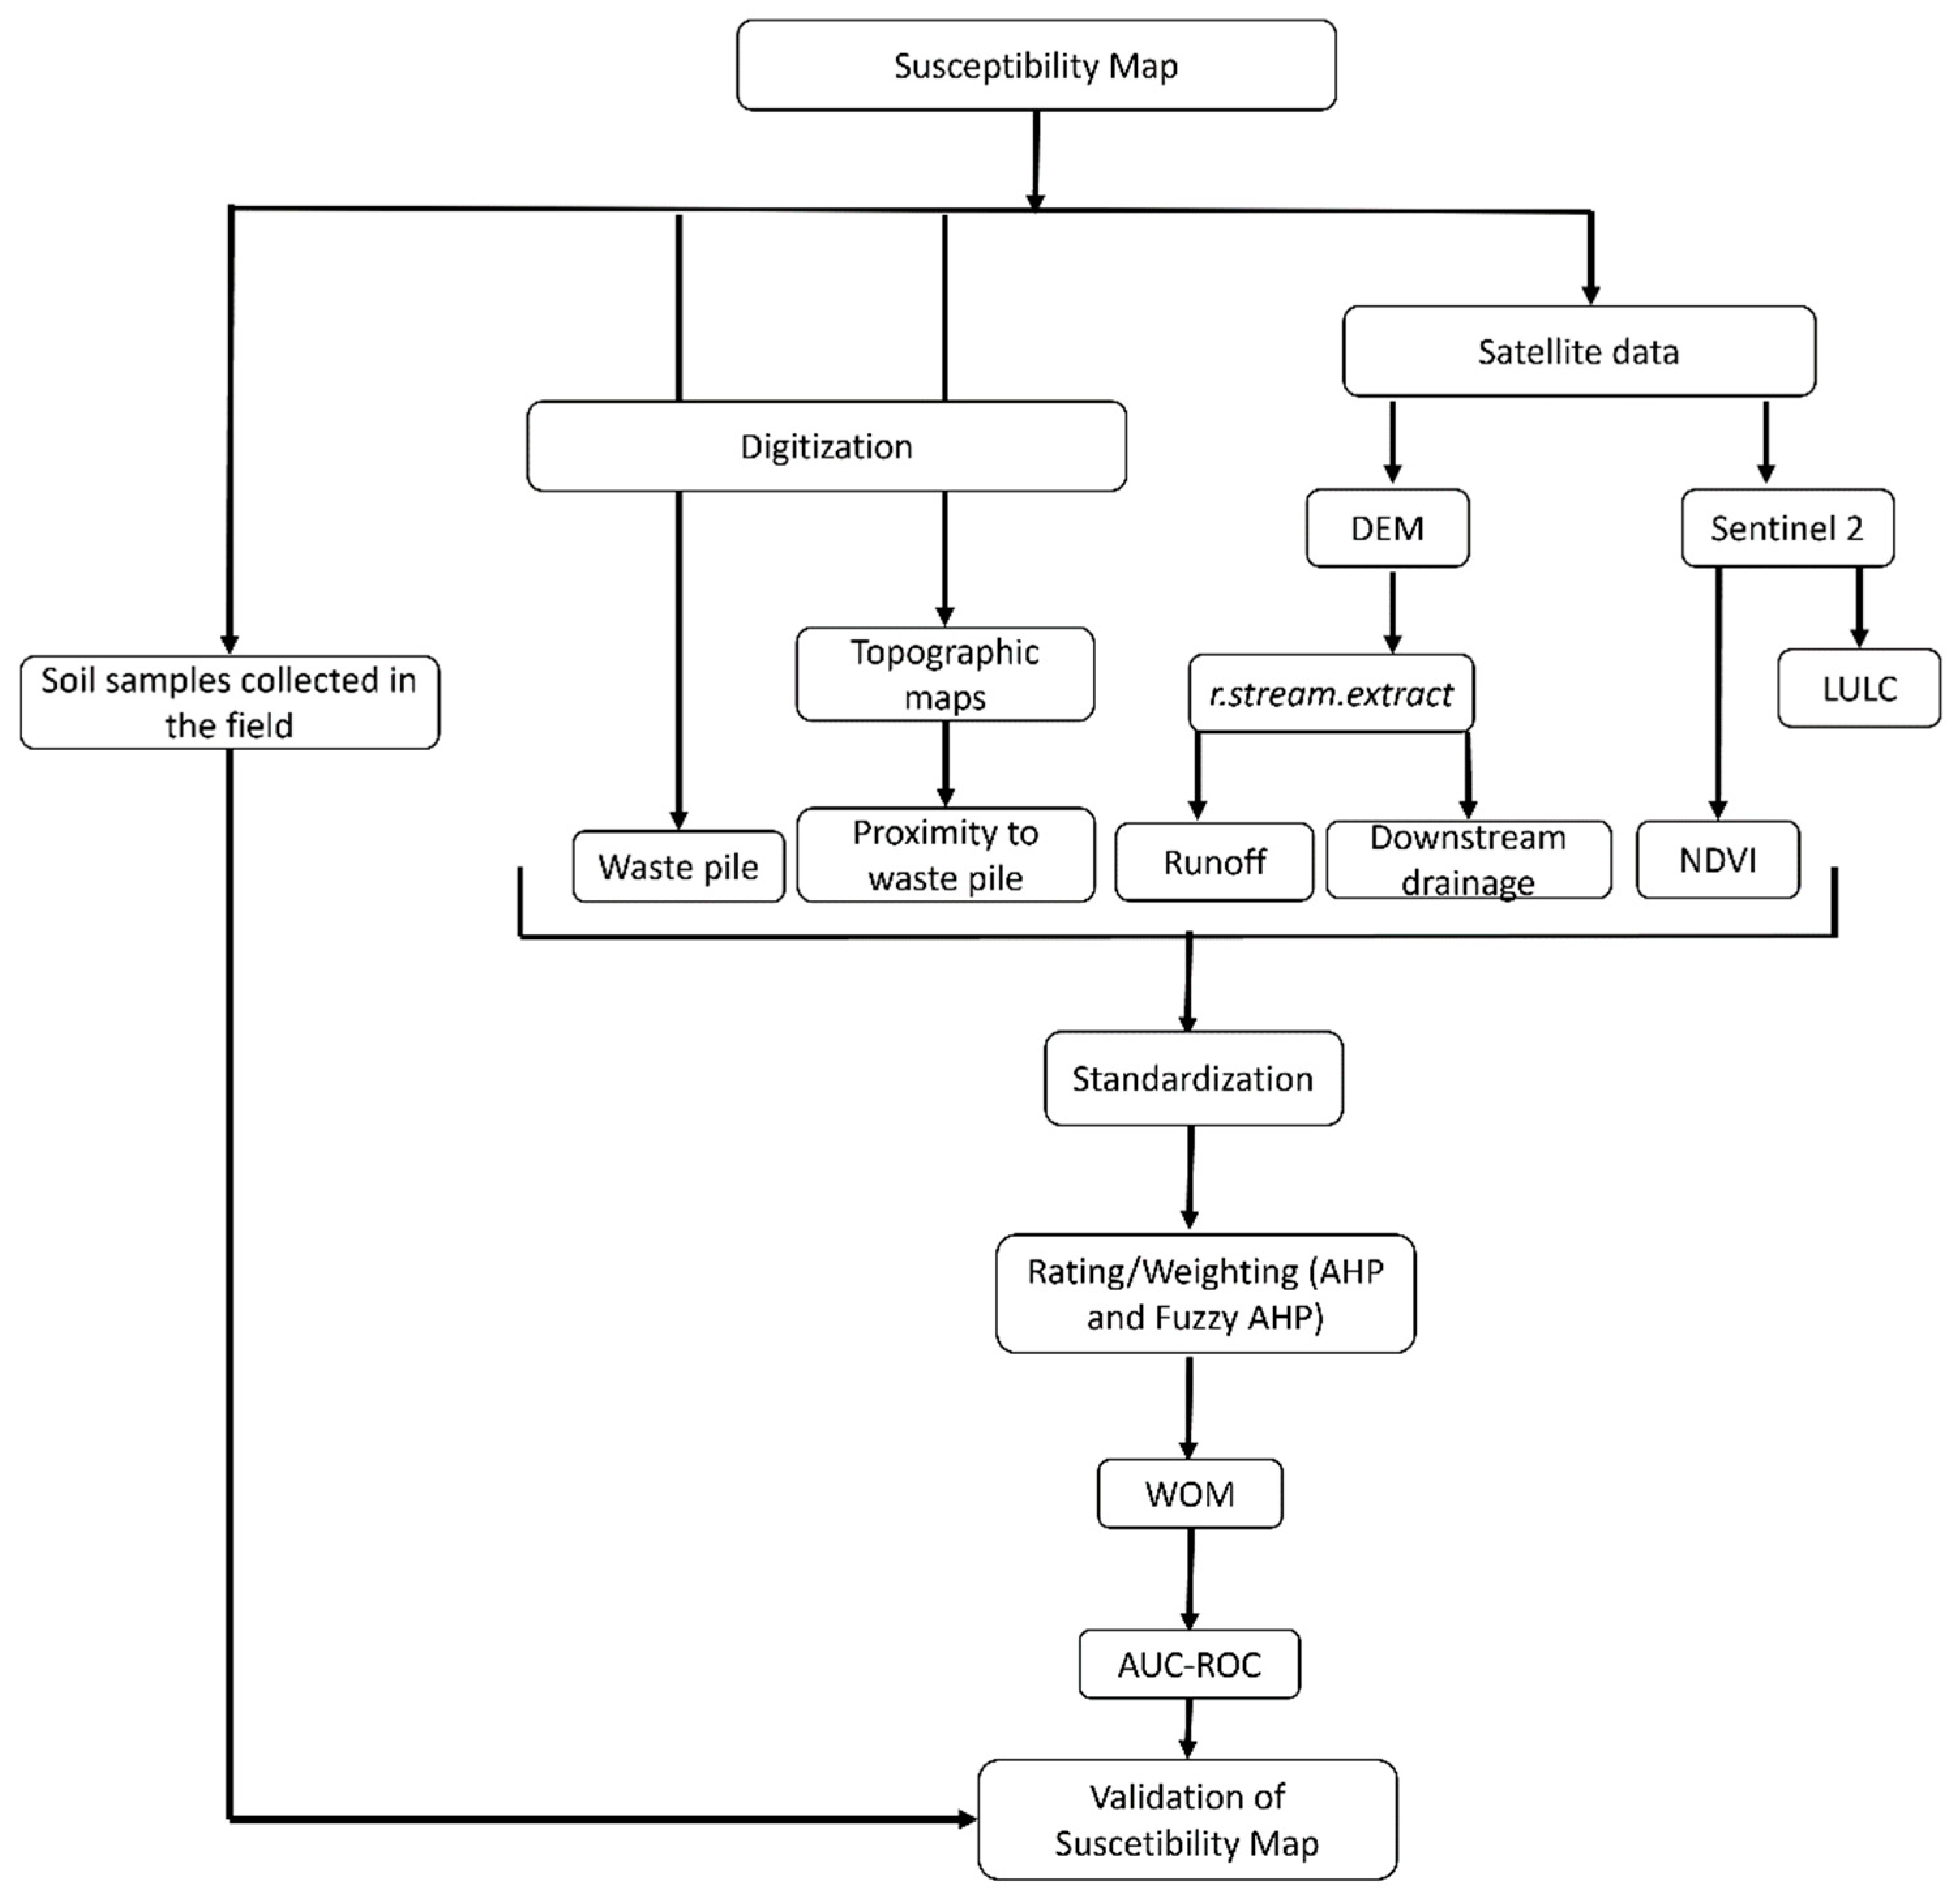
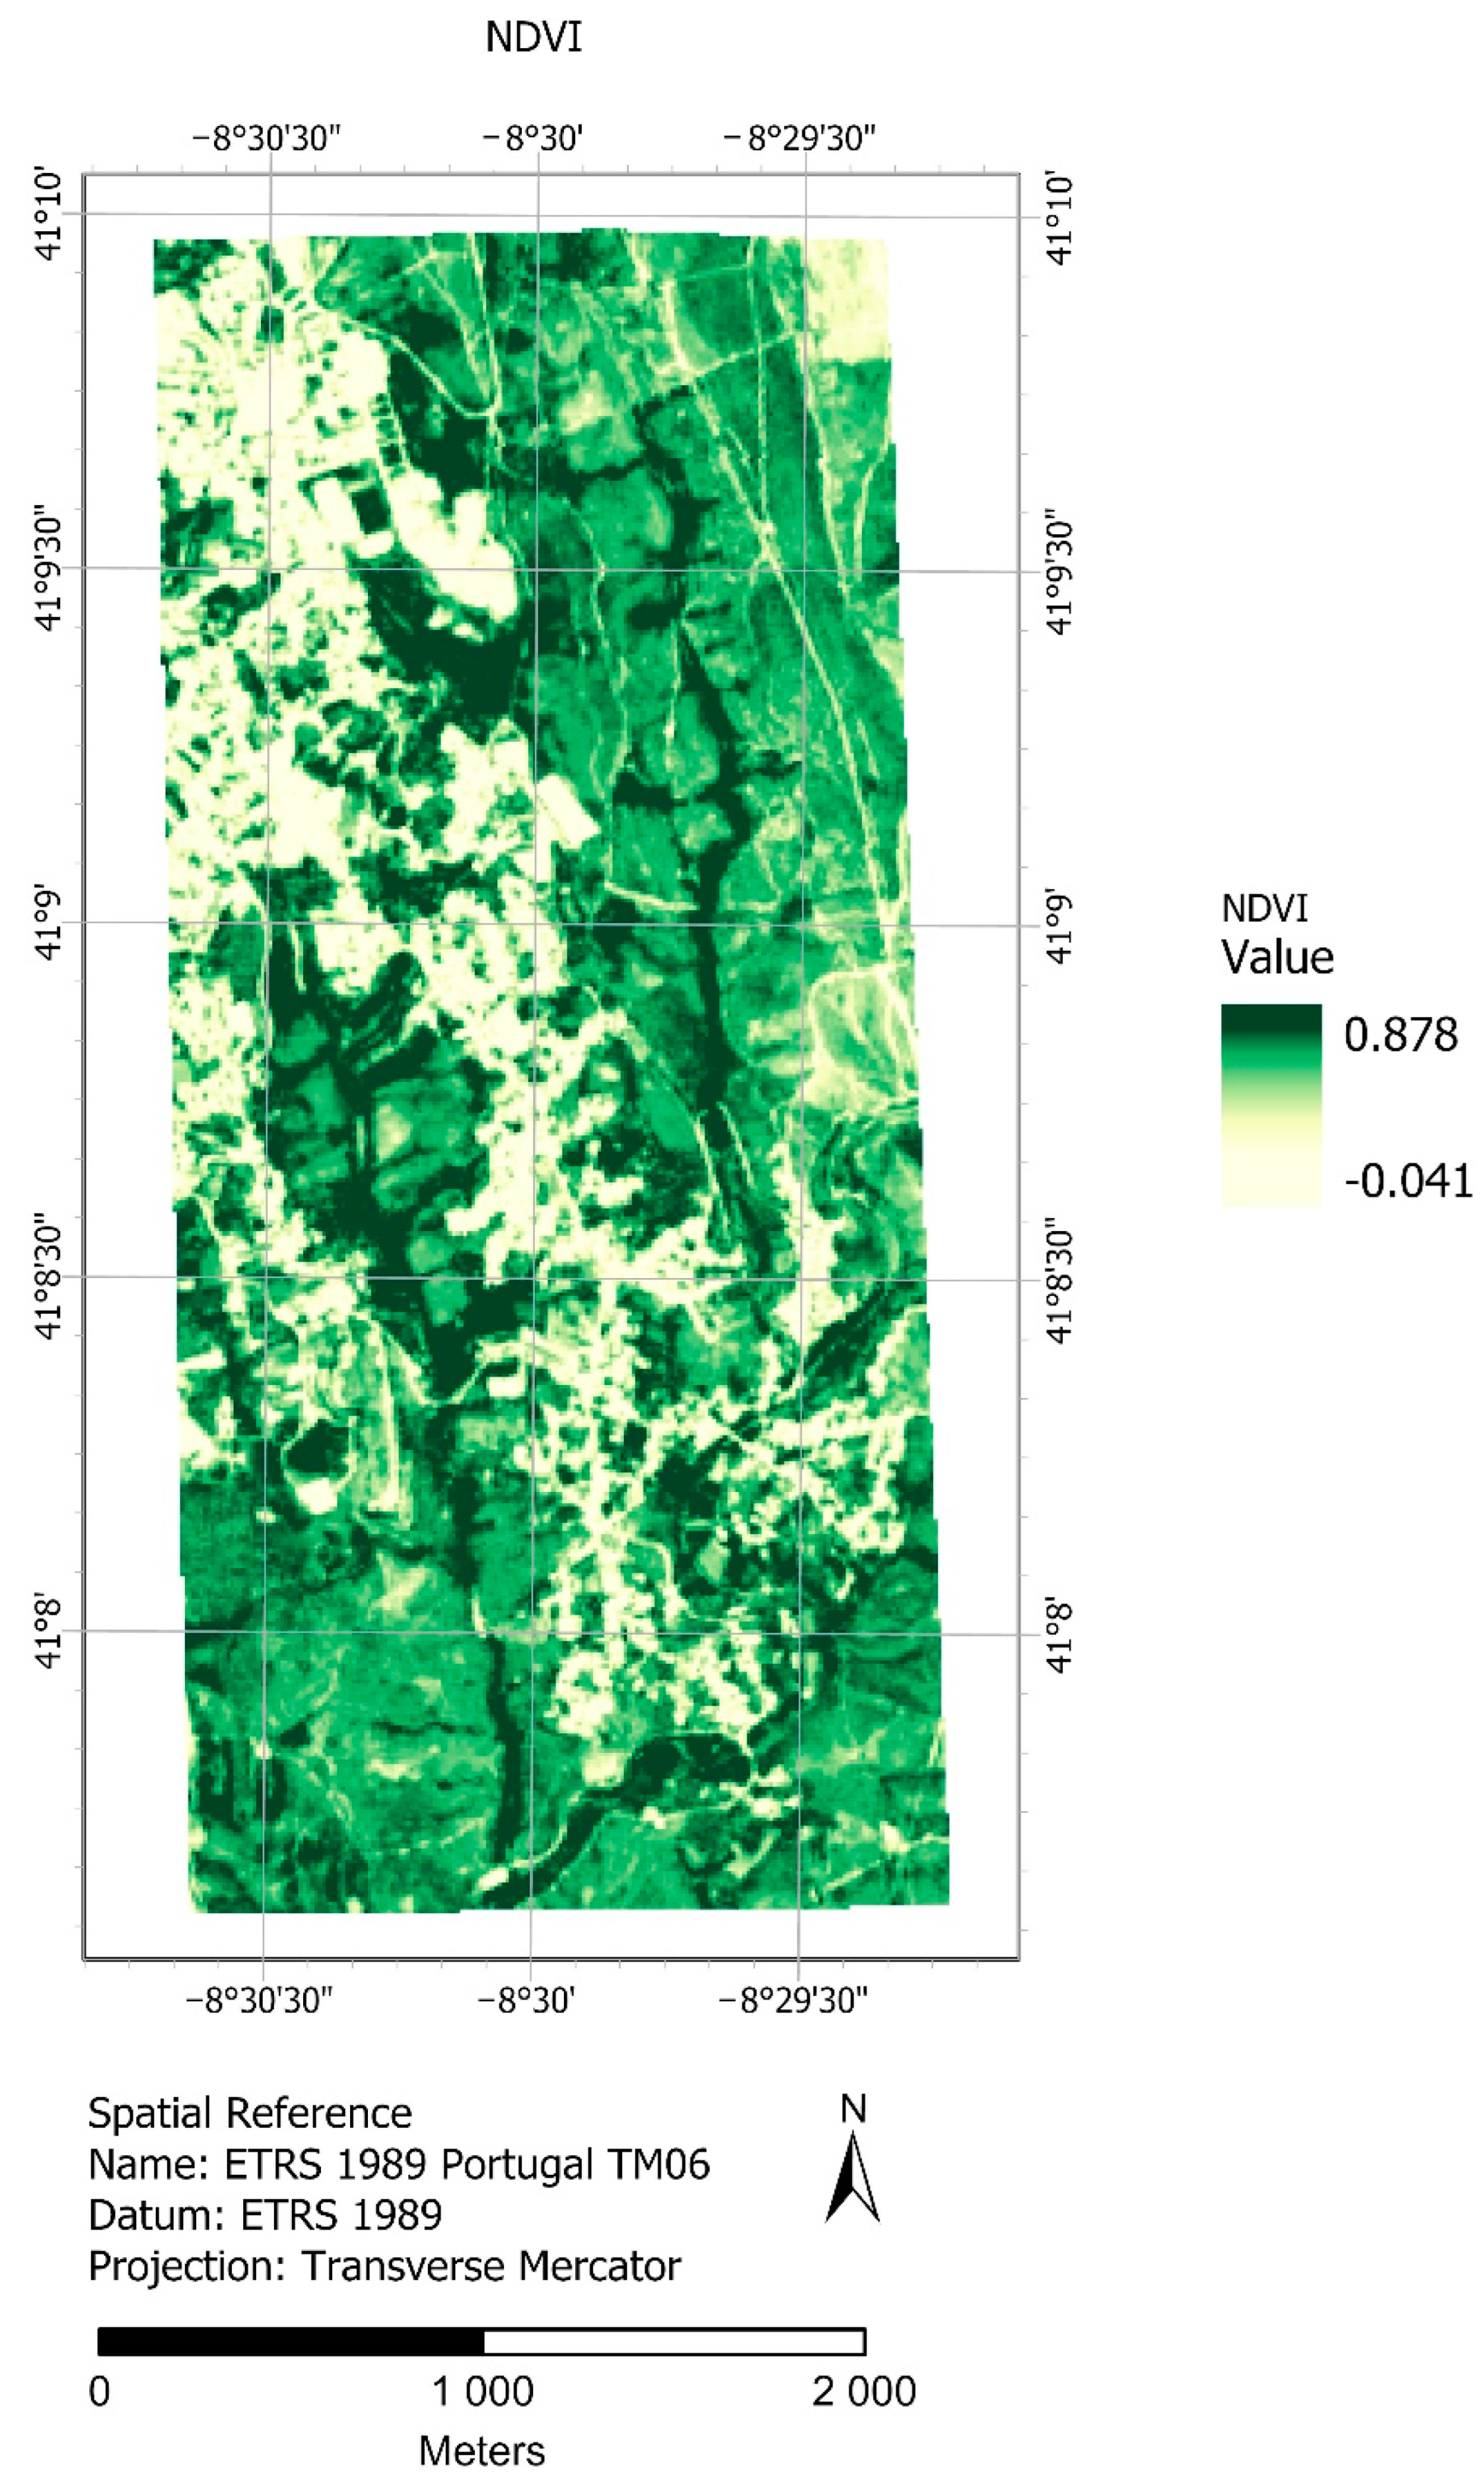
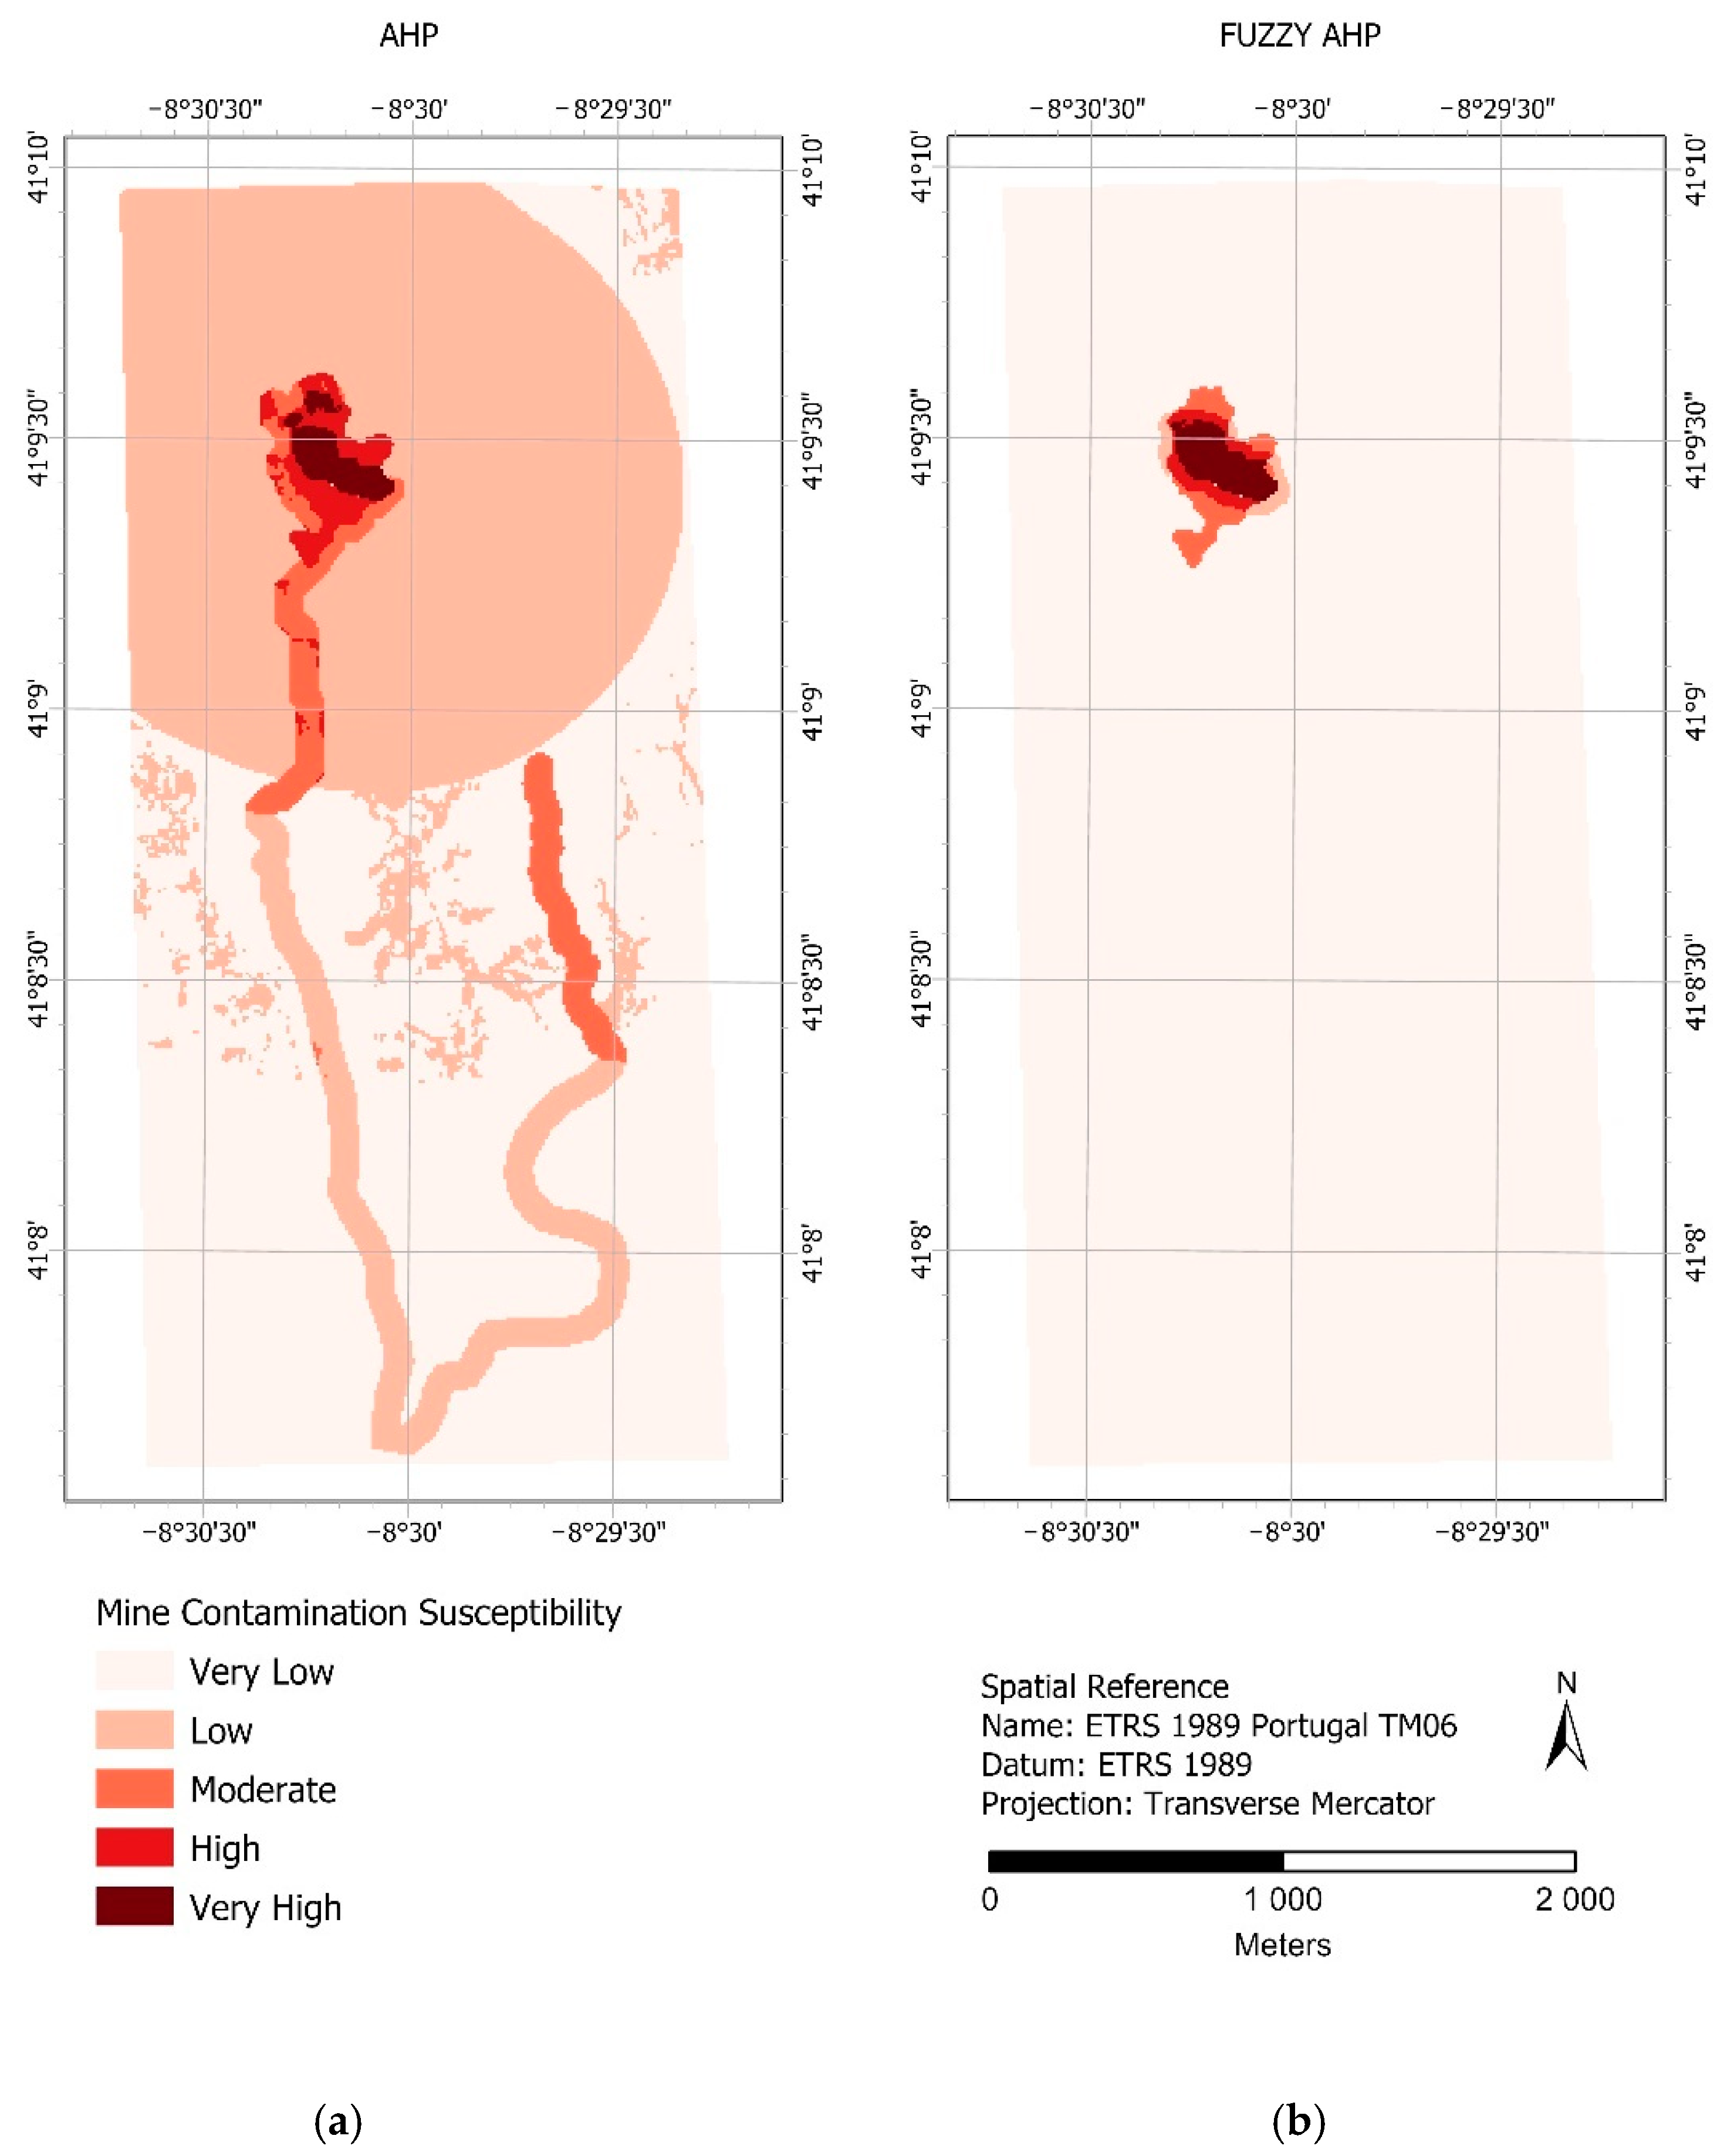
As previously mentioned, the evaluation of the contamination that affects the surrounding areas of São Pedro da Cova’s self-burning coal waste pile considered five parameters: (i) the waste pile, (ii) runoff areas, (iii) downstream drainage, (iv) the distance from the waste pile, and (v) the NDVI index. The factors were ranked and weighted based on their importance. The most important factors were the waste pile itself, the runoff, and the downstream drainage. The least important was the distance to the coal mine and the presence of vegetation. To produce the final susceptibility map, two methods were tested: the AHP method and the Fuzzy-AHP. The AHP method was applied through the pairwise comparison matrix (Table 6). The matrix was applied to assess the class ratings in each parameter and to estimate the final weights for each parameter. The values of the CR were less than 10%, which is in accordance with the consistency defined by the pairwise comparison [50]. To obtain the final susceptibility map (Figure 9a), the WOM method was used (Equation (3)) in GIS software (QGIS open-source software), where the assignment of the rankings was performed to each factor and then each of them was multiplied by the respective weight. The final susceptibility map values range from 0 to 1 and indicate an increasing degree of susceptibility.
In the second approach, the fuzzy logic technique, which has been widely used in environmental risk assessment [13,14], was applied to standardize the criteria layers. In this study, the fuzzy logic was applied to the distance to waste pile, NDVI map, and downstream drainage map. Areas near to the waste pile have a higher susceptibility to contamination, as well as the areas in the downstream drainage system near the waste pile. Otherwise, areas with low NDVI values have a higher susceptibility to contamination due to soil instability and wind transport of pollutants. Finally, to obtain the susceptibility map (Figure 9b), the WOM method was applied (Equation (3)). Values ranging from 0 to 1 were assigned, where areas with values close to 1 are more susceptible to contamination than areas with values close to 0. The final maps were divided into five classes using “Natural Breaks” method from ArcGIS software.
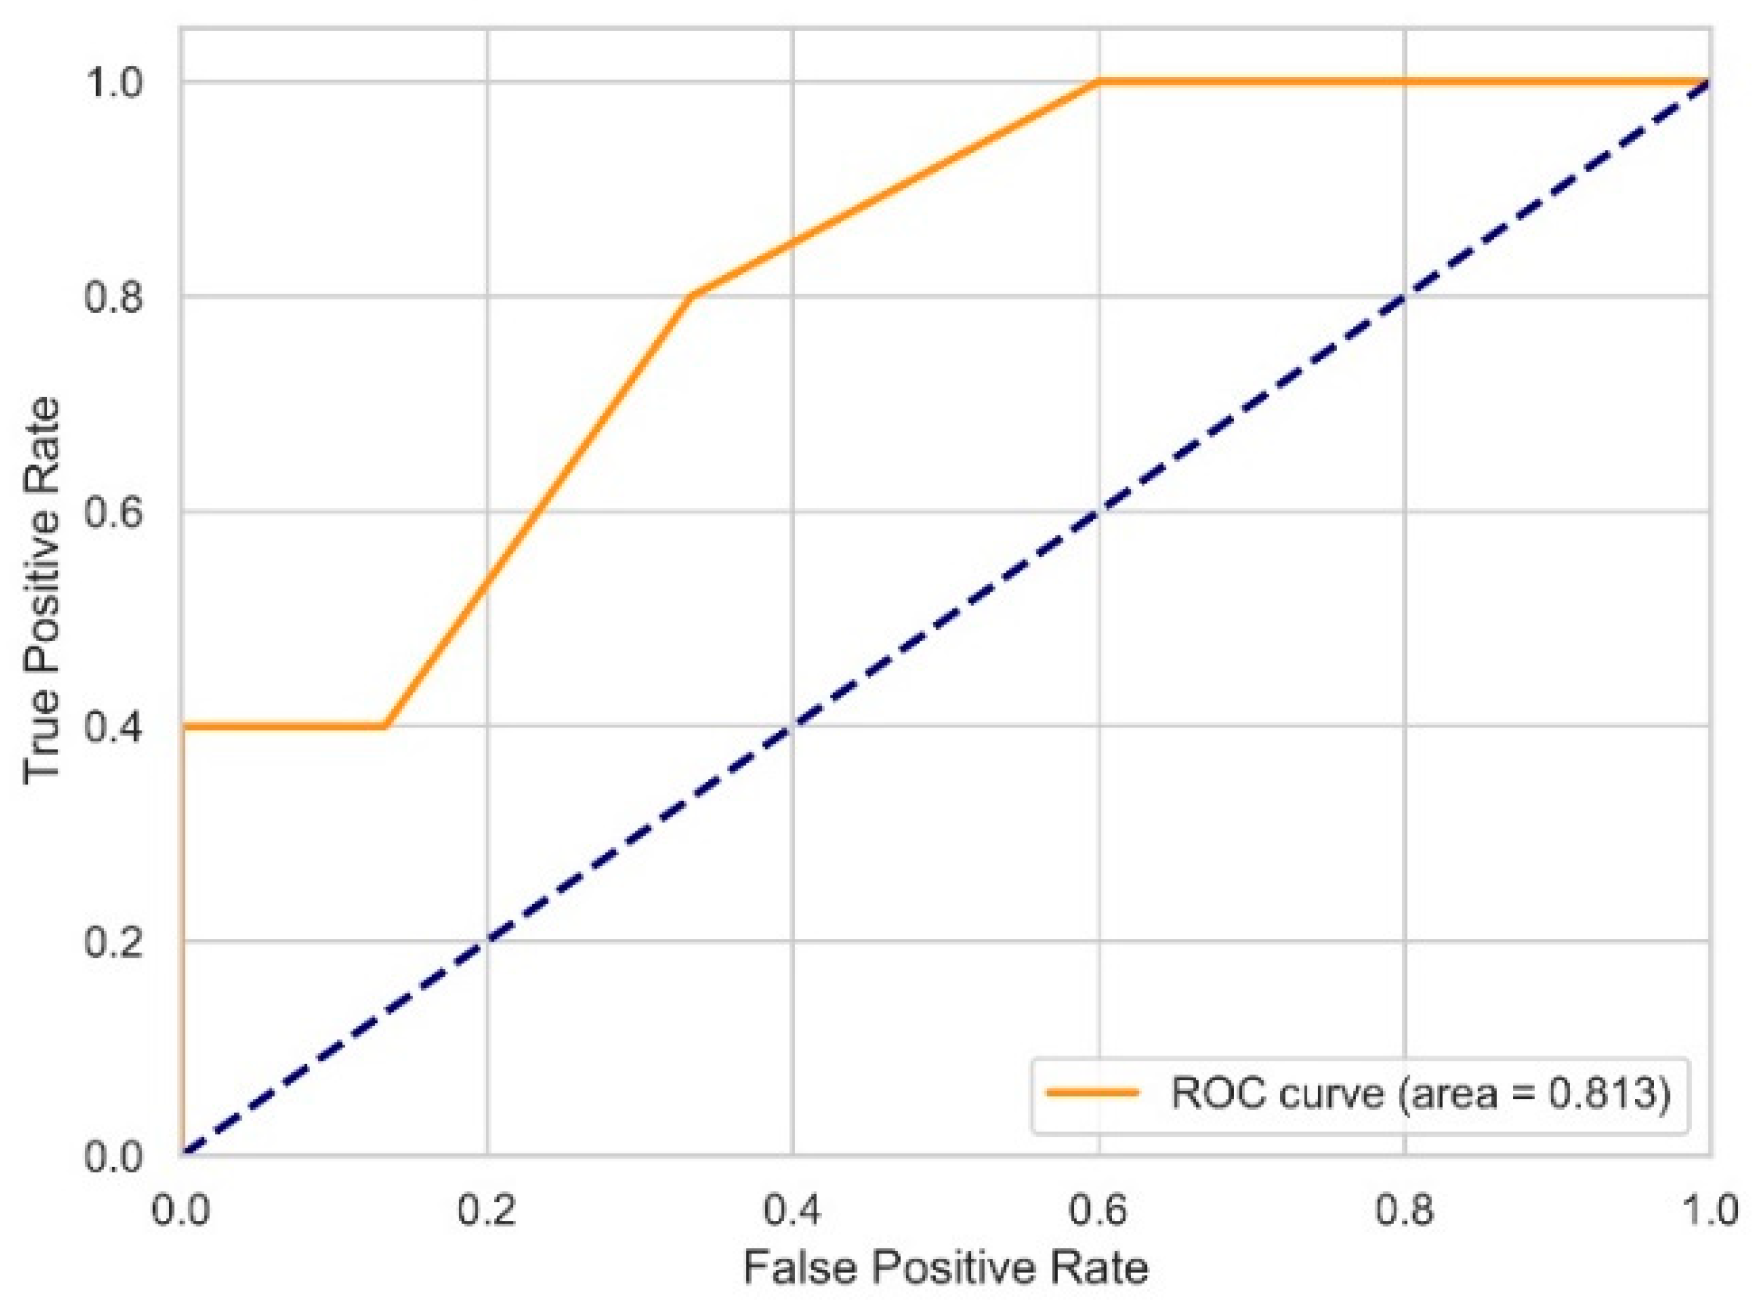
The evaluation of the results obtained was performed through the generation of the AUC curve, which is a statistical technique used by researchers to validate predictive results. As in Figure 10, the ROC curve is always above the reference line with the value of 0.5, with an AUC score of 0.813 indicating very good and accurate performance of the AHP approach. Fuzzy-AHP also indicates a very good value (0.800), despite the odd shape of the ROC curve. The obtained AUC scores indicate that the proposed models are suitable for susceptibility mapping.
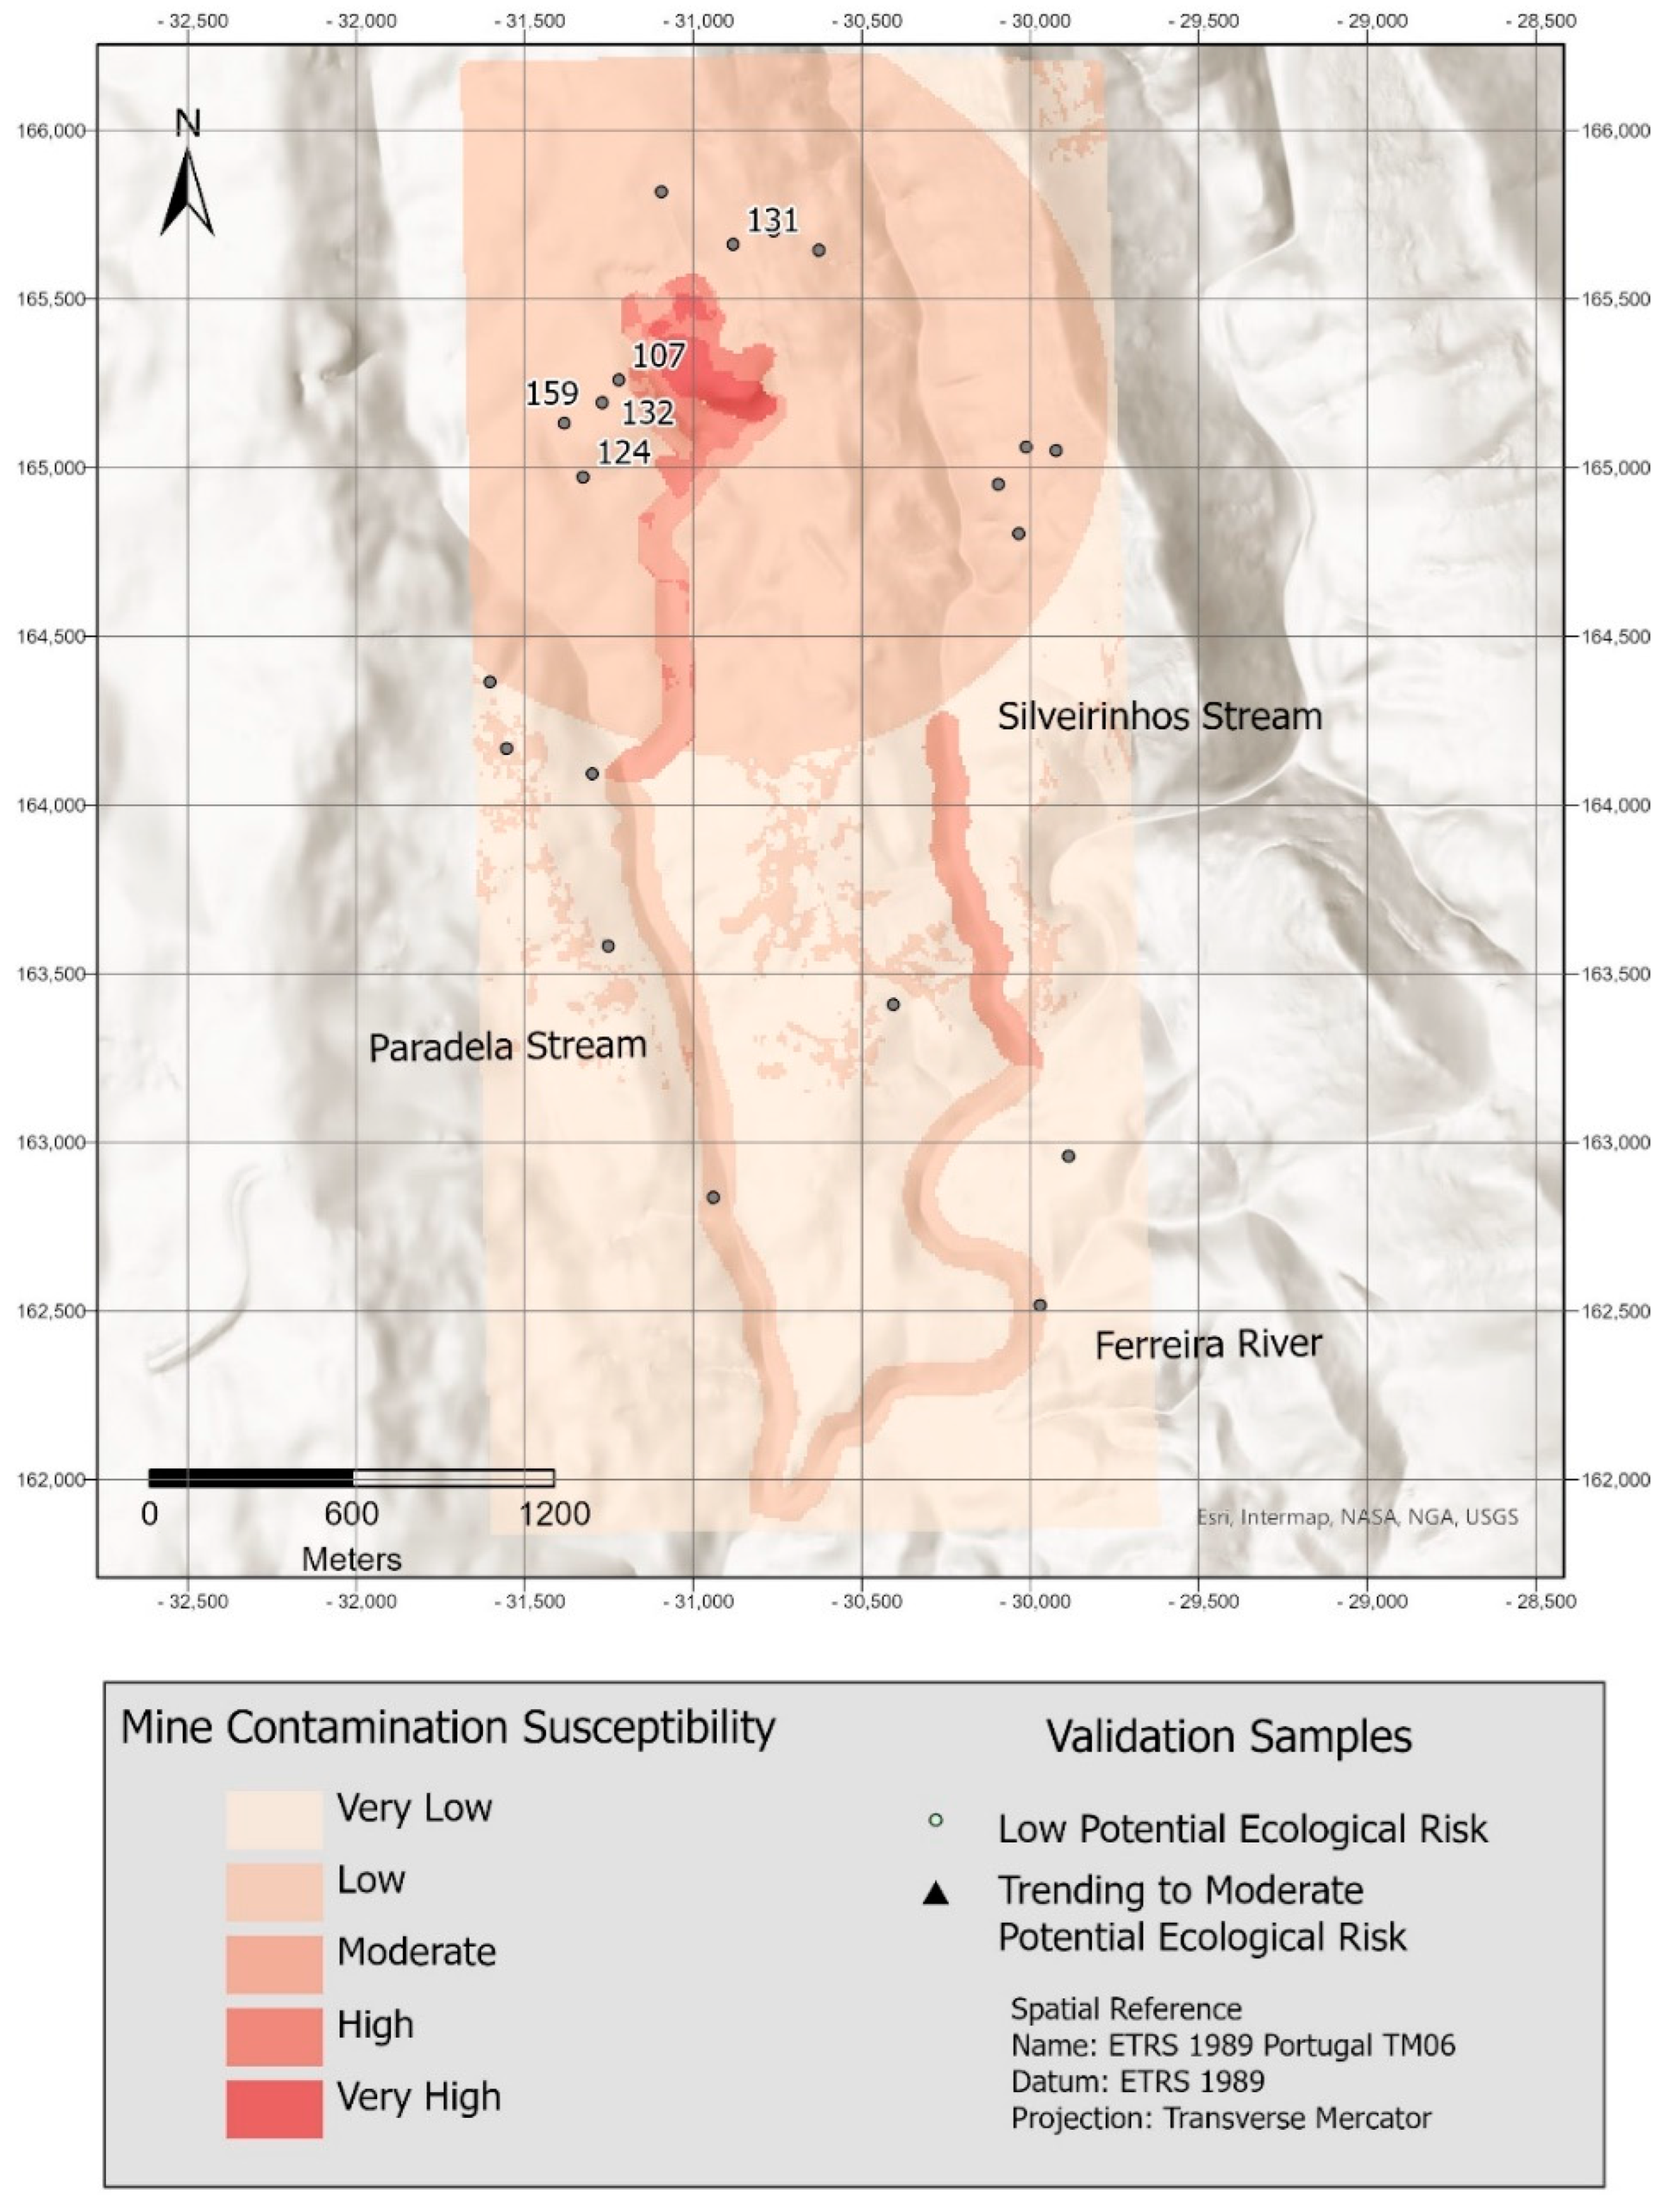
As expected, in both methods, the zones more susceptible to mine contamination were identified over the waste pile and in the immediate surrounding areas affected by the runoff. These areas were classified as presenting very high and high susceptibility to mine contamination and are mostly dominated by forest use and there is no urban overlap. The contamination susceptibility ranged from high to moderate along the closest segment of the drainage network from the waste pile and the mine effluents discharge; along these segments there is evidence for agricultural practices and therefore a growing concern with the eventual usage of poor-quality water for irrigation purposes. The following segments downstream decrease to low susceptibility as there is a significant dilution on pollutants concentration caused by tributary water input to the drainage lines.
A concentric area with approximately 1 km surrounding the waste pile is classified as moderate susceptibility as a reflex of contaminants deposition from the waste pile by areal dissemination. This area affects both urban, agricultural areas and forest.
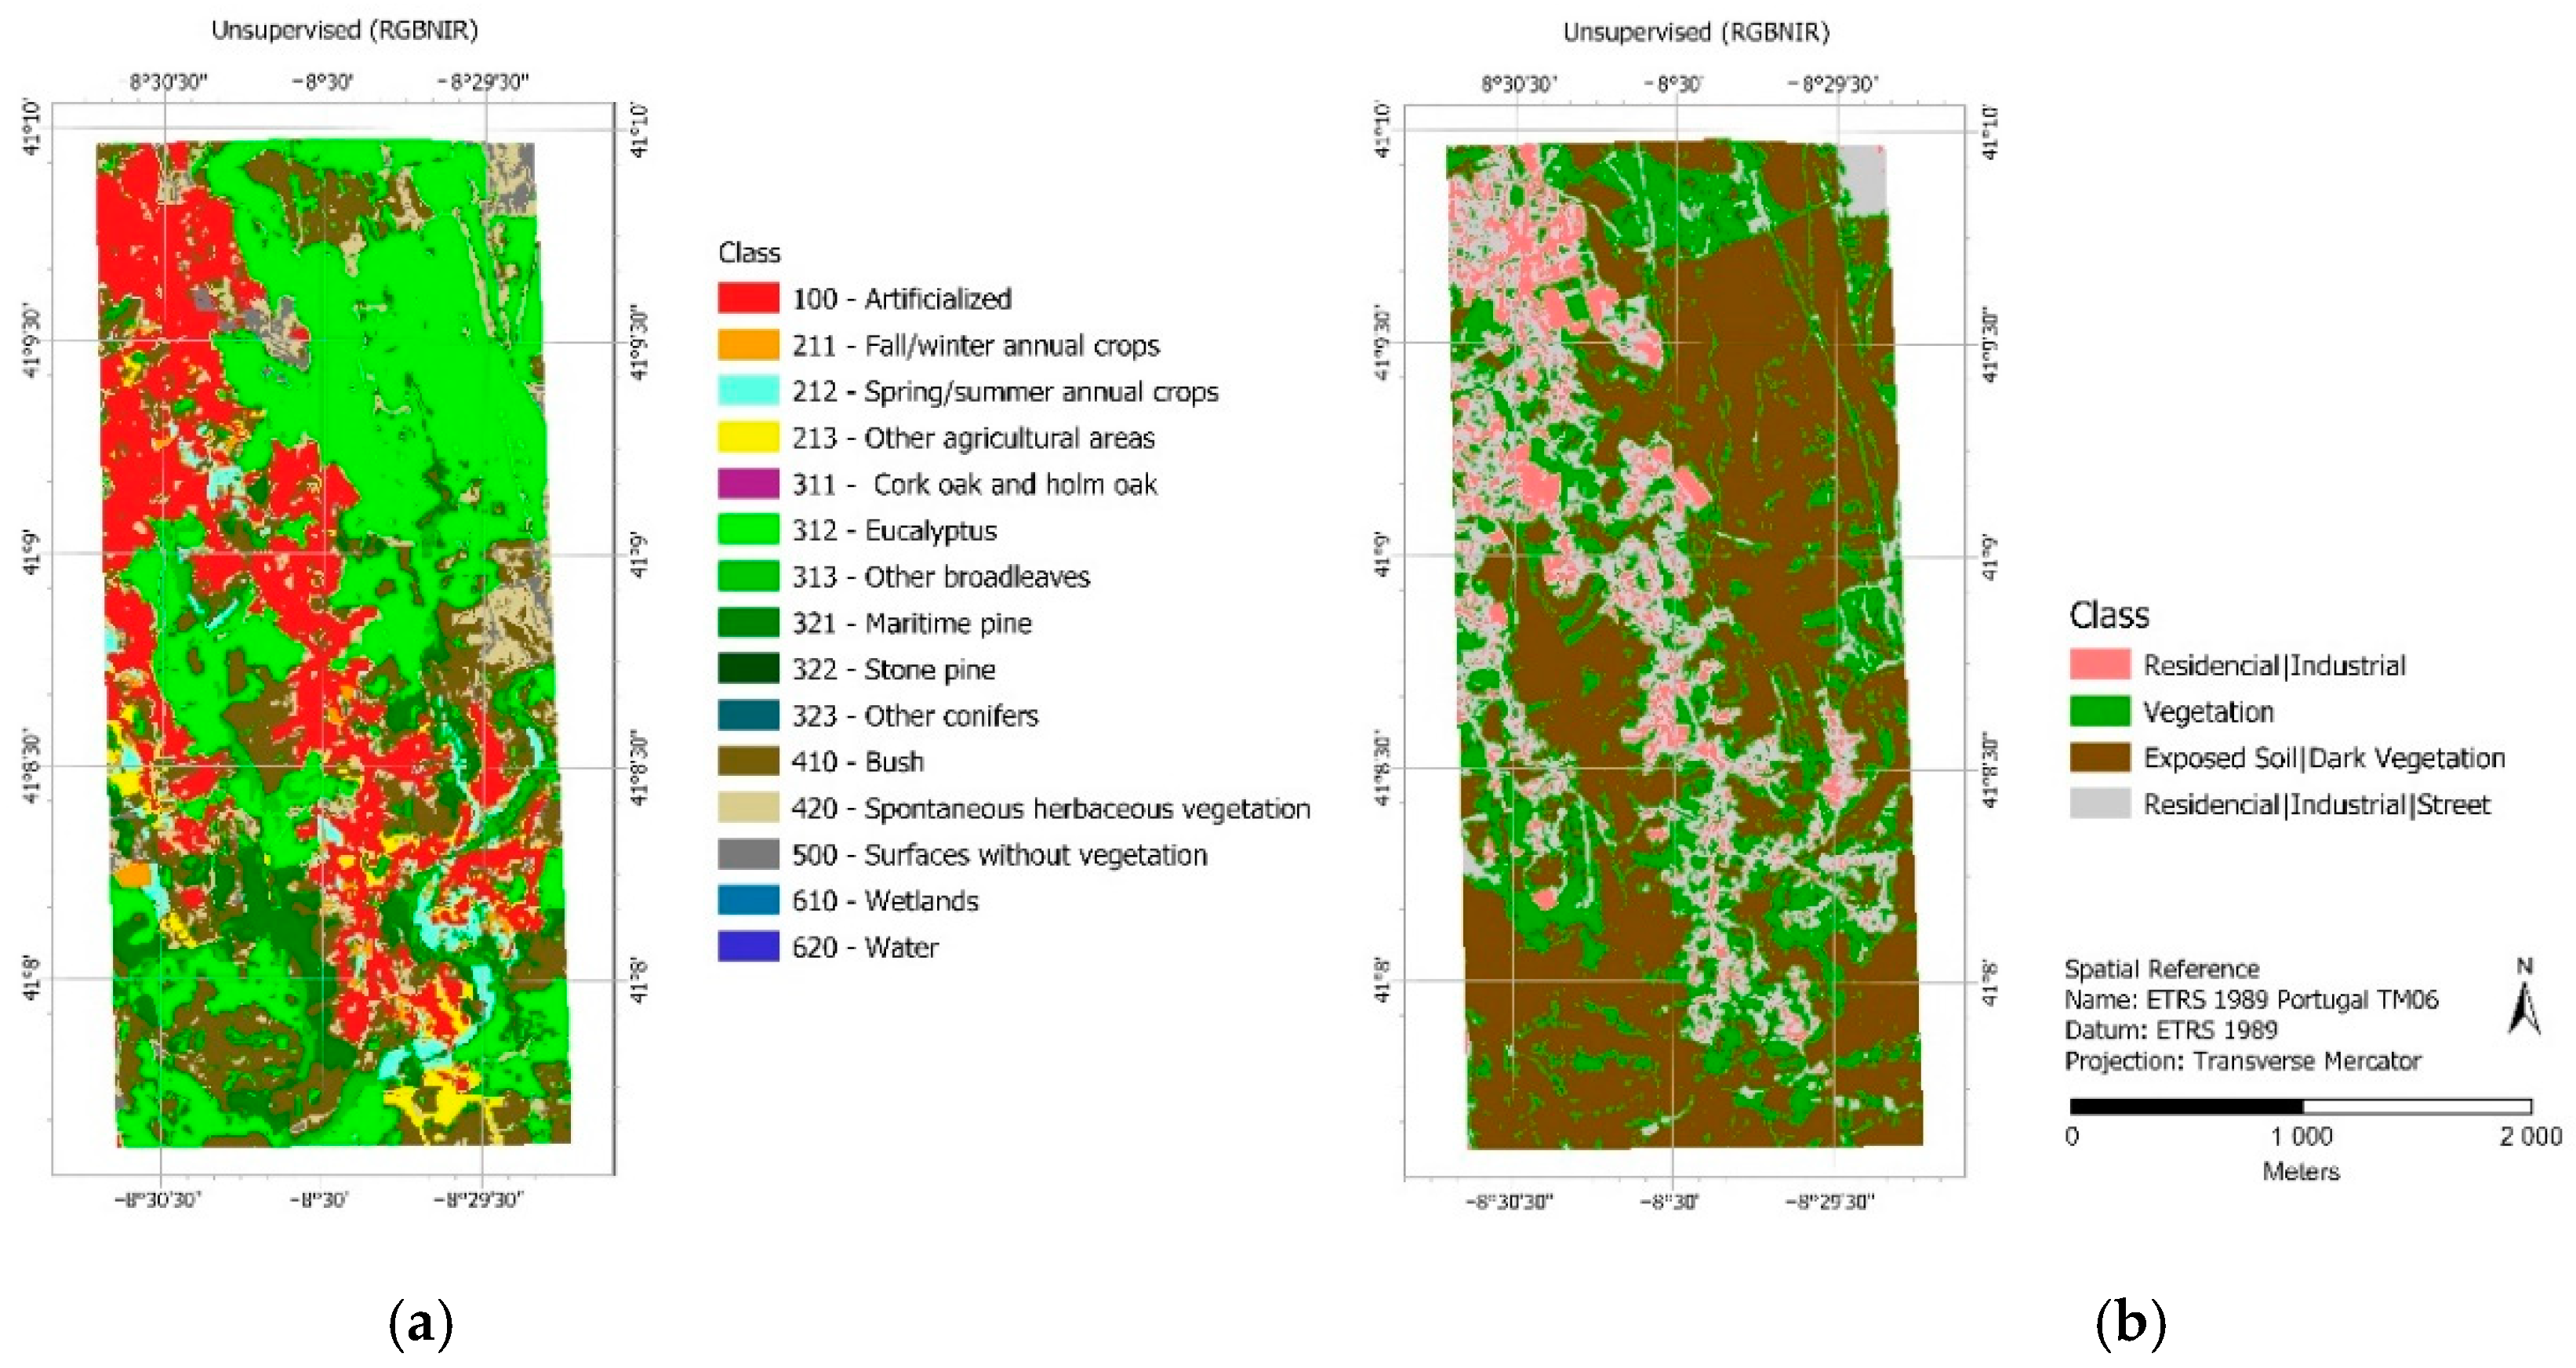
To validate the results, the LULC maps were generated for the study zone, and the COSSim was used (Figure 11). Comparing both maps and considering that the LULC map aggregates the classes from COSSim, from visual interpretation it can be concluded that the maps are coherent. The waste pile location is mainly characterized by vegetation (mainly eucalyptus) and bare soil zones. It can also be observed that the urban areas are very close to the waste pile.
The influence of urban contamination in the areas adjacent to the waste pile cannot be neglected. As previously mentioned in Teodoro et al. [20], there are multiple types of contamination sources contributing differently to the concentration of PTEs and other elements registered in soils that surround the mine. The samples located in urban areas upstream of the mine demonstrated a moderate increase in PTEs (As, Pb, Mo, Cu, Zn, Co, Ni and Ag). These values can influence the results obtained, suggesting that the contamination in the urban area can have different sources (external to the waste pile).
This study also provides the development of a webGIS constituting the client interface, free and open source, so any user can access. The webGIS can be considered as a base to develop and apply the appropriate management and monitoring of the São Pedro da Cova waste pile, providing detailed information acquired in situ and also from different geospatial techniques. In this context, the webGIS developed in this project, besides being a final product for dissemination of the data acquired/generated, has a number of advantages: (i) the access is possible from a web browser with connection to Internet, without costs; (ii) it does not require knowledge about any GIS software or database; (iii) it was developed as a user-friendly interface, with intuitive and simplistic buttons to manipulate, consult and access the information; (iv) a wide range of clients can use the application simultaneously; and (v) the application is open to further development and extension of functionalities and it can be adapted to other regions and other studies. Some limitations were also identified, since in the future more actions and analyses can be implemented in the webGIS. Additionally, it depends on the internet connection because some data have a large size.

5. Conclusions

In this study, AHP and Fuzzy AHP methods were employed to create a susceptibility map to identify the zones that possibly can be affected by contaminants of the São Pedro da Cova coal waste pile. The multiple contamination pathways were considered, including water and air. The adopted approach was never applied in the context of the São Pedro da Cova coal waste pile and since the data were available, this study integrated all of them using MCDM methods to evaluate the contaminant susceptibility in the surrounding areas of the waste pile. The results obtained showed that the contamination susceptibility is higher surrounding the abandoned mine, particularly along the waste piles and the corresponding runoff areas, which can be particularly sensitive. Nearly 2 km of mine drainage along the hydrographic network, sourced by the waste pile and the mining effluents discharge, can also be an object of concern, as these areas are surrounded by agriculture fields that can be flooded with contaminated materials and the water can potentially be used for irrigation. The NDVI parameter did not influenced so much the susceptibility to contamination.
The predictive maps were evaluated using the ROC, which indicates an accuracy of 0.813 (AUC = 0.813) for AHP and 0.800 (AUC = 0.800) for Fuzzy AHP, both indicating a high accuracy. Furthermore, the LULC and COSSim maps were compared and analyzed considering the waste pile.
Regarding the susceptibility analysis performed, although the availability of data is not enough, the results of the AHP and Fuzzy AHP methods suggest that it can be applied to other abandoned mines. To disseminate the results obtained under the CoalMine project, a user-friendly webGIS was developed, allowing us to visualize and combine the data obtained during the project, with respect to terrain analysis and water and soil characterization. Regarding the webGIS developed, the data acquired during the CoalMine project can be disseminated for any user, with tools that can help to analyze and combine the information. With the development of the project, users will take great advantage of a variety of long-term information, which provides critical implications for São Pedro da Cova coal waste pile and can help with management decision-making. The access to more available data and a larger time window would have allowed for a more effective analysis. The chosen parameters were selected in order to model the contamination susceptibility on the immediate area surrounding the São Pedro da Cova mine. For this analysis, in such a restrained area, the focus was on the known contamination sources and the identified dissemination pathways. Other factors such as wind preferential direction, aquifer and underground modelling (pluviometry data, types of geologic substract, hydraulic conductivity), and social-economic parameters, should be addressed in future studies regarding risk modelling in broader areas.
The developed work intends to provide information related to the sites more susceptible to contaminants. This work can help to provide security/control measures for public health and safety, preventing potential exposure of the surrounding community to soils and water channels close to a waste pile. It is important to attract the attention of the inhabitants that live close to the waste pile, so they are aware of the potential contaminants
In the future, the acquisition of more field measurements/data to improve this analysis is foreseen, integrating more factors in the MCDM approaches in order to obtain better outcomes. For instance, socio-demographic factors, to understand who is living close to the waste pile and consequently what kind of populations are more exposed or more vulnerable, and what kind of activities are taking place there, among others.

Author Contributions

Conceptualization, A.C.T., P.S., D.F. and L.D.; methodology, L.D. and P.S.; software, L.D.; validation, P.S.; formal analysis, P.S.; investigation, L.D. and P.S.; resources, A.C.T., P.S., C.R.d.A., J.C.-F. and D.F.; writing—original draft preparation, L.D. and P.S.; writing—review and editing, A.C.T., P.S., C.R.d.A., J.C.-F. and D.F. All authors have read and agreed to the published version of the manuscript.

Funding

This work was funded through the Foundation for Science and Technology, through the CoalMine project with the ref. POCI-01-0145-FEDER-030138, 02-SAICT-2017, by FEDER funding through the COMPETE 2020 programme and framed within the ICT activities (projects UIDB/04683/2020 and UIDP/04683/2020).

Institutional Review Board Statement

Not applicable.

Informed Consent Statement

Not applicable.

Data Availability Statement

Not applicable.

Acknowledgments

The authors want to acknowledge Jorge Espinha Marques, Joana Ribeiro, Catarina Mansilha, João Rocha, João Fernandes, Vitor Martins, José Alberto Gonçalves, Rita Fonseca and Catarina Pinho for the support given in several steps of the CoalMine project.

Conflicts of Interest

The authors declare no conflict of interest.

References

  1. Bhuiyan, M.A.H.; Parvez, L.; Islam, M.A.; Dampare, S.B.; Suzuki, S. Heavy metal pollution of coal mine-affected agricultural soils in the northern part of Bangladesh. J. Hazard. Mater. 2010, 173, 384–392. [Google Scholar] [CrossRef]
  2. Ribeiro, J.; Ferreira da Silva, E.; Flores, D. Burning of coal waste piles from Douro Coalfield (Portugal): Petrological, geochemical and mineralogical characterization. Int. J. Coal Geol. 2010, 81, 359–372. [Google Scholar] [CrossRef]
  3. Ribeiro, J.; Ferreira da Silva, E.; Li, Z.; Ward, C.; Flores, D. Petrographic, mineralogical and geochemical characterization of the Serrinha coal waste pile (Douro Coalfield, Portugal) and the potential environmental impacts on soil, sediments and surface waters. Int. J. Coal Geol. 2010, 83, 456–466. [Google Scholar] [CrossRef]
  4. Yenilmez, F.; Kuter, N.; Emil, M.K.; Aksoy, A. Evaluation of pollution levels at an abandoned coal mine site in Turkey with the aid of GIS. Int. J. Coal Geol. 2011, 86, 12–19. [Google Scholar] [CrossRef]
  5. Marove, C.A.; Sotozono, R.; Tangviroon, P.; Tabelin, C.B.; Igarashi, T. Assessment of soil, sediment and water contaminations around open-pit coal mines in Moatize, Tete province, Mozambique. Environ. Adv. 2022, 8, 100215. [Google Scholar] [CrossRef]
  6. Antunes, I.M.H.R.; Albuquerque, M.T.D.; Sanches, F.A.N. Spatial risk assessment related to abandoned mining activities: An environmental management tool. Environ. Earth Sci. 2014, 72, 2631–2641. [Google Scholar] [CrossRef]
  7. Martínez-López, S.; Martínez-Sánchez, M.J.; Pérez-Sirvent, C. Do Old Mining Areas Represent an Environmental Problem and Health Risk? A Critical Discussion through a Particular Case. Minerals 2021, 11, 594. [Google Scholar] [CrossRef]
  8. Quispe-Jofré, A.; Philimon, P.P.; Alfaro-Lira, S. Socio-environmental conflict over abandoned mining waste in Copaquilla, Chile. Environ. Sci. Pollut. Res. 2021, 28, 68773–68791. [Google Scholar] [CrossRef]
  9. Tozsin, G.; Arol, A.I.; Duzgun, S.; Soydan, H.; Torun, A. Effects of abandoned coal mine on the water quality. Int. J. Coal Prep. Util. 2022. [Google Scholar] [CrossRef]
  10. Salgado-Almeida, B.; Falquez-Torres, D.A.; Romero-Crespo, P.L.; Valverde-Armas, P.E.; Guzmán-Martínez, F.; Jiménez-Oyola, S. Risk Assessment of Mining Environmental Liabilities for Their Categorization and Prioritization in Gold-Mining Areas of Ecuador. Sustainability 2022, 14, 6089. [Google Scholar] [CrossRef]
  11. Marrugo-Madrid, S.; Salas-Moreno, M.; Gutiérrez-Mosquera, H.; Salazar-Camacho, C.; Marrugo-Negrete, J.; Díez, S. Assessment of dissolved mercury by diffusive gradients in thin films devices in abandoned ponds impacted by small scale gold mining. Environ. Res. 2022, 208, 112633. [Google Scholar] [CrossRef]
  12. Alamanos, A.; Papaioannou, G. A GIS Multi-Criteria Analysis Tool for a Low-Cost, Preliminary Evaluation of Wetland Effectiveness for Nutrient Buffering at Watershed Scale: The Case Study of Grand River, Ontario, Canada. Water 2020, 12, 3134. [Google Scholar] [CrossRef]
  13. Qiaoxiu, W.; Hong, W.; Zuoqiu, Q. An application of nonlinear fuzzy analytic hierarchy process in safety evaluation of coal mine. Saf. Sci. 2016, 86, 78–87. [Google Scholar]
  14. Choi, J.-K.; Kim, K.-D.; Lee, S.; Won, J.-S. Application of a fuzzy operator to susceptibility estimations of coal mine subsidence in Taebaek City, Korea. Environ. Earth Sci. 2009, 59, 1009–1022. [Google Scholar] [CrossRef]
  15. Rehman, S.; Sahana, M.; Dutta, S.; Sajjad, H.; Song, X.; Imdad, K.; Dou, J. Assessing subsidence susceptibility to coal mining using frequency ratio, statistical index and Mamdani fuzzy models: Evidence from Raniganj coalfield, India. Environ. Earth Sci. 2020, 79, 380. [Google Scholar] [CrossRef]
  16. Dai, G.; Xue, X.; Xu, K.; Dong, L.; Niu, C. A GIS-based method of risk assessment on no. 11 coal-floor water inrush from Ordovician limestone in Hancheng mining area, China. Arab. J. Geosci. 2018, 11, 714. [Google Scholar] [CrossRef]
  17. Sahin, F.; Kara, M.K.; Koc, A.; Sahin, G. Multi-criteria decision-making using GIS-AHP for air pollution problem in Igdir Province/Turkey. Environ. Sci. Pollut. Res. 2020, 27, 36215–36230. [Google Scholar] [CrossRef]
  18. Milevski, I.; Dragićević, S. Landslides Susceptibility Zonation of the Territory of North Macedonia Using Analytical Hierarchy Process Approach. Contrib. Sect. Nat. Math. Biotech. Sci. 2019, 40, 115–126. [Google Scholar] [CrossRef]
  19. Ribeiro, J.; Viveiros, D.; Ferreira, J.; Lopez-Gil, A.; Dominguez-Lopez, A.; Martins, H.; Perez-Herrera, R.; Lopez-Aldaba, A.; Duarte, L.; Pinto, A.; et al. ECOAL Project—Delivering Solutions for Integrated Monitoring of Coal-Related Fires Supported on Optical Fiber Sensing Technology. Appl. Sci. 2017, 7, 956. [Google Scholar] [CrossRef]
  20. Teodoro, A.; Santos, P.; Marques, J.E.; Ribeiro, J.; Mansilha, C.; Melo, A.; Duarte, L.; de Almeida, C.R.; Flores, D. An integrated multi-approach to environmental monitoring of a self-burning coal waste pile: The são pedro da cova mine (porto, portugal) study case. Environments 2021, 8, 48. [Google Scholar] [CrossRef]
  21. Duarte, L.; Teodoro, A.C.; Gonçalves, J.A.; Ribeiro, J.; Flores, D.; Lopez-Gil, A.; Dominguez-Lopez, A.; Angulo-Vinuesa, X.; Martin-Lopez, S.; Gonzalez-Herraez, M. Distributed Temperature Measurement in a Self-Burning Coal Waste Pile through a GIS Open Source Desktop Application. ISPRS Int. J. Geo-Inf. 2017, 6, 87. [Google Scholar] [CrossRef] [Green Version]
  22. Ribeiro, J.; Flores, D.; Ward, C.R.; Silva, F.O. Identification of nanominerals and nanoparticles in burning coal waste piles from Portugal. Sci. Total Environ. 2010, 408, 6032–6041. [Google Scholar] [CrossRef]
  23. Ribeiro, J.; Silva, T.; Graciano Mendonca Filho, F.; Flores, D. Polycyclic aromatic hydrocarbons (PAHs) in burning and non-burning coal waste piles. J. Hazard. Mater. 2012, 199–200, 105–110. [Google Scholar] [CrossRef]
  24. Ribeiro, J.; Taffarel, S.R.; Sampaio, C.H.; Flores, D.; Silva, L.F. Mineral speciation and fate of some hazardous contaminants in coal waste pile from anthracite mining in Portugal. Int. J. Coal Geol. 2013, 109–110, 15–23. [Google Scholar] [CrossRef]
  25. Ribeiro, J.; Sant’Ovaia, H.; Gomes, C.; Ward, C.; Flores, D. Mineralogy and Magnetic Parameters of Materials Resulting from the Mining and Consumption of Coal from the Douro Coalfield, Northwest Portugal in Coal and Peat Fires: A Global Perspective. In Coal and Peat Fires: A Global Perspective; Elsevier: Amsterdam, The Netherlands, 2015; Volume 3, pp. 493–508. [Google Scholar]
  26. Ribeiro, J.; Viveiros, D.; Ferreira, J.; Suárez-Ruiz, I.; Santos, J.L.; Baptista, J.M.; Flores, D. Volatile organic compounds emitted from self-burning coal waste piles in Spain and Portugal: Environment and human health concerns. In Progress in Medical Geology; Ibaraki, M., Mori, H., Eds.; Cambridge Scholars Publishing: Newcastle Upon Tyne, UK, 2017; pp. 229–247. [Google Scholar]
  27. Ribeiro, J.; Flores, D. Occurrence, leaching, and mobility of major and trace elements in a coal mining waste dump: The case of Douro Coalfield, Portugal. Energy Geosci. 2021, 2, 121–128. [Google Scholar] [CrossRef]
  28. Lemos de Sousa, M.J.; Wagner, R.H. General description of the terrestrial carboniferous basins in Portugal and history of investigations. In The Carboniferous of Portugal. Memórias dos Serviços Geológicos de Portugal; Lemos de Sousa, M.J., Oliveira, J.T., Eds.; 1983; Volume 29, pp. 117–126. [Google Scholar]
  29. Wagner, R.H.; Lemos de Sousa, M.J. The Carboniferous megafloras of Portugal—A revision of identifications and discussion of stratigraphic ages. In The Carboniferous of Portugal; Lemos de Sousa, M.J., Oliveira, J.T., Eds.; Direção Geral de Geologia e Minas Memórias dos Serviços Geológicos de Portugal: Lisboa, Portugal, 1983; Volume 29, pp. 127–152. [Google Scholar]
  30. Correia, P.; Šimůnek, Z.; Artur, S.A.; Flores, D. A new Late Pennsylvanian floral assemblage from the Douro Basin, Portugal. Geol. J. 2018, 53, 2507–2531. [Google Scholar] [CrossRef]
  31. Correia, P.; Šimůnek, Z.; Pšenička, J.; Sá, A.A.; Domingos, R.; Carneiro, A.; Flores, D. New paleobotanical data on the Portuguese Pennsylvanian (Douro Carboniferous Basin, NW Portugal). Comun. Geol. 2014, 101, 409–414. [Google Scholar]
  32. Pinto de Jesus, A. Carboniferous Intermontane Basins of Portugal. In The Geology of Iberia: A Geodynamic Approach, 1st ed.; Oliveira, J., Quesada, C., Eds.; Springer: Cham, Switzerland, 2019; Volume 2, pp. 402–408. [Google Scholar]
  33. Liu, B.; Tian, K.; He, Y.; Hu, W.; Huang, B.; Zhang, X.; Zhao, L.; Teng, Y. Dominant roles of torrential floods and atmospheric deposition revealed by quantitative source apportionment of potentially toxic elements in agricultural soils around a historical mercury mine, Southwest China. Ecotoxicol. Environ. Saf. 2022, 242, 113854. [Google Scholar] [CrossRef]
  34. Stovern, M.; Betterton, E.A.; Sáez, A.E.; Villar, O.I.F.; Rine, K.P.; Russell, M.R.; King, M. Modeling the emission, transport and deposition of contaminated dust from a mine tailing site. Rev. Environ. Health 2014, 29, 91–94. [Google Scholar] [CrossRef]
  35. Lin, Y.; Hoover, J.; Beene, D.; Erdei, E.; Liu, Z. Environmental risk mapping of potential abandoned uranium mine contamination on the Navajo Nation, USA, using a GIS-based multi-criteria decision analysis approach. Environ. Sci. Pollut. Res. 2020, 27, 30542–30557. [Google Scholar] [CrossRef]
  36. Kumar, S.; Singha, S.; Singh, R.; Venkatesh, A.S.; Gogoi, U. A knowledge-driven multi-criteria decision making- Analytical Hierarchy Process based geospatial modeling for the delineation of fluoride contamination zones in groundwater, Jamui district, Indo-Gangetic alluvial plains, India. Groundw. Sustain. Dev. 2022, 18, 100795. [Google Scholar] [CrossRef]
  37. US Geological Survey. Available online: https://earthexplorer.usgs.gov/ (accessed on 5 June 2022).
  38. European Space Agency (ESA) Sentinel-2. Available online: https://sentinel.esa.int/web/sentinel/missions/sentinel-2 (accessed on 5 June 2022).
  39. Arvidson, T.; Barsi, J.; Jhabvala, M.; Reuter, D. Landsat and Thermal Infrared Imaging. In Thermal Infrared Remote Sensing; Kuenzer, C., Dech, S., Eds.; Springer: Dordrecht, the Netherlands, 2013; Volume 17, pp. 177–196. ISBN 978-94-007-6638-9. [Google Scholar]
  40. ESRI ArcGIS Pro. Available online: https://www.esri-portugal.pt/pt-pt/arcgis/produtos/arcgis-pro/overview (accessed on 6 June 2022).
  41. Espinha Marques, J.; Martins, V.; Santos, P.; Ribeiro, J.; Mansilha, C.; Melo, A.; Rocha, J.R.; Flores, D. Changes Induced by Self-Burning in Technosols from a Coal Mine Waste Pile: A Hydropedological Approach. Geosciences 2021, 11, 195. [Google Scholar] [CrossRef]
  42. Punia, A. Role of temperature, wind, and precipitation in heavy metal contamination at copper mines: A review. Environ. Sci. Pollut. Res. 2021, 28, 4056–4072. [Google Scholar] [CrossRef]
  43. Mansilha, C.; Melo, A.; Flores, D.; Ribeiro, J.; Rocha, J.R.; Martins, V.; Santos, P.; Espinha Marques, J. Irrigation with Coal Mining Effluents: Sustainability and Water Quality Considerations (São Pedro da Cova, North Portugal). Water 2021, 13, 2157. [Google Scholar] [CrossRef]
  44. Tomiyama, S.; Igarashi, T. The potential threat of mine drainage to groundwater resources. Curr. Opin. Environ. Sci. Health 2022, 27, 100347. [Google Scholar] [CrossRef]
  45. Angelovičová, L.; Fazekašová, D. Contamination of the soil and water environment by heavy metals in the former mining area of Rudňany (Slovakia). Soil Water Res. 2014, 9, 18–24. [Google Scholar] [CrossRef]
  46. Equeenuddin , S.M.; Tripathy, S.; Sahoo, P.K.; Panigrahi, M.P. Hydrogeochemical characteristics of acid mine drainage and water pollution at Makum Coalfield, India. J. Geochem. Explor. 2010, 105, 75–82. [Google Scholar] [CrossRef]
  47. Rouse, J.W.; Haas, R.H.; Schell, J.A.; Deering, D.W. Monitoring vegetation systems in the Great Plains with ERTS. In 3rd ERTS Symposium; NASA: Washington, DC, USA, 1974; pp. 309–317. [Google Scholar]
  48. Duarte, L.; Teodoro, A.C.; Gonçalves, H. Deriving phenological metrics from NDVI through an open source tool developed in QGIS. In Earth Resources and Environmental Remote Sensing/GIS Applications V, Proceedings of the SPIE REMOTE SENSING, Amsterdam, The Netherlands, 22–25 September 2014; SPIE: Bellingham, WA, USA, 2014; Volume 9245, p. 924511. [Google Scholar] [CrossRef]
  49. Hmimina, G.; Dufrêne, E.; Pontailler, J.Y.; Delpierre, N.; Aubinet, M.; Caquet, B.; de Grandcourt, A.; Burban, B.; Flechard, C.; Granier, A.; et al. Evaluation of the potential of MODIS satellite data to predict vegetation phenology in different biomes: An investigation using ground-based NDVI measurements. Remote Sens. Environ. 2013, 132, 145–158. [Google Scholar] [CrossRef]
  50. Saaty, R.W. The analytic hierarchy process—What it is and how it is used. Math. Model. 1987, 9, 161–176. [Google Scholar] [CrossRef]
  51. Fernandes, P.R.M.; Lima, H.M.d. A Framework for Ranking the Environmental Risk of Abandoned Mines in the State of Minas Gerais/Brazil. Sustainability 2021, 13, 13874. [Google Scholar] [CrossRef]
  52. Senouci, R.; Taibi, N.-E.; Teodoro, A.C.; Duarte, L.; Mansour, H.; Yahia Meddah, R. GIS-Based Expert Knowledge for Landslide Susceptibility Mapping (LSM): Case of Mostaganem Coast District, West of Algeria. Sustainability 2021, 13, 630. [Google Scholar] [CrossRef]
  53. Snedecor, G.W.; Cochran, W.G. Statistical Methods, 6th ed.; The Iowa State University Press: Ames, IA, USA, 1968. [Google Scholar]
  54. Nola, I.T.S.; Bacellar, L.A.P. Multi-criteria analysis for mapping susceptibility to iron formation caves development in the Gandarela mountain range (MG), southeast Brazil. Int. J. Speleol. 2021, 50, 173–187. [Google Scholar] [CrossRef]
  55. Lu, D.; Weng, Q. A survey of image classification methods and techniques for improving classification performance. Int. J. Remote Sens. 2007, 28, 823–870. [Google Scholar] [CrossRef]
  56. Zadeh, L.A. Fuzzy Sets. Inf. Control 1965, 8, 338–353. [Google Scholar] [CrossRef]
  57. Fawcett, T. An introduction to ROC analysis. Pattern Recognit. Lett. 2006, 27, 861–874. [Google Scholar] [CrossRef]
  58. Hákanson, L. The quantitative impact of pH, bioproduction and Hg-contamination on the Hg-content in fish (pike). Environ. Pollut. Ser. B Chem. Phys. 1980, 1, 285–304. [Google Scholar] [CrossRef]
  59. Carranza, E.J.M.; Hale, M.; Faassen, C. Selection of coherent deposit-type locations and their application in data-driven mineral prospectivity mapping. Ore Geol. Rev. 2008, 33, 536–558. [Google Scholar] [CrossRef]
  60. Esri The Image Classification Wizard. Available online: https://pro.arcgis.com/en/pro-app/latest/help/analysis/image-analyst/the-image-classification-wizard.htm (accessed on 5 June 2022).
  61. Siqi, J.; Yuhong, W. Effects of land use and land cover pattern on urban temperature variations: A case study in Hong Kong. Urban Clim. 2020, 34, 100693. [Google Scholar] [CrossRef]
  62. Nedd, R.; Light, K.; Owens, M.; James, N.; Johnson, E.; Anandhi, A. A Synthesis of Land Use/Land Cover Studies: Definitions, Classification Systems, Meta-Studies, Challenges and Knowledge Gaps on a Global Landscape. Land 2021, 10, 994. [Google Scholar] [CrossRef]
  63. Li, C.; Zhao, J.; Thinh, N.X.; Yang, W.; Li, Z. Analysis of the spatiotemporally varying effects of urban spatial patterns on land surface temperatures. J. Environ. Eng. Landsc. Manag. 2018, 26, 216–231. [Google Scholar] [CrossRef]
  64. Tang, J.; Di, L.; Xiao, J.; Lu, D.; Zhou, Y. Impacts of land use and socioeconomic patterns on urban heat island. Int. J. Remote Sens. 2017, 38, 3445–3465. [Google Scholar] [CrossRef]
  65. Ravanelli, R.; Nascetti, A.; Cirigliano, R.V.; Di Rico, C.; Leuzzi, G.; Monti, P.; Crespi, M. Monitoring the impact of land cover change on surface urban heat island through Google Earth Engine: Proposal of a global methodology, first applications and problems. Remote Sens. 2018, 10, 1488. [Google Scholar] [CrossRef]
  66. Costa, H.; Benevides, P.; Moreira, F.D.; Moraes, D.; Caetano, M. Spatially Stratified and Multi-Stage Approach for National Land Cover Mapping Based on Sentinel-2 Data and Expert Knowledge. Remote Sens. 2022, 14, 1865. [Google Scholar] [CrossRef]
  67. PostGIS. Available online: https://postgis.net/ (accessed on 5 June 2022).
Figure 1. Geographical location of São Pedro da Cova coal waste pile.
Geosciences 12 00352 g001
Figure 2. Flowchart presenting the data and methodology used in this study.
Geosciences 12 00352 g002
Figure 3. (a) RGB composition and (b) False color map.
Geosciences 12 00352 g003
Figure 4. Main water streams and temporary water lines affected by the mine.
Geosciences 12 00352 g004
Figure 5. NDVI map of the study area.
Geosciences 12 00352 g005
Figure 6. Sample points used for validation.
Geosciences 12 00352 g006
Figure 7. (a) WebGIS application and (b) detail of the cards where the map can be turned on/off.
Geosciences 12 00352 g007
Figure 8. An excerpt of the webGIS with the representation of the table with the information on the hydrogeochemical and soil characterization on the webGIS.
Geosciences 12 00352 g008
Figure 9. (a) AHP and (b) Fuzzy AHP maps.
Geosciences 12 00352 g009
Figure 10. ROC curve and AUC score for the AHP model that produced the environmental susceptibility map of Figure 8a.
Geosciences 12 00352 g010
Figure 11. (a) COSSim map and (b) LULC map.
Geosciences 12 00352 g011
Table 1. Data sources adopted to produce the susceptibility map.
DataCoordinate SystemSpatial Resolution (m)Source
NDVI/LULCUTM WGS84 Zone 29N (EPSG:32629)10Generated from Sentinel-2A satellite image (USGS website [37])
Stream and drainagesETRS89-LAEA projection (EPSG:3035)25Generated from DEM (Copernicus Land Monitoring Service [38])
Table 2. Information about the downloaded Sentinel-2B data.
File Name L1C_T29TNF_A023944_20211006T112114
Date Acquired6 October 2021
Land Cloud Cover0%
Data Type UINT16
Product Map Projection UTM
DATUM WGS84 Zone 29 N
Table 3. Information about the bands used (adapted from [38]).
BandsCentral Wavelength (nm)Bandwidth (nm)Spatial Resolution (m)
B2 (Blue)492.16610
B3 (Green)559.036
B4 (Red)664.931
B8 (Near Infrared (NIR))832.9106
Table 4. AHP fundamental scale [50].
Intensity of Importance on an Absolute ScaleDefinitionExplanation
1Equal importanceTwo activities contribute equality to the objective
3Moderate importance of one over anotherExperience and judgment strongly favor one activity over another
5Essential or strong importance
7Very strong importanceAn activity is strongly favored, and its dominance demonstrated in practice
9Extreme importanceThe evidence favoring one activity over another is of the highest possible order of affirmation
2, 4, 6, 8Intermediate values between the two adjacent judgementsWhen compromise is needed
ReciprocalsIf activity has one of the above numbers assigned to it when compared with activity j, then j has the reciprocal value when compared with i
RationalsRatios arising from the scaleIf consistency were to be forced by obtaining n numerical values to span the matrix
Table 5. AHP fundamental scale [50].
n2345678910
RI00.580.91.121.241.321.411.451.51
Table 6. AHP comparison matrix for the selected parameters.
Waste PileRunoffDownstream DrainageDistance to Waste PileNDVI
Waste pile13578
Runoff1/31258
Downstream drainage1/51/2138
Distance to waste pile1/71/51/315
NDVI1/81/81/81/51
Publisher’s Note: MDPI stays neutral with regard to jurisdictional claims in published maps and institutional affiliations.

