
Storm Driven Migration of the Napatree Barrier, Rhode Island, USA


Department of Environmental Earth Science, Eastern Connecticut State University, Willimantic, CT 06226, USA
Geosciences 2021, 11(8), 330; https://doi.org/10.3390/geosciences11080330
Submission received: 7 May 2021
/
Revised: 27 July 2021
/
Accepted: 31 July 2021
/
Published: 5 August 2021
(This article belongs to the Special Issue Shoreline Dynamics and Beach Erosion)
Abstract
:Napatree Point, an isolated barrier in southern Rhode Island, provides a case study of barrier spit migration via storm driven overwash and washover fan migration. Documented shoreline changes using historical surveys and vertical aerial photographs show that the barrier had little in the way of net change in position between 1883 and 1939, including the impact of the 1938 hurricane. The barrier retreated rapidly between 1945 and 1975, driven by both tropical and extra-tropical storms. The shoreline position has been largely static since 1975. The removal of the foredune during the 1938 hurricane facilitated landward shoreline migration in subsequent lower intensity storms. Dune recovery following the 1962 Ash Wednesday storm has been allowed due to limited overwash and barrier migration over the last several decades. Shoreline change rates during the period from 1945–1975 were more than double the rate of shoreline change between 1939 and 2014 and triple the rate between 1883 and 2014, exceeding the positional uncertainty of these shoreline pairs. The long-term shoreline change rates used to calculate coastal setbacks in Rhode Island likely underestimate the potential for rapid shoreline retreat over shorter time periods, particularly in a cluster of storm activity. While sea-level rise has increased since 1975, the barrier has not migrated, highlighting the importance of storms in barrier migration.
1. Introduction
Coastal barrier spits and islands, which comprise approximately 10% of the world’s coastline [1], are dynamic landforms that are impacted by storms and sea-level rise. Debate exists regarding the impacts of sea-level rise on shoreline change and barrier migration [2,3,4,5,6]. Over the millennia, sea-level rise and storms certainly drove the migration of shorelines across the continental shelf during the Holocene [5,7]. Barriers in the mid and northern Atlantic have largely been narrowing rather than migrating in the 20th century [8], and some authors argue the gradual recession of these areas is the result of sea-level rise, not storms [3,6]. Other authors have argued that roles of overwash and inlet dynamics in maintaining barrier systems drive shoreline changes at the decadal/century scale [5,9,10,11]. Difficulty remains in defining the direct cause and effect of sea-level rise and storms [12]. Gutierrez et al. [13] and Williams et al. [14] summarized likely responses of barriers to sea-level rise under various scenarios and concluded that it is virtually certain that barriers will experience morphological changes through erosion, overwash and washover fan deposition and the formation of inlets during storms. Subsequent research has focused on the various mechanisms related to barrier response to sea-level rise, including modelling studies focusing on the rate of sea-level rise, accommodation space and sediment availability [15,16] and the importance of tidal inlets and tidal deltas to barrier dynamics [17]. Understanding barrier dynamics in the face of potentially increased storminess (increased intensity) [18] and higher numbers of storms [19] is critical to understanding the response of barriers to forcings in the future.
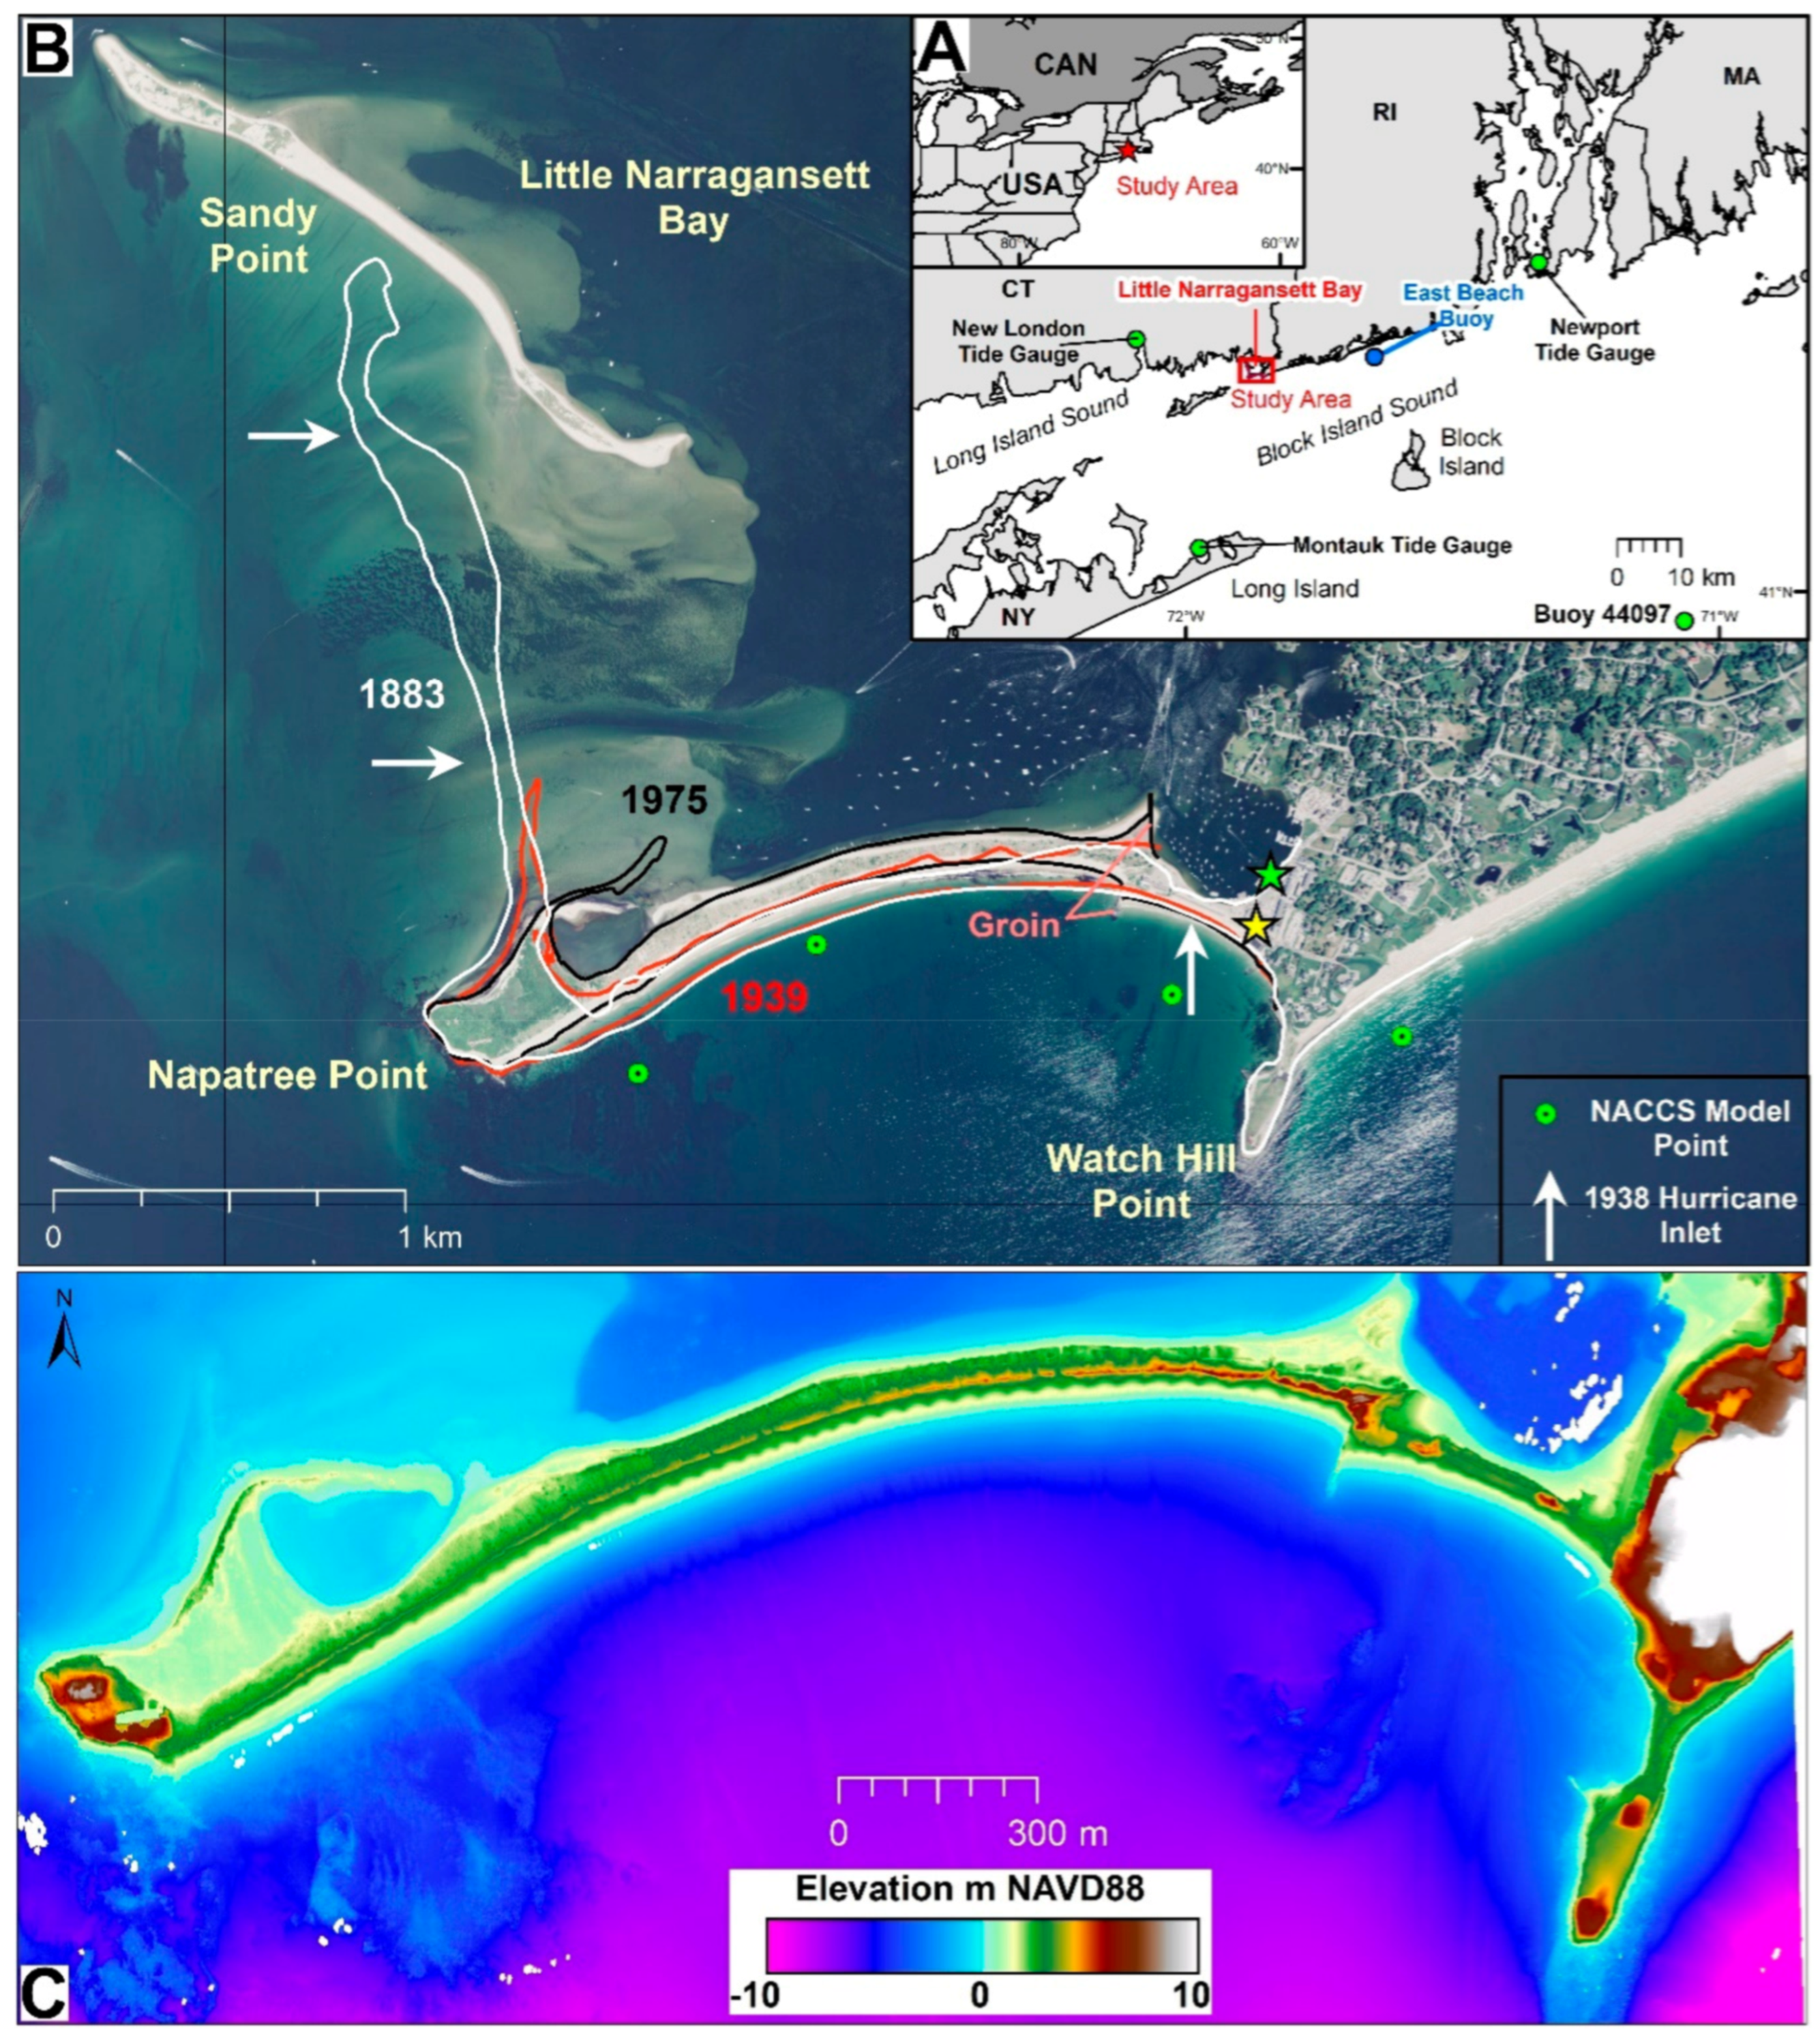
This study documents the storm driven shoreline changes of the Napatree Point Conservation Area (NPCA), a 2.5 km headland bounded barrier spit located in southwest Rhode Island, extending across the mouth of the Little Narragansett Bay estuary (Figure 1). The barrier and adjacent headland are important for several key reasons: The barrier (1) Attenuates storm impacts (surge, waves) for the southern end of Little Narragansett Bay and adjacent shorelines and (2) provides a suitable habitat for several threatened or endangered species, including Piping Plovers (Charadrius melodus), American Oystercatchers (Haematopus palliatus) and Least Terns (Sternula antillarum). Napatree has been recognized by the Audubon Society as a Globally Important Bird Area [20]. (3) NPCA is managed as a conservation area and remains an important recreational destination with hundreds of visitors a day in the summer.
The objective of this study is to document historical changes in shoreline position and morphology of a barrier spit between 1883 and 2014 and examine the roles of storm frequency and magnitude on barrier migration. The erosion and subsequent recovery of foredunes is critical to understanding the style and rate of barrier retreat [21]. Increased storm frequency and sea-level rise are likely consequences of climate change [19], creating a feedback loop of increased frequency of overwash events and reduced periods of barrier recovery. This would lead to faster rates of shoreline migration as barriers potentially cross a geomorphic threshold [11,13,17]. Between 1938 and 1975 multiple storms (both tropical and extra-tropical) impacted Napatree Point, leading to overwash and ‘roll-over’ via washover fan deposition and migration of the barrier. The period before 1939 and after 1975 produced little to no net migration of the barrier, even with some moderate storm events. This suggests that the period of recovery was sufficient, such that the barrier was not overwashed in these events, even though similar storms overwashed the barrier in the past. The pattern of increased storm frequency with limited periods of recovery, even in the absence of rapid sea-level rise, provides at least a partial analog of future behavior of a barrier spit and furthers understanding of the importance of storm frequency in barrier migration.
Figure 1.
(A). Location map of Napatree Point. (B). A 2014 Digital orthophotograph [22] with past shoreline positions superimposed in 1883 (white), 1939 (red) and 1975 (black) [23,24,25]. Note that Sandy Point was connected to Napatree Point in 1883 but has migrated north since the 1938 hurricane. White arrows indicate the 1938 hurricane [26]. The yellow star shows the location that the photograph in Figure 5D was captured at. Green circles indicate the locations of the NACCS buoys discussed in the text. The green star shows the location of the U.S. Geological Survey water level gauge. (C). A 2018 LiDAR Topobathymetric model of Napatree point and the adjacent Watch Hill, elevation in meters above NAVD88 [27].

2. Materials and Methods
2.1. Study Area
The barrier spit portion of the NPCA is a welded barrier [28], bounded by Watch Hill Point to the east and Napatree Point to the west (Figure 1). The entirety of the point/barrier complex extends 2.5 km across Little Narragansett Bay. The barrier spit itself is 2 km long. It has an average width of 100 m and an average volume of 300 m3 m−1. Foredune heights range from 3.5 to 8 m MLLW (mean, 4.7 m MLLW), with a general increase in elevation from west to east. The headlands at each end of the barrier are composed of boulder diamict (glacial till) deposited as part of recessional end moraines during the Late Wisconsinan deglaciation [29,30]. Napatree Point headland ranges from 5 to 8 m in relief, and is unarmored, although the boulders eroded from the till bluffs at the far western end form a natural ‘revetment’ in the manner of FitzGerald et al. [31]. The eastern bluff (Watch Hill Point) is 5 to 6 m in relief along the shoreline; however, shoreline protection structures (sea walls and revetments) have been in place along much of this shoreline since at least 1939. Offshore of the headlands, cobble-gravel to boulder pavement extends approximately 500 m to a water depth here of 7 to 8 m. These boulder-gravel areas are interpreted to represent erosion of the glacial headlands as the shoreline retreated during transgression [32]. The shoreface offshore of the Napatree barrier is largely sandy, and sorted bedforms are visible on aerial photographs, Lidar and unpublished side-scan sonar imagery. One linear ridge of cobble-gravel to boulder pavement is visible in both the aerial imagery and lidar of Figure 1 along the east end of the barrier.
NPCA, like the rest of the Rhode Island South Shore (RISS), is a microtidal, wave-dominated shoreline in the classification of Hayes [33], and tidal range along the ocean shoreline (Block Island Sound) is 0.8 to 1.2 m. A U.S. Geological Survey gauge (Figure 1) installed in 2014 in the harbor behind the eastern end of the barrier does not report calculated tidal datums, but the range is similar to the open ocean conditions, suggesting tidal range is not significantly dampened within Little Narragansett Bay. Direct observations of wave conditions in Block Island Sound are limited, due to no long-term stations in the area. Approximately one year of observations between July 2010 and September 2011 reported that significant wave heights are typically <1 m with periods 5 to 11 s (see the location of the East Beach Buoy, Figure 1A) [34]. Fair weather waves approach predominantly from the southwest or south. Storm wave conditions during intense storms remain speculative; however, observations along the RISS in 10 m of water depth 18 km east of Napatree during Tropical Storm Irene (2011) measured significant wave heights of 4.1 m with a peak period of 10 s [34]. Modelled conditions during storms were calculated as part of the North Atlantic Coast Comprehensive Study (NACCS), and the station 200 m offshore of the Napatree barrier with approximately 6 m deep water (Figure 1) resulted in calculated the wave height for a storm with a 2-year return period of 4.7 m; the 10-year return period wave height was 5.4 m. The height was 5.7 m for a 100-year return period [35]. These values are lower for than the adjacent shoreline (east of Watch Hill Point, Figure 1), suggesting some reduction in wave energy relative to the RISS. Modelled wave heights (NACCS) are slightly lower at the east and west ends of the barrier; the calculated heights were 4.8 m for the east and west ends of the barrier during a 100-year return period storm. Two small groins were installed near the east end of the barrier, one on the southern (Block Island Sound) shoreline (100 m long, installed between 1948 and 1951) and one on the northern (Little Narragansett Bay) shoreline (160 m long, installed between 1945 and 1951) (Figure 1). Patterns of shoreline change suggest that longshore transport is towards the west on the southern shoreline and to the east on the northern shoreline. The longest sea-level record in southern New England is from the Newport, Rhode Island tide gauge (50 km northeast of Napatree (Figure 1)), with monthly mean sea-level values dating to 1930 (Figure 2). Linear regression through the data shows a reported rate of sea-level rise of 2.83 ± 0.16 mm yr−1 [36]. Two stations closer to Napatree with shorter records (New London, CT, 20 km northwest; 2.72 ± 0.21 mm yr−1 (1938–2020); Montauk, NY, 30 km southwest; 3.41 ± 0.25 mm yr−1 (1947–2020)) [37,38] show good correlations with the Newport gauge (see supplemental Figure S1) suggesting a regional rate of sea-level rise of ~3 mm yr−1 since 1930. Analysis of the record suggests the rate of sea-level rise at the Newport tide gauge has increased: between 1984 and 2014, it reached 4.1 mm yr−1 [39]. The 30 year trend suggested by Carey et al. [39] is consistent with the measured global rate of sea-level rise since 1993 (3.3 ± 0.4 mm yr−1) [40] coupled with the vertical crustal motion of the region (−0.9 mm yr−1) [41].
Previous studies have documented the historical shoreline change of the Rhode Island shoreline, including NPCA, the results of which are summarized in Table 1. Shoreline change values are reported here as negative when the shoreline migrated landward and positive when the shoreline migrated seaward. Boothroyd and Hehre [24] reported the overall shoreline change rates as the net movement between 1939 to 2004, with a mean of −1 m yr−1. Hapke et al. [25] utilized T-sheet shorelines to extend the analysis to include the period between 1883 and 2004, and based on a linear regression of the shorelines, the average shoreline change was similar at −0.8 m yr−1. Hapke et al. [25] also reported a short-term shoreline change between 1975 and 2000 of +0.4 m yr−1. Boothroyd et al. [23] and Boothroyd and Hehre [24] reported the highest rates of shoreline change. Boothroyd et al. [23] calculated the rate using the most seaward shoreline in their study (1939) and the most landward shoreline (1975) based on the shoreline change envelope calculation in the Digital Shoreline Analysis System (DSAS), and the average rate for Napatree barrier was −1.4 m yr−1. Boothroyd and Hehre [24] reported a similar rate between 1939 and 1985 (Table 1).
2.2. Storm History
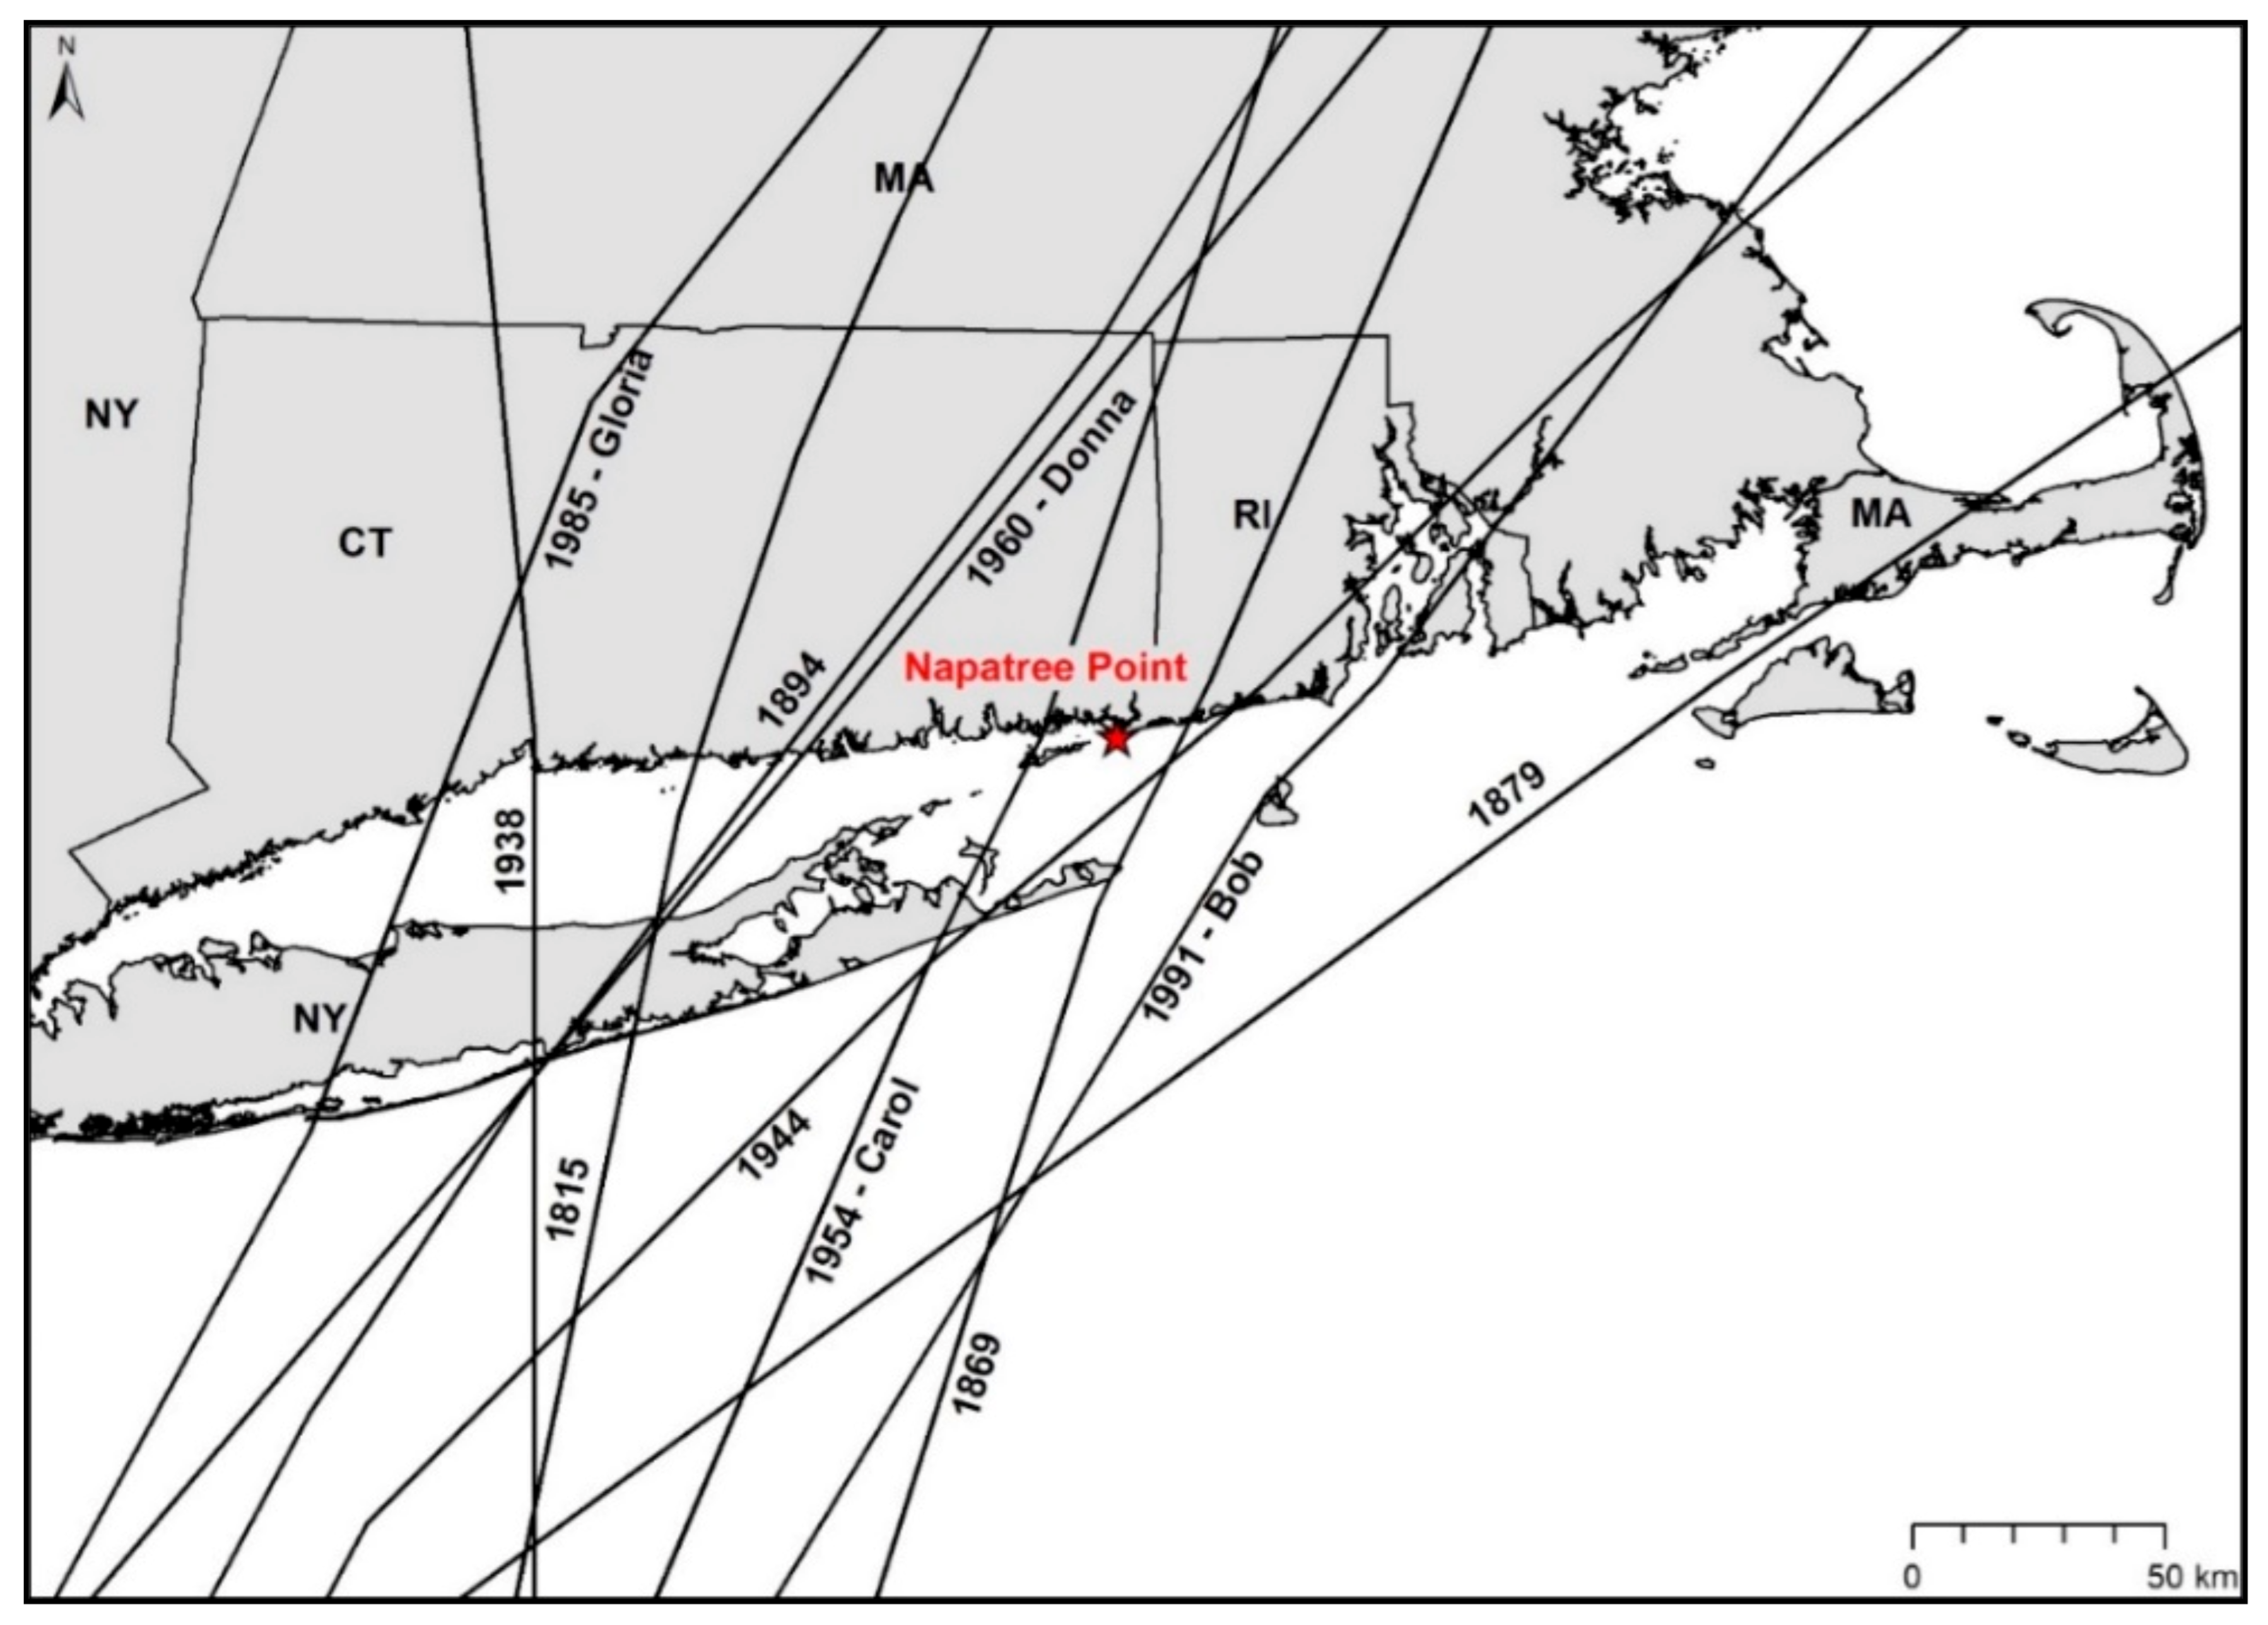
Detailed summaries of the storm history of Southern New England and adjacent Long Island, NY [42,43,44,45] coupled with historical storm tracks (1860 and 2018) [46] and the water-level record at the Newport, RI tide gauge provided the basis for compiling the storm history for the NPCA (Figure 3). Ten hurricanes made landfall within 200 km of Napatree during the study period (1883–2014) (Figure 4). Prior to the first shoreline map (1883), a hurricane made landfall 20 km east of Napatree in 1869; however, little damage was reported west of landfall (Ludlum, 1963). Category 1 hurricanes passed offshore or well to the east of Napatree in 1916, 1924 and 1936; one tropical storm made landfall in 1936 near the track of the 1938 hurricane [25,46]. The storm of record for the area is the hurricane of 1938, making landfall on 21 September 1938 approximately 200 km west of Napatree, placing the top right quadrant of the storm along the southern New England coastline. The 1938 hurricane caused widespread erosion of shorelines from Long Island, NY to Cape Cod, MA [26,47,48]. Storm surge measured at the Newport tide gauge was 2.9 m above MHHW. Impacts of the 1938 storm along the Rhode Island shoreline are summarized by Nichols and Marston [26] and Brown [48]. Napatree barrier was breached near the eastern end (Figure 1 and Figure 5), forming an inlet which was subsequently filled by the town of Westerly [26]. The Sandy Point barrier, which extended north off the western end of Napatree Point, was also breached, and the formation of the inlet initiated the 1.5 km northern migration and rotation of Sandy Point barrier to the current location (Figure 1). The period from the 1938 hurricane to the Ash Wednesday storm of 1962 (inclusive) included two landfalling hurricanes (hurricane of 1944—surge elevation 1.2 m MHHW; and Hurricane Carol, 1954—surge elevation 2.1 m MHHW). Hurricane Carol (Figure 5) overwashed barriers along the Rhode Island south shore [49,50]. Other notable storms include the Ash Wednesday Hurricane of 1962 [51], the ‘Blizzard of 1978’ [52], Hurricane Gloria (1985) [53], Hurricane Bob (1991) [54], The Halloween Nor’Easter (1991) [55], a December 1992 extra-tropical storm [56], the Patriot’s Day extra-tropical storm (April 2007) [57], Tropical storm Irene (2011) and Superstorm Sandy (2012) [58].
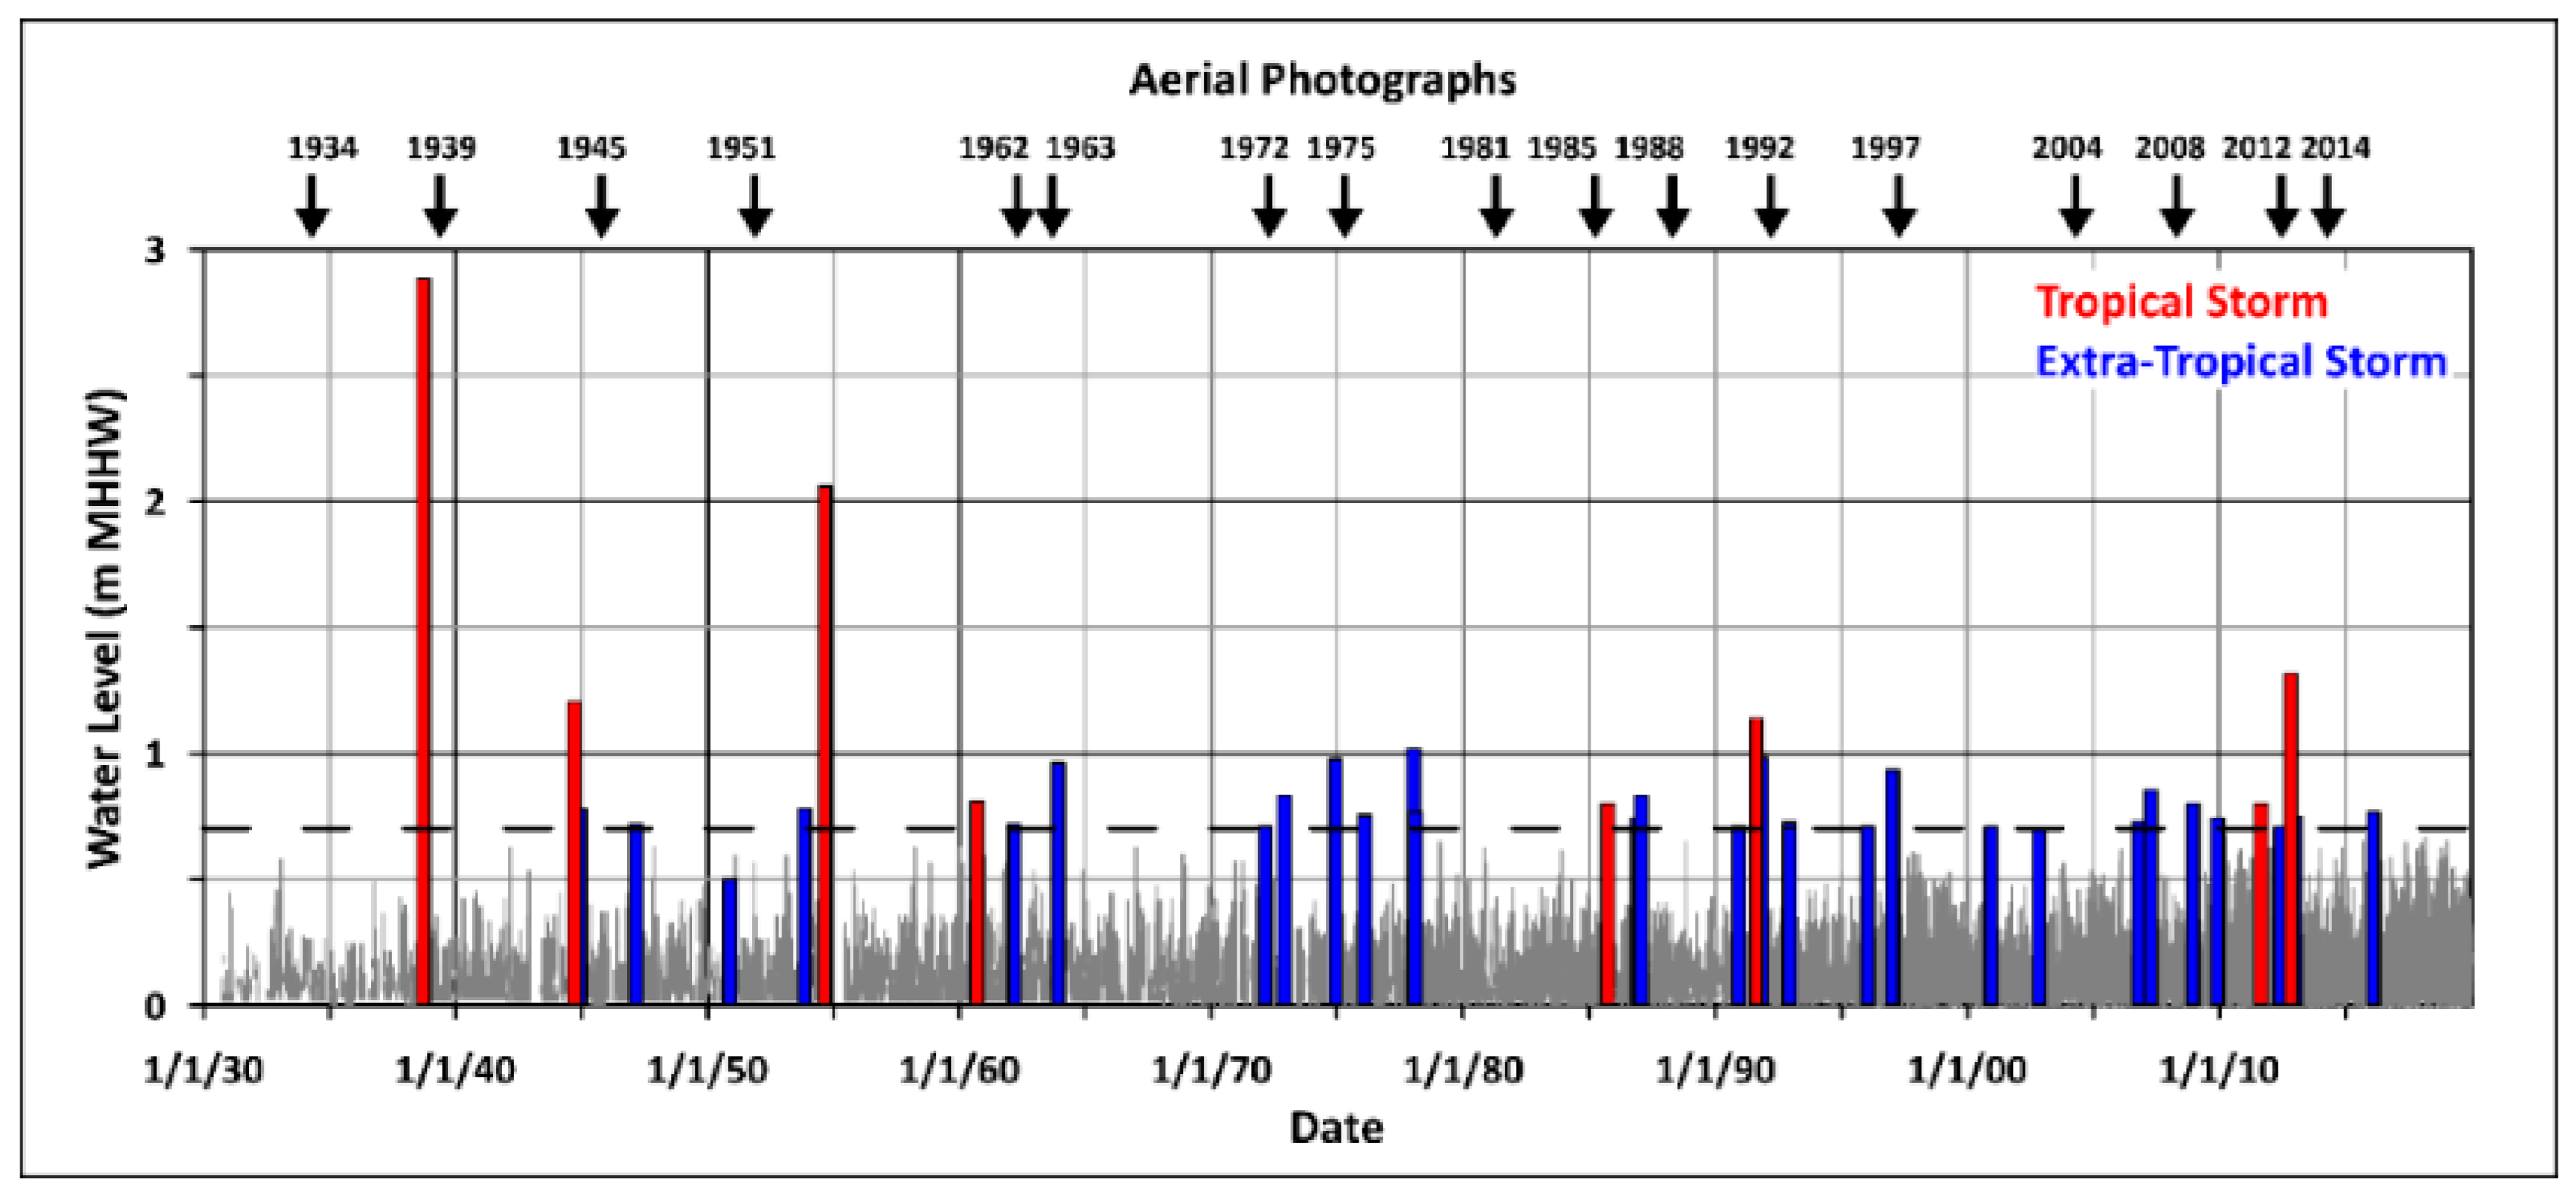
The review of historical storms was supplemented with an analysis of water levels at the Newport tide gauge. Zhang et al. [6,59] identified storms where the water level exceeded two standard deviations, and this approach was modified slightly to use here. Analysis of the water levels at the Newport tide gauge showed two standard deviations is 0.8 m MHHW; however, this threshold value excluded several notable storms (Blizzard of 1978, December 1992), so the value was lowered to 0.7 m MHHW. The selected water level coincides with a storm with a return period of 4 to 5 years based on the annual exceedance probability curves for the Newport tide gauge [60]. Water levels at the Newport tide gauge exceeded 0.7 m MHHW 38 times between 1930 and 2018 (Figure 3). The storm water levels are summarized in Table S1 in the supplemental materials.
2.3. Shoreline Change Data
The primary data used to document changes in position of the Napatree barrier were historical high-water line shoreline positions [24,25,63] (Table 2). Shorelines were derived from T-Sheets (1883 and 1948), georeferenced vertical aerial photographs (1939, 1951, 1963, 1975, 1985 and 1992) and digital orthophotographs (2004, 2012 and 2014). Shoreline positions and annualized end-point rates using previously published shorelines [24,25,63] were reanalyzed at transects spaced 50 m alongshore relative to an onshore baseline. Reanalysis involved the inclusion of the 1883 and 1948 T-Sheets, which were not used in the original study by Boothroyd et al. [23], and examining individual shoreline pairs (e.g., 1883 and 1939; 1939 and 1948). Shoreline positional uncertainty was assessed in the original mapping by Hapke et al. (2010); Boothroyd and Hehre (2007); and Boothroyd et al. (2016). Total positional uncertainty (Up) of a shoreline at each transect was calculated in these studies as the square root of the sum of five relevant uncertainty terms squared (Equation (1) for NOS T-Sheets; Equation (2) for historical aerial photographs)
Up = √(Ug2 + Ud2 + Ut2 + Upd2)
Up = √(Ug2 + Ud2 + Ua2 + Upd2)
These relevant terms include: georeferencing uncertainty (Ug), digitizing uncertainty (Ud), T-sheet uncertainty (Ut), aerial photograph uncertainty (Ua) and uncertainty in the position of the high-water line (Upd) [25]. The total positional uncertainties for these shorelines are reported in Table 3. The uncertainty of the end point change between two shorelines (Upair) was taken the square of the sum of positional uncertainty of the two shorelines (Equation (3)), and these were calculated as annualized rates (Ur) by dividing that results by the number of years between shoreline surveys (Equation (4)). Linear regression was applied to the shoreline positions for comparison with the long-term (1883–2004) shoreline change rates of Hapke et al. [23]. Barrier width was measured at each transect as the straight-line distance between the last high-tide swash shoreline of the bayside and ocean sides of the barrier.
Upair = √(Up12 + Up22)
Ur = Upair/(year2 − year1)
2.4. Historical Aerial Photographs
Historical vertical and oblique aerial photographs, including photographs not used in the original shoreline mapping [23,24,25], were analyzed (Table 2). These photographs were not added to the shoreline database due to a combination of scale, photo quality (i.e., ability to distinguish a high-water line), poor georeferenced accuracy or high wave energy at the time of image collection; however, the images were still suitable for qualitative analysis of barrier morphology and vegetation cover. Vertical aerial images were georeferenced in ESRI ArcMap to the 2014 U.S. Geological Survey digital orthophotographs for qualitative comparison, and images were examined to document historical changes in geomorphology—notably, the presence of washover fans and/or the presence of dune vegetation. Additionally, context on pre- and post-1938 hurricane conditions was determined from oblique aerial photography (Figure 5).
3. Results
3.1. Shoreline Change
Analysis of subsequent shoreline pairs between 1883 and 2014 shows that the rate and magnitude of shoreline change on the Napatree varied over time, particularly following a major storm event that removed the foredune and overwashed the entire barrier. Shoreline change rate was lower and even slightly accretional during a subsequent period of foredune recovery. The results here show the changes between transects 20 and 50 located on the barrier and outside the influence of the groins. The average changes, maximum change, minimum change and annualized rate of change are summarized in Table 4. Transects 51 to 60, while located on the barrier, were not considered in the analysis, as the width has been altered by the installation of the groins and the construction of a concrete seawall on the bayside of the barrier adjacent to the parking lot.
The shoreline change data (1883–2014) (Table 4) show that retreat of the Napatree barrier varied over time, with little change between 1883 and 1939, followed by landward shoreline migration between 1939 and 1975 and another period of little to no net change in position between 1975 and 2014. Figure 6 shows the shoreline positions for the entire Napatree Barrier over time. Figure 7 represents the average position of the barrier. Average landward migration of the shoreline here is reported as the change in distance from the baseline rather than the annualized rate. The error bars shown represent the standard deviation of the distance from the baseline for an individual shoreline between transects 20 and 50. These standard deviations are similar in magnitude to the shoreline positional uncertainty (see supplemental Table S2 for standard deviations).
The average retreat of the Napatree barrier between 1883 and 1939 was −9.4 m, which falls within the positional uncertainty of the shoreline pair (+/−13.4 m) (Table 4). Individual transects reported values ranging from essentially no change (+/−<3 m) to more than −20 m of change near the western end of the barrier (Figure 6). Examining the sequential shoreline pairs beginning in 1939 shows the highest overall amount of landward migration occurred between 1939 and 1948, with an average of −24.1 m of change along the barrier (−2.7 m yr−1) and individual transects recording changes of more than −30 m. This was followed by average retreat of −13.4 m between 1948 and 1951 (the same value as the uncertainty of the shoreline pair), although some transects showed > 22 m of retreat. A groin was installed between 1948 and 1951 on each side of the barrier at the east end (Figure 1) and appears to have impacted the shoreline position between transects 51 and 56 (Figure 6). The shoreline continued to retreat between 1951 and 1963. The average migration was 18 m (−1.5 m yr−1). Western portions of the barrier retreated > −35 m. Retreat of the shoreline continued between 1963 and 1975. The average change was −10.1 m, and parts of the barrier retreated > 15 m. Overall, between 1939 to 1975 the shoreline retreated an average of −69.5 m, and some transects saw > −77 m of change. The average annualized shoreline change rate was −1.9 m yr−1. These rates are substantially higher than other previously published rates of shoreline change (Table 1) [23,24,25]. The 1975 shoreline represents the most landward shoreline recorded. The shoreline position has fluctuated between 1975 and 2014 (largely within the uncertainty); however, the 2014 shoreline remains seaward of the 1975 shoreline along most of the barrier (Figure 6 and Figure 7), suggesting the shoreline has been neutral to slightly progradational since 1975. These results match the reported short-term change between 1975 and 2000 (+0.28 m yr−1; Table 2) derived from aerial photographs and airborne LiDAR as part of the national shoreline assessment [25].
3.2. Barrier Width
The variations in barrier width largely do not fall outside of the shoreline position uncertainties, so these results coupled with the aerial photographs should be viewed as qualitative. The average width of the barrier varied over time, ranging from <80 m to >105 m (Figure 8). The narrowest transects were measured in 1883 at transects 39–44 (average 56 m); the widest transects occurred near the groins near the eastern end of the barrier, >220 m at transect 53 in 2011 and 2014. Averaging the width of the barrier between transects 20 and 50 (outside groin influence) showed an increase in width between 1883 and 1963 and a slight decrease in width after 1963. In addition, there was an increase in width between 2004 and 2014 (red triangles, Figure 8). The width of the barrier at transects 26–30 is impacted by the migration and eventual welding of the small spit on the bayside of the barrier (visible in Figure 1, Figure 6 and Figure 9 and the supplemental materials); this is most apparent in the 2011–2014 shorelines. This resulted in an anomalously wide barrier in the 2011–2014 shorelines. The widening at transects 26–30 was not related to overwash and washover fan deposition, which is the inferred process that widened the barrier between 1939 and 1963. Excluding these transects (26–30) shows a decrease in barrier width between 1963 and 2014 (Figure 8).
3.3. A Review of the Aerial Photography
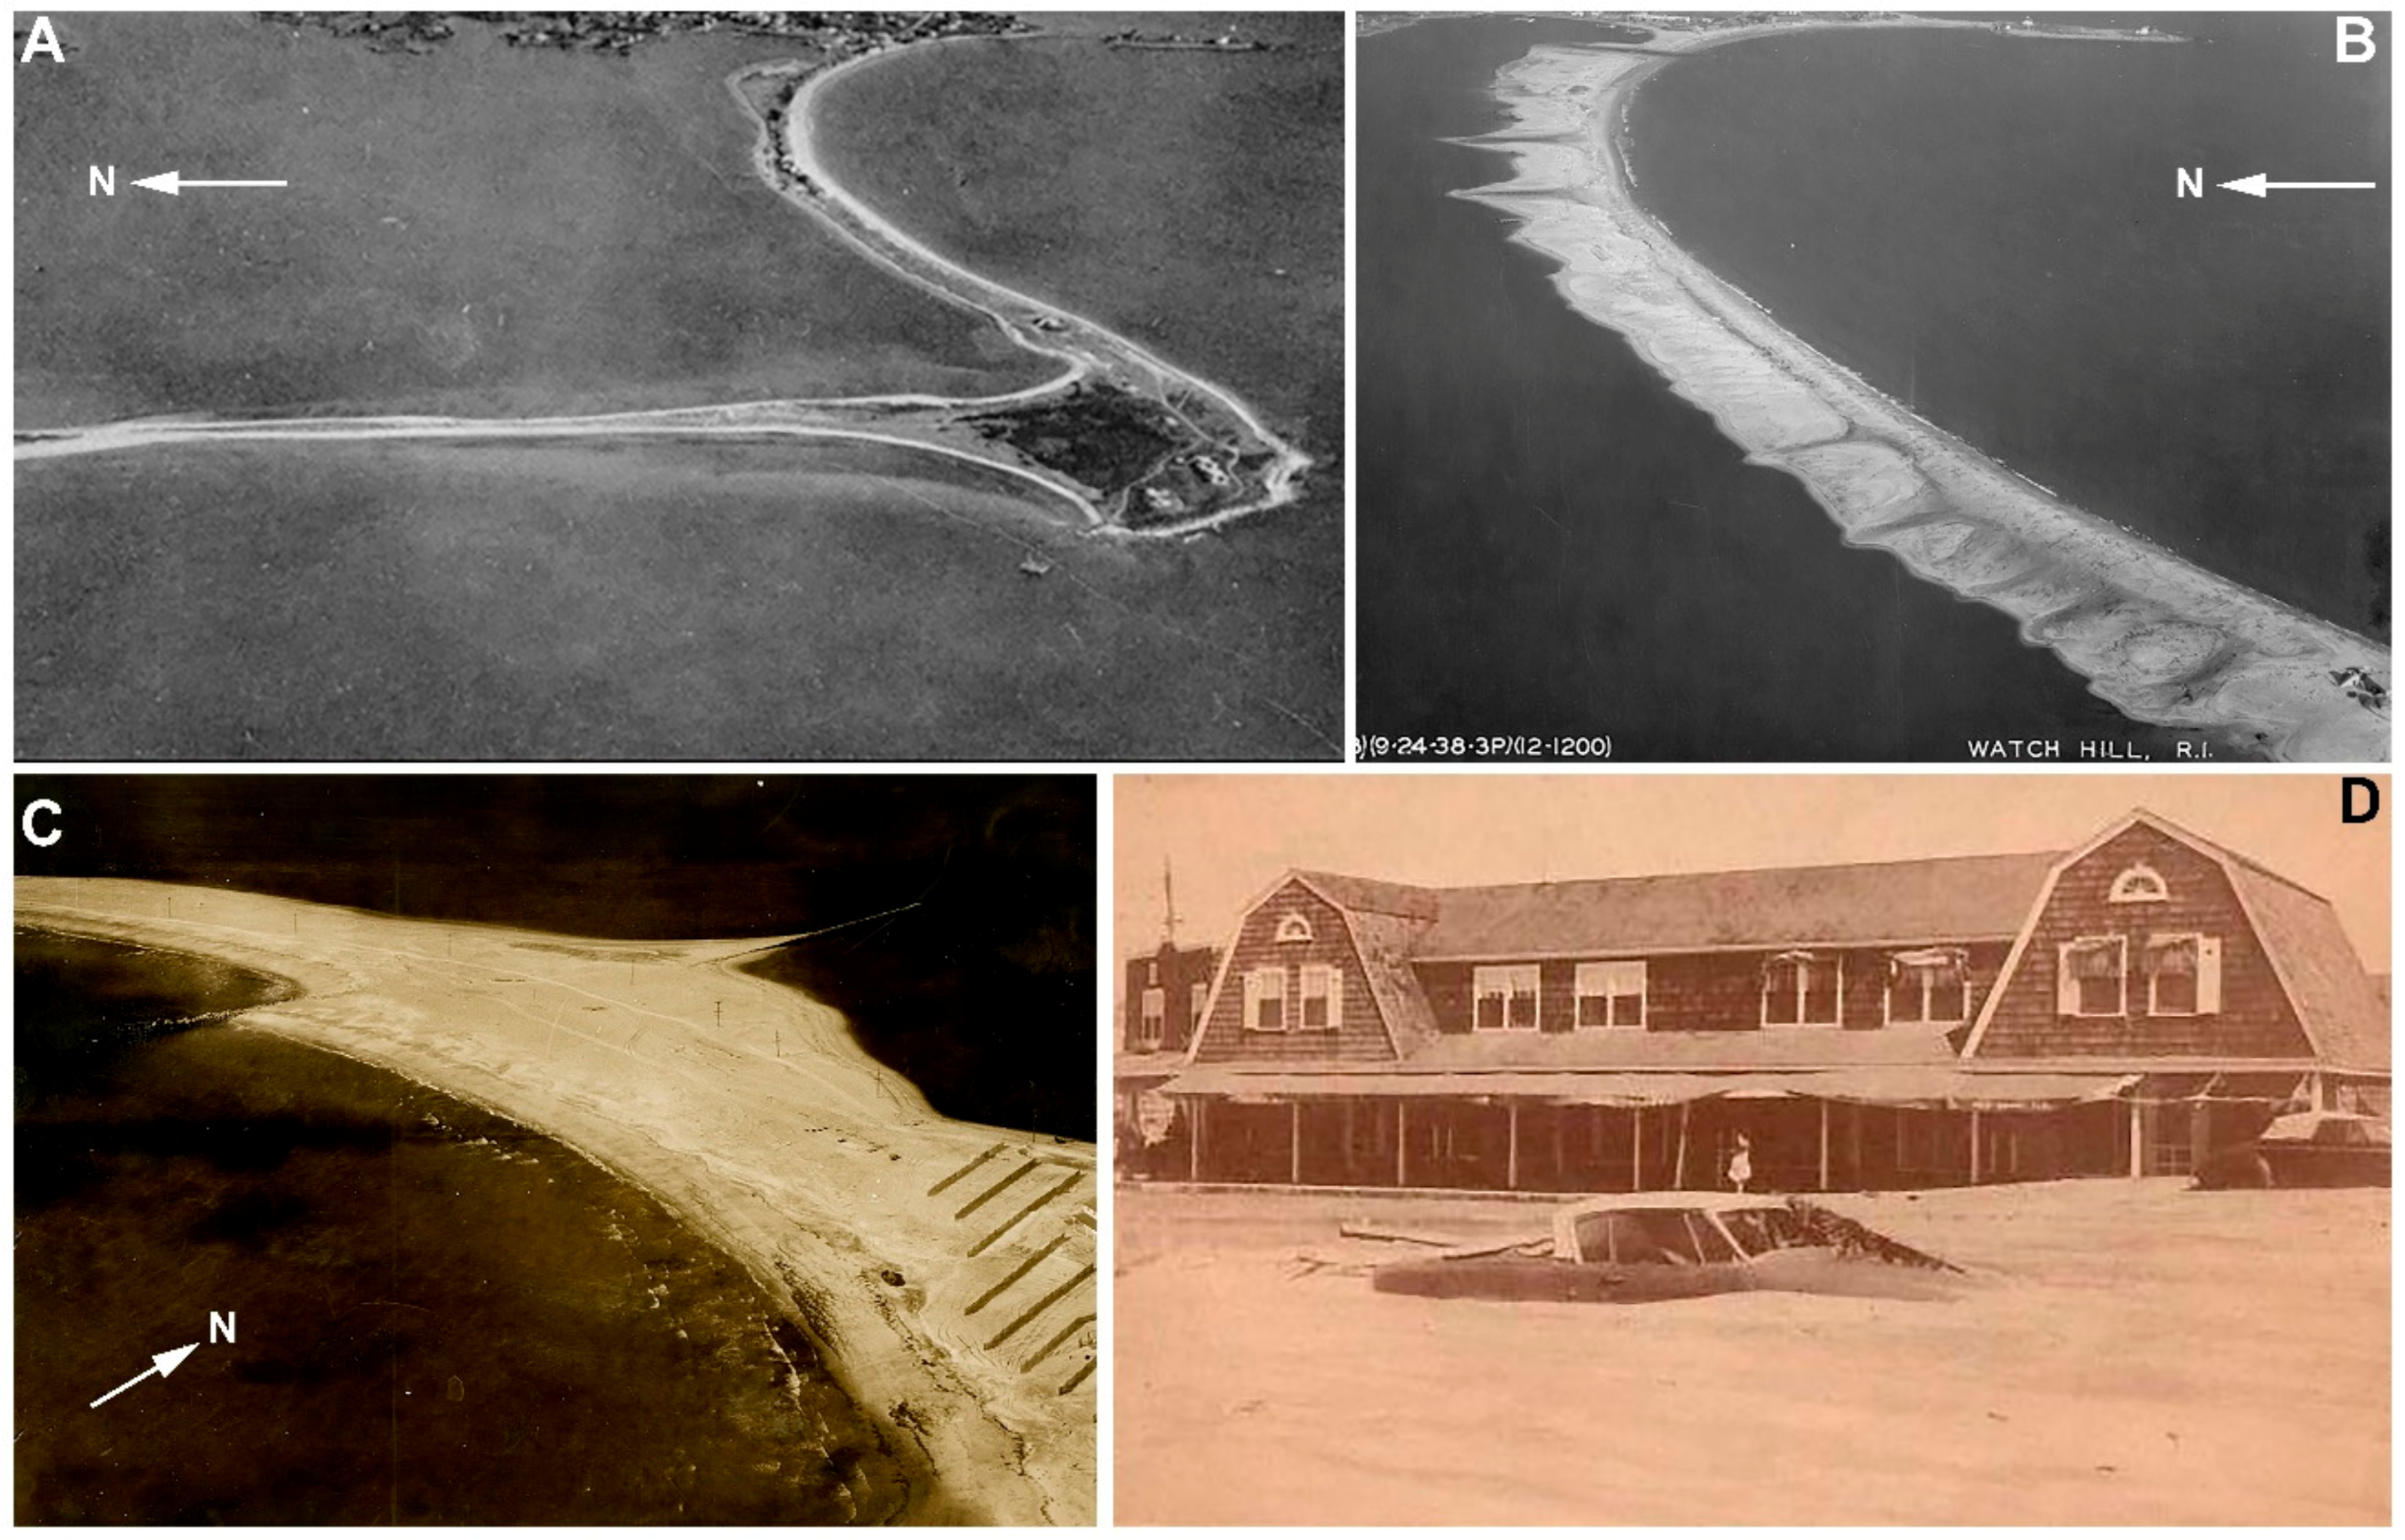
Historical vertical aerial photographs (n = 19) from between 1934 and 2018 were examined for evidence of storm impacts. Figure 9 shows selected aerial photographs from 1934 (partial coverage of 830 m of the east end of the barrier), 1939, 1951, 1963, 1975, 1985, 1992 and 2014. All aerial photographs are available in the online supplemental materials. The road and houses that extended down the barrier are clearly visible in the 1934 (Figure 9) vertical aerial and 1936 oblique images (Figure 5A). Dune vegetation is visible between and behind houses, and while foredune height and continuity cannot be determined from these images, the 1936 oblique image (Figure 5A) shows that a single foredune ridge existed on the barrier, which was particularly well-formed along the western end and in front of some of the cottages. No evidence of recent overwash is visible in these photos. An oblique aerial photograph of the barrier was taken 3 days after the 1938 hurricane [64] and shows complete overwash of the barrier (Figure 5B) with numerous surge channels visible.
The first complete set of vertical aerial photographs of Napatree Point was collected in May 1939, 8 months after the hurricane of 1938 (Figure 9). The 1939 images show fresh (unvegetated) washover fans deposited across the barrier and into Little Narragansett Bay. Penetration distance across the barrier of the overwash is >100 m. The inlet formed in the eastern corner of the barrier (Figure 1) [26] had been filled in by this point; however, the inlet along the southern end of Sandy Point (Figure 1) remained open, and Sandy Point had begun to migrate to the north. Following the 1938 hurricane, the next photographs were collected in October 1945, one year after a hurricane in 1944. These photos also show fresh (unvegetated) washover fans along most of the barrier (See Supplemental Materials). Some patchy dune vegetation is visible on the western 100 m and eastern 500 m of the barrier, suggesting that some portions of the barrier may not have been overtopped completely. This pattern of some vegetation surviving along the western and eastern ends of the barrier was repeated in the November 1951 photographs (Figure 9), which were collected 1 year after a November 1950 extra-tropical storm. Vertical aerial images were not collected following Hurricane Carol (1954), so the direct assessment of impacts on Napatree Point Conservation Area could not be determined; however, significant overwash was photographed in the parking lot and road adjacent to the east end of the barrier (Figure 5C) [62].
April 1962 images collected 39 days after the Ash Wednesday storm show near complete overwash of the barrier, with again the exception being the eastern 500 m of the barrier. Images collected in September 1963 still show evidence of overwash (Figure 9); however, more dune vegetation is visible as compared to the 1962 images, suggesting that the barrier was beginning to recover from the Ash Wednesday storm. The next images available were collected in April 1972, and these show dune vegetation along the entire barrier, although some areas may show some minor washover fan deposition, possibly relating to an extra-tropical storm in February 1972 extra-tropical storm. April 1975 and 1976 (exact date unknown) imagery shows some unvegetated washover fans, although penetration distance across the barrier was a few 10s of meters, and largely focused near trails crossing the dune (Figure 9). These washover fans are likely related to extra-tropical storms in November 1972 and December 1974. The pattern continues in images collected in 1981, which show some slight overwash in the center of the barrier with penetration depth < 30 m. These images were collected three years after the Blizzard of 1978, which caused extensive erosion and overwash along much of the northeast [52]. Images taken in 1985 show no evidence of overtopping or overwash, and dune vegetation is visible along the entire barrier. April 1988 images show some slight overwash at trails crossing the dune, likely the result of Hurricane Gloria (September 1985), which produced washover fans elsewhere along the RISS [53].
March 1992 imagery shows moderate overwash of the western half of the barrier, with penetration of less than half the width of the barrier (30 to 40 m). These images were collected after Hurricane Bob (August 1991) and the Halloween Nor’easter (October 1991), so the impact of each individual storm cannot be parsed out; however, this shows the cumulative impact of these storms. Images collected after 1992 (1995, 1997, 2004) show no evidence of washover fan deposition. June 2012 images collected 292 days after Tropical Storm Irene (August 2011), show one small (25 m wide, penetration distance < 15 m) washover fan, although evidence of frontal erosion of the dune is seen as a retreat in the edge of vegetation. No vertical aerial photographs were collected following Hurricane Sandy (October 2012) for Napatree Point; however, oblique aerial images from March 2013 show the western half of the barrier was overwashed, and he eastern half largely showed evidence of frontal erosion of the dunes of up to 13 m (see 2014 images in the supplemental materials). Oblique aerial images collected by the author in August 2013 show little in the way of visible washover fans, and field observations at that time show rapid revegetation of the limited areas that were overwashed. Two sets of images collected in 2014 by the USGS (April) and NOAA (August) show little evidence of the Sandy overwash and most areas that saw washover fan deposition were revegetated, except for some isolated patches near the west end of the barrier (Figure 9).
4. Discussion
The combination of a historical aerial photograph review and shoreline change analysis provides a semi-quantitative summary of the impacts of storms on the Napatree Barrier. This combination of datasets allows for a review of historical storm events and the resulting impacts on the barrier. The results highlight the importance of storm timing and frequency relative to the timescale of foredune recovery. Based on storm surge elevation and regional coastal impacts, the most substantial storm to impact Napatree and the shoreline change analysis during the study period, was the 1938 hurricane. Washover fans are clearly visible in both oblique (Figure 5 and Figure 9) and vertical aerial photographs following the 1938 hurricane. The post-storm photographs and 1939 vertical aerial images show complete removal of the foredune (and houses) along the barrier. While the historical photographs show clear impacts to the barrier, the net retreat of the shoreline over this period is less clear. Individual transects between 1883 and 1939 show changes ranging from essentially no change (+/−<3 m) to >20 m of retreat near the western end of the barrier (Figure 6). The average change along the barrier between 1883 and 1939 was −9.4 m. This falls within the positional uncertainty of the shoreline pair (+/−13.4 m; Table 4), so it cannot be said conclusively that the hurricane of 1938 produced net migration of the shoreline. The spring 1939 photographs were taken 236 days after the storm, so it is likely the active beach had largely recovered, and the high-water line position would not be considered storm impacted. The 1938 hurricane was likely the first time the barrier had been overwashed in at least several decades, so the dunes were likely well developed prior to the storm, and a vegetated foredune is visible in the 1934 and 1936 images (Figure 5 and Figure 9).
Aerial photographs were not collected between 1939 and the 1944 hurricane, so the condition of the barrier and levels of dune recovery and revegetation cannot be assessed. Dune recovery when a barrier is completely overwashed can take up to a decade [65], so complete recovery following the 1938 hurricane was unlikely prior to the 1944 hurricane. Vertical aerial photographs from 1945 show that Napatree was overwashed presumably during the 1944 hurricane. The 1945 imagery was not used as part of the shoreline change analysis, as the photos were ‘washed out,’ and delineating a high-water line was problematic. Between 1939 and 1948, the shoreline retreat exceeded the positional uncertainty of the shorelines, with an average change of −24.1 m and a maximum change of −30.7 m (Table 4). The measured shoreline change, coupled with the washover fans visible in the 1945 imagery suggests that the 1944 hurricane resulted in a net migration of the barrier. A similar response was seen in 1951 imagery and the 1948 to 1951 shoreline pair. Fresh washover fans are visible in 1951 imagery, and the shoreline change between 1948 and 1951 averaged −13.4 m (the same value as the positional uncertainty); however, some transects exceeded −22 m of change (Table 4). Water levels at the Newport gauge did not exceed the storm threshold between 1948 and 1951. An extra-tropical storm in late November 1950 produced a 0.85 m storm surge; however, the storm peaked after high tide, so the maximum water level recorded was 0.5 m MHHW at the Newport tide gauge. Water levels were higher to the west of Napatree, peaking at 1.4 m MHHW at New London and 0.9 m MHHW at Montauk, suggesting that impacts of this storm were more substantial in western Rhode Island and eastern Connecticut. Elsewhere, the November 1950 extra-tropical storm produced washover fans and caused substantial damage along the New Jersey coastline [43]. Following the hurricane of 1944 coupled with an extra-tropical storm in 1947, foredune recovery was limited and the barrier remained low enough to be overwashed during this storm.
Aerial images were not collected between 1951 and 1962, so the impacts observed over that period are the cumulative results of Hurricanes Carol and Edna (1954), Hurricane Donna (1960), an extra-tropical storm in 1953 and the Ash Wednesday Storm (1962), among other smaller extra-tropical storms. As a result, the impacts of individual storms cannot be parsed out; however, the net result was migration of the barrier that exceeded the positional uncertainty. A shoreline was not derived from the 1962 shoreline, as it was considered too soon after the Ash Wednesday storm (39 days); however, between 1951 and 1963 the shoreline retreated an average of −21.9 m, with a maximum change of −38.9 m (Table 4). The timing of these storms following the 1950 extra-tropical storm continued to hinder foredune recovery, and each storm event that overwashed the barrier essentially reset the clock on dune recovery. The shoreline continued to retreat between 1963 and 1975 (average change −10.1 m; maximum change −15.7 m); however, the aerial photography shows that vegetation was largely reestablished at this point and migration via overwash had largely ceased, and it appears the barrier was narrowing. Barrier width increased between 1883 and 1963 and decreased between 1963 and 2016. The combination of shoreline change data and observations from the aerial imagery suggests that the increase in width was likely driven by the overwash of the barrier and deposition of washover fans on the back-barrier. Increased width via overwash and washover fan deposition was also noted in field surveys after the 1938 hurricane [26].
While the 1938 hurricane produced appeared to produce little net change in shoreline position compared to 1883, storms’ impacts on the barrier were the impetus for the migration of the barrier that occurred between 1939 and 1975. The removal of the foredune increased the susceptibility of the barrier to overtopping in future storms, which allowed subsequent storms that likely would not have overwashed the barrier to overtop the partially recovered foredune, and deposit washover fans on the back barrier, ‘rolling over’ the barrier. The combination of field and LiDAR measurements provides insight into the elevation recovery from a moderate event (Hurricane Sandy). The majority of the Napatree barrier just exceeds the pre-Sandy volume and elevation 5.5 years after the storm, suggesting recovery from this event where the foredune was not completely removed took ~5 years [65]. Most of the vegetation was reestablished on the back barrier within 1 year following Sandy (as seen in 2014 aerial images and 2013 field surveys), and this pattern was likely repeated in smaller past storms, where washover was limited to a few 10s of meters across the barrier and dune vegetation can reestablish quickly.
No storm exceeded the threshold at the Newport tide gauge between November 1963 and December 1974. This 11-year period apparently allowed the dunes to recover enough elevation and volume to prevent wide-spread overwash of the barrier in subsequent moderate storm events. Based on the rates of recovery of the dune measured since Sandy [65], the foredune could have recovered ~1 m of elevation and ~30 m3 m−1 of volume during that period. This is supported by work on other barriers, where recovery periods of <5 years to >10 years have been reported following storms that completely overwash the barrier [64,66,67]. It remains unclear if management practices (i.e., sand fences) were utilized in the study area in the past, and if so, how they impacted dune formation and recovery between 1963 and 1975. Sand fences have clearly been used along the eastern end of the barrier over the last few decades, with multiple levels to build the foredune up to 8 m (MLLW) just west of the groins. The overall increase in dune height from west to east along the barrier was likely driven by a combination of some sand fencing and sediment availability and the prevailing wind direction; the dominant wind directions are southwest (spring/summer) and northwest (fall/winter), both of which transport sand towards the eastern end of the spit. This likely explains the partial recovery and revegetation of the eastern 500 m of the barrier prior to 1975, which limited overwash in these areas. There is no record of beach replenishment at this site; the exception to this is filling of the inlet breach at the eastern end of the barrier following the 1938 hurricane.
Subsequent storms, including the Blizzard of 1978, which caused extensive erosion elsewhere in New England, did not appear to cause widespread overwash, and no localized overwash was apparent in 1981 aerial images (See supplemental materials). A similar response was observed for Hurricane Gloria (1985), which overwashed other areas of the RISS [53], and the combined impact of Hurricane Bob and the October 1991 extra-tropical storm, which had limited overwash of the dunes and localized washover fan penetration of 10 s of meters. Hurricane Sandy (October 2012) had a similar storm surge elevation as the 1944 hurricane, yet it in little change in position of the barrier. Overwash was limited to the western portion of the barrier, washover fans only extended across the barrier in a few locations and the eastern portion of the barrier remained largely in the collisional regime of Sallenger [68]. The 1944 hurricane had a greater impact because the barrier (specifically the foredune) had not recovered from the 1938 hurricane; the same storm event, if the foredune had fully recovered, would likely not have produced the same impacts on the barrier. Houser et al. [64,66] showed that a more erosive storm being followed by smaller storms can produce a larger cumulative impact and result in substantial shoreline retreat. The 1938 to 1975 period falls into the ‘best-case’ scenario of Houser et al. [64], where storms were clustered, followed by periods of recovery. Under these conditions, transgression is rapid, and dunes are small and discontinuous during the periods of storminess; however, the subsequent period of quiescence allows for the dunes to reestablish, and eventually return to pre-storm height [64]. Fenster and Dolan [7,69] reported a reversal in shoreline change trends, from a seaward migration to more landward migration between 1930 and 1970. This period of increased shoreline change was attributed to storm frequency—notably, an increase in extra-tropical storm frequency. The trend reversed (switched from erosional to accretional) around 1967–1968 [69], which falls between available aerial photographs for Napatree (1963 and 1972/1975). Donnelly et al. [43] reported a similar response to what occurred with the storms discussed here—overwash and washover fan deposition on back barrier salt marshes of Brigantine Island in New Jersey (250 km west of Napatree) in 1944, 1950 and 1962. This suggests that the paraglacial isolated and welded Napatree barrier behaved similarly to the barrier island chains along the Mid-Atlantic coast of the U.S.
Shoreline change rates calculated between 1939 and 1975 were higher than previously published for the Napatree Barrier (Table 1). The annualized rates calculated by Boothroyd et al. [23] between 1939 and 2014 and the USGS long term rate between 1883 and 2004 [25] are less than half the annualized rate observed at Napatree between 1939 and 1975 (Table 1). The USGS assessment [25] also included a short-term shoreline change rate for the period between 1975–2000, with reported shoreline change values reflecting progradation of the shoreline. The average (end point) rate was +0.4 m yr−1 for that period (Table 1). Taken together, this suggests that the long-term shoreline change rates underestimate actual rates of change, which are an order of magnitude higher following a large storm event. While long-term shoreline change rates may produce a better mean representation of the long-term trend [70], the observed shoreline migration between 1939 and 1975 are indicative of the change that can occur during a shorter interval with several impactful storms. This does not suggest that the storms are outliers; rather, if the shoreline migration occurs during a cluster of storms, the annualized rate of change is reduced by spreading the change out over a longer time with limited storm activity.
Coastal construction setbacks in Rhode Island are based on the shoreline change rates between 1939 and 2014. Specifically, the setback was calculated as 30× the long-term erosion rate. These rates do not include additional components to account for storm impacts [71]. The results of this work show that on this shoreline these rates are likely underestimated if a barrier experiences a series of significant storm events and can exceed the long-term trend here by a factor of three or more. Zhang et al. [6] argued that including storm-influenced shorelines in long-term shoreline change calculations leads to an overestimation of rates of shoreline change and could have consequences on coastal development based on setbacks. However, where storms drive the observed rates of change and dominate the shoreline change signal, the inverse would potentially be of more consequence, as setbacks calculated using low rates of change fail to calculate the actual risk to coastal properties over time. While the Napatree barrier is currently undeveloped, a hypothetical house constructed using the average long-term (1883–2014) shoreline change rate (−0.6 m yr−1) would face substantially more risk if a similar storm sequence that was observed beginning in 1938 were to occur. Separating the shoreline response to storms from the long-term shoreline change record and understanding the risk to coastal development remain challenges for coastal managers. Numerous studies have outlined the likely response of barriers to sea-level rise [12,13,14,15,17,47]. These impacts include an increased rate of landward migration, more frequent overwash with the rising sea level and increased storminess, increased frequency of breaching and inlet formation/widening. The period between 1938 and 1975 provides at least a partial analog for the potential responses of other barrier spits within the glaciated northeast to a period of increased storminess. Headland separated barriers occur elsewhere within New England in both wave dominated and mixed energy regimes, and along Nova Scotia and Northern Germany [28]. Understanding the responses of these types of barrier systems to storms and a rising sea level fills an important gap in knowledge, as much of the existing literature focuses on barrier islands, particularly along the mid-Atlantic coast of the U.S.
A conclusive cause and effect summary linking all the observed shoreline changes to individual storms is not possible given the positional uncertainty and short-term changes observed. The lack of randomization, replication and direct measurements following storms also limit direct cause and effect attribution of the shoreline change to individual storms. However, the combination of shoreline change analysis and historical aerial photography here suggests that much of the change observed was the result of washover fan deposition during storms, which led to migration of the barrier. Extrapolating the shoreline trend between 1883 and 1939 (dashed grey line in Figure 7), which is admittedly limited to two data points, or the period between 1975 and 2014, suggests that the subsequent shoreline positions have not returned to the long-term trend. The interpretation here is that the storms produced net migration of the shoreline. If the change in the shoreline was driven by some other long-term factor (i.e., sea-level rise or changes in sediment supply), the shoreline should return to the long-term trend following storms [6]. Higher rates of sea-level rise over the last 40 years [39] do not coincide with any measurable shoreline retreat, and even correspond with a period of progradation (within the positional uncertainty) between 1975 and 2014. The responses of barriers under various sea-level rise scenarios have been the focus of recent modelling efforts, and the dynamics of the foredune have been shown in models to impact barrier retreat—namely, when the dunes are low, barriers are more susceptible to overwash, leading to migration of the barrier [21]. This leads to episodic retreat of the barrier, followed by periods of relative stability in barrier positions when the foredune recovers sufficiently to limit overwash. These results, both shown here at Napatree, reinforce the relationship between dune recovery and storm frequency reported in recent modelling studies [21].
Discussion of storm impacts here does not negate the impact of sea-level rise on barriers; however, the cumulative impact of storms between 1938 and 1975 likely far outweighs any response due to sea-level rise. The transgression observed over the span of a few decades could be indicative of future behavior of headland separated barriers if storm frequency increases in the future. Relative sea-level rise increases the vulnerability of the dunes to erosion, and this would exacerbate the impacts of a similar stormy period in the future. This combination of storms and sea-level rise could cause the barrier to cross a geomorphic threshold and lead to faster rates of transgression. Under moderate to high rates of sea-level rise and given the relatively consistent (low) back-barrier slope, the Napatree barrier could experience ‘width drowning’ in which the rapid overwash and migration of the barrier would outpace sediment transport from the shoreface, leading to barrier narrowing and possible barrier loss over the next few centuries [15]. Napatree, like the rest of the RISS, is sediment-starved, with little modern sediment on the shoreface [32]. Incision into the underlying glacial deposits is possible; however, this process has not yet been performed for this shoreline. Due to lacking an abundant sediment supply, Napatree is susceptible to increased storm frequency/overwash. An additional sediment added to the barrier is from either erosion of the small bluff at the east end and/or transport from the shoreface and back barrier during transgression. Transport of the sediment down the Pawcatuck River into Little Narragansett Bay is likely not a significant contributor of sediment to the Napatree Barrier [72].
What the morphology of the Napatree barrier will look like if continued transgression causes the spit to detach from the western headland remains unclear. A possible response may be for the barrier to rotate clockwise to a more northeast to southwest orientation, similarly to the migration of the Sandy Point barrier (Figure 1). This would somewhat follow the model of Orford et al. [73], where barriers between glacial till headlands are breached, and switch from swash-aligned ones to ones where the barrier is oblique to the headland and rapid migration is driven by longshore sediment transport. Future research should focus on coring and geophysical studies to examine the properties of the shoreface, and observations of physical processes coupled with models would be helpful to quantify sediment transport pathways on the shoreface. Sediment transport on the northern side of the barrier, including exchange between the barrier and deposits related to the former position of Sandy Point, and sediment lost from the system around the west end of Napatree Point, remains unknown. While Napatree lacks significant back barrier marsh and is not part of a restricted coastal lagoon where loss of marsh due to accelerated sea-level rise may significantly alter tidal characteristics [17], inlet formation and widening could affect sediment distribution, including the transport of sediment from the barrier and adjacent shoreface to a flood-tidal delta [11]. Transport of sediment into the tidal delta represents loss to the subaerial barrier system, as the sediment remains there until transgression of the barrier reaches the tidal delta [11]. This loss of sediment would be problematic for a starved system, particularly if an inlet remained open long enough to develop a flood-tidal delta. The overall response of the barrier here is illustrative of the challenges barriers face in periods of increased storminess, and the importance of storm frequency relative to dune recovery. It represents an important case study when considering storms’ impacts on isolated, mainland attached barriers in future climate models.
Supplementary Materials
The following are available online at https://www.mdpi.com/article/10.3390/geosciences11080330/s1. Figure S1: Monthly sea-level elevations at the Newport, RI, New London, CT and Montauk, NY tide gauges. Figure S2: 1934 Partial vertical aerial photograph of the Napatree Barrier. Figure S3: 1939 Vertical aerial photograph of the Napatree Barrier. Figure S4: 1945 Vertical aerial photograph of the Napatree Barrier. Figure S5: 1951 Vertical aerial photograph of the Napatree Barrier. Figure S6: April 1962 Vertical aerial photograph of the Napatree Barrier. Figure S7: September 1963 Vertical aerial photograph of the Napatree Barrier. Original 9 × 9 Photograph scanned by Boothroyd and Hehre. Figure S8: April 1972 Vertical aerial photograph of the Napatree Barrier. Figure S9: April 1975 Vertical aerial photograph of the Napatree Barrier. Original 9 × 9 Photograph scanned by Boothroyd and Hehre. Figure S10: 1976 Vertical aerial photograph of the Napatree Barrier. Figure S11: April 1981 Vertical aerial photograph of the Napatree Barrier. Figure S12: March 1985 Vertical aerial photograph of the Napatree Barrier. Original 9 × 9 Scanned by Boothroyd and Hehre, 2007. Figure S13: April 1988 Vertical aerial photograph of the Napatree Barrier. Figure S14: March 1992 Vertical aerial photograph of the Napatree Barrier. Figure S15: Spring 1997 Digital Orthophotograph of the Napatree Barrier. Figure S16: April 2004 Digital Orthophotograph of the Napatree Barrier. Figure S17: Spring 2008 Digital aerial photograph of the Napatree Barrier. Figure S18: June 2012 Digital Orthophotograph of the Napatree Barrier. Figure S19: April 2014 Digital Orthophotograph of the Napatree Barrier. Figure S20: April 2018 Digital Aerial Photograph of the Napatree Barrier. Table S1: Water levels exceeding the 0.7 m MHHW threshold at the Newport, RI and New London tide gauges. Table S2: Average distance from baseline and standard deviation of shoreline position used in this analysis. See Table 3 for the sources of the shorelines.
Funding
This research received no external funding. Publication costs were provided via a Connecticut State University-American Association of University Professors Faculty Research Grant. The Watch Hill Conservancy provided in-kind support for field surveys.
Acknowledgments
This manuscript benefited from numerous discussions over the years regarding shoreline change mapping and processes, including Mark Borrelli, Rachel Henderson, Janet Freedman, Robert Hollis and Scott Rasmussen. Mark Borelli, Peter August, Janet Freedman and Nathan Vinhateiro, along with two anonymous reviewers provided helpful reviews of the manuscript.
Conflicts of Interest
The authors declare no conflict of interest. The funders had no role in the design of the study; in the collection, analyses, or interpretation of data; in the writing of the manuscript or in the decision to publish the results.
References
- Stutz, M.L.; Pilkey, O.H. Open-ocean barrier islands: Global influence of climatic, oceanographic, and depositional settings. J. Coast. Res. 2011, 27, 207–222. [Google Scholar] [CrossRef]
- Fenster, M.S.; Dolan, R.; Morton, R.A. Coastal storms and shoreline change: Signal or noise? J. Coast. Res. 2001, 17, 714–720. [Google Scholar]
- Leatherman, S.; Zhang, K.; Douglas, B. Sea level rise shown to drive coastal erosion. EOS Trans. Am. Geophys. Union 2000, 81, 55–57. [Google Scholar] [CrossRef]
- Pilkey, O.H.; Young, R.S.; Bush, D.M. Comment on “Sea level rise shown to drive coastal erosion”. EOS Trans. Am. Geophys. Union 2000, 81, 436. [Google Scholar] [CrossRef] [Green Version]
- Sallenger, A.H., Jr.; Morton, R.; Fletcher, C.; Thieler, E.R.; Howd, P. Comment on “Sea level rise shown to drive coastal erosion”. EOS Trans. Am. Geophys. Union 2000, 81, 436. [Google Scholar] [CrossRef]
- Zhang, K.; Douglas, B.; Leatherman, S. Do storms cause long-term beach erosion along the U.S. east barrier coast? J. Geol. 2002, 110, 493–502. [Google Scholar] [CrossRef]
- Morton, R.A. Historical changes in the Mississippi-Alabama barrier-island chain and roles of extreme storms, sea level and human activities. J. Coast. Res. 2008, 24, 1587–1600. [Google Scholar] [CrossRef]
- Leatherman, S.P. Migration of Assateague Island, Maryland, by inlet and overwash processes. Geology 1979, 7, 104–107. [Google Scholar] [CrossRef]
- Morton, R.A. Factors controlling storm impacts on coastal barriers and beaches—A preliminary basis for near real-time forecasting. J. Coast. Res. 2002, 18, 486–501. [Google Scholar]
- Morton, R.A.; Sallenger, A.H., Jr. Morphological impacts of extreme storms on sandy beaches and barriers. J. Coast. Res. 2003, 19, 560–573. [Google Scholar]
- FitzGerald, D.M.; Hein, C.J.; Hughes, Z.; Kulp, M.; Georgiou, I.; Miner, M.D. Runaway Barrier Island Transgression Concept: Global Case Studies. In Barrier Dynamics and Response to Changing Climate; Moore, L.J., Murray, A.B., Eds.; Springer: Cham, Switzerland, 2018; pp. 3–56. [Google Scholar]
- Williams, S.J. Sea-level rise implications for coastal regions. J. Coast. Res. 2013, 63, 184–196. [Google Scholar] [CrossRef]
- Gutierrez, B.T.; Williams, S.J.; Thieler, E.R. Potential for Shoreline Changes due to Sea-Level Rise along the U.S. Mid-Atlantic Region: U.S. Geological Survey Open-File Report 2007-1278; U.S. Geological Survey: Reston, VA, USA, 2007.
- Williams, S.J.; Gutierrez, B.T. Sea-level rise and coastal change: Causes and implications for the future of coasts and low-lying regions. Shore Beach 2009, 77, 13–21. [Google Scholar]
- Ashton, A.D.; Lorenzo-Trueba, J. Morphodynamics of Barrier Response to Sea-Level Rise. In Barrier Dynamics and Response to Changing Climate; Moore, L.J., Murray, A.B., Eds.; Springer: Cham, Switzerland, 2018; pp. 277–304. [Google Scholar]
- Lorenzo-Trueba, J.; Ashton, A.D. Rollover, drowning, and discontinuous retreat: Distinct modes of barrier response to sea-level rise arising from a simple morphodynamic model. J. Geophys. Res. Earth Surf. 2014, 119, 779–801. [Google Scholar] [CrossRef] [Green Version]
- FitzGerald, D.M.; Fenster, M.S.; Argow, B.A.; Buynevich, I.V. Coastal Impacts Due to Sea-Level Rise. Annu. Rev. Earth Planet. Sci. 2008, 36, 601–647. [Google Scholar] [CrossRef] [Green Version]
- Bender, M.A.; Knutson, T.R.; Tuleya, R.E.; Sirutis, J.J.; Vecchi, G.A.; Garner, S.T.; Held, I.M. Modeled Impact of Anthropogenic Warming on the Frequency of Intense Atlantic Hurricanes. Science 2010, 327, 454–458. [Google Scholar] [CrossRef] [Green Version]
- Emanuel, K.A. Downscaling CMIP5 climate models shows increased tropical cyclone activity over the 21st century. Proc. Natl. Acad. Sci. USA 2013, 110, 12219–12224. [Google Scholar] [CrossRef] [PubMed] [Green Version]
- National Audubon Society. National Audubon Society Important Bird Areas in the U.S.: Napatree Point/Sandy Point. Available online: https://www.audubon.org/important-bird-areas/napatree-pointsandy-point (accessed on 21 September 2020).
- Reeves, I.R.B.; Moore, L.J.; Murray, A.B.; Anarde, K.A.; Goldstein, E.B. Dune Dynamics Drive Discontinuous Barrier Retreat. Geophys. Res. Lett. 2021, 48, e2021GL092958. [Google Scholar] [CrossRef]
- RIGIS. April 2014 Rhode Island Statewide High Resolution Orthoimages. In Rhode Island Geographic Information System (RIGIS) Data Distribution System. Environmental Data Center; University of Rhode Island: Kingston, Jamaica, 2015. [Google Scholar]
- Boothroyd, J.C.; Hollis, R.J.; Oakley, B.A.; Henderson, R. Shoreline Change Maps for Washington County Rhode Island Depicting Shoreline Change from 1939–2014; Rhode Island Geological Survey: Kingston, RI, USA, 2016. [Google Scholar]
- Boothroyd., J.C.; Hehre, R.E. Shoreline Change Maps for the South Shore of Rhode Island, Map Folio 2007-2 ed.; Rhode Island Geological Survey: Kingston, RI, USA, 2007. [Google Scholar]
- Hapke, C.J.; Himmelstoss, E.A.; Kratzmann, M.G.; List, J.H.; Thieler, E.R. National Assessment of Shoreline Change: Historical Shoreline Change along the New England and Mid-Atlantic Coasts; US Geological Survey: Reston, VA, USA, 2010.
- Nichols, R.L.; Marston, A.F. Shoreline changes in Rhode Island produced by hurricane of 21 September 1938. Bull. Geol. Soc. Am. 1939, 50, 1357–1370. [Google Scholar] [CrossRef]
- USACE. 2018 USACE NCMP Topobathy Lidar: East Coast. 2020. Available online: https://www.fisheries.noaa.gov/inport/item/55881 (accessed on 3 August 2021).
- FitzGerald, D.M.; Van Heteren, S. Classification of paraglacial barrier systems: Coastal New England, USA. Sedimentology 1999, 46, 1083–1108. [Google Scholar] [CrossRef]
- Schafer, J.P. Surficial Geologic Map of the Watch Hill quadrangle, Rhode Island-Connecticut. In U.S. Geological Survey Geological Quadrangle Map GQ-410; US Geological Survey: Reston, VA, USA, 1965. [Google Scholar]
- Stone, J.R.; Shafer, J.P.; London, E.H.; DiGiacomo-Cohen, M.; Lewis, R.S.; Thompson, W.B. Quaternary Geologic Map of Connecticut and Long Island Sound Basin.: U.S. Geological Survey Geologic Investigations Series Map I-2784, Scale 1:125,000, 2 Sheets and Pamphlet; US Geological Survey: Reston, VA, USA, 2005; pp. 1–72.
- FitzGerald, D.M.; Baldwin, C.T.; Ibrahim, N.A.; Sands, D.R. Development of the northwestern Buzzards Bay Shoreline, Massachusetts. In Glaciated Coasts; FitzGerald, D.M., Rosen, P.S., Eds.; Academic Press: San Diego, CA, USA, 1987. [Google Scholar]
- Oakley, B.A.; Murphy, C.; Varney, M.; Hollis, R.J. Spatial Extent and Volume of the Shoreface Depositional Platform on the Upper Shoreface of the Glaciated Rhode Island South Shore. Estuaries Coasts 2019, 1–20. [Google Scholar] [CrossRef]
- Hayes, M.O. Barrier island morphology as a function of tidal and wave regime. In Barrier Islands from the Gulf of St. Lawrence to the Gulf of Mexico; Leatherman, S.P., Ed.; Academic Press: New York, NY, USA, 1979; pp. 1–27. [Google Scholar]
- WHG. Wave, Tide and Current Data Collection, Washington County, Rhode Island: Report to the U.S. Army Corps of Engineers by the Woods Hole Group; US Army Corps of Engineers: New England District, MA, USA, 2012. [Google Scholar]
- USACE. North Atlantic Coast Comprehensive Study: Resilient Adaptation to Increasing Risk; Main Report; US Army Corps of Engineers: New England District, MA, USA, 2015. [Google Scholar]
- NOS. Mean Sea Level Trend Station 8452660 Newport, Rhode Island. Available online: https://tidesandcurrents.noaa.gov/sltrends/sltrends_station.shtml?stnid=8452660 (accessed on 20 May 2021).
- NOS. Mean Sea Level Trend Station 8461490 New London, CT. Available online: https://tidesandcurrents.noaa.gov/sltrends/sltrends_station.shtml?id=8461490 (accessed on 20 May 2021).
- NOS. Mean Sea Level Trend Station 8510560 Montauk, New York. Available online: https://tidesandcurrents.noaa.gov/sltrends/sltrends_station.shtml?id=8510560 (accessed on 20 May 2021).
- Carey, J.C.; Moran, S.B.; Kelly, R.P.; Kolker, A.S.; Fulweiler, R.W. The declining role of organic matter in New England salt marshes. Estuaries Coasts 2017, 40, 626–639. [Google Scholar] [CrossRef]
- Beckley, B.; Ray, R.; Zelensky, N.; Lemoine, F.; Yang, X.; Brown, S.; Desai, S.; Mitchum, G. Global Mean Sea Level Trend from Integrated Multi-Mission Ocean Altimeters TOPEX/Poseidon Jason-1 and OSTM/Jason-2 Version 5; NASA Physical Oceanography DAAC: Pasadena, CA, USA, 2020. [CrossRef]
- Karegar, M.A.; Dixon, T.H.; Engelhart, S.E. Subsidence along the Atlantic Coast of North America: Insights from GPS and late Holocene relative sea level data. Geophys. Res. Lett. 2016, 43, 3126–3133. [Google Scholar] [CrossRef] [Green Version]
- Boose, E.R.; Chamberlin, K.E.; Foster, D.R. Landscape and regional impacts of historical hurricanes in New England. Ecol. Monogr. 2001, 71, 27–48. [Google Scholar] [CrossRef]
- Donnelly, J.; Bryant, S.S.; Butler, J.; Dowling, J.; Fan, L.; Hausmann, N.; Newby, P.; Shuman, B.; Stern, J.; Westover, K.; et al. A backbarrier overwash record of intense storms from Brigantine, New Jersey. Mar. Geol. 2004, 210, 107–121. [Google Scholar] [CrossRef]
- Ludlum, D.M. Early American Hurricanes; American Meteorological Society: Boston, MA, USA, 1963; p. 198. [Google Scholar]
- Pore, N.A.; Barrientos, C.S. Storm Surge; New York SeaGrant Institute: Stony Brook, NY, USA, 1976. [Google Scholar]
- NOAA. Historical Hurricane Tracks; NOAA Office for Coastal Management: North Charleston, SC, USA, 2020; Volume 2020.
- Ashton, A.D.; Donnelly, J.P.; Evans, R.L. A discussion of the potential impacts of climate change on the shorelines of the Northeastern USA. Mitig. Adapt. Strateg. Glob. Chang. 2008, 13, 719–743. [Google Scholar] [CrossRef]
- Brown, C.W. Hurricanes and shore-line changes in Rhode Island. Geogr. Rev. 1939, 29, 416–430. [Google Scholar] [CrossRef]
- Donnelly, J.P.; Bryant, S.S.; Butler, J.; Dowling, J.; Fan, L.; Hausmann, N.; Newby, P.; Shuman, B.; Stern, J.; Westover, K. 700 yr sedimentary record of intense hurricane landfalls in southern New England. Geol. Soc. Am. Bull. 2001, 113, 714–727. [Google Scholar] [CrossRef] [Green Version]
- Shaw, A.; Hashemi, M.R.; Spaulding, M.; Oakley, B.; Baxter, C. Effect of Coastal Erosion on Storm Surge: A Case Study in the Southern Coast of Rhode Island. J. Mar. Sci. Eng. 2016, 4, 85. [Google Scholar] [CrossRef]
- Dolan, R. The Ash Wednesday Storm of 1962: 25 Years Later. J. Coast. Res. 1987, 3, 2–5. [Google Scholar]
- Leatherman, S.; Zaremba, R.E. Overwash and aeolian processes on a U.S. north.east coast barrier. Sediment. Geol. 1987, 52, 183–206. [Google Scholar] [CrossRef]
- Boothroyd, J.C.; Gibeaut, J.C.; Dacey, M.F.; Grant, J.A.; Blais, A.G.; Pickart, D.S.; Gricus, C.; Szak, C. The geological impact of Hurricane Gloria: South shore of Rhode Island. In Proceedings of the Geological Society of America; Geological Society of America: Boulder, CO, USA, 1986; p. 5. [Google Scholar]
- Cheung, K.F.; Tang, L.; Donnelly, J.P.; Scileppi, E.M.; Liu, K.B.; Mao, X.Z.; Houston, S.H.; Murnane, R.J. Numerical modeling and field evidence of coastal overwash in southern New England from Hurricane Bob and implications for paleotempestology. J. Geophys. Res. Earth Surf. 2007, 112, F3. [Google Scholar] [CrossRef] [Green Version]
- FitzGerald, D.M.; Van Heteren, S.; Montello, T.M. Shoreline Processes and Damage Resulting from the Halloween Eve Storm of 1991 along theNorth and South Shores of Massachusetts Bay, U.S.A. J. Coast. Res. 1994, 10, 113–132. [Google Scholar]
- Butman, B.; Sherwood, C.R.; Dalyander, P.S. Northeast storms ranked by wind stress and wave-generated bottom stress observed in Massachusetts Bay 1990–2006. Cont. Shelf Res. 2008, 8, 1231–1245. [Google Scholar] [CrossRef]
- Marrone, J.F. Evaluation of impacts of the Patriots’ Day storm (15–18 April 2007) on the New England coastline. In Solutions to Coastal Disasters 2008; American Society of Civil Engineers: Reston, VA, USA, 2008; pp. 507–517. [Google Scholar]
- Blake, E.S.; Kimberlain, T.B.; Berg, R.J.; Cangialosi, J.P.; Beven, J.L., II. Tropical Cyclone Report Hurricane Sandy (AL182012); 22–29 October 2012; National Hurricane Center: Miami, FL, USA, 2013.
- Zhang, K.; Douglas, B.C.; Leatherman, S.P. Twentieth-Century Storm Activity along the U.S. East Coast. J. Clim. 2000, 13, 1748–1761. [Google Scholar] [CrossRef]
- NOS. Annual Exceedance Probability Curves for Station 8452660 Newport, RI (Newport Tide Gauge); National Ocean Service: Silver Spring, MD, USA, 2021.
- NOAA. Verified Water-Level Data at the Newport, RI Tide Gauge (Station 8452660). 2020. Available online: https://tidesandcurrents.noaa.gov/stationhome.html?id=8452660 (accessed on 20 May 2021).
- Hale, S.O. Hurricane Carol Lashes Rhode Island; Providence Journal Co.: Providence, RI, USA, 1954; p. 80. [Google Scholar]
- USAAC. 1938 Hurricane Damage Photos: 23–24 September 1938, 118th Photographic Section of the U.S. Army Air Corps and the 43rd Division of the Connecticut National Guard. Connecticut State Library Aerial Photograph Collection. 1938. Available online: https://libguides.ctstatelibrary.org/hg/aerialphotos (accessed on 7 March 2020).
- Houser, C.; Barrineau, P.; Hammond, B.; Saari, B.; Rentschler, E.; Trimble, S.; Wernette, P.; Weymer, B.; Young, S. Role of the Foredune in Controlling Barrier Island Response to Sea Level Rise. Barrier Dynamics and Response to Changing Climate. In Barrier; Moore, L.J., Murray, A.B., Eds.; Springer: Berlin/Heidelberg, Germany, 2018; pp. 175–207. [Google Scholar]
- Oakley, B.A. Response and recovery of welded barrier: Napatree Point Conservation Area following ’Superstorm’ Sandy measured using LiDAR and field surveys. In Proceedings of the American Shore and Beach Preservation Association, Long Beach, CA, USA, 13–16 October 2020. [Google Scholar]
- Houser, C.; Hamilton, S. Sensitivity of post-hurricane beach and dune recovery to event frequency. Earth Surf. Process. Landf. 2009, 34, 613–628. [Google Scholar] [CrossRef]
- Morton, R.A. Texas Barriers. In Geology of Holocene Barrier Island Systems; Davis, R.A., Jr., Ed.; Springer: New York, NY, USA, 1994; pp. 74–114. [Google Scholar]
- Sallenger, A.H., Jr. Storm Impact Scale for Barrier Islands. J. Coast. Res. 2000, 16, 890–895. [Google Scholar]
- Fenster, M.S.; Dolan, R. Large-scale reversals in shoreline trends along the U.S. mid-Atlantic coast. Geology 1994, 22, 543–546. [Google Scholar] [CrossRef]
- Dolan, R.; Fenster, M.S.; Holme, S.J. Temporal Analysis of Shoreline Recession and Accretion. J. Coast. Res. 1991, 7, 723–744. [Google Scholar]
- RICRMC. Rhode Island Coastal Resources Management Program: Rhode Island Coastal Resources Management Council; Rhode Island Coastal Resources Managament Council: Wakefield, RI, USA, 1995.
- Boothroyd, J.C.; Friedrich, N.E.; McGinn, S.R. Geology of microtidal coastal lagoons: Rhode Island. Mar. Geol. 1985, 63, 35–76. [Google Scholar] [CrossRef]
- Orford, J.D.; Carter, R.W.G.; Jennings, S.C. Coarse clastic barrier environments: Evolution and implications for quaternary sea level interpretation. Quat. Int. 1991, 9, 87–104. [Google Scholar] [CrossRef]
Figure 2.
Monthly average sea-level at the Newport, RI tide gauge (blue line). The red dashed line is a linear fit through the data [36].
Figure 2.
Monthly average sea-level at the Newport, RI tide gauge (blue line). The red dashed line is a linear fit through the data [36].

Figure 3.
Water elevation levels for notable storms discussed in this study. The gray lines represent the hourly water levels at the Newport, RI tide gauge (Figure 1) [61]. The dashed black line is the threshold for storm detection used in this study (0.7 m MHHW). Red bars represent tropical storms; blue represent extra-tropical storms. Black arrows show the dates of aerial photographs (Figure S6; supplemental materials).

Figure 4.
Storm tracks of hurricanes that made landfall within 200 km of Napatree Point (Storm tracks from NOAA Digital Coast).
Figure 4.
Storm tracks of hurricanes that made landfall within 200 km of Napatree Point (Storm tracks from NOAA Digital Coast).

Figure 5.
(A). Oblique aerial photograph of the Napatree Barrier and Sandy Point Barrier taken in 1936. Note the beach cottages and the presence of dune vegetation along the barrier. (B). Oblique aerial photograph of the Napatree Barrier taken on 24 September 1938, 3 days after the 1938 hurricane made landfall. North is to the left of both images, (A,B). Note the inlet at the east (far) end of the barrier and numerous surge channels across the barrier. (C). An oblique aerial photograph taken after Hurricane Carol (1954) of the eastern end of the NPCA (note the two groins installed between 1948 and 1951) (D). Car buried in a washover fan on the east end of the Napatree Barrier during Hurricane Carol (1954). This photograph is just out of frame to the east of Figure 5C. See Figure 1 for the location of the photograph [62]. View is towards the east.

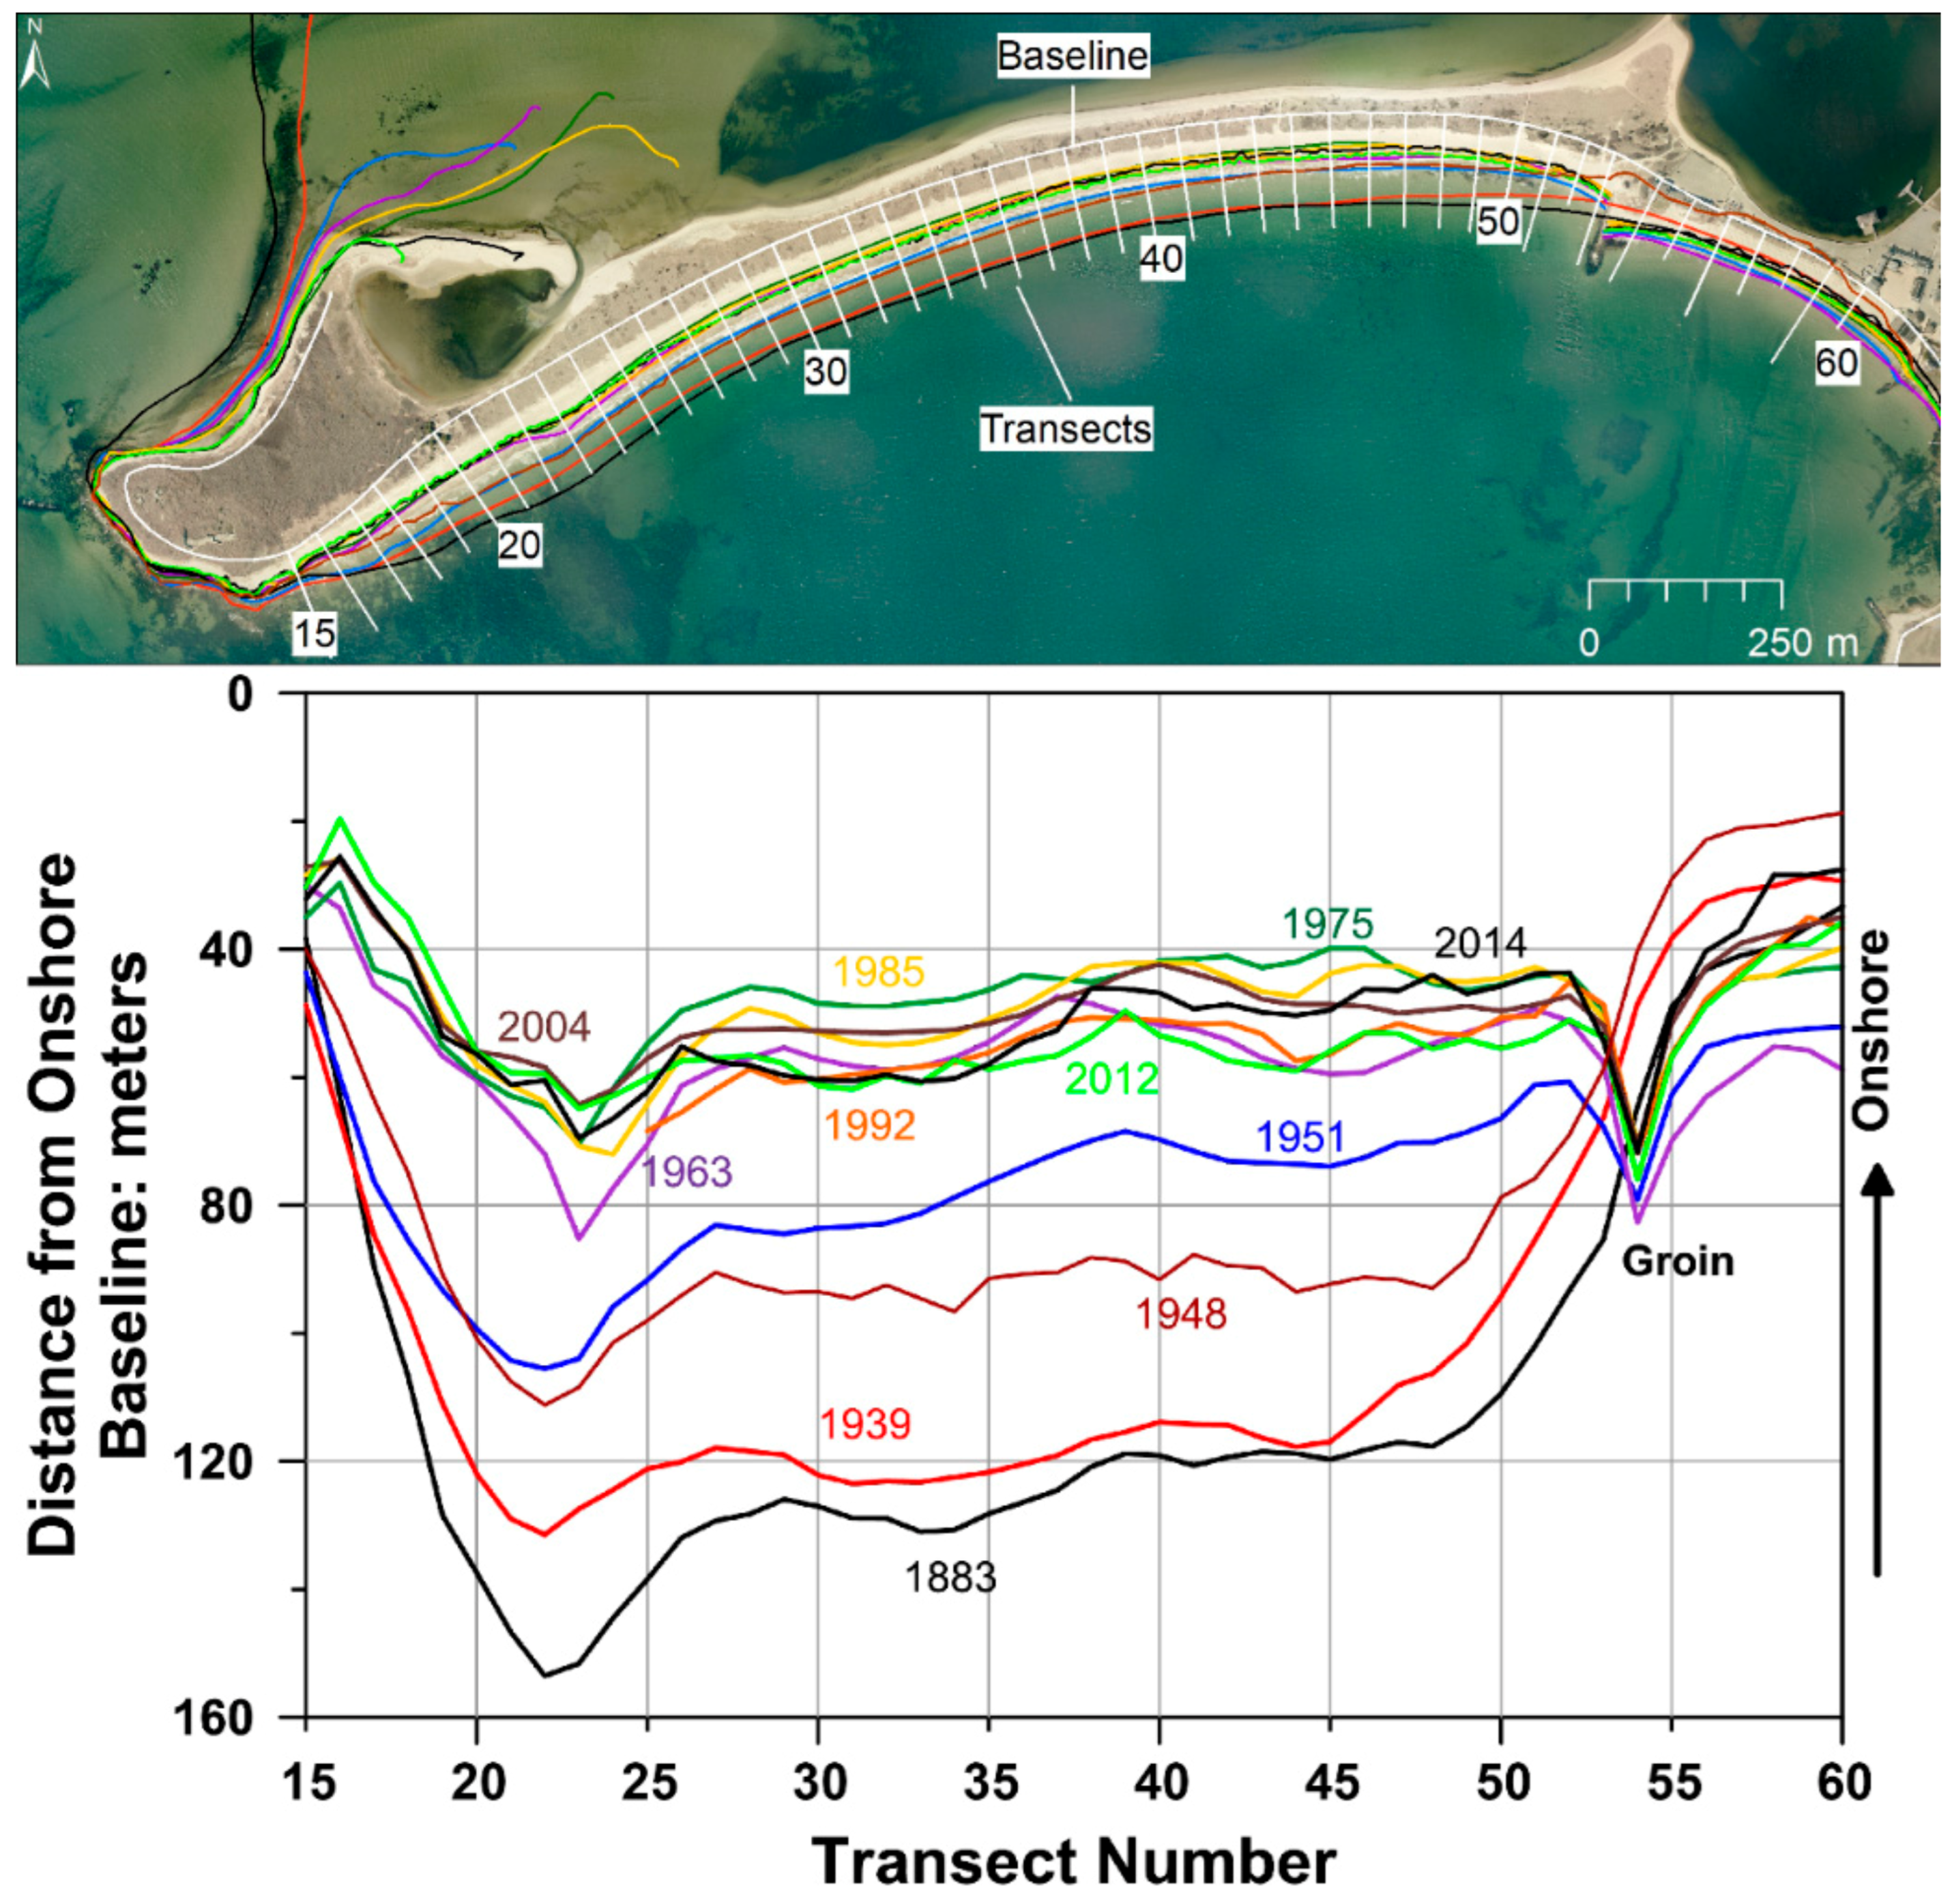
Figure 6.
(Top) Digital orthophotograph of the Napatree Barrier showing the location of the transects used in this study. (Bottom) Distance from the onshore baseline for transects 15–60 for Napatree Point. The barrier begins at transect 20. Note the migration of the shoreline between 1939 and 1975, and the lack of change in position between 1975 and 2014. The apparent progradation of the shoreline at transect 54 represents the installation of the small groin between 1948 and 1951. The impact of the groin on shoreline position appears to be limited to transects 51 to 56.

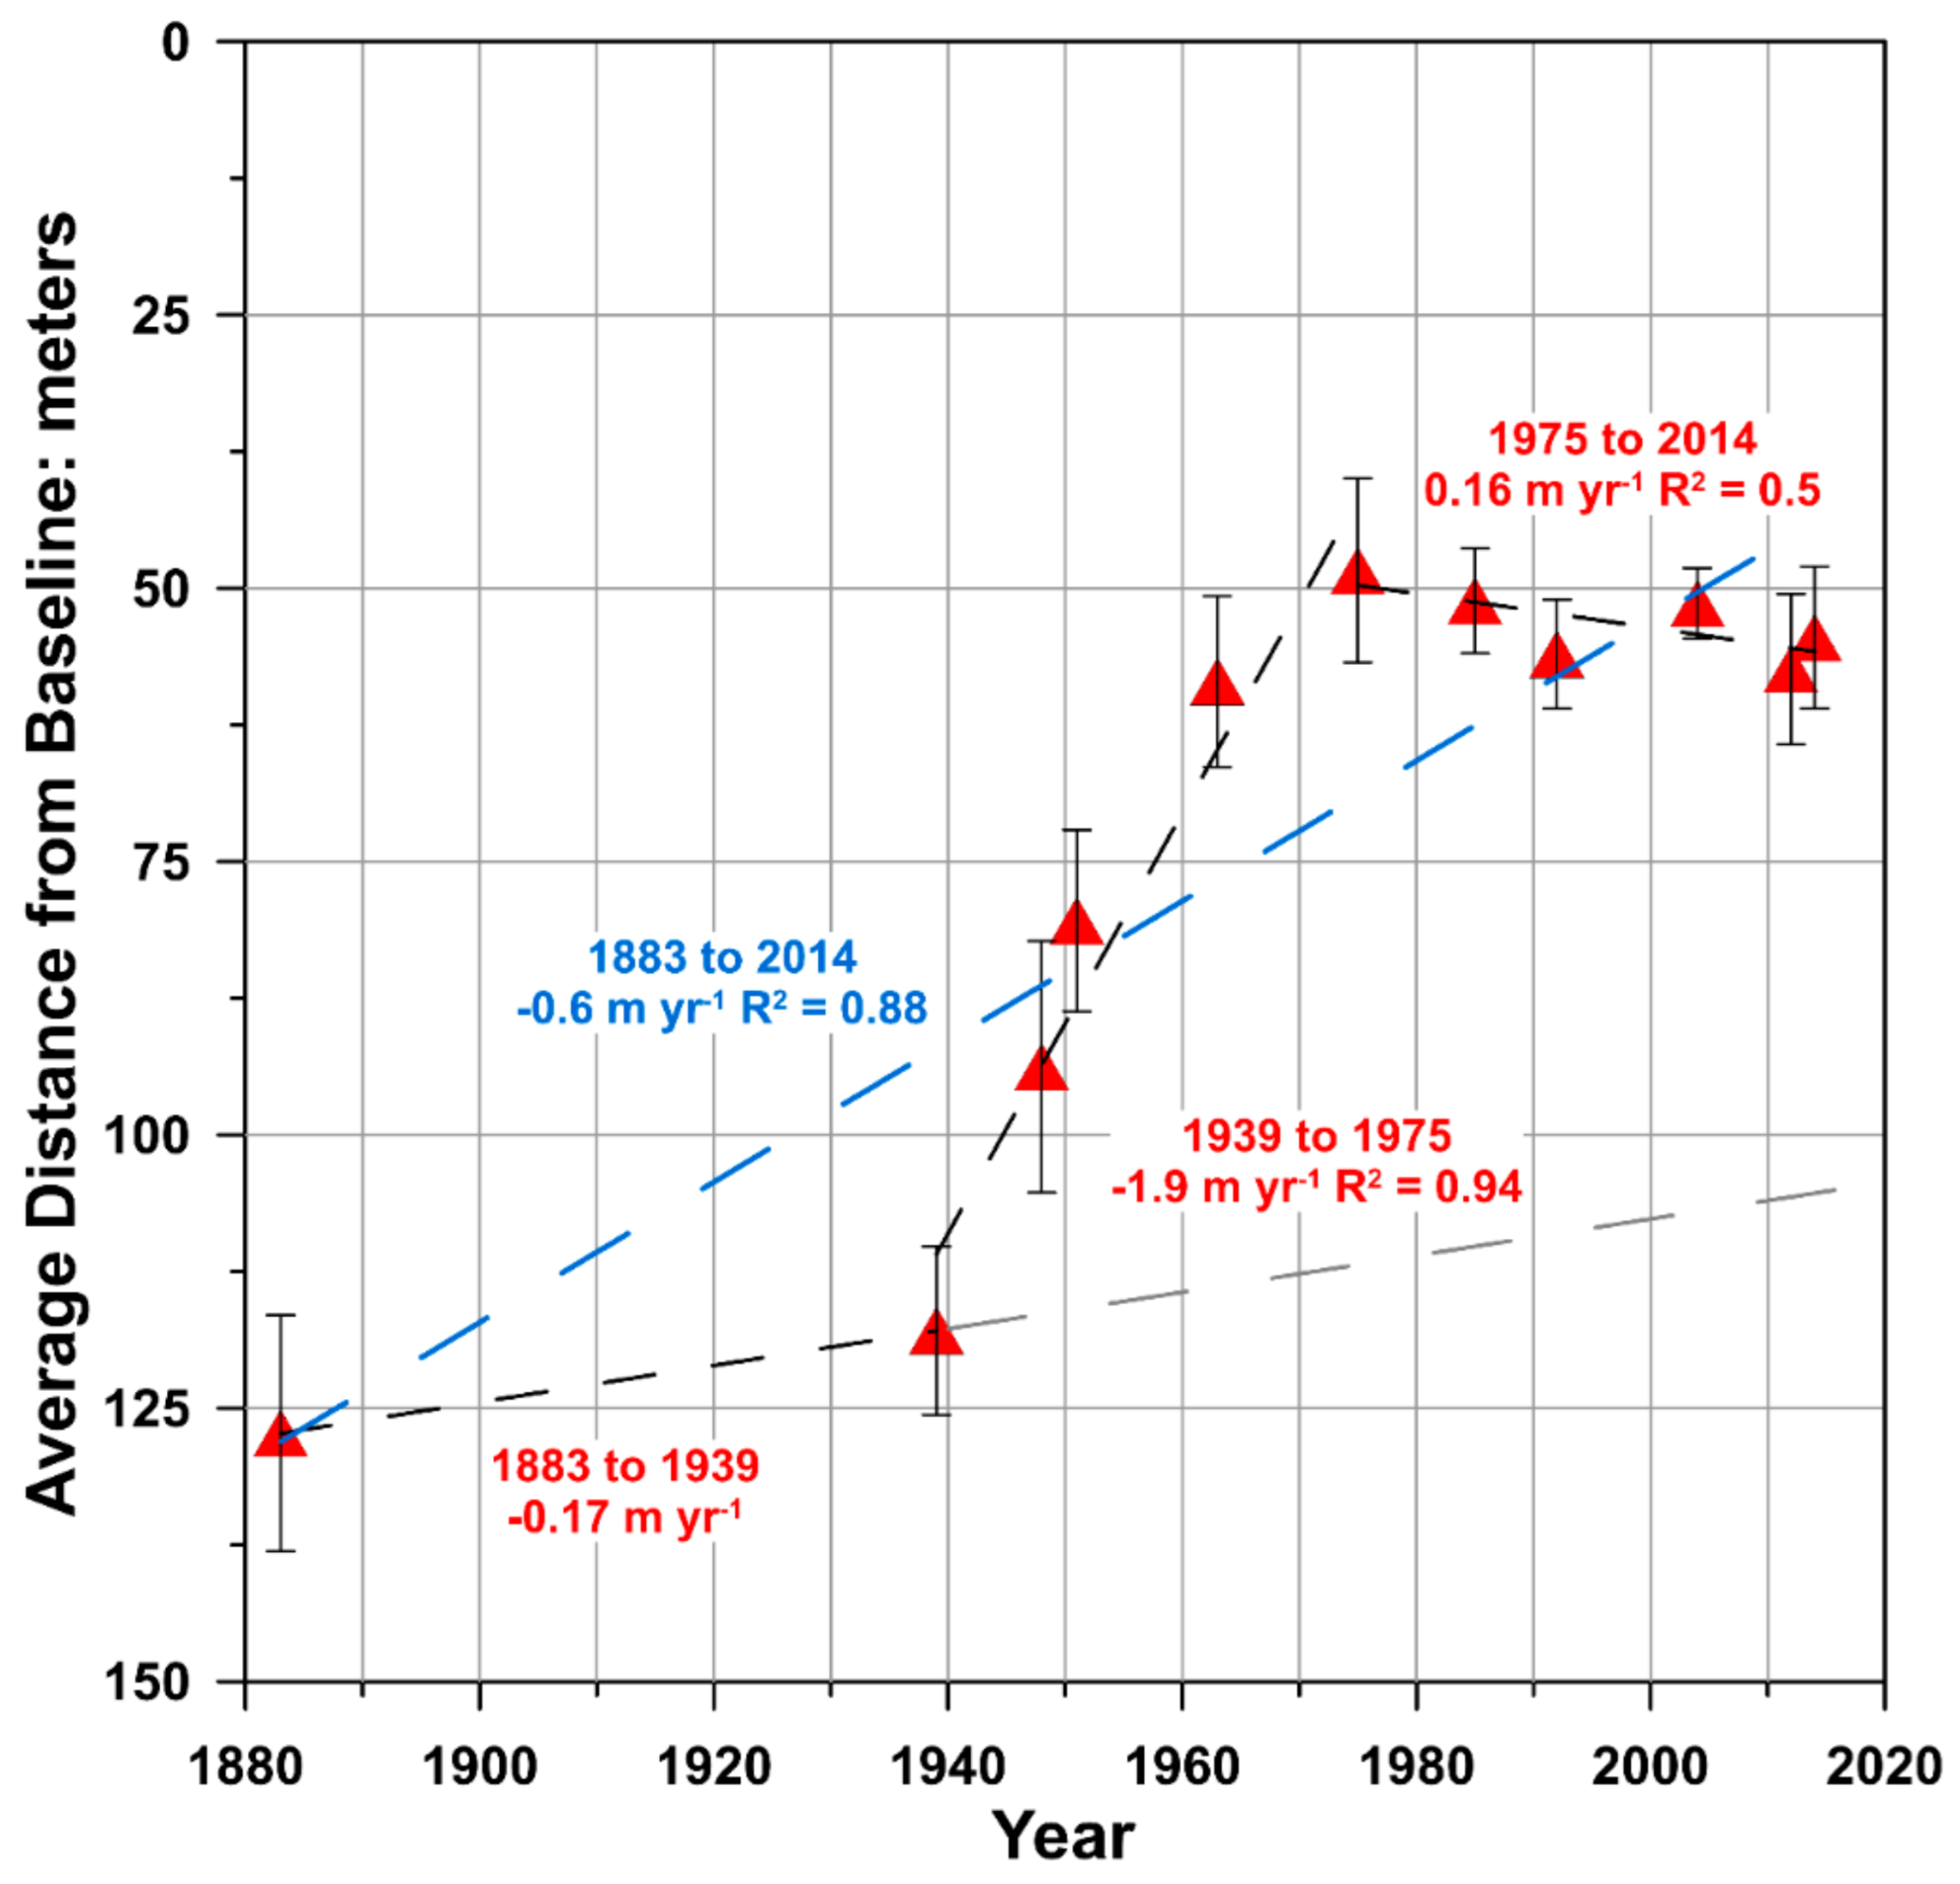
Figure 7.
Average position of the southern shoreline of Napatree Barrier 1883–2014 expressed as distance from the onshore baseline. Triangles show the average position of the barrier (transects 20 to 50). Error bars are based on the standard deviation in distance from the baseline for that shoreline reported in Table 4. The dashed blue line represents a linear best fit through the average positions (1883–2014). The dashed gray line represents the continuation of the 1883–1939 trend.

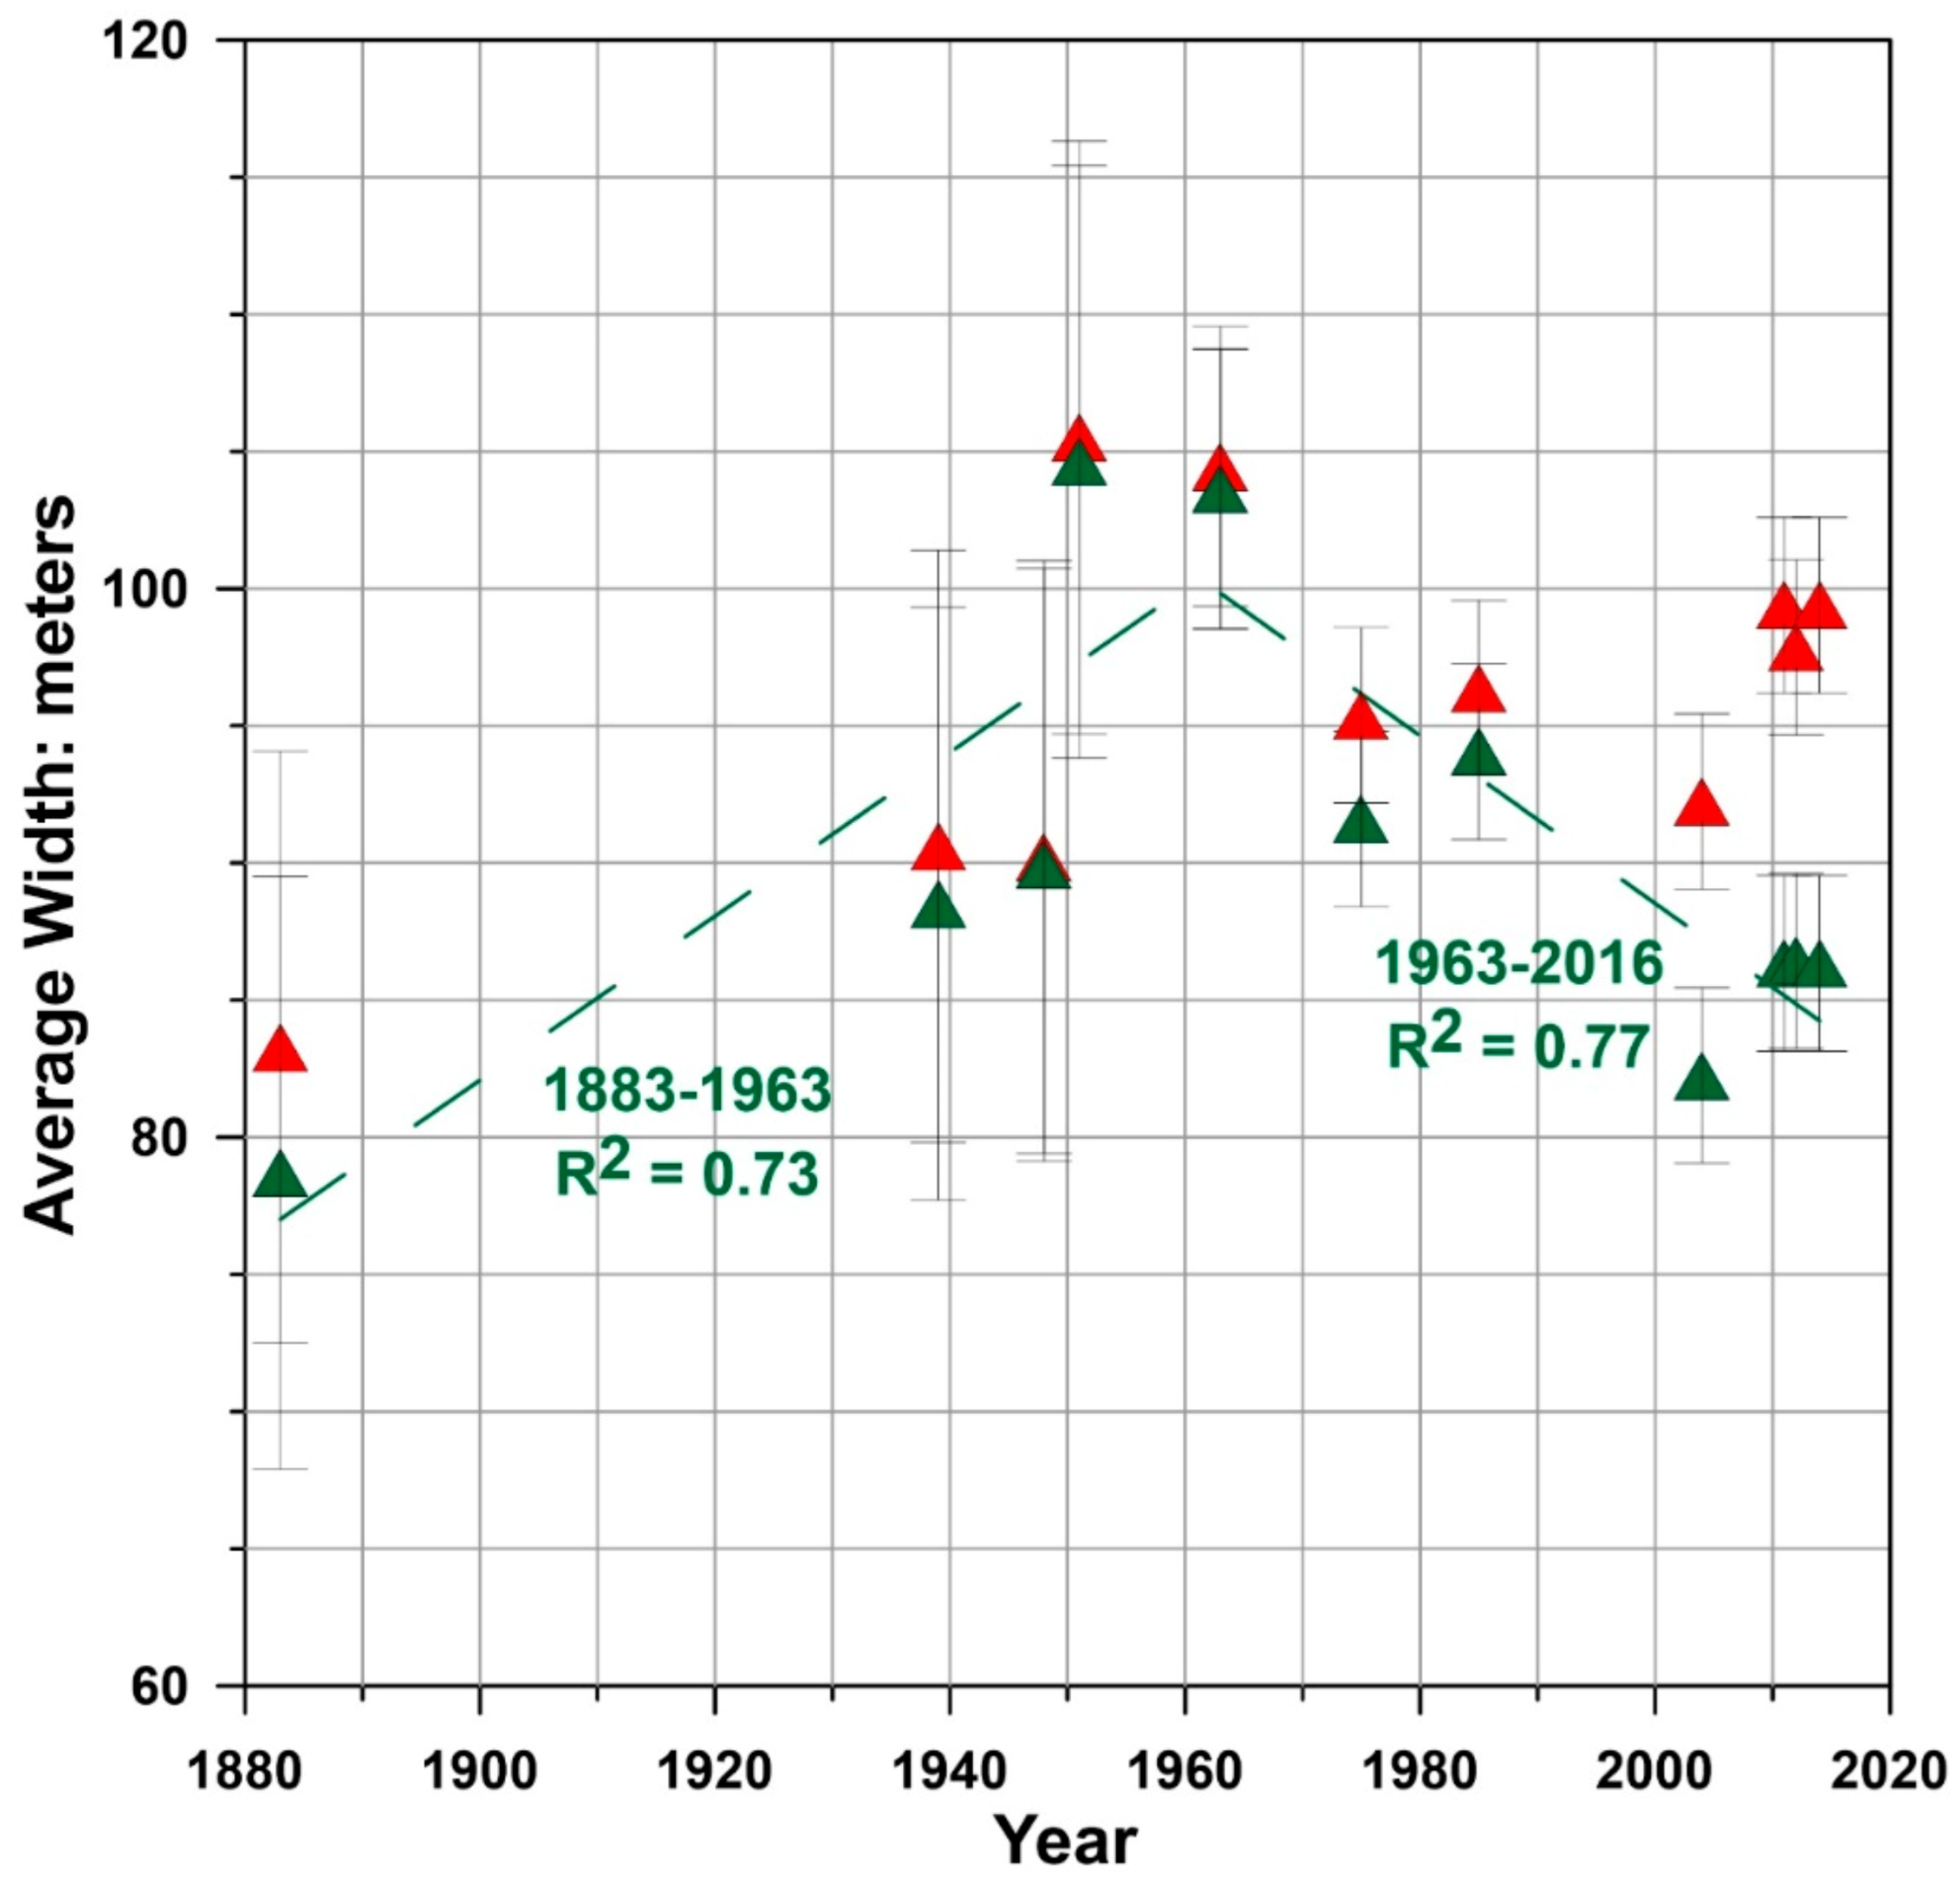
Figure 8.
Average width of the barrier based on all transects (red triangles) and transects 20–25 and 31–50 (green triangles). Transects 26–30 were excluded because the dynamics of the small spit on the western bayside of the barrier (see Figure 1, Figure 6, Figure 9 and supplemental materials) alter the barrier width of the 2004–2018 shorelines. See the text for a more detailed discuss of why transects were excluded. The dashed green line represents linear best fit of the data between 1883–1963 and 1963–2016. Error bars are based on the shoreline position uncertainty reported in Table 3.

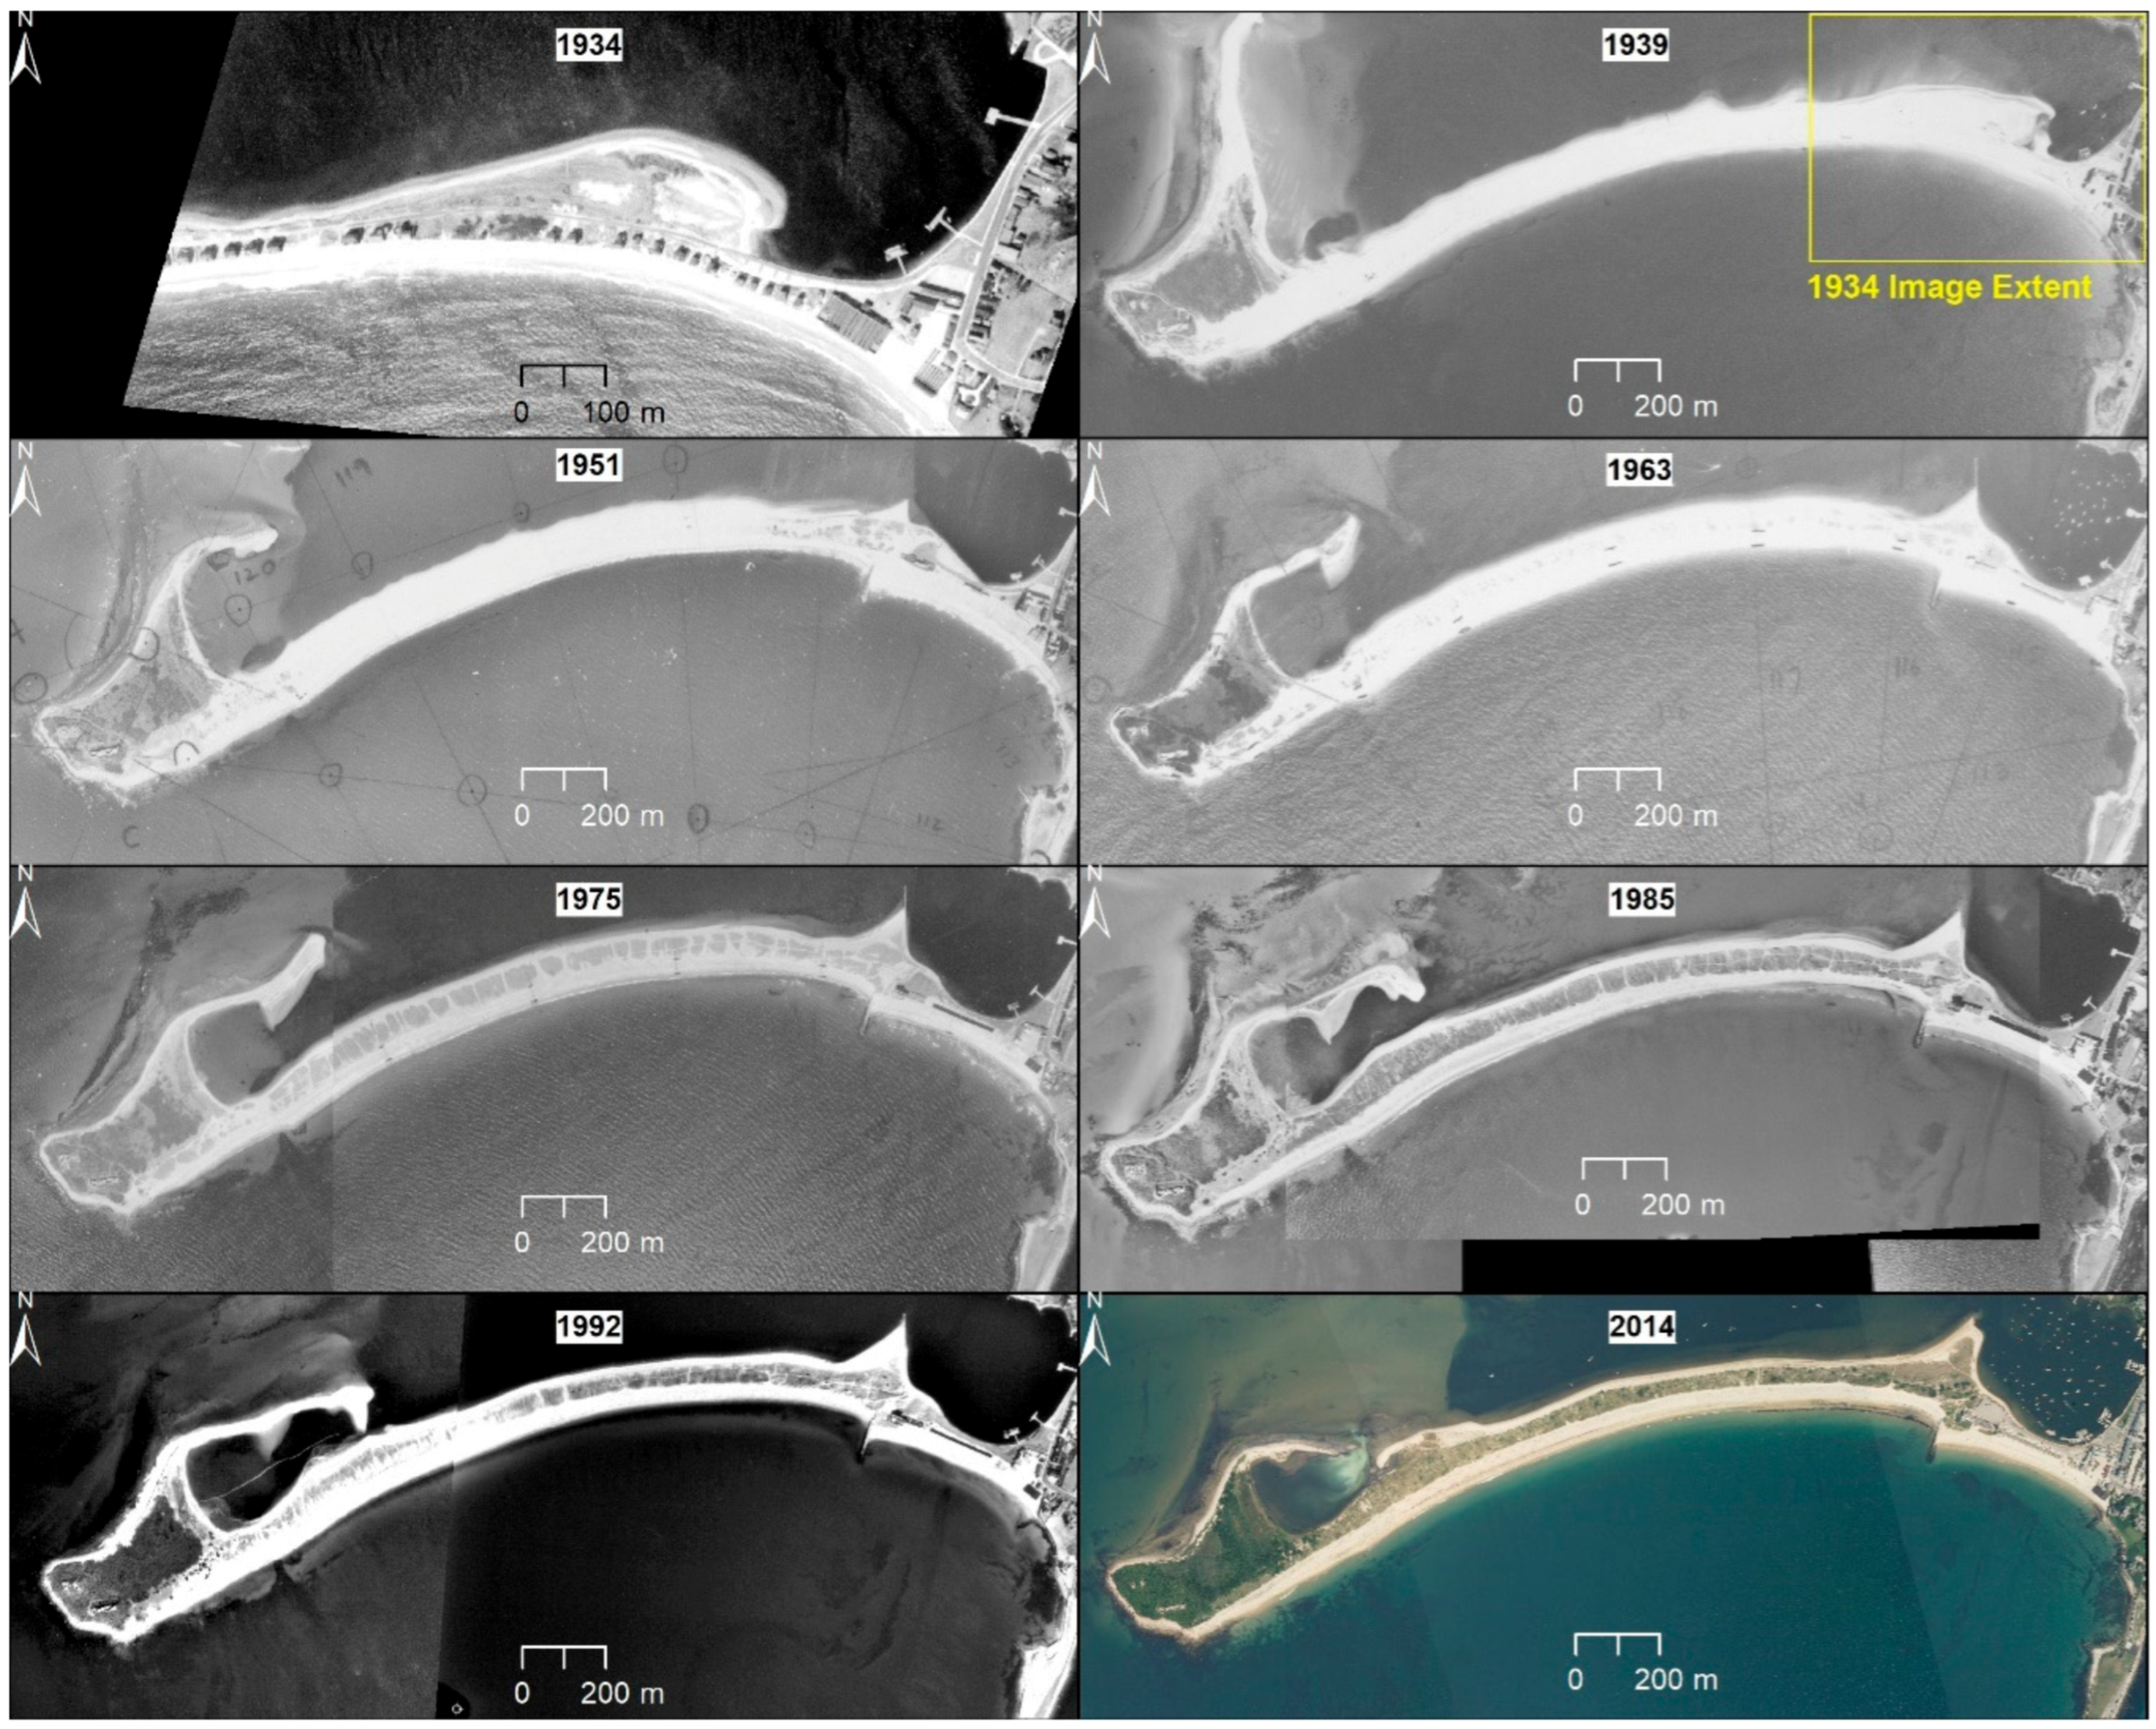
Figure 9.
Napatree barrier 1934 through 2014. Only the eastern portion of the barrier was imaged in 1934. Note the houses and vegetation visible in 1934. Images shown from 1939, 1951 and 1963 all show evidence of recent washover fan deposition. Images from 1975 to 2014 show vegetation reestablished along the barrier. The 1992 images show some overwash on the western half of the barrier, but not full removal of the dunes. See the supplemental materials for all aerial images used in this study.


Table 1.
Shoreline change rates for the Napatree barrier (transects 20 to 50) from previously published shoreline change maps (Boothroyd and Hehre et al. [24]; Boothroyd et al. [23]; Hapke et al. [25]) and this study.
| Years | Method | Average Shoreline Change Rate (m yr−1) | Source |
|---|---|---|---|
| 1939−1985 | End Point Rate | −1.4 | Boothroyd and Hehre, [24] |
| 1985−2004 | End Point Rate | 0.0 | Boothroyd and Hehre, [24] |
| 1939−2004 | End Point Rate | −1.0 | Boothroyd and Hehre, [24] |
| 1883−2004 | Linear Regression | −0.8 | Hapke et al. [25] |
| 1975−2000 | End Point Rate | 0.4 | Hapke et al. [25] |
| 1939−2014 | End Point Rate | −0.9 | Boothroyd et al. [23] |
| 1939−2014 | Shoreline Change Envelope | −1.4 | Boothroyd et al. [23] |
| 1883−1939 | End Point Rate | −0.2 | This study |
| 1939−1975 | Linear Regression | −1.9 | This study |
| 1939−1975 | End Point Rate | −1.9 | This study |
| 1975−2014 | Linear Regression | 0.2 | This study |
| 1975−2014 | End Point Rate | 0.1 | This study |
| 1883−2014 | Linear Regression | −0.6 | This study |
| 1883−2014 | End Point Rate | −0.6 | This study |
Table 2.
NOS T-Sheets (NOS-T), aerial photographs (AP) and digital orthophotos (DO) used in this study. Dates with an asterisk denote that a dataset was used to digitize a shoreline position. Time since storm indicates the number of days between the photograph/survey and last time the threshold water level (0.7 m MHHW) was exceeded at the Newport tide gauge.
| Type | Date | Time Since Storm (days) |
|---|---|---|
| NOS-T | 1883 * | N/A |
| AP | 4/15/1934 | N/A |
| AP | 5/15/1939 * | 236 |
| AP | 10/15/1945 | 395 |
| NOS-T | 1948 * | >365 |
| AP | 11/15/1951 * | 1718 |
| AP | 4/15/1962 | 39 |
| AP | 9/7/1963 * | 549 |
| AP | 4/15/1972 | 56 |
| AP | 4/14/1975 * | 133 |
| AP | 4/15/1981 | 1164 |
| AP | 3/22/1985 * | 2601 |
| AP | 4/15/1988 | 448 |
| AP | 3/15/1992 * | 136 |
| AP | 4/15/1997 | 95 |
| AP | 4/15/2004 * | 526 |
| AP | 4/15/2008 | 365 |
| AP | 6/15/2012 * | 292 |
| AP | 4/14/2014 * | 473 |
| AP | 4/15/2018 | 796 |
Table 3.
Reported measurement and total positional uncertainties reported for the shorelines used in this analysis. Sources notes by the superscript next to the date. 1 Hapke et al. [25]. 2 Boothroyd and Hehre [24]. 3 Boothroyd et al. [23].
| Measurement Uncertainties | Meters | ||||||
|---|---|---|---|---|---|---|---|
| Year | Type | Georeferencing (Ug) | Digitizing (Ud) | T-Sheet Survey (Ut) | Air Photo (Ua) | HWL (Upd) | Total Shoreline Position Uncertainty |
| 1883 1 | NOS T-Sheet | 4 | 1 | 10 | 4.5 | 11.7 | |
| 1939 2 | VAP | 3.6 | 1 | - | 3 | 4.5 | 6.6 |
| 1948 1 | NOS T-Sheet | 4 | 1 | 10 | 4.5 | 11.7 | |
| 1951 2 | VAP | 3.7 | 1 | - | 3 | 4.5 | 6.6 |
| 1963 2 | VAP | 3.7 | 1 | - | 3 | 4.5 | 6.6 |
| 1975 2 | VAP | 2 | 1 | - | 3 | 4.5 | 5.9 |
| 1985 2 | VAP | 3.3 | 1 | - | 3 | 4.5 | 6.4 |
| 1992 2 | VAP | 3.1 | 1 | - | 3 | 4.5 | 6.3 |
| 2004 2 | DO | - | 1 | - | 3 | 4.5 | 5.5 |
| 2012 3 | DO | - | 1 | - | 3 | 4.5 | 5.5 |
| 2014 3 | DO | - | 1 | - | 1 | 4.5 | 4.7 |
Table 4.
Average change in shoreline position, maximum change, minimum change, average annualized rate, positional uncertainty values (Upair) and rate uncertainty values (Ur) for subsequent shoreline pairs on the Napatree barrier for transects 20–50.
Table 4.
Average change in shoreline position, maximum change, minimum change, average annualized rate, positional uncertainty values (Upair) and rate uncertainty values (Ur) for subsequent shoreline pairs on the Napatree barrier for transects 20–50.
| Shoreline Pair | Average Change (m) | Max (m) | Min (m) | Annualized Rate (m yr−1) | Upair (m) | Ur (m) |
|---|---|---|---|---|---|---|
| 1883–1939 | −9.4 | −19.0 | −1.0 | −0.2 | 13.4 | 0.3 |
| 1939–1948 | −24.1 | −30.7 | −13.3 | −2.7 | 13.4 | 1.5 |
| 1948–1951 | −13.4 | −22.8 | −1.5 | −4.5 | 13.4 | 4.5 |
| 1951–1963 | −21.9 | −38.9 | −13.2 | −1.8 | 9.4 | 0.8 |
| 1963–1975 | −10.1 | −15.7 | −0.7 | −0.8 | 8.9 | 0.7 |
| 1975–1985 | 2.8 | 10.2 | −1.7 | 0.3 | 8.7 | 0.9 |
| 1985–1992 | 7.6 | 12.7 | 3.7 | 1.1 | 9 | 1.3 |
| 1992–2004 | −4.9 | −11.7 | −1 | −0.4 | 8.4 | 0.7 |
| 2004–2014 | 3.1 | 7.8 | −5.5 | 0.3 | 7.2 | 2.3 |
Publisher’s Note: MDPI stays neutral with regard to jurisdictional claims in published maps and institutional affiliations. |
© 2021 by the author. Licensee MDPI, Basel, Switzerland. This article is an open access article distributed under the terms and conditions of the Creative Commons Attribution (CC BY) license (https://creativecommons.org/licenses/by/4.0/).
Share and Cite
MDPI and ACS Style
Oakley, B.A. Storm Driven Migration of the Napatree Barrier, Rhode Island, USA. Geosciences 2021, 11, 330. https://doi.org/10.3390/geosciences11080330
AMA Style
Oakley BA. Storm Driven Migration of the Napatree Barrier, Rhode Island, USA. Geosciences. 2021; 11(8):330. https://doi.org/10.3390/geosciences11080330
Chicago/Turabian StyleOakley, Bryan A. 2021. "Storm Driven Migration of the Napatree Barrier, Rhode Island, USA" Geosciences 11, no. 8: 330. https://doi.org/10.3390/geosciences11080330
Note that from the first issue of 2016, this journal uses article numbers instead of page numbers. See further details here.