Article

Spatial-Temporal Land Use and Land Cover Changes in Urban Areas Using Remote Sensing Images and GIS Analysis: The Case Study of Opole, Poland

by
Barbara Wiatkowska
*,
Janusz Słodczyk
and
Aleksandra Stokowska
Institute of Socio-Economic Geography and Spatial Management, University of Opole, Ozimska 46a, 45-058 Opole, Poland
*
Author to whom correspondence should be addressed.
Geosciences 2021, 11(8), 312; https://doi.org/10.3390/geosciences11080312
Submission received: 22 June 2021 / Revised: 22 July 2021 / Accepted: 23 July 2021 / Published: 26 July 2021
(This article belongs to the Special Issue A GIS Spatial Analysis Model for Land Use Change)

Abstract

:
Urban expansion is a dynamic and complex phenomenon, often involving adverse changes in land use and land cover (LULC). This paper uses satellite imagery from Landsat-5 TM, Landsat-8 OLI, Sentinel-2 MSI, and GIS technology to analyse LULC changes in 2000, 2005, 2010, 2015, and 2020. The research was carried out in Opole, the capital of the Opole Agglomeration (south-western Poland). Maps produced from supervised spectral classification of remote sensing data revealed that in 20 years, built-up areas have increased about 40%, mainly at the expense of agricultural land. Detection of changes in the spatial pattern of LULC showed that the highest average rate of increase in built-up areas occurred in the zone 3–6 km (11.7%) and above 6 km (10.4%) from the centre of Opole. The analysis of the increase of built-up land in relation to the decreasing population (SDG 11.3.1) has confirmed the ongoing process of demographic suburbanisation. The paper shows that satellite imagery and GIS can be a valuable tool for local authorities and planners to monitor the scale of urbanisation processes for the purpose of adapting space management procedures to the changing environment.

1. Introduction

Urban expansion, associated with progressive demographic as well as economic, social, or political processes, is a dynamic and complex process that often has adverse effects on LULC changes [1]. These changes, determined by ongoing processes of urban sprawl, are some of the most important and very often irreversible types of environmental change, which in turn affect the transformation of natural vegetation cover and the functioning of urban ecosystems [2,3,4,5,6]. Urban sprawl contributes to an increase in impervious surfaces, such as buildings, roads, parking lots, technical infrastructure, etc., which are the indicators of the degree of urbanisation, reflecting the environmental quality of urban areas. In turn, the growth of built-up land affects, among other things, the formation of urban heat islands [7,8,9,10], increased pollution [11], water management [12] and the structure and functioning of the city [13,14,15]. Thus, land cover types and the spatial configuration of their structures affect the quality of human life [16].
The spatial expansion of built-up areas in most urban centres around the world is mainly accelerated by urban population growth [17,18]. According to demographic projections, by 2050, nearly 70% of the population will have lived in cities [19], which will result in dynamic urbanisation, especially in developing countries [20]. Urbanisation processes are not uniform worldwide [21]; significant population growth due to natural increase, migration towards urban areas and transformation of rural areas into urban centres make urbanisation processes in developing countries more dynamic, which is unfavourable and worrying for sustainable urban development [22]. Other challenges currently concern cities in most regions of Europe, where urban expansion has entered a phase of intensive suburbanisation, manifested by the dynamic development of urban areas in the peripheral urban districts and suburban zones, mainly at the expense of agricultural land and forests, despite the aging and shrinking population and depopulation of city centres [23,24,25], and which could already be observed in previous decades in wealthy countries, especially in North America [26]. In suburban areas, as a result of population influx and increased construction activity, urban sprawl is observed, being one of the forms of urban development, where residential areas are highly dispersed in space and distances to workplaces and major public facilities are relatively distant [27,28].
In Poland, the scale of suburbanisation has not yet reached the level observed in western European countries, while its dominant form is a chaotic, uncontrolled dispersion of buildings, which in Europe is not encountered on such a large scale. As a result of progressive demographic processes, mainly migration, there is a process of settlement deconcentration and chaotic location of new buildings at an increasing distance from the centre of the settlement system [29]. Spatial disorder in Poland is primarily the result of historical conditions and inadequate spatial policy, including legal and management regulations, for many years. For the areas of many developing cities and municipalities, local spatial management plans, which are the documents of local law, have not been developed so far, and the existing plans often cover small areas, which is not conducive to creating a coherent and functionally planned space [30]. More than half of investments in Poland, and above all new buildings, are located on the basis of administrative decisions on development conditions, which often do not take into account the spatial management and the original purpose of land surrounding the location of the planned investment. Such actions consequently contributed to the dispersion of residential development in the areas of agricultural plots, located at a considerable distance from the urban fabric [31]. The areas allocated for development in local spatial management plans and studies are also ahead of what is called the demographic absorptiveness (understood as the number of residents who can settle in a given area) even by 150–210 years, which leads to the consumption of space and the natural environment, and is an obstacle to sustainable urban development [30]. In many European countries, such as France, Spain, or the UK, public administration bodies carry out rational spatial policy, taking care of spatial order, and have the authority to make decisions in the field of spatial management in a manner not limited by law, in accordance with the well-understood principle of subsidiarity [31]. On the other hand, uncontrolled suburbanisation conducted on a large scale in Poland generates costs and huge losses in the economic, environmental, social, and spatial-functional spheres, which—according to Śleszyński et al. [32]—amount to over 20 billion euros annually. Development on agricultural areas, first of all in peripheral and suburban zones, depopulation of city centres, creation of mono-functional districts without appropriate technical infrastructure and public utility facilities are contrary to the principles of sustainable development.
Given that spatial LULC and demographic changes in urban areas are essential to shape progress towards sustainable urbanisation, among the Sustainable Development Goals (SDGs), Goal 11.3.1 highlights the importance of efficiency of “the land consumption rate to the population growth rate” for the benefit of the sustainable urbanisation and improvement of opportunities for participatory, integrated and sustainable urban planning and management [33,34,35]. Bearing in mind that urban growth is often disproportionate to population growth, this disparity cannot be monitored using statistical data alone. Thus, in order to assess urban expansion, there is a need to accurately identify and continuously monitor spatial changes in LULC over the long term [36,37,38]. As Sapena and Ruiz [1] emphasise, monitoring land use change should be a priority objective of spatial management policy and it is the responsibility of, among others, local governments in many countries around the world as well as in Poland [39]. Knowledge of spatial information about the spatial patterns that different types of LULC is therefore essential at the policy-making stage of sustainable urban development and supports decision-making processes [40,41,42].
These needs are satisfied by modern and dynamically developing remote sensing technologies which provide digital data, e.g., satellite images with high spectral, spatial, and temporal resolution and, first of all, at lower costs than those obtained by traditional field measurements [43,44]. Remote sensing data combined with geographic information systems (GIS) enable accurate detection of different categories of LULC, provide detailed and precise information on current and historical land cover, and enable analysis of the dynamics of these changes and reveal the spatial patterns of urban sprawl at different points in time [45,46,47,48]. Especially in countries where the computerisation of the spatial management is at an unsatisfactory level due to the lack of up-to-date and accurate national LULC data, modern and rapidly developing remote sensing and GIS technologies ensure that the infrastructure of digital spatial-temporal land cover data necessary for monitoring urban expansion is maintained [40,49,50,51,52].
The analysis of LULC changes can be based on remote sensing data processing and also on existing ready-made geospatial datasets for LULC mapping, classified and developed from long-term earth observation missions [53,54]. One of the potential and known products for the identification of LULC changes used by the European public administration, e.g., in the field of spatial planning, is the Urban Atlas implemented under the Copernicus programme by the European Space Agency (ESA) (https://land.copernicus.eu/local/urban-atlas, accessed on 10 March 2021). Urban Atlas uses high-resolution satellite data to produce digital LULC maps for functional urban areas for Europe’s most populous cities. This product is used to analyse LULC and urban structures of urban neighbourhoods [55]. The second product is Corine Land Cover (CLC), also implemented under the Copernicus programme by ESA, providing digital maps generated mainly from classification of satellite images. For many EU countries, including Poland, it is the only systematically updated database covering the whole country. It is mainly used to analyse land cover and land use change at the regional scale [36,56,57,58,59]. Both projects are open to the public and have standardised the way the results are collected, processed, and presented across the EU. On the other hand, the periodicity of their update lasting several years and their relatively low spatial resolution is a certain limitation of their use in the studies of local LULC changes in urban areas [60]. Since geospatial data on LULC changes are not compiled at the local level as regularly and accurately as socio-demographic data, it has become increasingly common to use remote sensing data from publicly available Landsat and Sentinel satellite imagery to quantify urban expansion and model optimal sustainable urbanisation scenarios, based on which an automated retrospective classification of LULC using spectral information is performed [17,25,61,62,63,64,65,66].
Therefore, this paper proposes the use of Landsat (TM, OLI) and Sentinel (MSI) multispectral satellite imagery and GIS tools for the quantification of internal urban expansion over the last 20 years (2000–2020), analysed in five-year-time periods (2000, 2005, 2010, 2015, 2020), in the city of Opole, one of the oldest cities in Poland and one of the fastest depopulating region in Europe. The main objectives of the study are as follows: (1) detection of homogeneous LULC types with the use of supervised spectral classification and remote sensing indices based on the spectral characteristics of individual land cover elements; (2) analysis of spatial and temporal LULC changes; (3) analysis of spatial and temporal changes in built-up areas and their rate in individual equidistances: 0–3 km (core area), 3–6 km (outer core area), and more than 6 km (urban fringe area) from the city centre; (4) analysis of the rate of change in built-up areas in relation to the changing population; (5) analysis of the ratio of land consumption to the population growth rate.
The results of this study reveal the spatial and temporal pattern of urban development in Opole and can be used as baseline information to determine future urban land use and to identify priorities in the implementation of sustainable urban development.

2. Materials and Methods
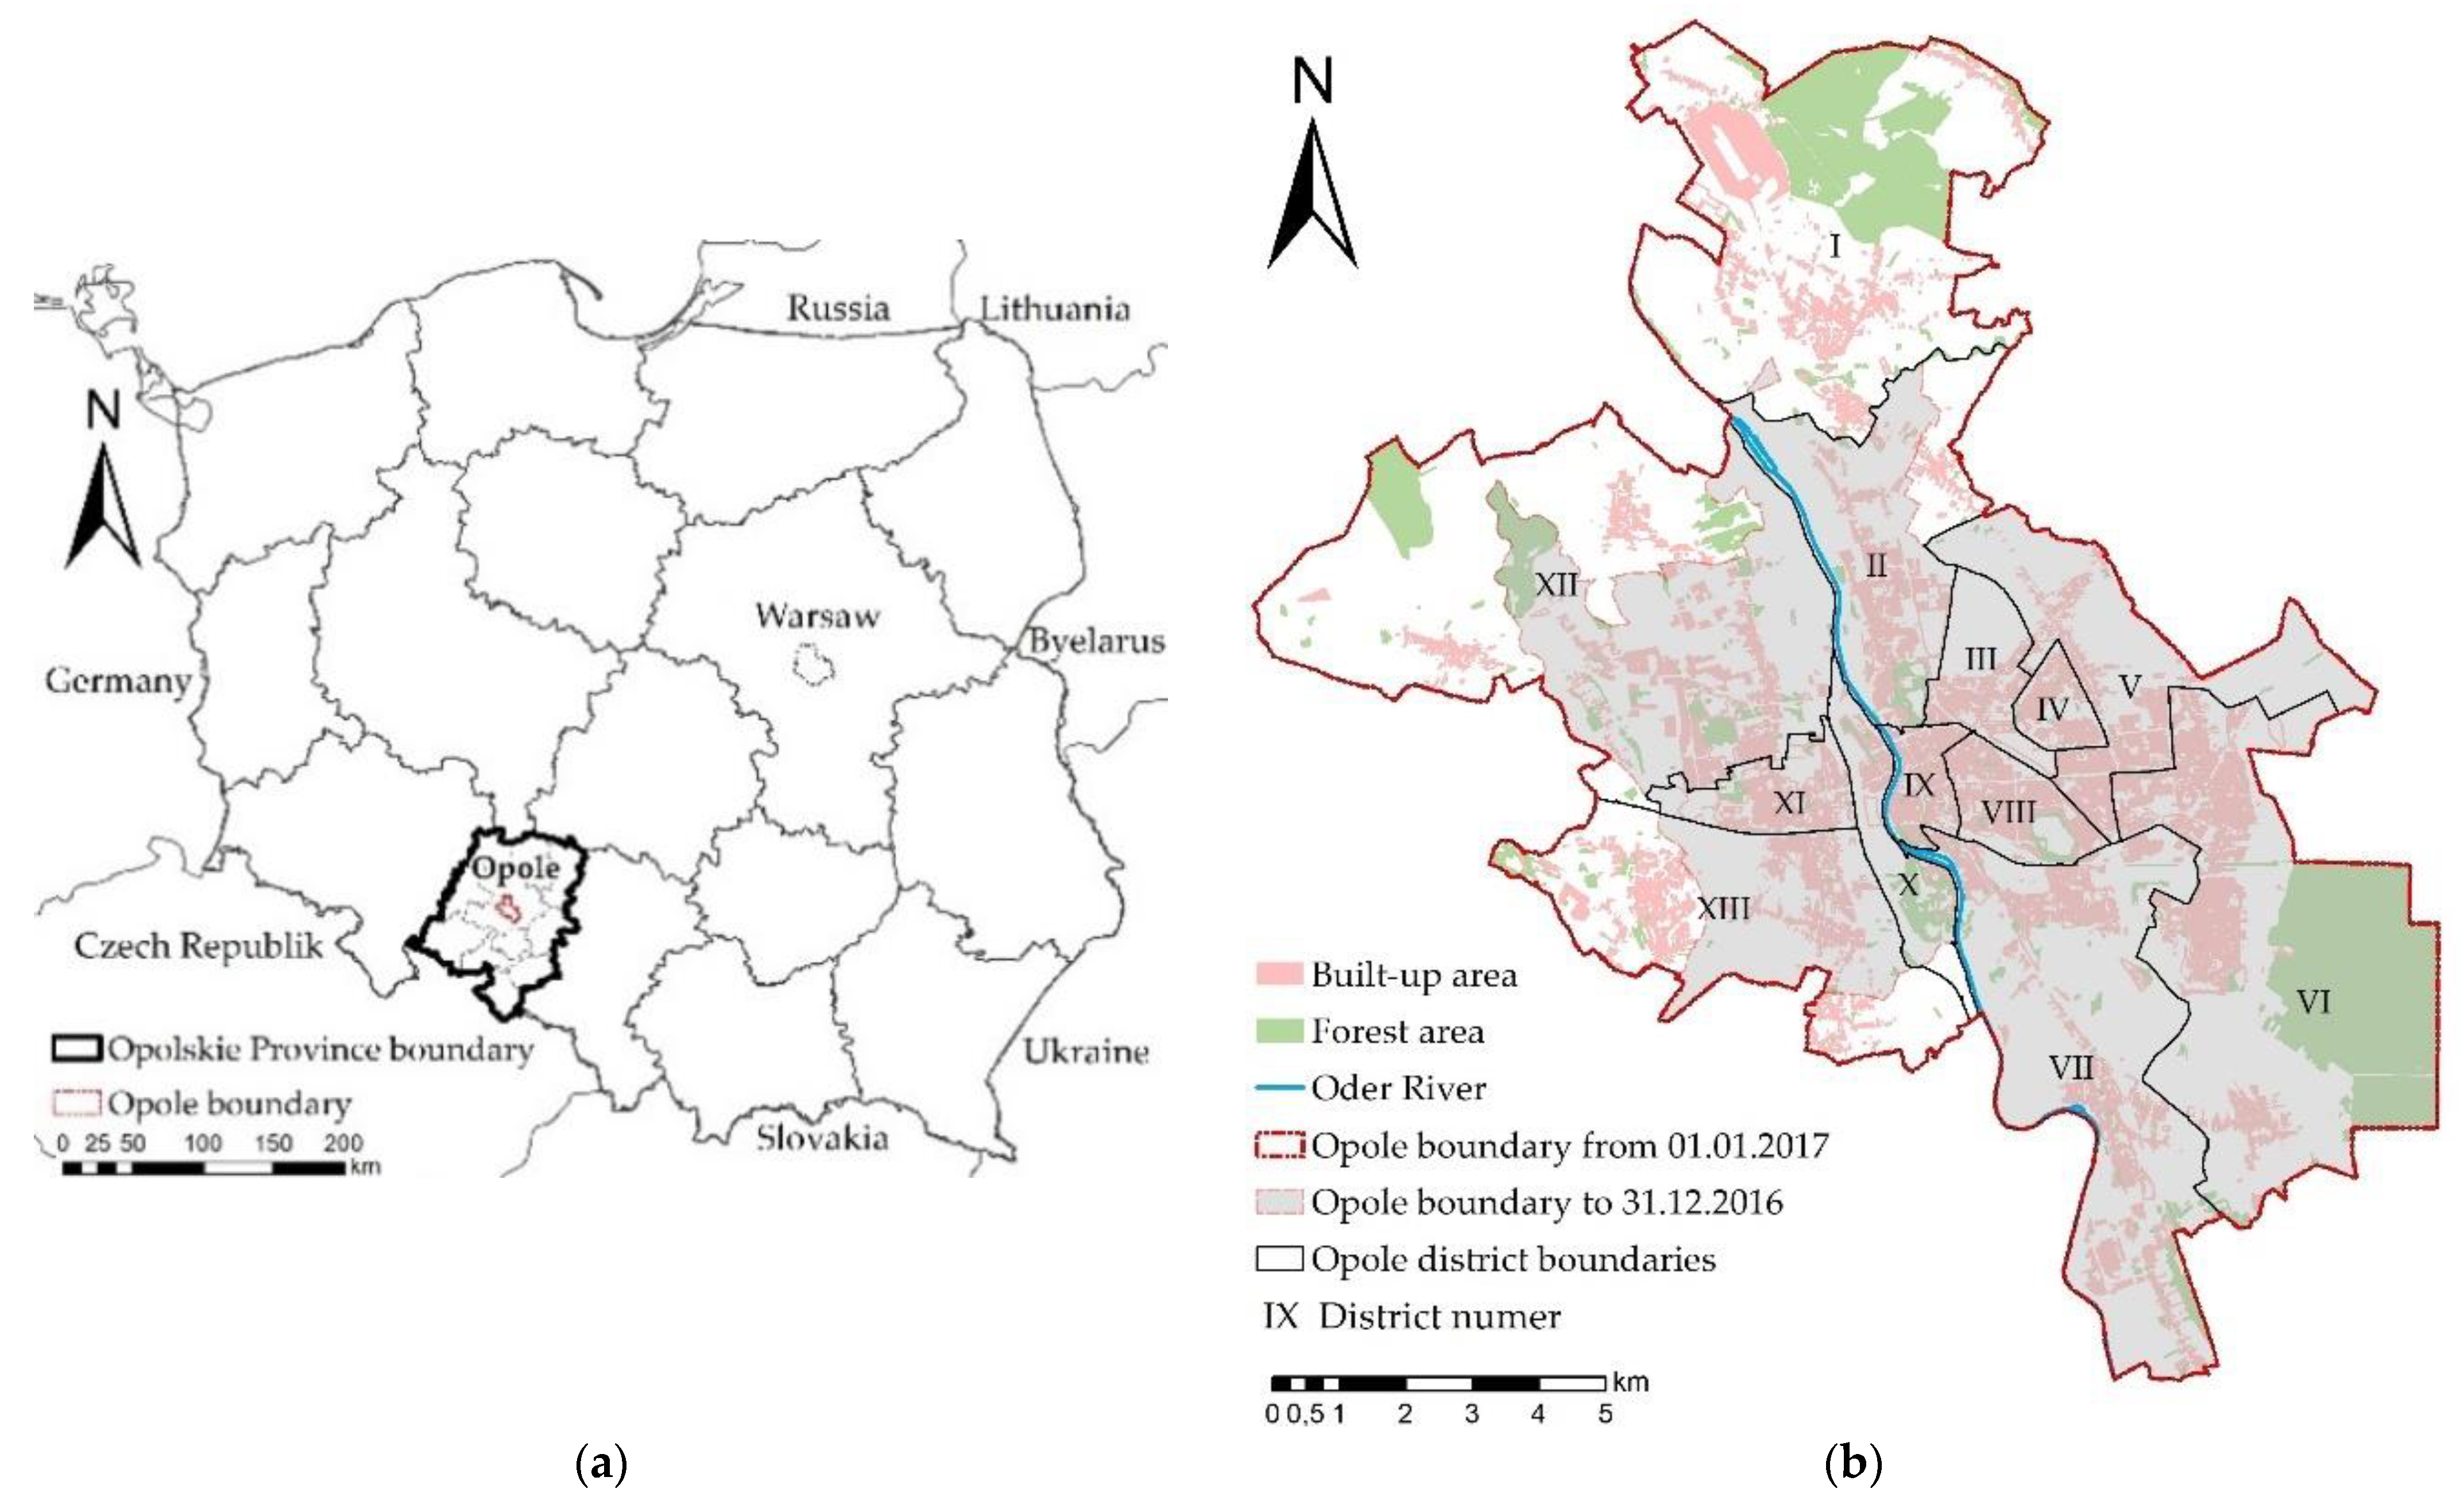
2.1. Study Area

The city of Opole is located in south-western Poland (50°39′53″ N, 17°55′37″ E); it is the capital of Opole Province and the core of Opole Agglomeration (Figure 1). As the largest economic, academic, and cultural centre, Opole is an important labour market for its inhabitants and the entire region. The city of Opole was enlarged on 1 January 2017 by the inclusion of 12 new villages into the existing city limits. Currently, Opole covers an area of 149 km2, which gives it the 15th place in Poland among districts and cities with district rights in terms of area. Before the enlargement of Opole’s boundaries, the area was 97 km2 in 2016 [67]. Opole is situated in the Odra River valley. Most anthropogenic areas are located in the city centre. In contrast, most agricultural, forest, and semi-natural areas are located in the northern part of the city and on its western outskirts. Local spatial management plans are in force in the analysed area and cover 37% of the city’s total area; further management plans are being prepared, which will additionally cover approx. 10% of the city’s area. The current planning documents cover mainly the city centre and its immediate surroundings, while the outskirts of the city, especially the areas that were annexed to Opole in 2017, are not covered by management plans [68].

2.2. Datasets and Sources

The time period of the study was 2000–2020; we targeted at 5-year interval and downloaded data for the years: 2000, 2005, 2010, 2015, and 2020. Year 2000, preceded by the systemic transformation lasting over 10 years in Poland, was adopted as the reference period. In turn, 2005 was the year after the Polish accession to the EU and in 2010 the largest decline in the number of residents of Opole was recorded. Further on, in 2015, the largest increase in build-up areas occurred in the analysed area as recorded between 2010 and 2015.
To identify changes in Land Use and Land Cover (LULC) over the past 20 years, multispectral satellite imagery Landsat 5 Thematic Mapper (TM) and Landsat 8 Operational Land Imager (OLI) were downloaded from the Earth Explorer portal (https://earthexplorer.usgs.gov, accessed on 10 March 2021) of the United States Geological Survey (USGS). Landsat datasets cover the study area from 2000, 2005, 2010, 2015, and 2020 (Table 1). Due to the short imaging times of these satellites, Sentinel 2 Multi Spectral Imager (MSI) satellite multispectral imagery acquired from the Copernicus Open Access Hub (https://scihub.copernicus.eu/dhus/#/home, accessed on 10 March 2021) provided by European Space Agency (ESA), covers the study area in 2015 and 2020 only (Table 1). Landsat and Sentinel satellite images are very useful in this study because they have similar spectral ranges and are considered one of the most reliable, effective, and publicly available sources for LULC detection and quantification over the years due to their spatial resolution, spectral resolution, synopticity, and the frequency of real-time data acquisition [25].
Ancillary data, such as aerial photographs, were used to identify different areas undergoing LULC changes to validate our results; while demographic data concerning, inter alia, the number of population according to the division into urban units that make up Opole’s districts, taking into account the enlarged city boundaries in 2017 to include the areas of neighbouring municipalities, were obtained from the population register resources of the Opole Municipality and the offices of the attached commune offices (Table 1).

2.3. Methods of Data Analysis

The research conducted in this study was divided into four main stages within the adopted research procedure. The first step was to analyse and pre-process the available Landsat and Sentinel satellite imagery. The second step was the detection of LULC types and their variations using supervised spectral classification. In the third step, we analysed the spatial and temporal changes of built-up areas. The last step analysed the growth of built-up land in relation to population representing land consumption. This procedure was repeated for the 2000, 2005, 2010, 2015, and 2020 imagery. In order to implement the procedure adopted in this way, ArcGIS ESRI and SNAP software was used for image processing, spatial raster analysis, and creation of digital GIS maps. Detailed procedure of the approach has been described below.

2.3.1. Data Processing

Availability of Landsat and Sentinel satellite imagery for the study area was analysed. The selection criteria were the images recorded in the spring-summer months as well as low cloud cover and processing in terms of atmospheric correction. Next, colour compositions were developed for the acquired images in order to visualise land cover features characteristic for built-up and agricultural areas, bare land, water, and forest areas. Compositions in natural RGB colours (bands: visible red, visible green, visible blue) were developed to distinguish from forms of land use, such as large-scale buildings, watercourses, agricultural areas, or green areas. Composition in unnatural CIR colours (bands: near-infrared, visible red, visible green) enabled one to isolate and visualise areas of low greenery and forest areas as well as exposed soil in cultivated fields and water areas. In order to distinguish more accurately between the areas of urban development and undeveloped areas, false colour composites were developed (bands: near-infrared, short-wave infrared, visible red). For the analysis of distribution of geological formations and discovered soils, false colour composite (bands: mid-infrared, near-infrared and visible red) was prepared. Remote sensing indices were then calculated to improve the interpretation of multispectral satellite imagery in terms of the LULC types present. The Normalised Difference Vegetatnion Index (NDVI), a commonly used vegetation index to determine the state of vegetation development and condition, was calculated which negative values found in impervious areas [69]; Equation (1):
NDVI = ( NIR RED ) / ( NIR + RED )
where NIR is band Near-Infrared and RED is band Visible red.
While Normalised Difference Built-Up Index (NDBI) was used for automatic mapping of built-up and bare soils [70,71,72]; Equation (2):
NDBI = ( SWIR 1 NIR ) / ( SWIR 1 + NIR )
where NIR is band Near-Infrared and SWIR1 is band Shortwave Infrared.
Normalised Difference Bare Land Index (NBLI) was also used to automatically map bare soil areas only for Landsat imagery due to Sentinel 2 imagery not having TIR channel [73]; Equation (3):
NBLI = ( RED TIR ) / ( RED + TIR )
where RED is band Visible red and TIR is band Thermal Infrared.

2.3.2. Land Use and Land Cover Classification and Changes between 2000 and 2020

Spectral classification of satellite images was done based on the supervised classification using the maximum likelihood classification algorithm method (MLC), which is the most widely adopted parametric algorithm for land cover classification due to minimal miscalculation probability [69,74,75]. The types of each land cover class were defined for each satellite image by identifying homogeneous groups of pixels (training fields), for the photo interpretation of which the colour compositions and remote sensing indices developed in earlier steps of the research procedure and multi-temporal Google Earth aerial photographs were also used [76]. For the remaining pixels, the programme using the MCL algorithm automatically assigned a class based on the similarity of their spectral responses to the LULC class patterns defined in the system [77]. Each pixel was categorised into one of the four developed LULC classes: built-up area (residential, commercial, and service; industrial and transport; as well as recreational urban areas); vegetated areas (arable land, meadows, pastures, areas covered with low vegetation, allotment gardens, fallow land, and bare soil); wooded areas (forests, parks, wooded and semi-natural areas); and surface water areas (rivers, canals, reservoirs). The assessment of classification accuracy was also performed to quantitatively determine how effectively the pixels are grouped into the correct feature classes [78]. For this purpose, the test fields were distributed evenly outside the areas of the training fields, supported by information from the analysis of accurate maps (e.g., multi-temporal aerial photography, orthophotomaps). On the basis of confusion matrix, it was possible to analyse parameters describing classification accuracy, such as overall accuracy, which is defined as accuracy between the classified map and the reference data as well as Kappa coefficient defining total classification error and the degree of conformity between the compared images. Kappa coefficient greater than 0.80 indicates excellent agreement; a value between 0.4–0.80 indicates moderate agreement, and a value less than 0.4 indicates poor agreement between classification categories [78]. Such analyses resulted in raster maps of LULC classification; also, magnitude of changes for the individual land cover class in each period were calculated.
In order to identify the pattern of urban growth, built-up area class was used to represent urban expansion areas from 2000 to 2020. Spatially delimited buffer zones were designated, whose equidistances from the city centre were determined on the basis of the identified characteristics of each zone in the urban organism, i.e., core area (0–3 km), outer core area (3–6 km), and urban fringe area (more than 6 km). For the designated zones, raster maps of built-up area classification in particular zones were estimated, and the magnitude and percentage of changes in each research period were calculated annually. The average 5-year rate of change in the built-up areas, by means of relative chain indices, was analised [79]; Equations (4) and (5):
Rate   of   change   in   the   built-up   areas = [ ( Urbt + n / Urbt ) 1 ] · 100 %
Average   rate   of   change   in   the   built-up   areas = t = 1 n 1 Urbt + n / Urbt   n 1
where Urbt+n is the area of built-up class at the final year (t + n), Urbt is the area of built-up class in initial year (t), and n is the number of the periods.

2.3.3. Efficiency Analysis of Built-Up Areas Use in Relations to Population

In order to analyse in more detail the process of Opole’s development in the last 20 years and to assess whether the growth of built-up areas in relation to the changing population was sustainable, the following formula was used: Ratio of Land Consumption Rate to Population Growth Rate (LCRPGR) proposed by UN-Habitat [80], which measures the ratio between Land Consumption Rate (LCR) and Population Growth Rate (PGR). Land Consumption Rate (LCR) is an indicator that, in this research, refers to the percentage of built-up areas that were newly developed over a given time period and reflects urban expansion. Population Growth Rate (PGR) is an indicator that reflects population growth over a given period, expressed as a percentage of the population at the beginning of that period. It reflects the number of births and deaths in a given period and the number of migrants. The analysis that integrates earth observation (EO) and population data provides the opportunity to derive new metrics at any time that are important for capturing important dimensions in urban planning and management [81]. The SDG indicator 11.3.1 Ratio of land consumption rate to population growth rate (LCRPGR) is an example of this type of data combination [82]; Equations (6)–(8):
LCRPGR = LCR / PGR
LCR = ln ( Urbt + n / Urbt ) / y
PGR = ln ( Popt + n / Popt ) / y
where Urbt+n is surface occupied by areas urban areas at the final year (t + n), Urbt is surface occupied by urban areas at the initial year (t), Popt+n is population living in urban areas at the final year (t + n), Popt is population living in urban areas at the initial year (t) and y is the number of years between the two periods: (t) and (t + n).
LCR < 0 indicates a built-up area decrease as compared with the previous period, whereas LCR > 0 indicates an increase in the built-up area [81]. Similarly, PGR > 0 indicates a population increase as contrasted with the previous period; PGR < 0 indicates a population decrease and the city is classified as a shrinking city, suggesting that the population and vitality are decreasing.
Alternatively, Land Use Efficiency (LUE) has been calculated as it may be difficult to capture the dynamics of cities with negative or zero growth via the global indicator LCRPGR computation. The Land Use Efficiency indicator measures the change rate of the built-up area per capita (Idxt). It was calculated according to the formula proposed by Corbane et al. [83]; Equations (9)–(11):
Idxt = ( Yt Yt + n ) / Yt
Yt = BUt / Popt
Yt + n = BUt + n / Popt + n
where BUt is surface occupied by built-up areas at the initial year (t), Popt is total population within the built-up areas at the initial year (t), BUt+n is surface occupied by built-up areas at the final year (t + n) and Popt+n is total population within the built-up areas at the final year (t + n).
For the calculation of both LCRPGR and LUE, built-up area class as urban areas was used. The LUE indicator can be estimated at different time intervals upon the availability of observations. For the comparability of the results of 5-year time intervals, the Idxt values were normalised to obtain the average annual change; Equation (12):
dxt = [ ( Yt Yt + n ) / Yt ] · 1 / y
where y is the number of years between the two periods: the initial year (t) and the final year (t + n).

3. Results and Discussion

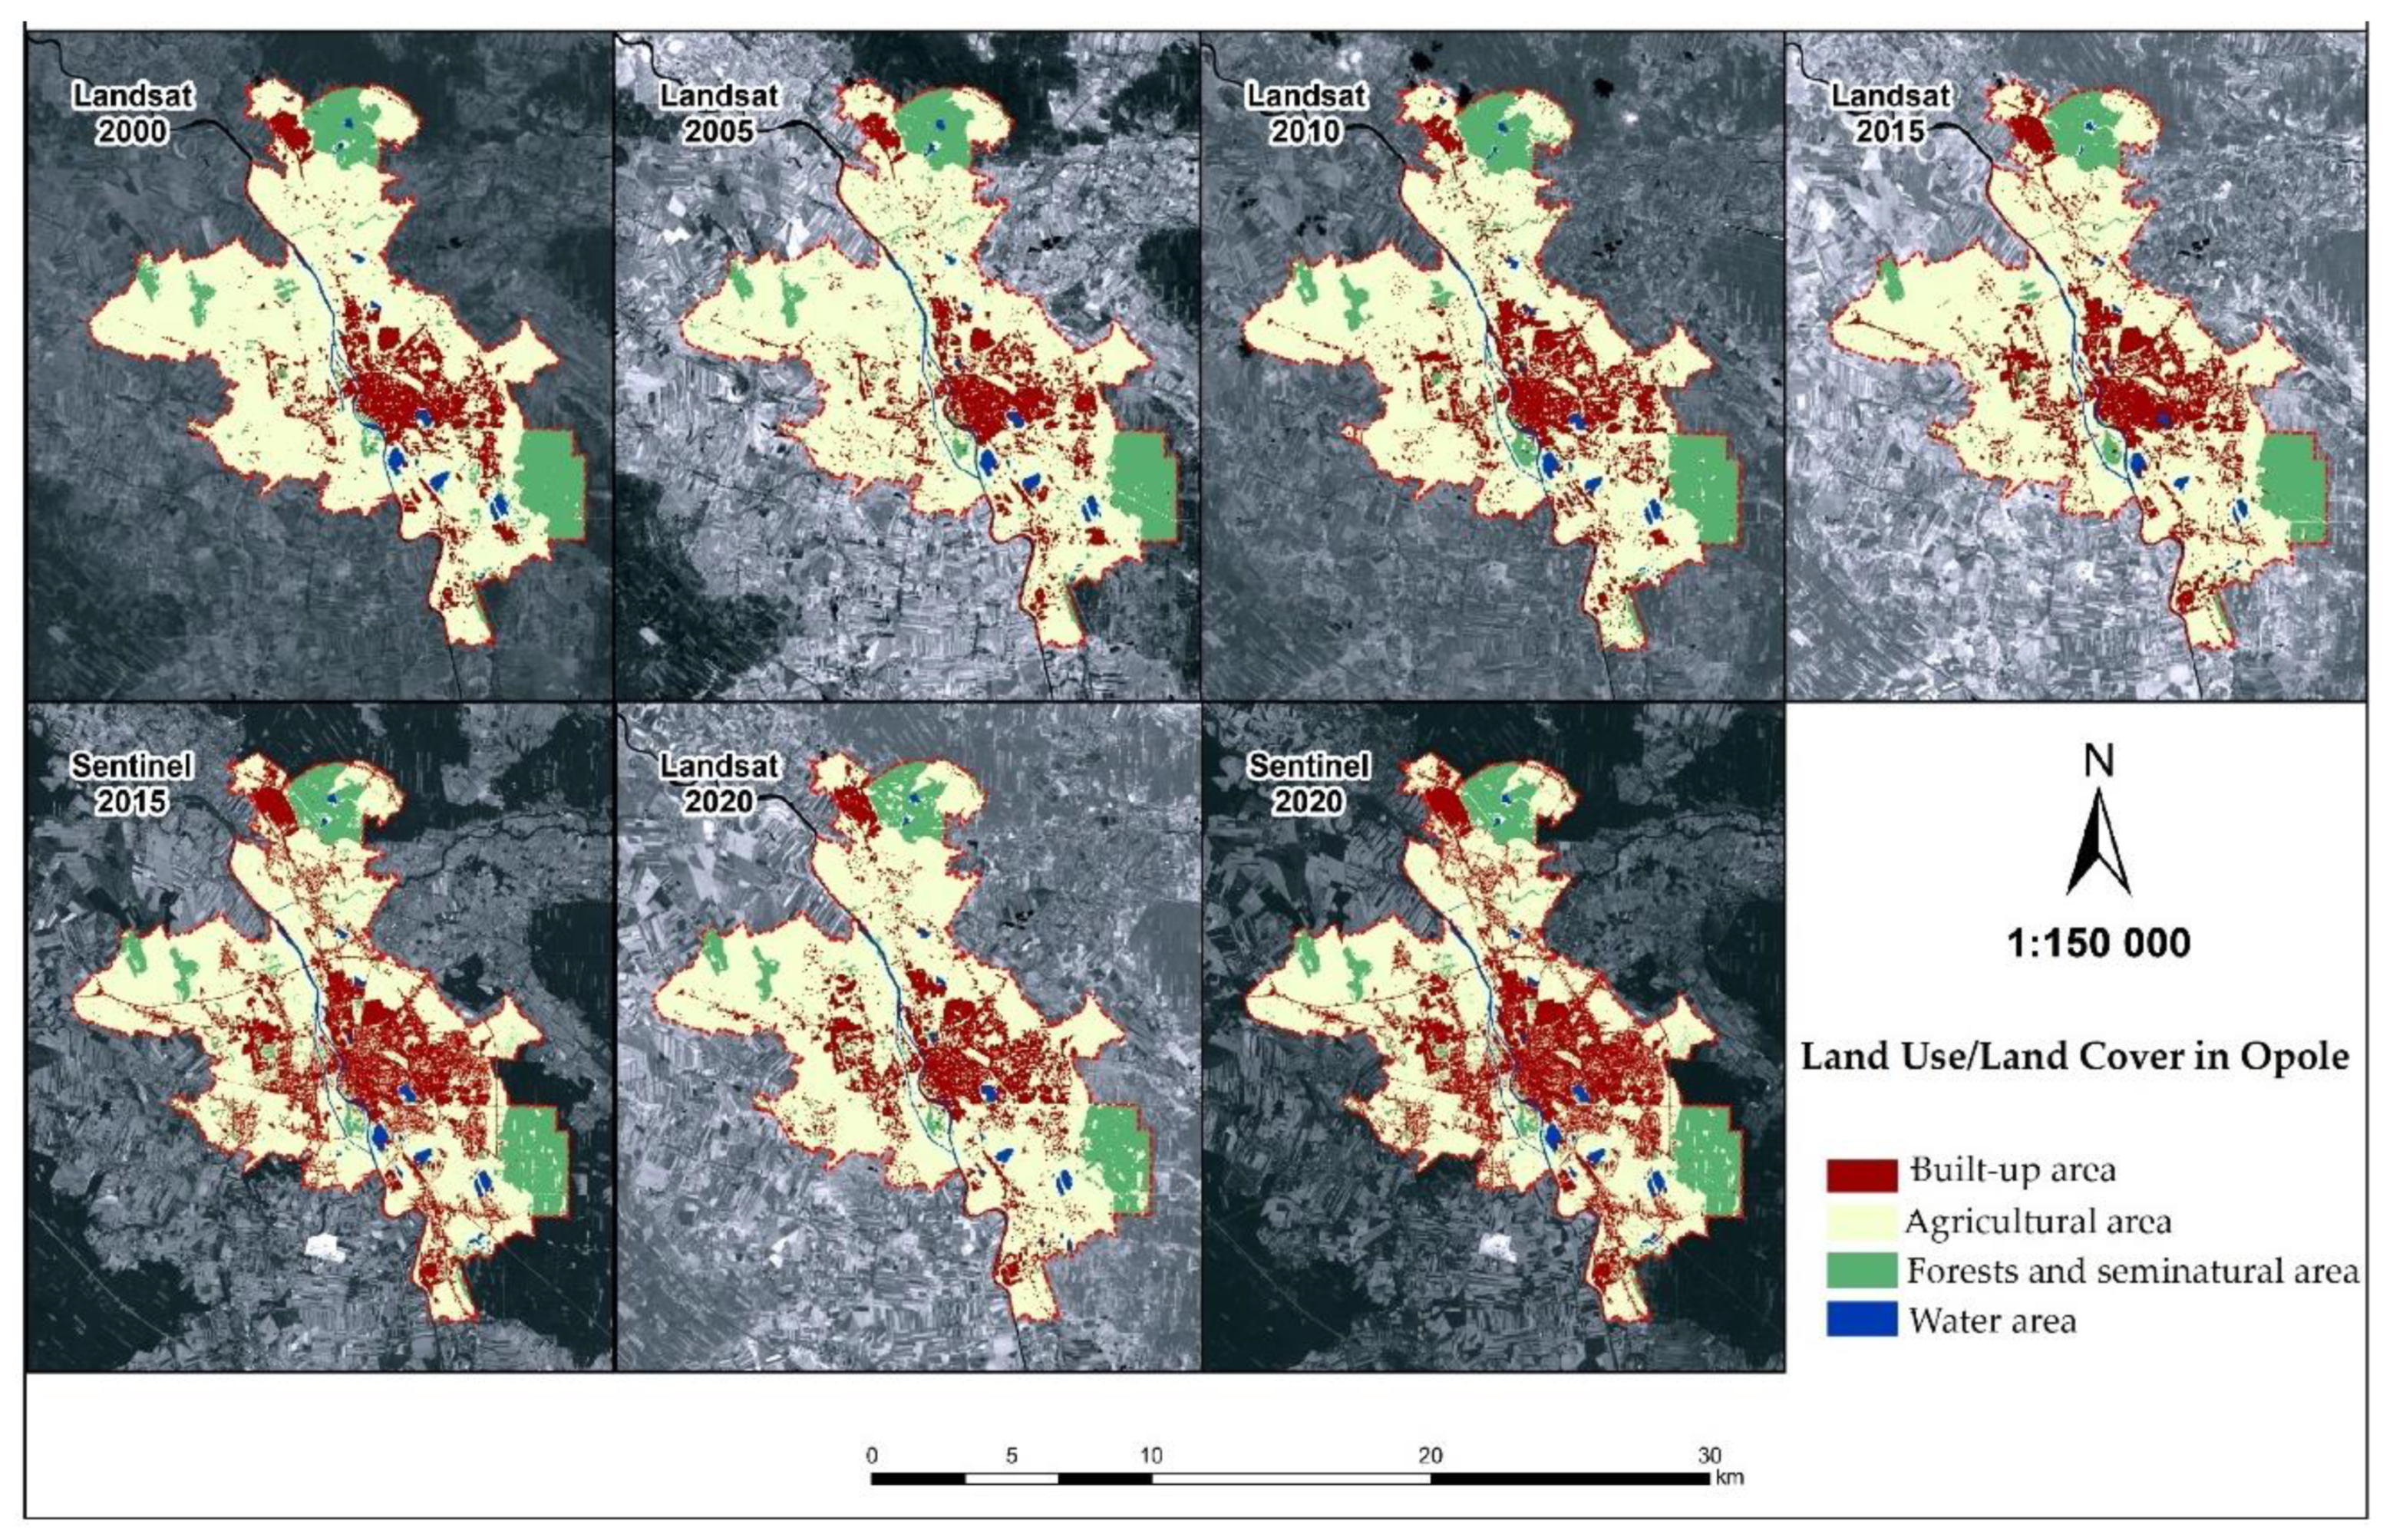
3.1. Assessment of Land Use and Land Cover Changes in Opole between 2000 to 2020

The spatial distribution of LULC extracted from the spectral classification of Landsat 5, Landsat 8 and Sentinel 2 satellite imagery indicates that in the study area, LULC were subject to continuous change (Figure 2). Overall accuracy for the classified LULC based on Landsat images was 88–92% of correctly assigned pixels to each class and Kappa coefficient was 0.79–0.83, and overall accuracy 89–95% and Kappa coefficient 0.80–0.86 for Sentinel images. All overall accuracies are above 85%, signifying an effective image processing approach used in the study.
Over a period of 20 years, urban development has led to the expansion of the city leading to changes in land use (Figure 2, Table 2). There is a clear increase in the concentration of development not only to the east, but also to the west of the Odra River.
Analysing the results obtained from Landsat imagery, one can see an increase in the area occupied by built-up area by about 880 ha between the reference year 2000 and 2020 (Table 3). The percentage of built-up land in relation to the total area of the city increased from 15.4% in 2000 to 21.3% in 2020. Built-up areas increased their area in the city’s spatial structure mainly at the expense of vegetation areas, i.e., agricultural areas, meadows, and low greenery, which lost approx. 845 ha; the percentage of vegetation areas decreased from 70.3% to 64.6%. The highest intensity of urban spatial development occurred between 2010 and 2015, which is when built-up areas increased by more than 300 ha (Figure 2, Table 3).
On the other hand, the analysis of built-up areas extracted on the basis of Sentinel satellite imagery classification shows that these areas covered about 3305 ha in 2015 and about 3530 ha in 2020. The sizes of these areas are on average about 350 ha higher than those extracted by the spectral classification of Landsat imagery in 2015 and 2020 (Table 2). Sentinel images have a higher spatial resolution; therefore, additionally roads or other traffic routes as well as less dense buildings were detected (Figure 2). Still, the differences in built-up areas between 2015 and 2020 calculated from Landsat and Sentinel imagery classification results are very similar in percentage points (+1.4 pp and +1.5 pp, respectively) (Table 3). Therefore, it can be concluded that Landsat images successfully show the general trend and directions of changes in the LULC structure of the analysed area even though they do not detect smaller buildings as precisely as Sentinel images.
The analysis shows that agricultural land, despite its decline over the last 20 years, is still the dominant form in the overall LULC structure, which classifies Opole as a city of agricultural type; it is also confirmed by the results of the study presented by Pieńkowski et al. [85]. The study of the changing structure of LULC is important because it enables the analysis of the dominant landscape background, which can be helpful to assess the quality of life of inhabitants, both for cities located in anthropogenic and agricultural landscapes. Interesting studies were also presented by Castanho et al. [36]. The results of the studies show that in the south-western region of Poland (e.g., in the Opolskie Province where Opole is located), in the general structure of land cover between 1990 and 2006, the largest number of crops, meadows, and pastures disappeared, while most urban buildings appeared. Castanho et al. [36] also shows that the entire territory of Poland between 1990 and 2012 gradually changed its land use from agricultural to artificial surfaces and land use changes did not follow the trend of LULC changes observed in the countries that neighbour Poland (Germany, Germany, Slovakia, and the Czech Republic), where land use changes were not so smooth but much more radical. In fact, the results and trends of LULC changes obtained in Poland are much closer to such countries as Slovenia, Malta, Cyprus, Hungary, Ireland, Bulgaria, Belgium, or France. Research in this area was also presented by Gibas [30], who shows that contemporary Polish cities are characterised by high dynamics of change. This results both from the increase in the share of built-up areas in the overall structure of cities and increasing urban densification as well as from the degradation of post-industrial areas and increasing spatial chaos.

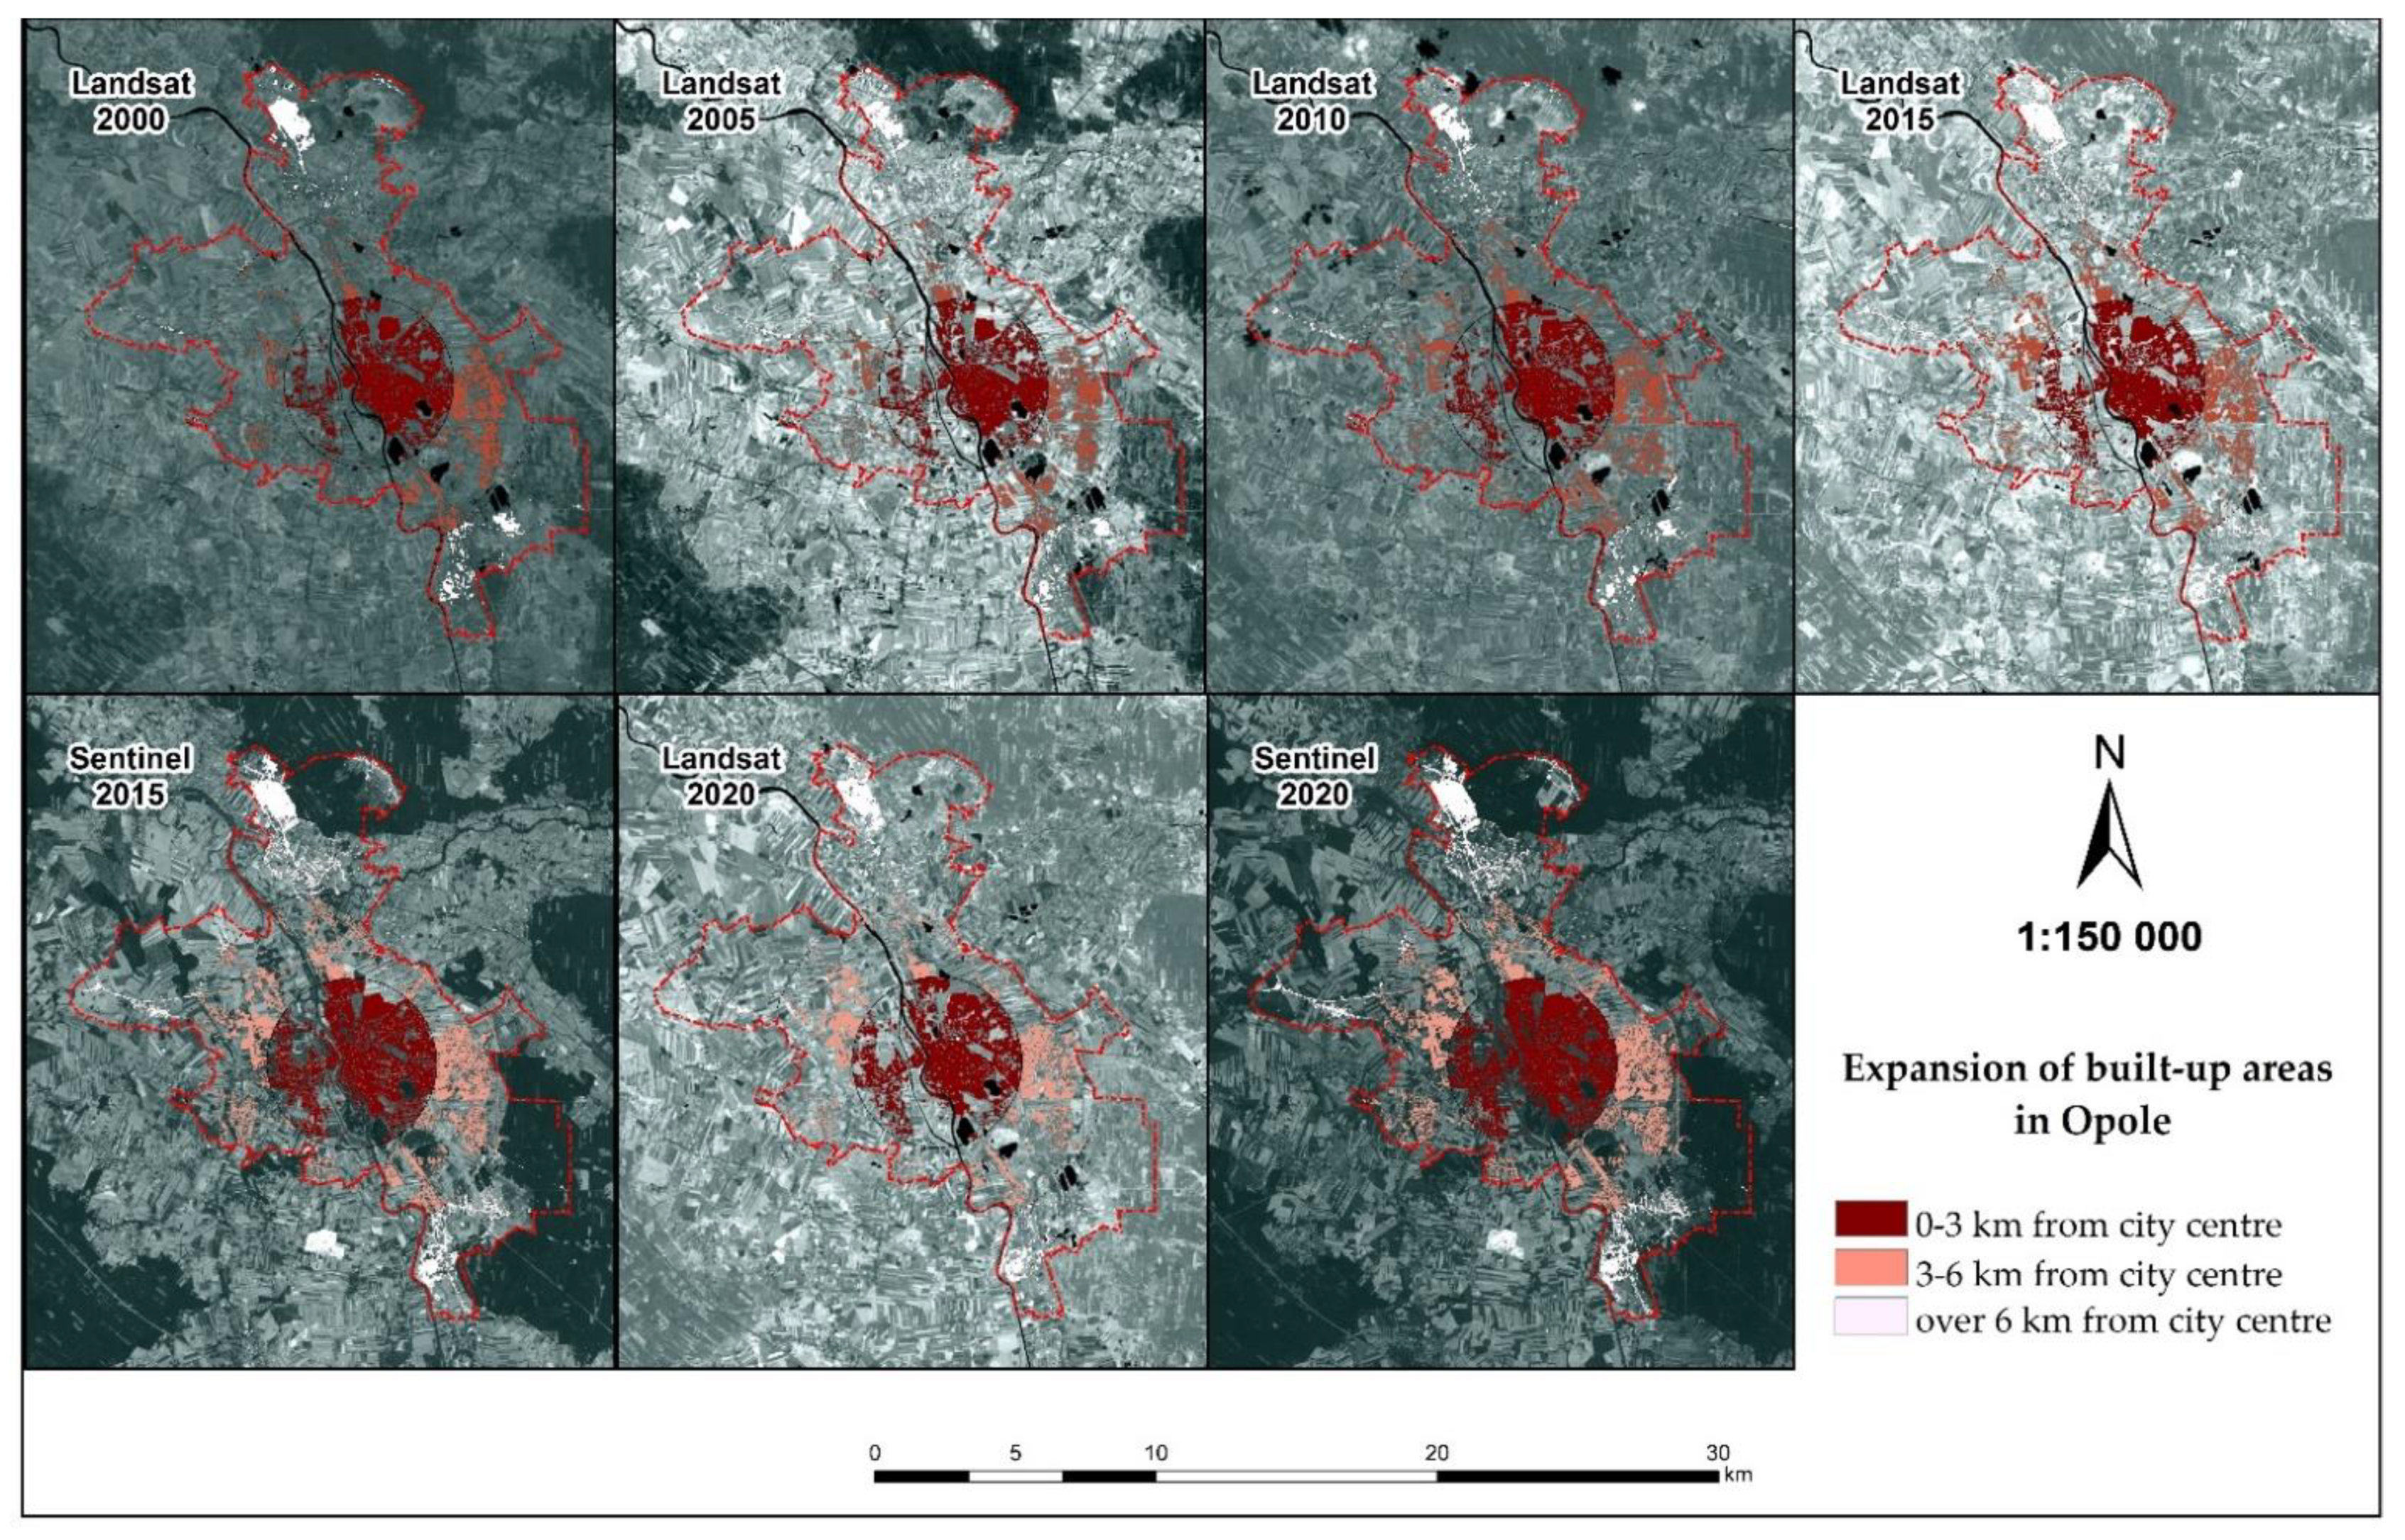
3.2. Spatial Expansion of the Built-Up Areas in Opole between 2000–2020

Appropriately developed and spatially delimited equidistances from the city centre (Figure 3) enabled detailed analyses of the magnitude, percentage, and average changes rates for the built-up areas in each buffer zone. A buffer zone delimited within 3 km of the city centre has been adopted as core area where the density of built-up areas is high due to residential areas, public utilities, and road network, which gives a compact picture of the built-up area (Figure 3). A buffer zone of 3–6 km from the city centre has been designated as an outer core area because residential areas are also visible here. A buffer zone defined beyond 6 km from the city centre has been adopted as urban fringe area because this area includes the city’s peripheral districts and is influenced by the administrative boundary. Urban-rural interaction is evident here due to the dominant presence of agricultural land and new dispersed detached housing occurs (Figure 3).
The study indicated that from 2000 to 2020, the distribution of built-up area has formed a dense spatial pattern in the city centre, and the built-up area is increasing from the centre towards the peripheral districts in each of the buffer zones, even on the western bank of the Odra River (Figure 3), where initial interest in urban development, especially housing, was limited due to the effects of the 1000-year flood that took place in 1997. Such trends continue also in other regions of Poland where an exceptionally large area was built up in Poland despite the threat of floods or landslides [36].
On the basis of conducted surveys, it may be noticed that the share of built-up area in the total built-up area, i.e., 43% in 2020, in Opole is still slightly higher in the zone up to 3 km from the city centre, where historical downtown buildings surrounded by multi-family residential estates dominate, than in the zone 3–6 km from the city centre, i.e., 38% in 2020 (Table 4). The largest amount of built-up area, i.e., over 400 ha, occurred in the zone from 3 km to 6 km from the city centre. In the zone up to 3 km, about 260 ha accrued, and in the zone above 6 km, about 200 ha (Table 5).
Centralised and dense buildings in the historical urban core is a characteristic of European cities [86] and dense artificial land cover is consistent with the idea of a compact city with dense buildings and a well-functioning public transport system [87]. High spatial resolution satellite data are used to analyse both the rapidly growing urban fringes in developing countries and the less rapidly growing urban cores in older cities [88]. An interesting study in this regard was presented by Dhanaraj and Angadi [52], where—also with the help of satellite imagery and GIS—an increase in built-up area in Mangaluru (India) was detected due to intensive growth of built-up area in the urban core, which proved the compact nature of growth of this city.
Our research shows that the fastest rate of growth of built-up area in the last 20 years took place in the zone 3–6 km from the centre of Opole, where every 5 years an average rate of growth of built-up area by 11.70% was recorded due to the development of multi-family residential estates (Table 6). A slightly lower average rate of growth of the built-up area, i.e., 10.43%, also occurred in the zone above 6 km from the centre of Opole, where, with the increasing share of the built-up area, the zone is gradually losing its agricultural character and transforming into compact, mono-functional estates with detached housing.
The lowest average rate of change of the built-up area, i.e., approx. 5.23%, took place in the zone from 3 km from the city centre (Table 6). The analysis shows that areas away from the city centre expand faster than those near the centre. The study by Cieślak et al. [58] shows that in many Polish cities, there is a growing tendency to live in urban fringe and suburban zones, despite the implementation of many measures aimed at transforming cities into more sustainable forms, such as compact city. Built-up area monitoring can be used as an important indicator to assess the degree of urbanisation of cities [89,90]. Therefore, assessing the extent, spatial patterns, and dynamics of change of impervious surfaces using satellite imagery and GIS is crucial for achieving sustainable development goals.
According to Kowalewski et al. [31], with the growth of new built-up areas away from the centre, also the level of technical infrastructure often deteriorates. A significant problem is often the lack of utility networks, hardened communication routes, and restrictions in access to public facilities. On the basis of Statistics Poland data, residential buildings in Opole connected to the water supply system in 2015 accounted for 92% of all residential buildings and in 2019—79% [67]. On the other hand, in 2015, according to Statistics Poland data, 90% of all residential buildings in Opole were connected to the sewage system and in 2019—85%.

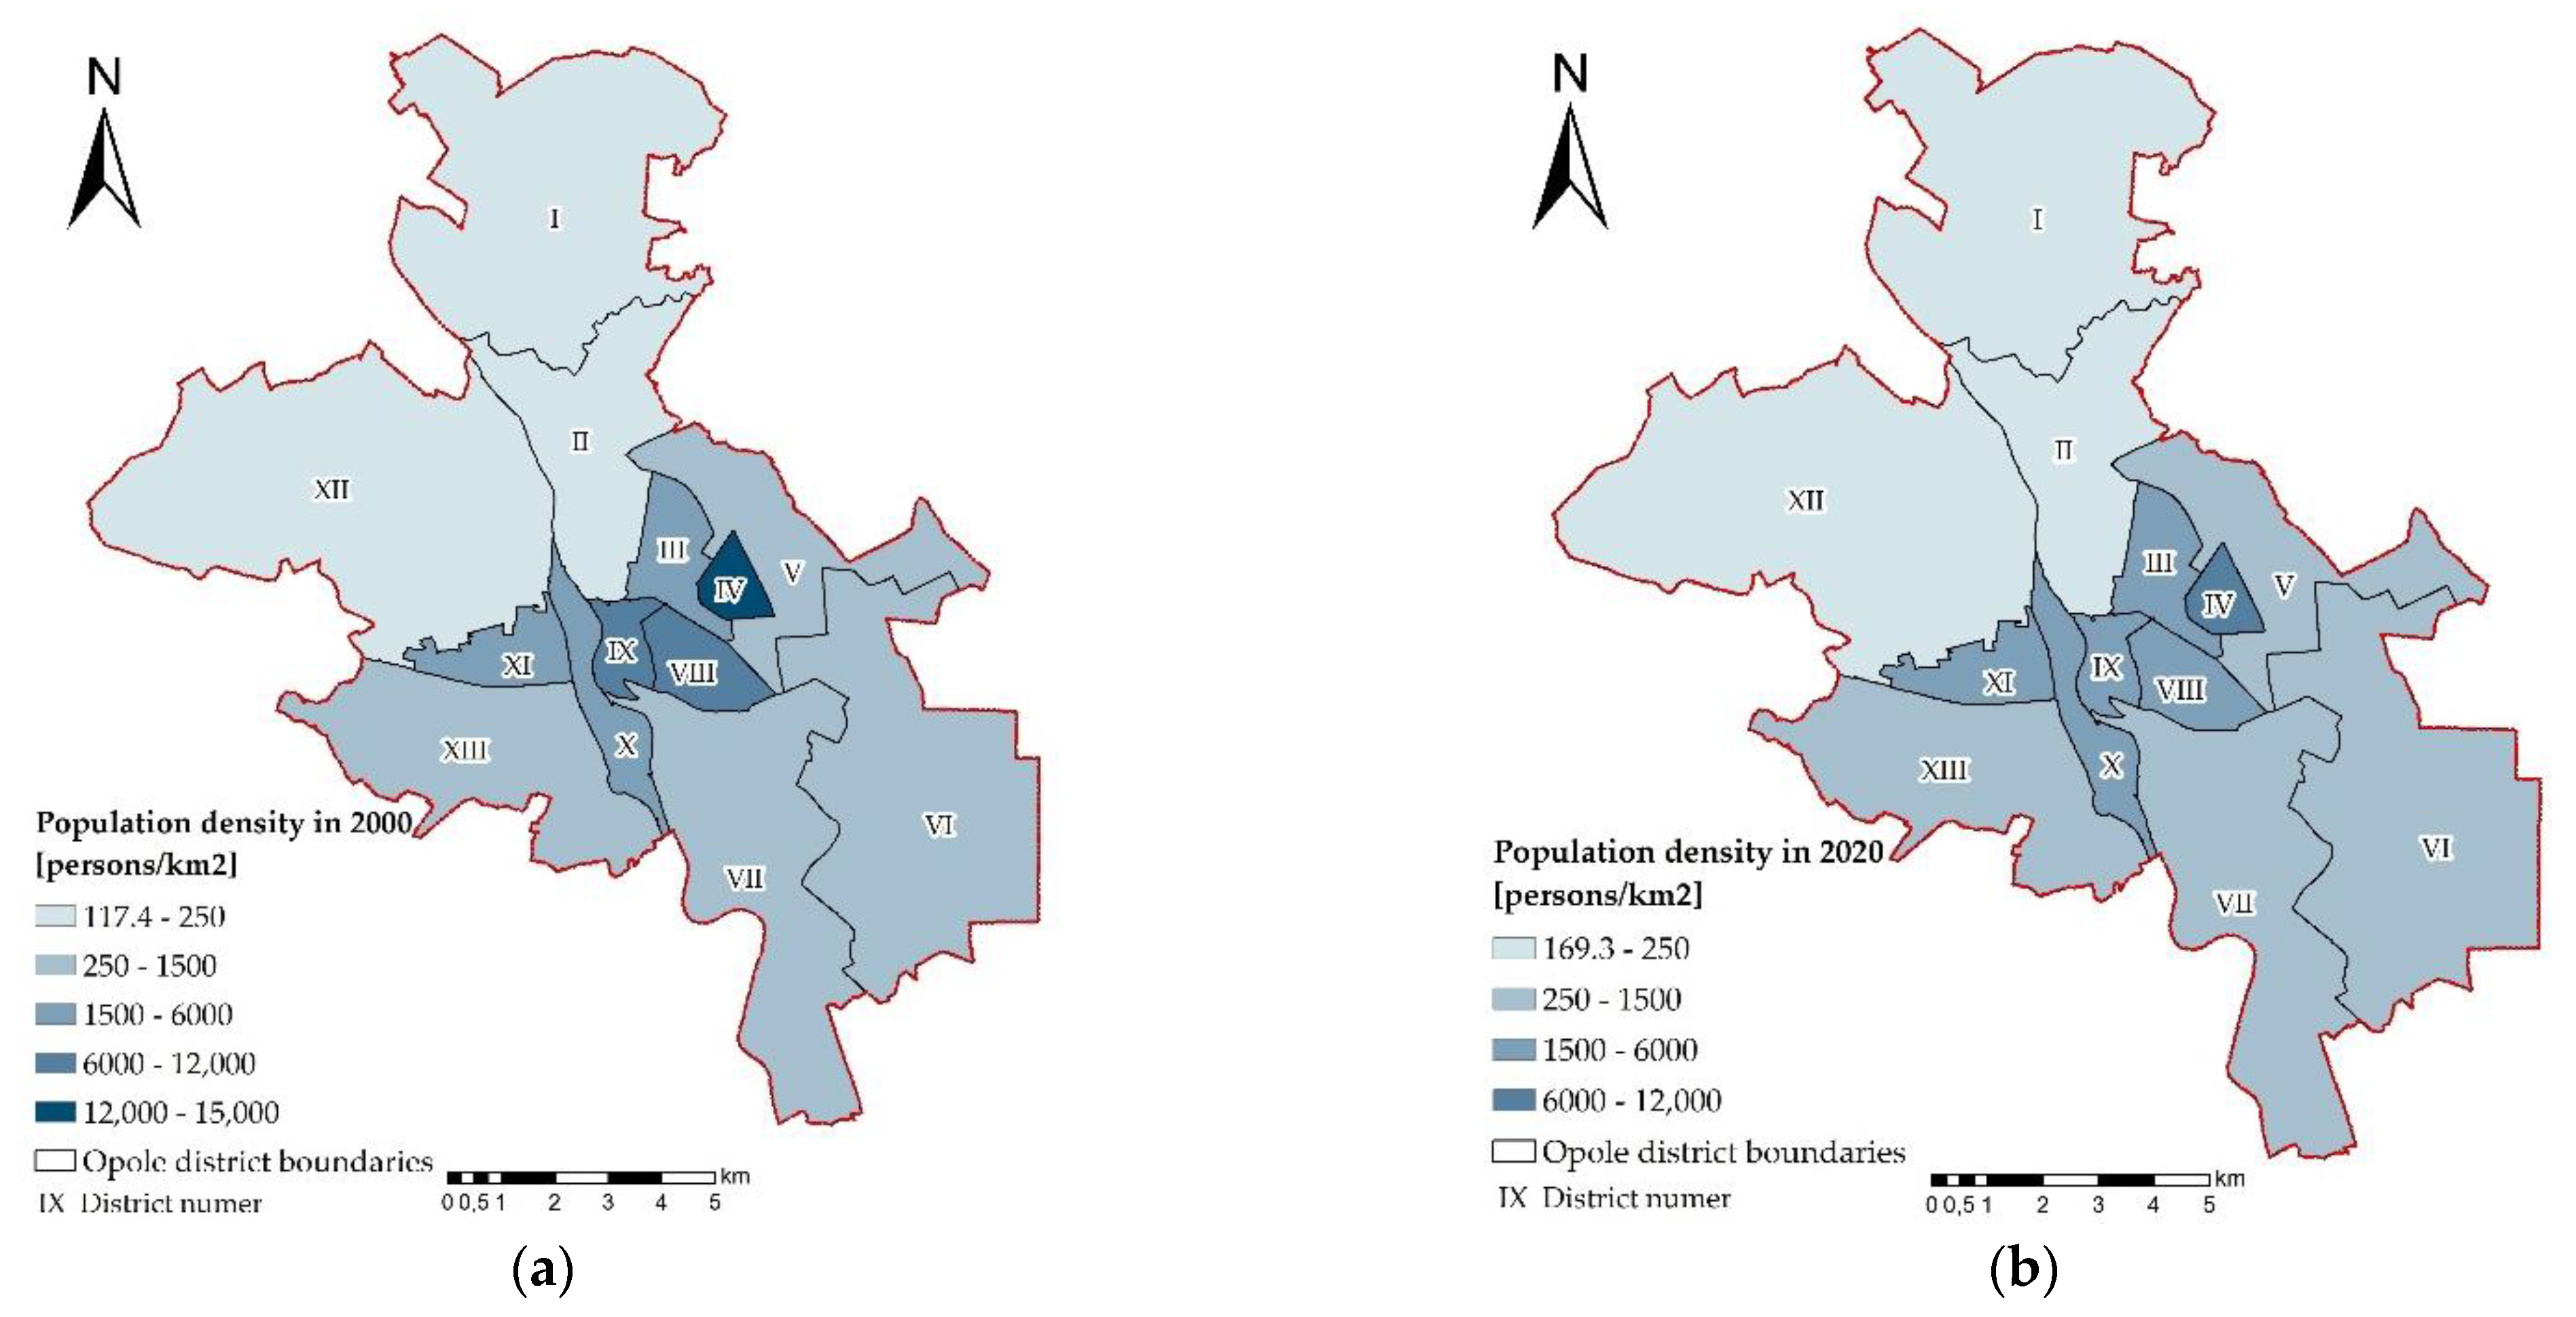
3.3. Changes in the Land Consumption and Population Dynamics in Opole between 2000–2020

The number of inhabitants of Opole has been systematically decreasing since the end of the 1990s [67]. In 2000, Opole was inhabited by about 130 thousand inhabitants registered for permanent residence, taking into account the number of inhabitants of attached villages according to the new administrative division as of 2017 (Table 7).
The study shows that the average rate of population decline in each successive analysed five-year time period was about 2% as compared to the previous time period. Negative natural growth and negative balance of internal and foreign migration of inhabitants had unfavourable influence on demographic processes. The Opole region, where Opole is located, is one of the fastest depopulating regions in Europe and the decreasing trend of population in Poland is already a nationwide problem [91,92]. Apart from the phenomenon of depopulation, a significant social challenge in Opole is the progressing process of ageing of the local community. Also unfavourable is the age structure projected to 2050, which shows a decline in the pre-working age population from 15% in 2015 to 12.5% in 2050, in the working age population from 62% to 55%, and an increase in the share of post-working age people from 23% to 32.5%. This means that the Opole community will be aging [93].
The study also shows that in the analysed area, there were changes in population density between 2000 and 2020 (Figure 4). The largest population increase over 20 years has been recorded in district V situated in the eastern part of the city. Alternatively, the highest population outflow and a significant decrease in population density by ca. 3000 people/km2 was recorded in district IV, which is one of the largest residential districts in Opole. Also, the population and population density decreased by more than 2000 people/km2 in district VIII and by more than 1600 people/km2 in district IX, both located in the city centre.
A significant decline in population was also recorded in district XI, which, like district IV, is a large residential area. In 2020, districts I and XII, both located in the northern and north-western part of Opole, at a considerable distance from the centre, had still the lowest population density, but with positive growth dynamics in relation to the reference year 2000. The highest population density, ca. 11,000 people/km2, is still found in district IV located in the city centre (Figure 4). However, in comparison with 2000, this district experienced the largest population outflow.
For particular research periods, Table 7 presents quantitative data concerning built-up area, developed on the basis of spectral classification of satellite images, in relation to population registered for permanent residence in Opole. The study shows that the analysed area had an upward trend in built-up area from 2000 to 2020 (Table 7). The average growth rate of built-up area in the next 5-year study period as compared to the previous one was 8.3%. In 2015, the built-up area increased by approximately 12% as compared to 2010. The population, instead, had a decreasing trend during the study period under analysis. The highest rate of population decline of about 3% occurred between 2000 and 2005 (Table 7). According to the research, despite the progressing depopulation process, in the analysed periods, an increase in built-up areas was recorded. The calculated Pearson linear correlation coefficient indicates a strong negative correlation between these processes (r = −0.97) over the past 20 years. This means that the city, despite its declining population, is growing spatially but the space, capital, and natural environment have been wasted. This results from the fact that during the analysed period of the last 20 years the local government of Opole have not pursued an effective spatial policy because the main elements of public infrastructure, conditioning the development of buildings and spatial management, were created mainly on the basis of location decisions, outside the system of planning acts [94]. Moreover, the coverage by local plans in Opole did not correlate with the construction and investment activity due to the lack of some local spatial development plans. Insufficient infrastructure of the city’s new investment areas and partial preparation of local spatial development plans was a major impediment to investing capital and attracting investments [95].
An interesting study was also conducted by Castanho et al. [36], which shows that taking into account the development indicators within the next 150–210 years, it is clear that land designated for development is of greater importance than the called demographic absorptiveness, i.e., the number of inhabitants who can settle down there. Opole, like other Polish cities [30], undergoes a process of internal demographic suburbanisation. In our study, this is also confirmed by the analysis of population density, which indicates depopulation of the city centre and an increase in population density in the outskirts of the city (Figure 4).
The National Urban Policy on sustainable urban development in Poland is relatively new and is just getting established [96]. This document implements the provisions of 2030 Agenda and the New Urban Agenda in terms of achieving SDG 11.3.1.; it also assumes strengthening the potential of urban settlements such as, among others, the city of Opole within the national networks of cities. The implementation of the provisions of the national urban policy by local authorities should counteract the negative phenomena of uncontrolled suburbanisation by shaping compact and sustainable cities [97]. Therefore, the intensity of urban expansion in Opole and demographic change in particular research periods was also analysed based on the results of the Ratio of Land Consumption Rate to Population Growth Rate (LCRPGR) analysis, which is a global measure of SDG 3.11.3, to identify land use efficiency during the process of urbanisation (Table 8). LCRPGR for all study periods had a value less than 0 (LCRPGR < 0). When the LCRPGR value is negative, it is not possible to rely solely on the LCRPGR value to reflect whether population or land has grown; it is, therefore, to reflect whether population or land has grown, we need to analyse the sign of LCR and PGR [81]. The LCR was used to quantify urban expansion and PGR was used to quantify demographic change. The study shows that the highest annual increase in LCR, i.e., to 0.022, occurred between 2010 and 2015, suggesting higher urban expansion during this time period (Table 8). The LCR value is low because LCR represents the annual rate at which cities uptake land for urbanised uses. In other time periods, the LCR was at a similar level (0 < LCR < 1), the growth rate of built-up was slow. As far as demographic changes are concerned, PGR was characterised by negative values (PGR < 0), which reflected the outflow of population from the city (Table 8).
The largest annual decline in PGR, i.e., to −0.006, occurred between 2000 and 2005. The average annual PGR values from 2000 to 2020 were approximately −0.004. Based on the analysis of the LCR and PGR, Opole should be categorised as demonstrating uncoordinated development type because the relationship between land use and population growth is unsynchronised. In the analysed period of the last 20 years in Opole, there have been a number of investments improving the spatial development and the quality of life of the inhabitants. However, despite the measures taken, there are still areas in the city that require special support [98].
We also analysed the urbanisation processes taking place in Opole over the last 20 years on the basis of Land Use Efficiency (LUE) (Table 8), which is an alternative to LCRPGR due to its easier interpretability [99]. Table 8 characterises the LUE estimates obtained for each study period, which reflected the change rate of the built-up area per capita. During these periods, the LUE estimates were negative because the expansion of urban areas in Opole was accompanied by a decline in population. For the period between 2000 and 2005, a high LUE of −0.113 was recorded, due to the highest outflow of inhabitants between 2000 and 2005, and for the period between 2010 and 2015, which in turn was accompanied by the highest growth of built-up area (Table 7 and Table 8). The most desirable LUE values are close to 0, indicating that soil consumption per capita is stable over the studied time period [99].
An interesting study was presented by Wang et al. [81] demonstrating the potential of satellite earth observation (EO) data to monitor the spatial distribution of SDG 11.3.1 across provinces in China for a 10-year observation period (1990–2000 and 2000–2010). The research identified cities experiencing growth in urban built-up areas and those with a declining proportion of the population range as well as those characterised by uncoordinated development, where urban expansion is not synchronised with population growth. These studies show that urban growth is often disproportionate to population growth also in developing countries. Also, in the study by Hegazy and Kaloop [22], GIS technology and remote sensing methodology provided important tools to detect land use changes and identify patterns of spatially expanding cities in Egypt, where urban sprawl has caused severe losses to agricultural land and water bodies due to the rapid rate of growth urban population. An interesting study was also carried out by Cai et al. [35], using Landsat satellite imagery and statistical data to calculate land use efficiency to test urban land use efficiency in Wukang from 1990 to 2015, with 5- and 10-year intervals. These studies show that urban land use becomes denser as the population grows, which will have a positive impact on the sustainability of urban development. The authors of this research highlighted that the results of that work can be helpful for the local government to balance urban land consumption and population growth. In contrast, Nicolau et al. [99] found that land expansion in Portugal proceeded much faster than population expansion in the past few decades (2007–2015).
The development of cities, whether on a global, regional, or local scale, is undoubtedly influenced by varying geographical conditions as well as demographic, social, or economic factors, etc. The influence of spatial planning is also significant, making some cities more successful in managing urban growth than others. Research by Fregolent and Tonin [100] suggests that due to the different planning policy regimes in Europe in terms of control and management of LULC, the impact of planning on urban growth remains unknown but may also be insufficient to address the driving forces in the context of urban sprawl. This is also supported by the study conducted by Angel et al. [26], which shows that despite the implementation of planning policy regimes to control urban sprawl, such as compact city policies and urban growth management initiatives, urban LULC change will continue to increase globally and the main reason for this is the increase in living standards which goes hand in hand with higher per capita land consumption.
Our research also shows that assuming the calculated average rate of growth of the built-up area at the level of 8.5% every five years, the projected size of the built-up area in Opole in 2025 will amount to approx. 3500 ha, and in 2030—approx. 3870 ha. New development is likely to occur on the outskirts of the city at the expense of agricultural land. This demonstrates the tendency of contemporary cities towards suburbanisation and the development of suburban zones. In contrast, new buildings will be located in the vicinity of existing ones, which is in line with the principles of sustainable development [30]. However, when it comes to the forecasted size of population in Opole, with the calculated average decrease of population about 2% every five years, in 2025 the population will amount to about 113,200 and in 2030, it is estimated at 107,300 people. However, in 2050 the population will fall to around 90,000. Similar phenomena of population decrease and depopulation of cities have already been observed throughout Poland, and earlier, they were also noticeable in Western Europe. Poland is currently working on a reform of its spatial planning system with the support from the European Fund for Recovery and Resilience—the EU’s response to new threats and challenges posed by the Covid-19 pandemic in many areas of life, also contributing to suburbanisation and urban depopulation. The methodology presented in this paper can be helpful to identify the risks associated with demographic suburbanisation.
The growth of urban land use is a global trend and a challenge for urban policy makers. While in some parts of the world rapid urban growth resulting from increasing population is a challenge, other parts of the world, have to face the prevailing phenomenon of urban shrinkage, characterised by population loss and ageing, declining population density, mass emigration, decline in industrial and other economic activities, etc. In contrast, in some parts of the world (cities in the United States, Germany, Central, and Eastern Europe), a parallel process of re-urbanisation, a new trend observed for many years, is emerging [101]. In order to adapt to different urbanisation scenarios that are happening, integrated urban policy approaches and sustainable urbanisation strategies are needed taking into account the spatial and temporal scale of change in the processes determining urban development and their monitoring.

4. Summary and Conclusions

This study highlights the demographic suburbanisation of Opole. LULC changes were analysed using publicly available Landsat and Sentinel satellite imagery from 2000, 2005, 2010, 2015 and 2020, as well as GIS technology. The time range of the study 2000–2020 seems long enough to observe sustainable spatial trends and patterns, unencumbered by randomness. Four LULC classes have been developed using supervised spectral classification of satellite images. Remote sensing data was integrated with demographic data using GIS technology to analyse the expansion of the city in relation to population over the past 20 years. The analysis of the obtained results leads to the most important conclusions:
  • The built-up area in Opole has increased by approx. 880 ha in the last 20 years. The percentage of built-up area in relation to the total area of the city increased from 15.4% in 2000 to 21.3% in 2020. Built-up areas increased their area in the city’s spatial structure, mainly at the expense of agricultural areas. The highest intensity of spatial development of the city occurred in 2010–2015, when the built-up area increased by over 300 ha.
  • Sentinel images have a higher spatial resolution. Therefore, additional other built-up landmarks, such as roads, traffic routes, and less dense buildings, were detected. Therefore, it can be concluded that publicly available Sentinel and Landsat satellite imagery can be used for LULC spatial analysis at the scale of large cities. Although Landsat images do not detect smaller objects so precisely, they successfully show the general trend and directions of changes in the LULC structure.
  • The dynamics of changes in the built-up area revealed that areas away from the city centre expand faster than those around it. The fastest rate of change of built-up area in the last 20 years took place in the zone 3–6 km from Opole city centre, where on average every five years an increase of built-up area by 11.70% was recorded due to the development of multi-family residential estates. A slightly lower growth rate, i.e., 10.43%, was observed in the zone above 6 km from the centre of Opole, where the zone is gradually losing its agricultural character and transforming into dense, mono-functional estates with single-family housing. The spatial and temporal pattern of urban sprawl was revealed by measuring the distance of new urban growth areas from the city centre.
  • The largest population increase over 20 years has been in district V, which is in the eastern part of the city. Alternatively, the highest population outflow and significant decrease of population density was recorded in district IV, which is one of the biggest housing districts in Opole. Taking into account the decreasing population between 2000 and 2020 and the decrease in population density in the districts located in the city centre and in the largest residential districts, it can be concluded that a significant part of the population has settled in the peripheral districts or suburban areas or has moved to another city.
  • The average growth rate of built-up area in each successive 5-year study period as compared to the previous one was 8.3%. The average rate of population decline in each successive analysed 5-year period was about 2%. Despite the progressing depopulation process in the analysed periods of time, an increase in built-up areas was recorded, which confirms the ongoing demographic suburbanisation process in Opole.
  • Ratio of Land Consumption Rate to Population Growth Rate (LCRPGR), which is a global measure of SDG 3.11.3, had a negative value in every analysed time period, indicating inefficient land use during the urbanisation process. Opole is a city with an uncoordinated development because the relationship between land use and population growth is not synchronised. Also, the negative values of Land Use Efficiency (LUE) obtained for particular research periods reflected the change rate of the built-up area per capita and revealed that the expansion of urban areas in Opole was accompanied by a decline in population.
  • There is a need for integrated approaches in urban policy and sustainable development strategies of Opole, taking into account the spatial and temporal scale of changes in processes determining the development of the city. In Opole, it is necessary to implement solutions preventing demographic suburbanisation as a result of progressing depopulation and uncontrolled development of built-up areas. For this purpose, monitoring and detailed analyses of LULC changes using GIS technology and publicly available and up-to-date remote sensing data in relation to population are necessary. Poland is currently working on a new spatial management reform, which is intended to respond to the problems of suburbanisation and spatial chaos faced by modern cities. Therefore, these phenomena have to be monitored on a larger scale in order to identify the areas being at risk the most and implement the programme measures.
  • The applied survey procedure is universal and can be used by local authorities and planners for any administrative units due to general availability of historical Landsat and Sentinel satellite images.

Author Contributions

Conceptualization, B.W. and A.S.; methodology, B.W.; software, B.W. and A.S.; validation, B.W. and J.S.; formal analysis, B.W.; investigation, B.W.; resources, B.W. and A.S.; data curation, B.W. and A.S.; writing—original draft preparation, B.W.; writing—review and editing, B.W. and J.S.; visualization, B.W. and A.S.; supervision, J.S.; project administration, B.W.; funding acquisition, J.S. All authors have read and agreed to the published version of the manuscript.

Funding

This research received no external funding.

Institutional Review Board Statement

Not applicable.

Informed Consent Statement

Not applicable.

Data Availability Statement

Publicly available datasets were analyzed in this study. This data can be found here: https://bdl.stat.gov.pl/BDL, http://www.gugik.gov.pl/pzgik, https://earthexplorer.usgs.gov, https://scihub.copernicus.eu (accessed on 10 March 2021). We wish to express our thank to the USGS Earth Explorer and ESA Copernicus Open Access Hub for providing remote sensing data and the authorities of Opole, Prószków, Komprachcice, Dobrzeń Wielki, Dąbrowa Municipalities for providing numers of inhabitants registered for permanent residence which were used in this study.

Acknowledgments

This work has been supported by Institute of Socio-Economic Geography and Spatial Management, University of Opole.

Conflicts of Interest

The authors declare no conflict of interest.

References

  1. Sapena, M.; Ruiz, L.A. Analysis of land use/land cover spatio-temporal metrics and population dynamics for urban growth characterization. Comput. Environ. Urban Syst. 2019, 73, 27–39. [Google Scholar] [CrossRef]
  2. Grimm, N.B.; Faeth, S.H.; Golubiewski, N.E.; Redman, C.L.; Wu, J.; Bai, X.; Briggs, J.M. Global Change and the Ecology of Cities. Science 2008, 319, 756–760. [Google Scholar] [CrossRef] [Green Version]
  3. Hahs, A.K.; McDonnell, M.J.; McCarthy, M.A.; Vesk, P.A.; Corlett, R.T.; Norton, B.A.; Clemants, S.E.; Duncan, R.P.; Thompson, K.; Schwartz, M.W.; et al. A global synthesis of plant extinction rates in urban areas. Ecol. Lett. 2009, 12, 1165–1173. [Google Scholar] [CrossRef]
  4. Ramachandra, T.V.; Aithal, B.H.; Sanna, D.D. Insights to urban dynamics through landscape spatial pattern analysis. Int. J. Appl. Earth Obs. Geoinf. 2012, 18, 329–343. [Google Scholar] [CrossRef]
  5. Yu, Y.; Tong, Y.; Tang, W.; Yuan, Y.; Chen, Y. Identifying Spatiotemporal Interactions between Urbanization and Eco-Environment in the Urban Agglomeration in the Middle Reaches of the Yangtze River, China. Sustainability 2018, 10, 290. [Google Scholar] [CrossRef] [Green Version]
  6. Kiełkowska, J.; Tokarczyk-Dorociak, K.; Kazak, J.; Szewrański, S.; van Hoof, J. Urban Adaptation to Climate Change Plans and Policies—The Conceptual Framework of a Methodological Approach. J. Ecol. Eng. 2018, 19, 50–62. [Google Scholar] [CrossRef] [Green Version]
  7. Arnfield, A.J. Two decades of urban climate research: A review of turbulence, exchanges of energy and water, and the urban heat island. Int. J. Climatol. 2003, 23, 1–26. [Google Scholar] [CrossRef]
  8. Hu, X.; Zhou, W.; Qian, Y.; Yu, W. Urban expansion and local land-cover change both significantly contribute to urban warming, but their relative importance changes over time. Landsc. Ecol. 2017, 32, 763–780. [Google Scholar] [CrossRef]
  9. Padmanaban, R.; Bhowmik, A.K.; Cabral, P. Satellite image fusion to detect changing surface permeability and emerging urban heat islands in a fast-growing city. PLoS ONE 2019, 14, e0208949. [Google Scholar] [CrossRef] [PubMed]
  10. Mitz, E.; Kremer, P.; Larondelle, N.; Stewart, J.D. Structure of Urban Landscape and Surface Temperature: A Case Study in Philadelphia, PA. Front. Environ. Sci. 2021, 9, 592716. [Google Scholar] [CrossRef]
  11. Zhang, J.; Zhang, L.Y.; Du, M.; Zhang, W.; Huang, X.; Zhang, Y.Q.; Yang, Y.Y.; Zhang, J.M.; Deng, S.H.; Shen, F.; et al. Identifying the major air pollutants base on factor and cluster analysis, a case study in 74 Chinese cities. Atmos. Environ. 2016, 144, 37–46. [Google Scholar] [CrossRef]
  12. Toure, S.I.; Stow, D.A.; Shih, H.-c.; Weeks, J.; Lopez-Carr, D. Land cover and land-use change analysis using multi-spatial resolution data and object-based image analysis. Remote Sens. Environ. 2018, 210, 259–268. [Google Scholar] [CrossRef]
  13. Weng, Y.C. Spatiotemporal changes of landscape pattern in response to urbanization. Landsc. Urban Plan. 2007, 81, 341–353. [Google Scholar] [CrossRef]
  14. Triantakonstantis, D.; Stathakis, D. Examining urban sprawl in Europe using spatial metrics. Geocarto Int. 2015, 30, 1092–1112. [Google Scholar] [CrossRef]
  15. Słodczyk, J. Formation of Urban Spaces around the World a History of Planning and Building of Cities; Opole University Publishing House: Opole, Poland, 2020. [Google Scholar]
  16. Larondelle, N.; Hamstead, Z.A.; Kremer, P.; Haase, D.; McPhearson, T. Applying a novel urban structure classification to compare the relationships of urban structure and surface temperature in Berlin and New York City. Appl. Geogr. 2014, 53, 427–437. [Google Scholar] [CrossRef]
  17. Mosammam, H.M.; Nia, J.T.; Khani, H.; Teymouri, A.; Kazemi, M. Monitoring land-use change and measuring urban sprawl based on its spatial forms the case of Qom city. Egypt J. Remote Sens. Space Sci. 2017, 20, 103–116. [Google Scholar] [CrossRef] [Green Version]
  18. Al Jarah, S.H.; Zhou, B.; Abdullah, R.J.; Lu, Y.; Yu, W. Urbanization and urban sprawl issues in city structure: A case of the Sulaymaniah Iraqi Kurdistan Region. Sustainability 2019, 11, 485. [Google Scholar] [CrossRef] [Green Version]
  19. Eurostat. Urban Europe Statistics on Cities, Towns and Suburbs; European Commission: Luxembourg, 2016. [Google Scholar] [CrossRef]
  20. United Nations, Department of Economic and Social Affairs, Population Division. World Urbanization Prospects: The 2018 Revision (ST/ESA/SER.A/420); United Nations: New York, NY, USA, 2019; Available online: https://population.un.org/wup/Publications/Files/WUP2018-Report.pdf (accessed on 20 March 2021).
  21. Melchiorri, M.; Florczyk, A.J.; Freire, S.; Schiavina, M.; Pesaresi, M.; Kemper, T. Unveiling 25 Years of Planetary Urbanization with Remote Sensing: Perspectives from the Global Human Settlement Layer. Remote Sens. 2018, 10, 768. [Google Scholar] [CrossRef] [Green Version]
  22. Hegazy, I.R.; Kaloop, M.R. Monitoring urban growth and land use change detection with GIS and remote sensing techniques in Daqahlia governorate Egypt. Int. J. Sustain. Built Environ. 2015, 4, 117–124. [Google Scholar] [CrossRef] [Green Version]
  23. European Environmental Agency (EEA). Urban Sprawl in Europe Joint EEA-FOEN Report; European Environmental Agency—Swiss Federal Office for the Environment: Ittigen, Switzerland, 2016; Available online: https://www.eea.europa.eu/publications/urban-sprawl-in-europe (accessed on 20 March 2021).
  24. Gerten, C.; Fina, S.; Rusche, K. The Sprawling Planet: Simplifying the Measurement of Global Urbanization Trends. Front. Environ. Sci. 2019, 7, 140. [Google Scholar] [CrossRef]
  25. Ghazaryan, G.; Rienow, A.; Oldenburg, C.; Thonfeld, F.; Trampnau, B.; Sticksel, S.; Jürgens, C. Monitoring of Urban Sprawl and Densification Processes in Western Germany in the Light of SDG Indicator 11.3.1 Based on an Automated Retrospective Classification Approach. Remote Sens. 2021, 13, 1694. [Google Scholar] [CrossRef]
  26. Angel, S.; Parent, J.; Civco, D.L.; Blei, A.; Potere, D. The dimensions of global urban expansion: Estimates and projections for all countries, 2000–2050. Progr. Plan. 2011, 75, 53–107. [Google Scholar] [CrossRef]
  27. Reckien, D.; Karecha, J. Sprawl in European Cities: The Comparative Background. In Urban Sprawl in Europe—Landscapes, Land-UseChange & Policy; Couch, C., Leontidou, L., Petschel-Held, G., Eds.; Blackwell Publishing (RICS Research): Oxford, UK, 2007; pp. 39–67. [Google Scholar] [CrossRef]
  28. Frenkel, A.; Ashkenazi, M. Measuring Urban Sprawl. How Can We Deal with it? Environ. Plan. B 2008, 35, 1–24. [Google Scholar] [CrossRef] [Green Version]
  29. Śleszyński, P. Społeczno-ekonomiczne skutki chaosu przestrzennego dla osadnictwa i struktury funkcjonalnej terenów. In Koszty Chaosu Przestrzennego; Kowalewski, A., Markowski, T., Śleszyński, P., Eds.; Studia KPZK PAN: Warszawa, Poland, 2018; Volume 182, pp. 29–80. Available online: https://www.czasopisma.pan.pl/dlibra/publication/123405/edition/107634/content (accessed on 21 March 2021).
  30. Gibas, P. (Ed.) Analiza Zmian i Prognoza Przyrostu Zabudowy Mieszkaniowej na Obszarze Polski do 2020 Roku; Bogucki Wydawnictwo Naukowe: Poznań, Poland, 2017. [Google Scholar]
  31. Kowalewski, A.; Markowski, T.; Śleszyński, P. (Eds.) Kryzys Polskiej Przestrzeni. Źródła, Skutki i Kierunki Działań Naprawczych; PAN KPZK: Warszawa, Poland, 2020; Available online: https://publikacje.pan.pl/dlibra/journal/133295/kryzys-polskiej-przestrzeni-zrodla-skutki-i-kierunki-dzialan-naprawczych-2020-kowalewski-adam-markowski-tadeusz-sleszynski-przemyslaw?language=pl (accessed on 21 March 2021).
  32. Śleszyński, P.; Kowalewski, A.; Markowski, T.; Legutko-Kobus, P.; Nowak, M. The Contemporary Economic Costs of Spatial Chaos: Evidence from Poland. Land 2020, 9, 214. [Google Scholar] [CrossRef]
  33. Ehrlich, D.; Kemper, T.; Pesaresi, M.; Corbane, C. Built-up area and population density: Two Essential Societal Variables to address climate hazard impact. Environ. Sci. Policy 2018, 90, 73–82. [Google Scholar] [CrossRef] [PubMed]
  34. Mudau, N.; Mwaniki, D.; Tsoeleng, L.; Mashalane, M.; Beguy, D.; Ndugwa, R. Assessment of SDG Indicator 11.3.1 and Urban Growth Trends of Major and Small Cities in South Africa. Sustainability 2020, 12, 7063. [Google Scholar] [CrossRef]
  35. Cai, G.; Zhang, J.; Du, M.; Li, C.; Peng, S. Identification of urban land use efficiency by indicator-SDG 11.3.1. PLoS ONE 2020, 15, e0244318. [Google Scholar] [CrossRef] [PubMed]
  36. Castanho, R.A.; Naranjo Gómez, J.M.; Kurowska-Pysz, J. Assessing Land Use Changes in Polish Territories: Patterns, Directions and Socioeconomic Impacts on Territorial Management. Sustainability 2019, 11, 1354. [Google Scholar] [CrossRef] [Green Version]
  37. El Mendili, L.; Puissant, A.; Chougrad, M.; Sebari, I. Towards a Multi-Temporal Deep Learning Approach for Mapping Urban Fabric Using Sentinel 2 Images. Remote Sens. 2020, 12, 423. [Google Scholar] [CrossRef] [Green Version]
  38. Gibas, P.; Majorek, A. Analysis of Land-Use Change between 2012–2018 in Europe in Terms of Sustainable Development. Land 2020, 9, 46. [Google Scholar] [CrossRef] [Green Version]
  39. Noszczyk, T. Land use change monitoring as a task of local government administration in Poland. J. Ecol. Eng. 2018, 19, 170–176. [Google Scholar] [CrossRef]
  40. Fenta, A.A.; Yasuda, H.; Haregeweyn, N.; Belay, A.S.; Hadush, Z.; Gebremedhin, M.A.; Mekonnen, G. The dynamics of urban expansion and land use/land cover changes using remote sensing and spatial metrics. Int. J. Remote Sens. 2017, 38, 4107–4129. [Google Scholar] [CrossRef]
  41. Anees, M.M.; Sajjad, S.; Joshi, P.K. Characterizing urban area dynamics in historic city of Kurukshetra, India, using remote sensing and spatial metric tools. Geocarto Int. 2018, 34, 1584–1607. [Google Scholar] [CrossRef]
  42. Kazak, J.K. The Use of a Decision Support System for Sustainable Urbanization and Thermal Comfort in Adaptation to Climate Change Actions—The Case of the Wrocław Larger Urban Zone (Poland). Sustainability 2018, 10, 1083. [Google Scholar] [CrossRef] [Green Version]
  43. Wulder, M.A.; Coops, N.C.; Roy, D.P.; White, J.C.; Hermosilla, T. Land cover 2.0. Int. J. Remote Sens. 2018, 39, 4254–4284. [Google Scholar] [CrossRef] [Green Version]
  44. Ioannou, K.; Myronidis, D. Automatic Detection of Photovoltaic Farms Using Satellite Imagery and Convolutional Neural Networks. Sustainability 2021, 13, 5323. [Google Scholar] [CrossRef]
  45. Sandu, A.; Groza, O. What pattern(s) for the urbal sprawl of the post-socialist Romanian cities? Inform. Geoinform. Remote Sens. 2017, 17, 867–874. [Google Scholar] [CrossRef] [Green Version]
  46. Olorunfemi, I.E.; Fasinmirin, J.T.; Olufayo, A.A.; Komolafe, A.A. GIS and remote sensing-based analysis of the impacts of land use/land cover change (LULCC) on the environmental sustainability of Ekiti State, southwestern Nigeria. Environ. Dev. Sustain. 2020, 22, 661–692. [Google Scholar] [CrossRef]
  47. Zhang, X.; Liu, L.Y.; Wu, C.S.; Chen, X.D.; Gao, Y.; Xie, S.; Zhang, B. Development of a global 30 m impervious surface map using multisource and multitemporal remote sensing datasets with the Google Earth Engine platform. Earth Syst. Sci. Data 2020, 12, 1625–1648. [Google Scholar] [CrossRef]
  48. Bielecka, E. GIS Spatial Analysis Modeling for Land Use Change. A Bibliometric Analysis of the Intellectual Base and Trends. Geosciences 2020, 10, 421. [Google Scholar] [CrossRef]
  49. Tahir, M.; Imam, E.; Hussain, T. Evaluation of land use/land cover changes in Mekelle City, Ethiopia using Remote Sensing and GIS. Comput. Ecol. Softw. 2013, 3, 9–16. [Google Scholar] [CrossRef]
  50. Erasu, D. Remote Sensing-Based Urban Land Use/Land Cover Change Detection and Monitoring. J. Remote Sens. GIS 2017, 6, 196. [Google Scholar] [CrossRef]
  51. An, Y.; Tsou, J.Y.; Wong, K.; Zhang, Y.; Liu, D.; Li, Y. Detecting Land Use Changes in a Rapidly Developing City during 1990–2017 Using Satellite Imagery: A Case Study in Hangzhou Urban Area, China. Sustainability 2018, 10, 3303. [Google Scholar] [CrossRef] [Green Version]
  52. Dhanaraj, K.; Angadi, D.P. Land use land cover mapping and monitoring urban growth using remote sensing and GIS techniques in Mangaluru, India. GeoJournal 2020. [Google Scholar] [CrossRef]
  53. Yang, L.; Jin, S.; Danielson, P.; Homer, C.; Gass, L.; Bender, S.M.; Case, A.; Costello, C.; Dewitz, J.; Fry, J.; et al. A new generation of the United States National Land Cover Database: Requirements, research priorities, design, and implementation strategies. ISPRS J. Photogramm. Remote Sens. 2018, 146, 108–123. [Google Scholar] [CrossRef]
  54. Bielecka, E.; Jenerowicz, A.; Pokonieczny, K.; Borkowska, S. Land Cover Changes and Flows in the Polish Baltic Coastal Zone: A Qualitative and Quantitative Approach. Remote Sens. 2020, 12, 2088. [Google Scholar] [CrossRef]
  55. Kukulska-Kozieł, A.; Szylar, M.; Cegielska, K.; Noszczyk, T.; Hernik, J.; Gawronski, K.; Dixon-Gough, R.; Jombach, S.; Valanszki, I.; Kovacs, K.F. Towards three decades of spatial development transformation in two contrasting post-Soviet cities-Krakow and Budapest. Land Use Policy 2019, 85, 328–339. [Google Scholar] [CrossRef]
  56. Tokarczyk-Dorociak, K.; Kazak, J.; Szewrański, S. The Impact of a Large City on Land Use in Suburban Area—The Case of Wrocław (Poland). J. Ecol. Eng. 2018, 19, 89–98. [Google Scholar] [CrossRef]
  57. Wiatkowska, B.; Słodczyk, J. Spatial Diversity of Environmental Governance in the Aspect of Sustainable Development of the Polish-Czech Border Area. In Development and Administration of Border Areas of the Czech Republic and Poland Support for Sustainable Development; Ardielli, E., Ed.; VŠB—Technical University of Ostrava: Ostrava, Czech Republic, 2018; pp. 292–301, WOS:000476581800037. [Google Scholar]
  58. Cieślak, I.; Biłozor, A.; Szuniewicz, K. The Use of the CORINE Land Cover (CLC) Database for Analyzing Urban Sprawl. Remote Sens. 2020, 12, 282. [Google Scholar] [CrossRef] [Green Version]
  59. Grigorescu, I.; Kucsicsa, G.; Popovici, E.A.; Mitrică, B.; Mocanu, B.; Dumitraşcu, I. Modelling land use/cover change to assess future urban sprawl in Romania. Geocarto Int. 2021, 36, 721–739. [Google Scholar] [CrossRef]
  60. Śleszyński, P.; Gibas, P.; Sudra, P. The Problem of Mismatch between the CORINE Land Cover Data Classification and the Development of Settlement in Poland. Remote Sens. 2020, 12, 2253. [Google Scholar] [CrossRef]
  61. Jia, K.; Wei, X.; Gu, X.; Yo, Y.; Xie, X.; Li, B. Land cover classification using Landsat 8 Operational Land Imager data in Beijing, China. Geocarto Int. 2014, 29, 941–951. [Google Scholar] [CrossRef]
  62. Lefebvre, A.; Sannier, C.; Corpetti, T. Monitoring Urban Areas with Sentinel-2A Data: Application to the Update of the Copernicus High Resolution Layer Imperviousness Degree. Remote Sens. 2016, 8, 606. [Google Scholar] [CrossRef] [Green Version]
  63. Kopecká, M.; Szatmári, D.; Rosina, K. Analysis of Urban Green Spaces Based on Sentinel-2A: Case Studies from Slovakia. Land 2017, 6, 25. [Google Scholar] [CrossRef] [Green Version]
  64. Sun, Z.; Xu, R.; Du, W.; Wang, L.; Lu, D. High-Resolution Urban Land Mapping in China from Sentinel 1A/2 Imagery Based on Google Earth Engine. Remote Sens. 2019, 11, 752. [Google Scholar] [CrossRef] [Green Version]
  65. UN-GGIM: Europe. The Territorial Dimension in SDG Indicators: Geospatial Data Analysis and Its Integration with Statistical Data; Instituto Nacional de Estatística: Lisbon, Portugal, 2019; Available online: https://un-ggim-europe.org/wp-content/uploads/2019/05/UN_GGIM_08_05_2019-The-territorial-dimension-in-SDG-indicators-Final.pdf (accessed on 22 March 2021).
  66. Vigneshwaran, S.; Kumar, S.V. Urban Land Cover Mapping and Change Detection Analysis Using High Resolution Sentinel-2A Data. Environ. Nat. Resour. J. 2019, 17, 22–32. [Google Scholar] [CrossRef] [Green Version]
  67. Statistics Poland Local Data Bank. Available online: https://bdl.stat.gov.pl/BDL (accessed on 10 March 2021).
  68. Public Information Bulletin of the Opole Municipality. Available online: https://www.bip.um.opole.pl (accessed on 10 March 2021).
  69. Boori, M.S.; Netzband, M.; Choudhary, K.; Choudhary, K.; Voženílek, V. Monitoring and modeling of urban sprawl through remote sensing and GIS in Kuala Lumpur, Malaysia. Ecol. Process. 2015, 4, 15. [Google Scholar] [CrossRef] [Green Version]
  70. Zha, Y.; Gao, J.; Ni, S. Use of normalized difference built-up index in automatically mapping urban areas from TM imagery. Int. J. Remote Sens. 2003, 24, 583–594. [Google Scholar] [CrossRef]
  71. Ghosh, D.K.; Mandal, A.C.H.; Majumder, R.; Patra, P.; Bhunia, G.S. Analysis for Mapping of Built-Up Area Using Remotely Sensed Indices-A case Study of Rajarhat Block in Barasat Sadar Sub-Division in West Bengal (India). J. Landsc. Ecol. 2018, 11, 67–76. [Google Scholar] [CrossRef] [Green Version]
  72. Patra, S.; Sahoo, S.; Mishra, P.; Mahapatra, S.C. Impacts of urbanization on land use /cover changes and its probable implications on local climate and groundwater level. J. Urban Manag. 2018, 7, 70–84. [Google Scholar] [CrossRef]
  73. Li, H.; Wang, C.; Zhong, C.; Su, A.; Xiong, C.; Wang, J.; Liu, J. Mapping Urban Bare Land Automatically from Landsat Imagery with a Simple Index. Remote Sens. 2017, 9, 249. [Google Scholar] [CrossRef] [Green Version]
  74. Koko, A.F.; Yue, W.; Abubakar, G.A.; Hamed, R.; Alabsi, A.A.N. Analyzing urban growth and land cover change scenario in Lagos, Nigeria using multi-temporal remote sensing data and GIS to mitigate flooding. Geomat. Nat. Hazards Risk 2020, 12, 631–652. [Google Scholar] [CrossRef]
  75. Shikary, C.; Rudra, S. Measuring Urban Land Use Change and Sprawl Using Geospatial Techniques: A Study on Purulia Municipality, West Bengal, India. J. Ind. Soc. Remote Sens. 2021, 49, 433–448. [Google Scholar] [CrossRef]
  76. Abdullah, A.Y.M.; Masrur, A.; Adnan, M.S.G.; Baky, M.A.A.; Hassan, Q.K.; Dewan, A. Spatio-Temporal Patterns of Land Use/Land Cover Change in the Heterogeneous Coastal Region of Bangladesh between 1990 and 2017. Remote Sens. 2019, 11, 790. [Google Scholar] [CrossRef] [Green Version]
  77. Borsa, M.; Zagajewski, B.; Kulawik, B. Teledetekcja w Planowaniu Przestrzennym; Ministerstwo Infrastruktury i Budownictwa: Warszawa, Poland, 2017. Available online: https://www.gov.pl/web/rozwoj-praca-technologia/teledetekcja-w-planowaniu-przestrzenny (accessed on 10 March 2021).
  78. Mawenda, J.; Watanabe, T.; Avtar, R. An Analysis of Urban Land Use/Land Cover Changes in Blantyre City, Southern Malawi (1994–2018). Sustainability 2020, 12, 2377. [Google Scholar] [CrossRef] [Green Version]
  79. Güneralp, B.; Reba, M.; Hales, B.U.; Wentz, E.A.; Seto, K.C. Trends in urban land expansion, density, and land transitions from 1970 to 2010: A global synthesis. Environ. Res. Lett. 2020, 15, 044015. [Google Scholar] [CrossRef]
  80. UN-Habitat. United Nations Human Settlements Program. Module 3: Land Consumption Rate. 2018. Available online: https://www.unescwa.org/sites/www.unescwa.org/files/u593/module_3_land_consumption_edited_23-03-2018.pdf (accessed on 20 March 2021).
  81. Wang, Y.; Huang, C.; Feng, Y.; Zhao, M.; Gu, J. Using Earth Observation for Monitoring SDG 11.3.1-Ratio of Land Consumption Rate to Population Growth Rate in Mainland China. Remote Sens. 2020, 12, 357. [Google Scholar] [CrossRef] [Green Version]
  82. Corbane, C.; Politis, P.; Siragusa, A.; Kemper, T.; Pesaresi, M. LUE User Guide: A Tool to Calculate the Land Use Efficiency and the SDG 11.3 Indicator with the Global Human Settlement Layer; Publications Office of the European Union: Luxembourg, 2017. [Google Scholar] [CrossRef]
  83. Corbane, C.; Pesaresi, M.; Kemper, T.; Freire, S. Assessment of Land Use Efficiency using GHSL derived indicators. In Atlas of the Human Planet 2016. Mapping Human Presence on Earth with the Global Human Settlement Layer; Pesaresi, M., Melchiorri, M., Siragusa, A., Kemper, T., Eds.; Publications Office of the European Union: Luxembourg, 2016; pp. 77–78. [Google Scholar] [CrossRef]
  84. Stokowska, A. Detection of Changes in the Urban Areas in Opole between 2000 and 2020 Using Satellite Images and GIS. Bachelor’s Thesis, University of Opole, Opole, Poland, 2021. (In Polish). [Google Scholar]
  85. Pieńkowski, P.; Podlasiński, M.; Dusza–Zwolińska, E. Evaluation of the location of cities in terms of land cover on the example of Poland. Urban Ecosyst. 2019, 22, 619–630. [Google Scholar] [CrossRef] [Green Version]
  86. Huang, J.; Lu, X.X.; Sellers, J.M. A global comparative analysis of urban form: Applying spatial metrics and remote sensing. Landsc. Urban Plan. 2007, 82, 184–197. [Google Scholar] [CrossRef]
  87. Artmann, M.; Kohler, M.; Meinel, G.; Gan, J.; Ioja, I.C. How smart growth and green infrastructure can mutually support each other—A conceptual framework for compact and green cities. Ecol. Indic. 2017, 96, 10–22. [Google Scholar] [CrossRef]
  88. Maktav, D.; Erbek, F.S.; Jürgens, C. Remote sensing of urban areas. Int. J. Remote Sens. 2005, 26, 655–659. [Google Scholar] [CrossRef]
  89. Liu, C.; Zhang, Q.; Luo, H.; Qi, S.; Tao, S.; Xu, H.; Yao, Y. An efficient approach to capture continuous impervious surface dynamics using spatial-temporal rules and dense Landsat time series stacks. Remote Sens. Environ. 2019, 229, 114–132. [Google Scholar] [CrossRef]
  90. Deng, C.; Zhu, Z. Continuous subpixel monitoring of urban impervious surface using Landsat time series. Remote Sens. Environ. 2020, 238, 110929. [Google Scholar] [CrossRef]
  91. Przeciwdziałanie Depopulacji Opolszczyzny, Raport; NIK: Warszawa, Poland, 2020. Available online: https://www.nik.gov.pl/plik/id,22773,vp,25472.pdf (accessed on 30 January 2021).
  92. Heffner, K.; Klemens, B.; Solga, B. Challenges of Regional Development in the Context of Population Ageing. Analysis Based on the Example of Opolskie Voivodeship. Sustainability 2019, 11, 5207. [Google Scholar] [CrossRef] [Green Version]
  93. Uchwała nr LXVI/1248/18 Rady Miasta Opola z dnia 5 lipca 2018 r. w sprawie uchwalenia Studium Uwarunkowań i Kierunków Zagospodarowania Przestrzennego Opola, Załącznik 1. Available online: https://www.bip.um.opole.pl/download/file/bu/suikzp/Uchwala.pdf (accessed on 30 January 2021).
  94. Heffner, K. Uwarunkowania Funkcjonalno-Przestrzenne Rozwoju Miasta Opola, Ekspertyza. Opole, Poland, 2015. Available online: https://www.bip.um.opole.pl/zalaczniki/40978/zalacznik_nr_9_digi_27-04-2016_11-59-03.pdf (accessed on 30 January 2021).
  95. Strategia Rozwoju Miasta Opola—Stolicy Polskiej Piosenki na lata 2004–2015; Rada Miasta Opola: Opole, Poland, 2007. Available online: https://www.po.edu.pl/media/funduszeue/2012/strategia_rozwoju_miasta_opola.pdf (accessed on 30 April 2021).
  96. Zrównoważony Rozwój Miast w Polsce: Krajowa Polityka Miejska w Kontekście Celu 11 Agendy 2030 i Nowej Agendy Miejskiej, Raport; Ministerstwo Inwestycji i Rozwoju: Warszawa, Poland, 2019. Available online: https://www.funduszeeuropejskie.gov.pl/media/72565/raport_pl_final.pdf (accessed on 30 April 2021).
  97. Strategii Rozwoju Aglomeracji Opolskiej na lata 2014–2020; Stowarzyszenie Aglomeracja Opolska: Opole, Poland, 2014. Available online: https://www.aglomeracja-opolska.pl/sites/default/files/page/attachments/strategia_rozwoju_aglomeracji_opolskiej_na_lata_2014-2020.pdf (accessed on 30 May 2021).
  98. Strategia Rozwoju Opola do 2030 r. Załącznik do uchwały nr XV/282/19 Rady Miasta Opola z dnia 29 sierpnia 2019 r; Urząd Miasta Opola: Opole, Poland, 2019; Available online: https://www.opole.pl/sites/default/files/field_attachment/2020-02/Strategia%20Rozwoju.pdf (accessed on 30 May 2021).
  99. Nicolau, R.; David, J.; Caetano, M.; Pereira, J.M.C. Ratio of Land Consumption Rate to Population Growth Rate—Analysis of Different Formulations Applied to Mainland Portugal. ISPRS Int. J. Geo-Inf. 2019, 8, 10. [Google Scholar] [CrossRef] [Green Version]
  100. Fregolent, L.; Tonin, S. (Eds.) Growing Compact; FrancoAngeli: Milano, Italy, 2015; Available online: https://www.francoangeli.it/Area_PDFDemo/1862.193_demo.pdf (accessed on 30 April 2021).
  101. Haase, D.; Güneralp, B.; Dahiya, B.; Bai, X.; Elmqvist, T. Global urbanization. In Urban Planet: Knowledge towards Sustainable Cities; Elmqvist, T., Bai, X., Frantzeskaki, N., Griffith, C., Maddox, D., McPhearson, T., Parnell, S., Romero-Lankao, P., Simon, D., Watkins, M., Eds.; Cambridge University Press: Cambridge, UK, 2018; pp. 19–44. [Google Scholar] [CrossRef]
Figure 1. Location of the study area, Poland, Central Europe: (a) map of Poland with study area (b) city of Opole.
Geosciences 11 00312 g001
Figure 2. Classified land cover maps of Opole produced from the supervised classification of Landsat (2000, 2005, 2010, 2015, 2020) and Sentinel (2015, 2020).
Geosciences 11 00312 g002
Figure 3. The growth and expansion of built-up areas from the city centre to the periphery of Opole from 2000–2020.
Geosciences 11 00312 g003
Figure 4. Changes in population density in Opole’s districts: (a) in 2000, (b) in 2020.
Geosciences 11 00312 g004
Table 1. Datasets used in the analysis, their sources and characteristics.
DatasetsDataSourceResolution
Satellite images Landsat 5,
sensor: Thematic Mapper (TM)
June 2000
May 2005
July 2010
U.S. Geological Survey (USGS)Raster
30 m
Satellite image Landsat 8,
sensor: Operational Land Imager (OLI)
July 2015
July 2020
U.S. Geological Survey (USGS)Raster
30 m
Satellite image Sentinel 2A,
sensor: Multi Spectral Imager (MSI)
July 2015
August 2020
Copernicus Open Access HubRaster
10 m
Orthophotomap
Multi-temporal aerial photography
2000–2020Polish Head Office of Geodesy and Cartography (GUGiK), Google EarthRaster
0.25–0.5 m
Database of the state border register and areas of territorial divisions of the country2020Polish Head Office of Geodesy and Cartography (GUGiK)Vector
Local Area Development Plans2020Public Information Bulletin of the Opole MunicipalityWMS
district
Civil registry2000, 2005, 2010, 2015, 2020Opole, Prószków, Komprachcice, Dobrzeń Wielki, Dąbrowa MunicipalitiesText
district
Descriptive data and metadata
on demographic situation
2000–2020Statistics Poland (GUS)Text
district
Table 2. Land use and land cover (LULC) in Opole obtained on the basis of processing of satellite imagery: Landsat (2000, 2005, 2010, 2015, 2020) and Sentinel (2015, 2020), source: [84].
LULC Landsat 5 (TM), Landsat 8 (OLI)Sentinel 2 (MSI)
Units2000200520102015202020152020
Built-up areaha2291.052472.292652.482964.253172.523304.883528.97
%15.416.617.819.921.322.223.7
Agricultural
area
ha10,461.6910,283.410,117.19829.69617.39396.39218.3
%70.369.1686664.663.162.0
Forests and semi-natural areaha1879.191863.61846.31824.41818.81884.61856.6
%12.6112.512.412.312.212.712.4
Water areaha256.1268.7272.1269.7279.2296.9284.4
%1.711.81.831.811.92.01.9
Total area
of Opole
ha14,888 ha
%100%
Table 3. Changes LULC in Opole obtained on the basis of processing of satellite imagery: Landsat (2000, 2005, 2010, 2015, 2020) and Sentinel (2015, 2020) (difference in area and percentage points).
LULC Landsat 5 (TM), Landsat 8 (OLI)Sentinel 2 (MSI)
Units2000–20052005–20102010–20152015–20202000–20202015–2020
Built-up areaha+181.2+180.2+311.8+208.2+881.4+219.1
pp+1.2+1.2+2.1+1.4+5.9+1.5
Agricultural
area
ha−179.0−166.0−287.4−212.3−844.7−178.0
pp−1.2−1.1−2.0−1.4−5.7−1.1
Forests and semi-natural areaha−15.6−17.3−21.9−5.7−60.4−28
pp−0.1−0.1−0.1−0.1−0.4−0.3
Water areaha+12.6+3.4−2.4+9.5+23.1−12.5
pp+0.10−0.020.1+0.2−0.1
Table 4. Built-up areas in particular buffer zones from the centre of Opole obtained from processing of Landsat (2000, 2005, 2010, 2015, and 2020) and Sentinel (2015, 2020) satellite images, source: [84].
Equidistant UnitsLandsat 5 (TM), Landsat 8 (OLI)Sentinel 2 (MSI)
2000200520102015202020152020
0–3 kmha1106.261187.571212.131289.171364.311373.541431.38
%48.2948.0445.7043.4943.0041.5640.56
3–6 kmha779.20842.33956.651111.081206.551244.231351.52
%34.0134.0736.0737.4838.0337.6538.30
over 6 kmha405.59442.39483.70564.00601.66687.11746.07
%17.7017.8918.2419.0318.9620.7921.14
Total
built-up areas
ha2291.052472.292652.482964.253172.523304.883528.97
%100.00100.00100.00100.00100.00100.00100.00
Table 5. Changes in built-up areas according to buffer zones from the centre of Opole obtained from processing of Landsat satellite images (2000, 2005, 2010, 2015, and 2020) and Sentinel (2015, 2020).
Equidistant UnitsLandsat 5 (TM), Landsat 8 (OLI) Sentinel 2
2000–20052005–20102010–20152015–20202000–20202015–2020
0–3 kmha+81.31+24.56+77.04+75.14+258.05+57.84
3–6 kmha+63.13+114.32+154.43+95.47+427.35+107.29
over 6 kmha+36.80+41.34+80.30+37.66+196.07+58.96
Total
built-up area
ha+181.24+180.19+311.77+208.27+881.47+224.09
Table 6. Rate of change in built-up areas in particular buffer zones from the centre of Opole obtained from processing of Landsat satellite images (2000, 2005, 2010, 2015, and 2020).
YearEquidistant 0–3 kmEquidistant 3–6 kmEquidistant over 6 km
Built-Up Area [ha]Rate of Change in Built-Up Area [%]Built-Up Area [ha]Rate of Change in Built-Up Area [%]Built-Up Area [ha]Rate of Change in Built-Up Area [%]
20001106.260.00779.200.00405.590.00
20051187.577.35842.338.10442.399.07
20101212.132.07956.6513.57483.709.34
20151289.176.361111.0816.14564.0016.60
20201364.315.831206.558.59601.666.68
Average rate
of changes
5.23%-11.70%-10.43%
Table 7. The rate of change in the growth of built-up areas in relation to the population in Opole between 2000–2020.
YearBuilt-Up Area [ha]Rate of Change in Built-Up Area [%]PopulationRate of Change in Population [%]Built-Up Areas per
Capita [m2/Person]
20002291.11.00129,2691.00177.24
20052472.37.91125,306−3.07197.30
20102652.57.29123,788−1.21214.28
20152964.311.75121,430−1.91244.12
20203172.57.02119,190−1.85266.17
Average rate of change-+8.30%-−1.91%-
Table 8. Ratio of Land Consumption Rate to Population Growth Rate (LCRPGR) and Land Use Efficiency (LUE) in Opole between 2000–2020.
Landsat 5 (TM), Landsat 8 (OLI)
Indicators2000–20052005–20102010–20152015–20202000–2020
Land Consumption Rate (LCR)0.01520.01410.02220.01360.0163
Population Growth Rate (PGR)−0.0062−0.0024−0.0038−0.0037−0.0041
Ratio of Land Consumption Rate to Population Growth Rate (LCRPGR)−2.45−5.88−5.84−4.00−3.98
Land Use Efficiency (LUE)−0.1132−0.0860−0.1393−0.0903−0.5018
Publisher’s Note: MDPI stays neutral with regard to jurisdictional claims in published maps and institutional affiliations.

