Article

Recent Shoreline Changes Due to High-Angle Wave Instability along the East Coast of Lingayen Gulf in the Philippines

1
Public Works Research Center, Taito, Tokyo 110-0016, Japan
2
Department of Oceanic Architecture and Engineering, College of Science and Technology, Nihon University, Funabashi, Chiba 274-8501, Japan
*
Author to whom correspondence should be addressed.
Geosciences 2021, 11(3), 144; https://doi.org/10.3390/geosciences11030144
Submission received: 14 December 2020 / Revised: 8 March 2021 / Accepted: 9 March 2021 / Published: 22 March 2021
(This article belongs to the Special Issue Shoreline Dynamics and Beach Erosion)

Abstract

:
A small perturbation on the shoreline may develop under high-angle wave conditions, resulting in the formation of sand spits along the shoreline. Serizawa et al. explained the development of sand spits caused by the instability mechanism using the BG model (a model for predicting 3-D beach changes based on Bagnold’s concept). However, examples of the development of sand spits caused by this mechanism in the field are limited in number. Lingayen Gulf in the Philippines has a large aspect ratio, so shoreline instability occurs along the coastline, significantly affecting the shore protection along the coast. In this study, the shoreline instability along the river delta coasts around the Balili and Aringay Rivers flowing into Lingayen Gulf and a sand spit were investigated using satellite images together with field observation. The shoreline changes observed south of the Aringay River mouth were compared with those observed in a previous study on the development of a sand spit by San-nami et al. The rate of longshore sand transport to form a sand spit at Santo Tomas in Lingayen Gulf was estimated to be approximately 1.3 × 10⁵ m3/yr, which is in good agreement with the value measured on the Shimizu coast in Suruga Bay, with a comparable aspect ratio of 1.2 relative to 1.3 in Lingayen Gulf. It was concluded that shoreline undulations have evolved downcoast of two river deltas owing to high-angle wave instability along the east coast of Lingayen Gulf and the formation of a sand spit has occurred. A soft measure, such as sand bypassing, would be better to be adopted along the coasts in Lingayen Gulf instead of hard measures against erosion, to prevent rapid expansion of an artificial, protected coastline.

1. Introduction

When waves are obliquely incident to a slender water body at a large angle relative to the direction normal to the shoreline, shoreline undulation may develop owing to high-angle wave instability [1], resulting in the formation of sand spits. Serizawa et al. [2] predicted beach changes under the condition that waves were obliquely incident to the direction normal to the shoreline at an angle over 45° using the BG model (a model for predicting 3-D beach changes based on Bagnold’s concept) and showed that sand spits can develop by this instability mechanism. Although real examples of shoreline instability are limited in number because the wave incidence angle is ±20° at most on ordinary coasts, examples can be found in a slender water body. Since Lingayen Gulf in the Philippines is a slender bay, shoreline undulations caused by this instability mechanism occur downcoast of the river deltas, significantly affecting shore protection on the coast. Anthony et al. [3] described the formation of the sand spits associated with the Volta and Senegal River deltas, which show complex patterns of morphodynamic development while also strongly reflecting the recent impacts of human activities, such as the marked reduction in sand supply on the eastern coast of Ghana. In this study, the formation of the shoreline undulations downcoast of the river deltas of the Balili and Aringay Rivers was studied in the same manner using satellite images together with a field observation on 23 February 2018. The evolution of the shoreline undulation downcoast of the Aringay River delta was compared with the results of the numerical simulation using the BG model [4] on the formation of a sand spit at the point where an abrupt change of the shoreline configuration takes place. Furthermore, a sand spit at Santo Tomas located near the bottom of Lingayen Gulf was selected as another study site (Figure 1).
Similarly to the studies on the sand spits of the Rhône River delta by Sabatier and Anthony [5], the formation of the sand spits in relation with the evolution and morphology of the Danube mouths and deltaic lobes in the Black Sea basin [6], and the comparison of evolution and dynamics of selected representative deltaic spits [7], the evolution of the shoreline undulations was investigated using satellite images in this study. Furthermore, to predict shoreline changes of a sand spit and consider the measures against beach erosion on a coast around a sand spit, quantitative estimation of the rate of longshore sand transport is important, so the rate of longshore sand transport around this sand spit was estimated from the temporal change in the foreshore area of the sand spit. As mentioned by [5], understanding the functional aspects of spit formation and growth is important for the management of the delta shoreline and its sediment budget by public authorities. In this study, it is pointed out that useful information regarding shore protection of the coasts in Lingayen Gulf can be obtained by the analysis of topographic changes under high-angle wave conditions, given morphological characteristics of the bay shape and arrangement of rivers.

2. Method of Study

First, the morphological characteristics of Lingayen Gulf were briefly described using a satellite image and bathymetric survey data as well as the investigation of wave characteristics using the Global Wave Statistics [8]. Because of the shape of Lingayen Gulf with a large aspect ratio, oblique wave incidence with a large angle to the direction normal to the shoreline prevails in this gulf. Taking these characteristics into account, satellite images of Lingayen Gulf were collected and the shoreline changes along the east coast were determined, selecting the deltas of two rivers (Balili and Aringay Rivers) and a sand spit at Santo Tomas with a supplementary field observation on 23 February 2018. Then, the wave field in Lingayen Gulf was calculated to explain the mechanism of occurrence of shoreline undulations along the east coast of the gulf due to high-angle wave instability [1] using the energy balance equation [9], based on the seabed contours of the gulf. Along the east coast of this bay, waves are obliquely incident to the direction normal to the shoreline over 45°, causing the shoreline instability. In an area south of the Balili River delta, a sand spit has formed at a location where the shoreline configuration abruptly changes due to high-angle wave instability. Therefore, the results of the numerical simulation regarding the formation of a sand spit on a coast with a sudden change in shoreline configuration were shown and the comparison of the results with the measured data was made. Furthermore, the rate of longshore sand transport along the sand spit at Santo Tomas was estimated from the temporal change in sand volume by integrating the foreshore area of the beach. Finally, the morphological similarity of Lingayen Gulf to that of Suruga Bay in Japan, and the rate of longshore sand transport in both bays were compared to consider the future measures against beach erosion along the coasts in these bays.

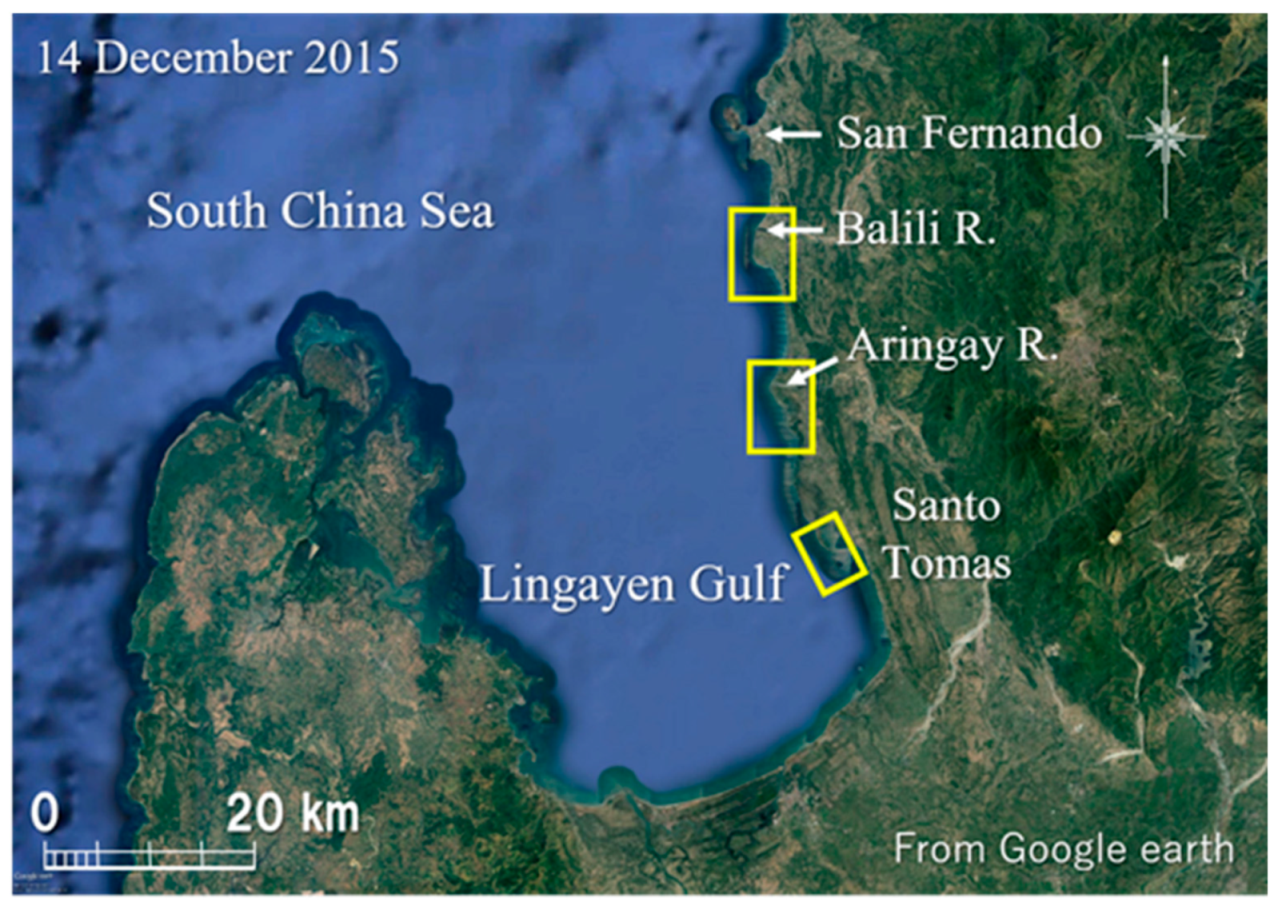
3. Morphological Characteristics of Lingayen Gulf

Lingayen Gulf, with a width of 44 km and a length of 58 km, has an aspect ratio of 1.3 and opens to the South China Sea in the direction of N20°W, as shown in Figure 1. This gulf has a semicircular embayment located on the northwestern coast of Luzon [10]. This area has two seasons—the wet season, from April to October, and the dry season, from November to March. Annual average rainfall in this area is 2500 mm with an average peak of 800 mm in August and a low of 1 mm in January. The mountains protect the province from the northeast monsoon and the trade winds but do not spare it from floods during the wet season. The west coast of this gulf has a complicated shoreline with many islands and headlands, whereas alluvial fans have developed along the east coast (Figure 1). A headland protrudes at San Fernando at the north end of the gulf, and the Balili River with a catchment area of 518 km2 flows into the gulf 9.6 km south of San Fernando. Furthermore, the Aringay River with a catchment area of 405 km2 flows into the gulf south of the Balili River, forming a delta. In addition, an elongated sand spit forms at Santo Tomas 18 km southeast of the Aringay River. In this gulf, incident waves have a strong directionality; waves are obliquely incident at a large angle relative to the direction normal to the shoreline because of the slender shape, so shoreline undulations due to high-angle wave instability [1] may have occurred.
The wave characteristics of this area can be estimated by the Global Wave Statistics [8]. In this report, the wave statistics in each area, separated into 104 subregions of all the world’s oceans, are shown based on the wave observation data and the hindcast of ocean waves. The area offshore of Lingayen Gulf belongs to subregion No. 40, and the results are summarized in Table 1; wave height with a probability of occurrence less than 5% ranges between 4.26 and 5.71 m with the maximum of 5.71 m in the direction of N. This result corresponds to the wave climate in South China Sea offshore of Lingayen Gulf, so the wave height in Lingayen Gulf is reduced, subject to the wave-sheltering effect.
Figure 2 shows the seabed topography of Lingayen Gulf with an average depth of 46 m and a maximum charted depth of about 100 m along its northern boundary [10]. Although a 20 m depth contour runs smoothly along the east coast, the contours shallower than 10 m in depth protrude around the Aringay River mouth and offshore of a sand spit at Santo Tomas. The formation of a sand spit on the bottom of the gulf clearly indicates the predominance of southward longshore sand transport under the oblique wave incidence from the north. On this coast with these characteristics, severe beach erosion occurs along the east coast because of the spatial imbalance in southward longshore sand transport.

4. Formation of Shoreline Undulations Due to High-Angle Wave Instability

4.1. Balili River Delta

Figure 3 shows a satellite image of a rectangular area around the Balili River mouth, as shown in Figure 1, taken on 15 April 2006. In the lower Balili River, a minor distributary (R2) is separated from the main distributary (R1). In Figure 3, the Aringay River mouth was often closed by the elongation of a sandbar from the right bank, which was induced by the deposition of southward longshore sand transport. The shoreline extends straight southward in a 1.9 km stretch between the mouth of the distributary R2 and point A south of the mouth, and then the shoreline bends around point A at a right angle. The tip of the curved shoreline connects to point B at the jetty of the oil refinery factory with a wide lagoon landward of the barrier island. Thus, a slender wetland separated by a barrier island extended in the west–east direction south of the distributary R2.
Similarly, Figure 4 shows a satellite image, taken on 14 February 2014, of the same area. Points A, B, P, and Q are indicated in Figure 4 to explain, but in what follows, “point” is omitted for simplicity, and the shoreline configuration measured on 15 April 2006 is shown in each figure. In this case, the shoreline position was directly determined from the satellite images while leaving an occurrence of some error in determining the shoreline position because of the lack of field data, i.e., the tide level and beach slope.
When referring to the tide level measured from January to December 2019 at San Fernando located at the entrance of Lingayen Gulf, the average of the monthly lowest and highest tide levels were −0.09 and +0.90 m, respectively, with a tidal range of 0.99 m. Detailed bathymetric surveys have not been carried out along the coast in Lingayen Gulf, but the berm height and foreshore slope were measured on a beach upcoast of a groin at Agoo, La Union near Narvacan on 23 February 2018, using two measuring staffs. The berm height and the foreshore slope were 2.0 m above mean sea level (MSL) and 1/7.7, respectively [11]. Given the tidal range of 0.99 m and the foreshore slope of 1/7.7, the maximum variance of the shoreline position becomes 7.7 m. This shoreline variance, however, is much smaller than the measured shoreline advance or the shoreline recession.
By 14 February 2014, a river delta had developed owing to the sediment discharge provided by the main channel of R1. Until this year, no shoreline changes were observed between P and A, although sediment supplied from the Balili River was deposited up to P. In contrast, a semicircular sandbar was newly formed with a shoreline protruding south of A. The formation of the sandbar clearly indicates that sediment supplied from the Balili River was transported southward and deposited as it turned around A. Until this time, the width of the sand spit increased because of the successive sand deposition along the shoreline of the sand spit, and in contrast, the lagoon width behind the sand spit decreased because of the deposition of sand from the distributary R2, as shown in Figure 4.
In Figure 5 showing an image taken on 11 June 2015, the river delta, which markedly protruded around the mouth, changed its form to a flat shape owing to erosion, and the curved sandbar south of A moved eastward as a whole.
This sandbar further approached B until 20 February 2016 (Figure 6).
A similar change continued until 1 December 2016, leaving an opening of the lagoon at the east end of the sandbar (Figure 7). In this year, a river delta was formed again around the mouth of R1 owing to sediment discharge from the river, indicating the occurrence of the intermittent sand supply from the Balili River.
The village of Bauang, La Union south of B, indicated by a rectangular area in Figure 7, is shown in Figure 8.
The center of the village is located 200 m north of the end of the coastal road. A concrete building destroyed by erosion remained in its vicinity, and five groins made of stones were constructed south of this building to maintain the shoreline. Figure 9 shows the coastal condition at Site 1 on the north side of the destroyed building.
A wide sandy beach was formed upcoast of the groins because of the blockage of southward longshore sand transport by the groins. Similarly, Figure 10 was taken at Site 2 on top of groin No. 4, facing south. In this area, a wide sandy beach was formed in front of the village, indicating the effect of the groins that locally blocked longshore sand transport.
In Figure 7, it should be noted that waves were obliquely propagating relative to the direction of the mean coastline in the offshore sea south of the Balili River, so the wave direction can be determined as the direction normal to the wave crestline. When setting the offshore point S at a location 3.2 km southeast of B, the wave direction at S was determined to be N37°W. Since the direction normal to the straight shoreline between the mouth of R2 and A is N84°W, waves were obliquely incident to the direction normal to the shoreline in a clockwise manner at an angle of 47°. In Lingayen Gulf, waves of high directionality are incident from the north because of the shape of the gulf, and the wave direction determined from Figure 7 is in accordance with this general condition of wave direction. Since waves are obliquely incident at an angle over 45° to the direction normal to the shoreline, the shoreline undulation due to high-angle wave instability may develop, resulting in the development of a markedly protruded shoreline south of the Balili River.
When setting Q at a location where the shoreline most protruded in the south between A and B in Figure 7, the eastward distances of Q with reference to the location on 14 February 2014 were 910 m (June 2015), 970 m (February 2016), and 1020 m (December 2016). It was found that Q gradually approached the location by December 2016 as its movement velocity decreased. When the shoreline markedly protruded near A, as shown in Figure 7, the area near B was protected by a significant wave-sheltering effect of the sandbar itself against waves incident from the direction of N37°W, and wave height decreases, resulting in the decrease in the movement velocity of the sandbar. Furthermore, when a sand body moves with the formation of a sand spit, the sand supply downcoast is suspended until the sand body reached downcoast, resulting in beach erosion. Because beach erosion has occurred in this manner in Bauang, La Union, it is considered that the groins have been constructed to protect the village against beach erosion.

4.2. Aringay River Delta

Figure 11 shows a satellite image of the rectangular area enclosing the Aringay River delta, taken on 15 April 2006. Here, a slender sandbar extended southward from the north riverbank, closing the river mouth. A sandy beach continuously extended southward while enclosing a lagoon behind it. Furthermore, a slender sand spit of 308 m length elongated southward from the south end of the river mouth sandbar. The elongation direction of the sand spit was at a large angle of 43° relative to the direction normal to the coastline immediately south of the river mouth. In the following figures, the shoreline configuration measured on 15 April 2006, as shown in Figure 11, is drawn for comparison.
By 28 October 2009, a slender sand spit elongated to a length of 770 m, while rotating counterclockwise and enclosing a lagoon behind the sand spit, although the shoreline north of the river mouth was stable (Figure 12).
This southward elongation of a sand spit implies that the entire volume of sand supplied from the Aringay River was transported southward. Because longshore sand has not been supplied to A located on the opposing shore downcoast of the tip of the sand spit during the elongation period of the sand spit, the shoreline of 1.5 km in length between A and B was eroded with a maximum shoreline recession of 115 m at a location 600 m south of A. For comparison, A and B of Figure 12 are shown in the following Figure 13, Figure 14, Figure 15, Figure 16 and Figure 17.
By 11 January 2011, sand was deposited near A located south of the sand spit (Figure 13). On the other hand, shoreline recession started at B located at the south end of the erosion area, and the erosion zone expanded until B’ 135 m south of it forming an erosion wave. The maximum shoreline recession reached 154 m at a location 580 m south of A. Thus, the shoreline recession increased on the south side of the sand spit with the elongation of the sand spit. In addition, another sand spit with approximately the same size as that in 15 April 2006 started to extend from the left bank of the river.
By 14 February 2014, a barrier island was formed by the extension of a sand spit offshore of A, forming an enclosed lagoon inside (Figure 14). In this period, the tip of the sand spit elongated 730 m south of A, as well as the elongation of another sand spit from the river mouth. With erosion, the eroded area expanded southward, and the south end of the erosion area moved by 670 m south of B. The maximum shoreline recession was 230 m at a location 750 m south of A.
By 11 June 2015, A located at the north end of the erosion zone in 2009 was enclosed by a slender barrier island with the elongation of a sand spit (Figure 15). Simultaneously, the erosion area expanded up to B’ located 1030 m south of B until this year. Even though the erosion expanded over time, the shoreline recession was relatively small near B because of the construction of five stone groins of 80 m in length in its vicinity. These groins prevented the shoreline from receding locally but caused downcoast erosion.
By 11 April 2016, the shoreline changed similarly to that shown in Figure 15, and another sand spit started to extend offshore of the barrier island formed by the extension of a sand spit near A (Figure 16).
Furthermore, the erosion zone extended up to B’ 1180 m south of B, and the shoreline recession downcoast of B reached 256 m. Finally, by 15 April 2017, A was enclosed by double barrier islands, and the distance between A and the shoreline increased until 280 m (Figure 17). Although the south end of the erosion zone is located at the same point of B’ 1180 m south of B, the shoreline recession downcoast of B reached 308 m.
In the vicinity of point B south of the Aringay River, the shoreline upcoast of the groin was locally fixed, whereas the shoreline receded downcoast of the groins because of the blockage of longshore sand transport owing to the groins, as shown in Figure 18; an enlarged satellite image of the rectangular area shown in Figure 17.
In this area, six groins were installed to protect the village, whereas the shoreline markedly retreated south of groin No. 6. For example, the village houses between groins Nos. 4 and 5, made of large boulders with a crown height of 2 m above mean sea level, were protected by a sandy beach between groins, as shown in Figure 19. Similarly, the intertidal beach was left north of groin No. 6.
In contrast, the shoreline south of this groin retreated as a water area can be identified landward (left) end of the groin (Figure 20). Thus, the construction of the six groins was successful in locally stabilizing the shoreline, but their impact further expanded downcoast.

4.3. Formation of a Sand Spit at Santo Tomas

The shoreline changes in the rectangular area including a sand spit at Santo Tomas, shown in Figure 1, were investigated. A satellite image taken on 25 October 2003 is shown in Figure 21.
When setting A at the protruded shoreline in front of Narvacan, a concave shoreline is present near the location 880 m southeast of A, and then the shoreline protrudes again at a location 1400 m southeast of A. Since the shoreline undulation was not so large in 2003, the sand spit was considered to have been simply extending, owing to the continuous sand supply by southward longshore sand transport. However, 19 groins had been constructed until 25 October 2003, north of Narvacan, and continuous sand supply to the tip of the sand spit gradually became difficult.
By 15 April 2006, a significant shoreline change started to occur (Figure 22). By setting points B, C, and D, we found that the shoreline receded between B and C, and advanced between C and D. Until 15 March 2010, dominant shoreline recession occurred between B and C with a maximum shoreline recession of 155 m (Figure 23).
In contrast, the shoreline advanced by 86 m maximum between C and D. Furthermore, as shown in Figure 23, new sand spits of a small size developed near Narvacan, and simultaneously, the shoreline downcoast of the sand spit retreated because of the discontinuity in longshore sand supply at the tip of the sand spit, causing local shoreline recession.
Figure 24 shows a satellite image taken on 27 October 2013. In this figure, wave crestlines can be clearly observed offshore of the coastline. By setting point P 1.5 km offshore of B, we estimated the incident wave angle at P to be S113°W. Because the angle of the direction normal to the shoreline between B and C is S63°W, the wave incidence angle relative to the direction normal to the mean shoreline becomes 50°, satisfying the occurrence condition of high-angle wave instability. In Figure 24, the critical point where the shoreline recession started was located at B’ 240 m south of B, and the shoreline markedly receded between B’ and C with a maximum shoreline recession of 210 m across transect a–a’. In contrast, the shoreline advanced between C and D with a maximum shoreline advance of 190 m across transect b–b’.
By 28 February 2015, the shoreline retreated between B’ and C with a maximum shoreline recession of 210 m at transect a–a’, whereas the shoreline advanced between C and D with a maximum shoreline advance of 190 m at transect b–b’ (Figure 25). As mentioned above, accretion occurred in the areas of AB’ and CD with erosion in the area of B’C separating these accretion areas, and the shoreline undulated as a periodic function with increasing amplitude. These shoreline changes are similar to those observed in the area south of the Aringay River mouth, and the amplitude was extremely large at 220 m in the area of B’C.

5. Results of Numerical Calculations
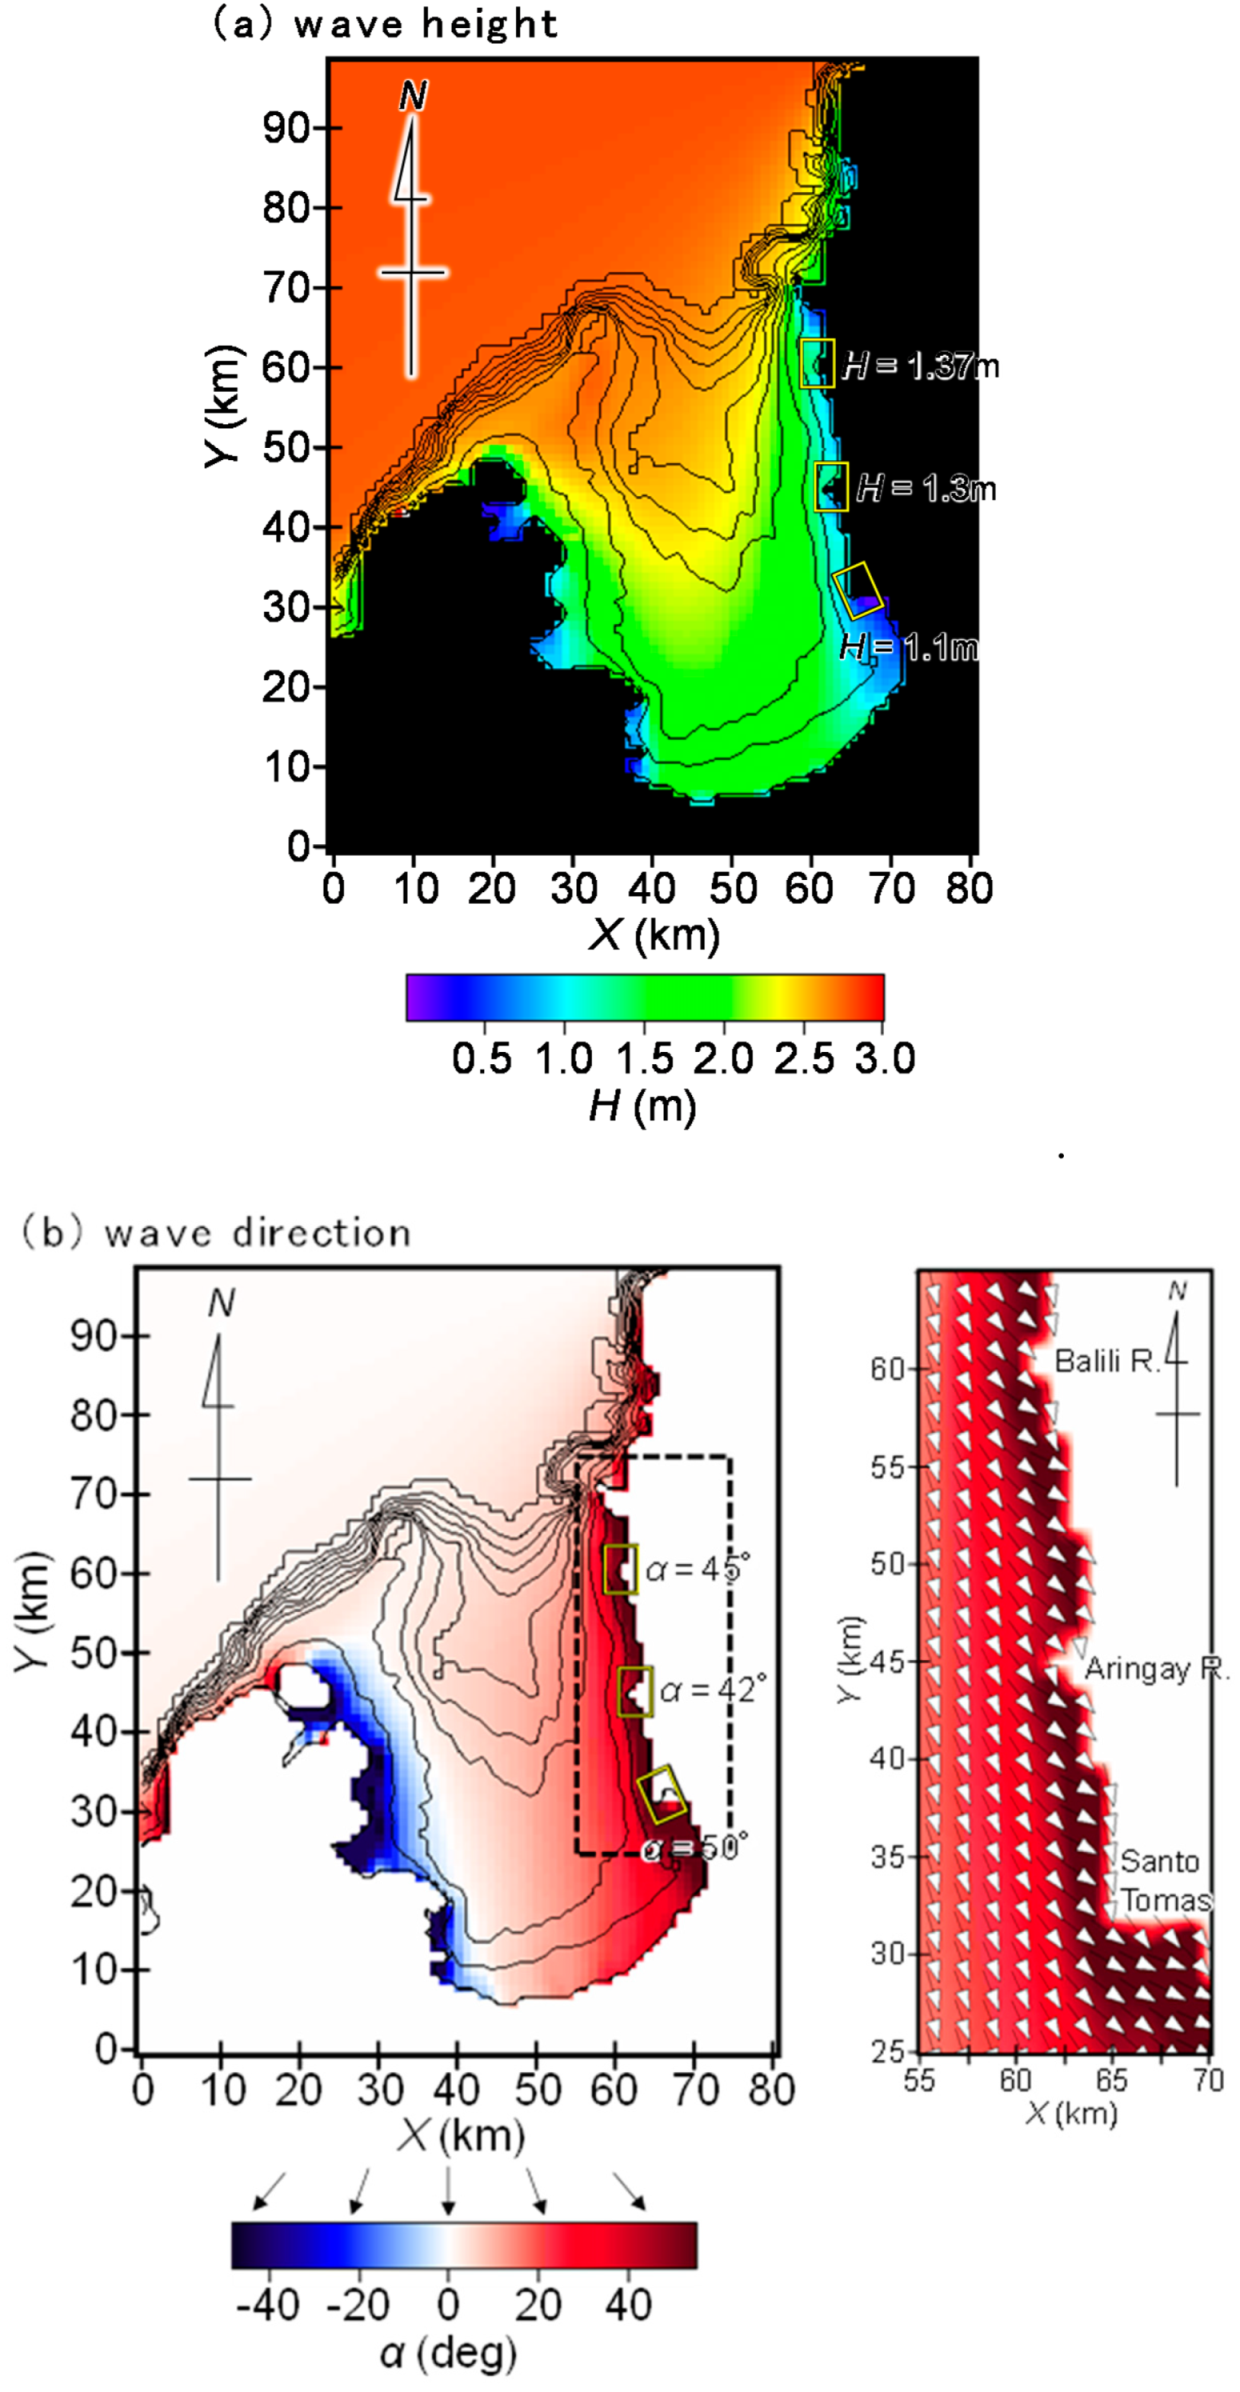
5.1. Wave Field

The formation of shoreline undulations including sand spits along the east coast of Lingayen Gulf may occur due to high-angle wave instability [1] because of oblique wave incidence with a large angle to the shoreline. Thus, the wave field in Lingayen Gulf was calculated using the energy balance equation [9], given the seabed contours of the gulf, as shown in Figure 2. The direction of incident waves was assumed to be N, corresponding to the direction of the most frequent energy mean waves, as shown in Table 1, referring to the Global Wave Statistics [8], with a wave height of 2.81 m and a wave period of 6.2 s. The directional spreading parameter (Smax) was selected to be 25 for waves with a large steepness and 75 for ocean waves.
Figure 26 shows the results of the calculation when Smax is given as 75. The wave height in the vicinity of the Balili River mouth near the bay mouth is 1.2 m, and the wave height reduces toward the bottom of the gulf, resulting in H = 0.9 m near the sand spit at Santo Tomas. The wave direction is shown in Figure 26b, where a positive angle is the value measured counterclockwise with respect to the -Y direction.
The wave angle relative to the direction normal to the coastline is over 45° at any point, taking the direction of the coastline into account. Similar results when Smax is 25 are shown in Figure 27. The reduction of the wave height from the entrance of the gulf toward the bottom of the gulf is the same as that when Smax is 75, with H = 1.37 m around the Balili River and H = 1.1 m near the sand spit at Santo Tomas. Comparing the two results highlights that the wave height along the coastline is greater when Smax is 75 than that when Smax is 25 because of the concentration of wave propagation. The wave angle relative to the direction normal to the coastline is greater than or close to 45° at any point. When the angle between the direction normal to the shoreline and the wave direction exceeds 45° at a point along the shoreline, the shoreline protrusion occurs at such a point owing to high-angle wave instability [1,2,12]. Thus, shoreline undulations or sand spits are capable of forming along the east coastline in Lingayen Gulf.

5.2. Formation of a Sand Spit on a Coast with Abrupt Change in Shoreline Configuration

A sand spit has formed at a location with an abrupt change in shoreline configuration south of the Balili River delta, enclosing a lagoon behind the sand spit, as shown in Figure 3. Such a formation of a sand spit can be numerically predicted using the BG model [4,12]. San-nami et al. [4] carried out a numerical simulation of the elongation of a sand spit with a model case of 1/100 on a seabed with different water depths and slopes around the location where the shoreline configuration abruptly changes. In their study, the water depth where a sand spit is formed were altered to 5, 10, 15, and 20 cm at various seabed slopes of 1/50, 1/40, 1/30, and 1/20. The incident wave height was Hi = 4.6 cm, and the wave period T = 1.27 s. A beach model was produced, as shown in Figure 28a, with incident waves from the Y-axis, so the wave incidence angle normal to the upcoast shoreline was to be 20°. The depth of closure was given as hc = 2.5 H, where H is the wave height at a point. The berm height and equilibrium slope of sand were assumed as 5 cm and 1/5, respectively, based on the experimental results along with the angle of repose of sand of 1/2. The calculation domain was discretized by meshes of 20 cm, and the 8 h of calculation (8 × 10⁴ steps) was carried out using the time intervals of Δt = 10−4 h. Table 2 shows the calculation conditions.
Figure 28b,c shows the results for the condition under which a sand spit is formed on a coast of the seabed slope of 1/20. When waves were incident from the Y-axis where the coastline direction markedly changes, similarly to the area south of the Balili River, leftward longshore sand transport occurred, and a sand spit started to elongate from the location where the coastline abruptly changes. After two hours of wave generation, a sand spit elongated very close to the opposite shore, enclosing a lagoon behind the sand spit. The elongation of a sand spit and the formation of a lagoon behind the sand spit may account for the observation results qualitatively. Thus, the formation of a sand spit south of the Balili River can be explained by the mechanism shown by San-nami et al. [4].

6. Longshore Sand Transport

6.1. Estimation of the Rate of Longshore Sand Transport

Although a sand spit extended south of Narvacan in recent years, many groins have been constructed upcoast of Narvacan, and smooth movement of sand by southward longshore sand transport was blocked by these groins, resulting in the shoreline recession at Narvacan. Here, the change in sand volume can be estimated from the shoreline changes, as shown in Figure 25, assuming that sand supply from upcoast became negligibly small because of the blockage by groins constructed upcoast.
First, the planar area in the shoreline recession zone between B’ and C in Figure 25 between October 2003 and February 2015 is calculated to be 2.1 × 10⁵ m2. The rate of change in the total volume of sand in the area between B’ and C can be calculated by multiplying this planar area by the characteristic height of beach changes (h), which is a correlation factor when the shoreline change is transformed into the change in cross-sectional area of the beach, and dividing by the period between 25 October 2003 and 28 February 2015. Usually, h can be determined from the bathymetric survey data, but in this case, it was difficult to employ this method because of the lack of bathymetric survey data. Therefore, h was calculated using empirical relationships h = (1.0–1.3) hc and hR = 0.31 hc among h, hc, and hR [16]. In this case, the berm height hR is given as 2.0 m owing to the field observation [11].
Since the mean value of h is determined to be 7.5 m, the rate of change in the total volume of sand in the area between B’ and C became 1.3 × 10⁵ m3/yr. North of Narvacan, southward longshore sand transport decreased because of the construction of groins. Assuming that the southward longshore sand transport at point B’ is negligible, the rate of longshore sand transport through point C, which is the nodal point between the erosion and accretion areas, can be evaluated to be 1.3 × 10⁵ m3/yr.

6.2. Interruption of Continuous Longshore Sand Transport at the Sand Spit Tip

In the Balili and Aringay River deltas, the sand supply downcoast was suspended until the sand supplied from the upcoast of the river deltas reaches downcoast, resulting in shoreline recession downcoast. Similarly, the shoreline downcoast of the sand spit retreated owing to the discontinuity in longshore sand supply at the tip of the sand spit at Santo Tomas. This is commonly observed around the tip of the sand spit. Noshi et al. [17] showed an example of the rapid development of a recurved sand spit around the south end of Phan Rang City in Vietnam. In their example, erosion occurred downcoast of the sand spit during the elongation period of the sand spit because of spatial imbalance in longshore sand transport at the tip of the sand spit. After the sand spit further elongated and connected the opposite shore, however, the sand supply by longshore sand transport along the shoreline of the sand spit was possible. In the area first eroded, sand was redeposited. The same phenomena were observed north of Pengambengan fishing port located in Bali Strait [18] and during the development of a barrier island in Nakatsu tidal flat [19].

7. Similarity of Lingayen Gulf and Suruga Bay in Japan

The beach changes along the east coast in Lingayen Gulf could be compared with those measured in another bay with a similar aspect ratio and wave characteristics, such as Suruga Bay in Japan, shown in Figure 29. When a straight line is drawn between Point Irozaki at the tip of Izu Peninsula and Point Omaezaki in Figure 29, the width of the bay mouth is approximately 50 km, and the length of the bay measured from this straight line to the bottom of the bay is 60 km, resulting in an aspect ratio of 1.2. Since the width and length of Lingayen Gulf were 44 and 58 km, respectively, and the aspect ratio is 1.3, both bays are similar to each other in terms of width, length, and aspect ratio. In addition, the west coast of Lingayen Gulf has a complicated coastline with many islands and headlands, similarly to the east coast in Suruga Bay. The development of the Balili and Aringay River deltas along the east coast of Lingayen Gulf is similar to the development of the river deltas around the Ohi and Abe Rivers with the catchment areas of 1280 and 567 km2, respectively, on the west coast in Suruga Bay. Furthermore, the formation of a sand spit at Santo Tomas is similar to the formation of the Mihono-matsubara sand spit. Thus, the morphologies of both bays resemble each other so that waves are obliquely incident to the direction normal to the shoreline, and a sand spit has been formed near the bay bottom. Therefore, much experience of beach erosion along the west coast in Suruga Bay is useful in considering measures against beach erosion on the east coasts in Lingayen Gulf.
Figure 30 shows the seabed contours of Suruga Bay, which faces the Pacific Ocean to the south [20], and is a deep bay with a maximum water depth of 2000 m compared with that of 100 m in Lingayen Gulf. However, the coastline configuration of the west coast of Suruga Bay resembles the east coast of Lingayen Gulf; the coastline protrudes at the mouths of the Ohi and Abe Rivers, and Mihono-matsubara sand spit develops in the bay. Owing to the wave observations offshore of the Shimizu coast, the wave height with a probability of occurrence less than 5% is 3.0 m with a wave period of 9 s [21]. This wave height is the same order of magnitude in Lingayen Gulf. The rate of longshore sand transport was estimated to be 1.3 × 10⁵ m3/yr around the sand spit at Santo Tomas, which is in good agreement with the value of 1.3 × 10⁵ m3/yr estimated on the Shimizu coast surrounding Mihono-matsubara sand spit in Suruga Bay [21]. On the Shimuzu coast, severe beach erosion occurred owing to the decrease in the fluvial supply of sand after extensive riverbed mining in the Abe River, which is the supply source of sand, and the movement of a sand body occurred owing to the blockage of longshore sand transport by a number of detached breakwaters as described in [20]. Thus, the experience of the beach erosion on coasts in Suruga Bay, fully described in detail [20], is useful in explaining the beach changes along the coasts in Lingayen Gulf at least as a first step before detailed numerical simulation.

8. Concluding Remarks

The formation of shoreline undulations due to high-angle wave instability was actually observed at two river deltas and around a sand spit at Santo Tomas in Lingayen Gulf. The sand spit at Santo Tomas extended, similarly to a sinusoidal function due to high-angle wave instability, resulting in large shoreline recession and advance. South of the Balili River, the elongation of a sand spit was observed on a coast with an abrupt change in shoreline configuration, because waves were obliquely incident to the shoreline at a large angle. These observation results were explained by the mechanism described by San-nami et al. [4].
The morphologies of the east coast in Lingayen Gulf and the west coast in Suruga Bay are very similar (Figure 1 vs. Figure 29). A protruded shoreline develops north of the Ohi River, similarly to south of the Balili River, and the shoreline orientation abruptly changes. Continuous transport of sand was disrupted in a 20 km stretch between the Aringay River and the sand spit at Santo Tomas because of the construction of many groins to locally protect the coast, causing downcoast erosion. Although the sand supplied from the Abe River was transported northward forming Mihono-matsubara sand spit at a location where the shoreline orientation abruptly changes [21], severe beach erosion occurred on the Shizuoka and Shimizu coasts north of the river mouth owing to the decrease in sediment supply from the river caused by excess riverbed mining in the Abe River [20]. On the Suruga coast north of the Ohi River and the Shizuoka and Shimizu coasts located north of the Abe River, the beaches were severely eroded. As a measure, sand bypassing from the riverbed to the coasts was adopted. Taking into account the fact that the east coasts in Lingayen Gulf have the same condition as those in Suruga Bay, overall management of sand movement is required instead of local optimization using groins. A soft measure, such as sand bypassing, should be preferred along the coasts in Lingayen Gulf instead of hard measures against erosion to prevent an artificial, protected coastline from expanding, similarly to the case of coasts in Suruga Bay in Japan, where sand bypassing has now been adopted as a measure for sediment management.

Author Contributions

Data curation, T.U.; Formal analysis, Y.N. All authors have read and agreed to the published version of the manuscript.

Funding

This research received no external funding.

Institutional Review Board Statement

Not Applicable.

Informed Consent Statement

Not Applicable.

Conflicts of Interest

The authors declare no conflict of interest.

References

  1. Ashton, A.; Murray, A.B.; Arnault, O. Formation of coastline features by large-scale instabilities induced by high angle waves. Nature 2001, 414, 296–300. [Google Scholar] [CrossRef] [PubMed]
  2. Serizawa, M.; Uda, T.; Miyahara, S. Prediction of development of sand spits and cuspate forelands with rhythmic shapes caused by shoreline instability using BG model. In Proceedings of the 33rd ICCE, Santander, Spain, 1–6 July 2012; pp. 1–11. Available online: http://journals.tdl.org/icce/index.php/icce/article/view/6534/pdf_534 (accessed on 20 March 2021).
  3. Anthony, E.J. Patterns of sand spit development and their management implications on deltaic, drift-alinged coasts: The causes of the Senegal and Volta River delta sipts, west Africa. In Sand and Gravel Spits; Randazzo, G., Jackson, D.W., Cooper, J.A.G., Eds.; Springer International Publishing: Berlin/Heidelberg, Germany, 2015; pp. 21–36. [Google Scholar]
  4. San-nami, T.; Uda, T.; Serizawa, M.; Miyahara, S. Numerical simulation of elongation of sand spit on seabed with different water depths and slopes. In Proceedings of the 34th ICCE, Seoul, Korea, 15–20 June 2014; pp. 1–13. Available online: https://journals.tdl.org/icce/index.php/icce/article/view/7112/pdf_415 (accessed on 9 March 2021).
  5. Sabatier, F.; Anthony, E. The sand spits of the Rhone River delta: Formation, dynamics, sediment budgets and management. In Sand and Gravel Spits; Splinger International Publishing: Berlin/Heidelberg, Germany, 2015; pp. 259–274. [Google Scholar]
  6. Vespremeanu-Stroe, A.; Preoteasa, L. Morphology and cyclic evolution of Danube Delta spits. In Sand and Gravel Spits; Springer International Publishing: Berlin/Heidelberg, Germany, 2015; pp. 327–339. [Google Scholar]
  7. Zainescu, I.F.; Vespremeanu-Stroe, A.; Tatui, F. Comparative spit dynamics. The cause of deltaic river mouth spits. J. Coast. Res. 2016, 75, 800–804. [Google Scholar]
  8. Hogben, N. Gloval Wave Statistics; British Maritime Technology Ltd.: Teddington/Middlesez, UK, 1986. [Google Scholar]
  9. Mase, H. Multidirectional random wave transformation model based on energy balance equation. Coast. Eng. J. JSCE 2001, 43, 317–337. [Google Scholar] [CrossRef]
  10. MacManus, L.T.; Thia-Eng, C. The Coastal Environmental Profile of Lingayen Gulf, Philippine, Association of Southeast Asian Nations/United States Coastal Resources Management Project; Technical Publications Series 5; Association of Southeast Asian Nations: Manila, Philippines, 1990. [Google Scholar]
  11. Uda, T.; Serizawa, M.; Onaka, S.; Ichikawa, S. Development of a sand spit offshore of groin under high-angle wave condition and evaluation of longshore sand transport. J. Jpn. Soc. Civ. Eng. Ser. B2 Coast. Eng. 2020, 76, 631–636. (In Japanese) [Google Scholar] [CrossRef]
  12. Uda, T.; Serizawa, M.; Miyahara, S. Morphodynamic Model for Predicting Beach Changes Based on Bagnold’s Concept and Its Applications; INTEC: London, UK, 2018; p. 188. Available online: https://www.intechopen.com/books/morphodynamic-model-for-predicting-beach-changes-based-on-bagnold-s-concept-and-its-applications (accessed on 20 March 2021).
  13. Ozasa, H.; Brampton, A.H. Model for predicting the shoreline evolution of beaches backed by seawalls. Coast. Eng. 1980, 4, 47–64. [Google Scholar] [CrossRef]
  14. Dally, W.R.; Dean, R.G.; Dalrymple, R.A. A model for breaker decay on beaches. In Proceedings of the 19th ICCE, Houston, TX, USA, 6–8 June 1984; pp. 82–97. [Google Scholar]
  15. Goda, Y. Random Seas and Design of Maritime Structures; University of Tokyo Press: Tokyo, Japan, 1985; p. 323. [Google Scholar]
  16. Uda, T. Beach Erosion in Japan; Sankaido: Tokyo, Japan, 1997; p. 442. (In Japanese) [Google Scholar]
  17. Noshi, Y.; Uda, T.; Kobayashi, A.; Miyahara, S.; Serizawa, M. Beach changes observed in Phan Rang City in Southeast Vietnam. In Proceedings of the 8th International Conference on Asian and Pacific Coasts (APAC 2015), Procedia Engineering, Chennai, India, 7–10 September 2015; Volume 116, pp. 163–170. [Google Scholar]
  18. Uda, T.; Onaka, S.; Serizawa, M. Beach erosion downcoast of Pengambengan fishing port in western part of Bali Island Japan. In Proceedings of the 8th International Conference on Asian and Pacific Coasts (APAC 2015), Procedia Engineering, Chennai, India, 7–10 September 2015; Volume 116, pp. 494–501. [Google Scholar]
  19. Miyahara, S.; Uda, T.; Serizawa, M. Field observation and numerical simulation of barrier island formation as a result of elongation of sand spit and its attachment to opposite shore. In Proceedings of the 35th Conference on Coastal Engineering, Antalya, Turkey, 17–20 November 2016; pp. 1–14. [Google Scholar]
  20. Uda, T. Japan’s Beach Erosion—Reality and Future Measures, 2nd ed.; World Scientific: Singapore, 2017; p. 530. [Google Scholar]
  21. San-nami, T.; Uda, T.; Ohashi, N.; Iwamoto, H.; Serizawa, M.; Ishikawa, T.; Miyahara, S. Prediction of beach erosion caused by reduction of fluvial sand supply due to excess sand mining and beach recovery after prohibition of mining. In Proceedings of the 33rd ICCE, Santander, Spain, 1–6 July 2012; pp. 1–11. [Google Scholar]
Figure 1. Satellite image of Lingayen Gulf (for location, 16°30′45.27″ N, 120°7′11.62″ E).
Geosciences 11 00144 g001
Figure 2. Bathymetric chart of Lingayen Gulf in the Philippines (modified from [10]).
Geosciences 11 00144 g002
Figure 3. Satellite image of shoreline around Balili River mouth (15 April 2006).
Geosciences 11 00144 g003
Figure 4. Satellite image of shoreline around Balili River mouth (14 February 2014).
Geosciences 11 00144 g004
Figure 5. Satellite image of shoreline around Balili River mouth (11 June 2015).
Geosciences 11 00144 g005
Figure 6. Satellite image of shoreline around Balili River mouth (20 February 2016).
Geosciences 11 00144 g006
Figure 7. Satellite image of shoreline around Balili River mouth (1 December 2016).
Geosciences 11 00144 g007
Figure 8. Enlarged satellite image of rectangular area in Figure 7. Sites 1 and 2 are the locations where site photographs were taken in the field observation.
Geosciences 11 00144 g008
Figure 9. North view from the second floor of a damaged building.
Geosciences 11 00144 g009
Figure 10. South view from groin No. 4.
Geosciences 11 00144 g010
Figure 11. Satellite image of shoreline around Aringay River mouth (15 April 2016).
Geosciences 11 00144 g011
Figure 12. Satellite image of shoreline around Aringay River mouth (28 October 2009).
Geosciences 11 00144 g012
Figure 13. Satellite image of shoreline around Aringay River mouth (11 January 2011).
Geosciences 11 00144 g013
Figure 14. Satellite image of shoreline around Aringay River mouth (14 February 2014).
Geosciences 11 00144 g014
Figure 15. Satellite image of shoreline around Aringay River mouth (11 June 2015).
Geosciences 11 00144 g015
Figure 16. Satellite image of shoreline around Aringay River mouth (11 April 2016).
Geosciences 11 00144 g016
Figure 17. Satellite image of shoreline around Aringay River mouth (15 April 2017).
Geosciences 11 00144 g017
Figure 18. Enlarged satellite image of the shoreline in the rectangular area in Figure 17.
Geosciences 11 00144 g018
Figure 19. Picture of groin No. 4 taken from behind groin No. 5.
Geosciences 11 00144 g019
Figure 20. View of groin No. 6 taken from groin No. 5.
Geosciences 11 00144 g020
Figure 21. Satellite image around the sand spit at Santo Tomas (25 October 2003).
Geosciences 11 00144 g021
Figure 22. Satellite image around the sand spit at Santo Tomas (15 April 2006).
Geosciences 11 00144 g022
Figure 23. Satellite image around the sand spit at Santo Tomas (15 March 2010).
Geosciences 11 00144 g023
Figure 24. Satellite image around the sand spit at Santo Tomas (27 October 2013).
Geosciences 11 00144 g024
Figure 25. Satellite image around the sand spit at Santo Tomas (28 February 2015).
Geosciences 11 00144 g025
Figure 26. Predicted wave height and wave direction in Lingayen Gulf (Smax = 75), (a) wave height, (b) waive direction.
Geosciences 11 00144 g026
Figure 27. Predicted wave height and wave direction in Lingayen Gulf (Smax = 25) (a) wave height, (b) waive direction.
Geosciences 11 00144 g027
Figure 28. Elongation of sand spit and formation of barrier island [4]. (a) Initial topography, (b) A sand spit started to elongate from the corner owing to successive deposition of sand supplied by leftward longshore sand transport, (c) The tip of the sand spit attached opposite shore, forming a barrier island.
Geosciences 11 00144 g028
Figure 29. Satellite image of Suruga Bay (for location, 34°36′16.73″ N, 138°16′50.47″ E).
Geosciences 11 00144 g029
Figure 30. Bathymetric chart of Suruga Bay in Japan [20].
Geosciences 11 00144 g030
Table 1. Wave climate offshore of Lingayen Gulf [8].
ItemsWave Direction
WNWNALL
Energy mean wave height2.002.042.812.74
Wave height with a probability of occurrence less than 5% (m)4.264.425.715.41
Mean wave period (s)4.94.66.26.3
Most frequent wave period (s)4.54.55.56.5
Table 2. Calculation conditions (numbers in parentheses: experimental conditions).
Wave conditions.Incident waves: HI = 4.6 m (4.6 cm), T = 12.7 s (1.27 s), wave direction θI = 20° relative to normal to initial shoreline
Berm heighthR = 5 m (5 cm)
Depth of closurehc = 2.5 H (H: wave height)
Equilibrium slopetanβc = 1/5
Angle of repose slopetanβg = 1/2
Coefficients of sand transportCoefficient of longshore sand transport Ks = 0.045
Coefficient of Ozasa and Brampton [13] term K2 = 1.62 Ks
Coefficient of cross-shore sand transport Kn = 0.1 Ks
Mesh sizeΔx = Δy = 20 m (20 cm)
Time intervalsΔt = 10−3 h (10−4 h)
Duration of calculation80 (8) h (8 × 10⁴ steps)
Boundary conditionsShoreward and landward ends: qx = 0, right and left boundaries: qy = 0
Calculation of wave fieldCalculation of wave field: energy balance equation [9]
Term of wave dissipation due to wave breaking: Dally et al. [14] model
Wave spectrum of incident waves: directional wave spectrum density obtained by Goda [15].
Total number of frequency components NF = 1 and number of directional subdivisions Nθ = 8.
Directional spreading parameter Smax = 75.
Coefficient of wave breaking K = 0.17 and Γ = 0.3.
Imaginary depth between minimum depth h0 and berm height hR: h0 = 2 m (2 cm).
Wave energy = 0 where ZhR.
Lower limit of h in terms of wave decay due to breaking Φ: 0.7 m (0.7 cm)
Publisher’s Note: MDPI stays neutral with regard to jurisdictional claims in published maps and institutional affiliations.

