1. Introduction
The passive release of fluids from hydrothermal and magmatic sources marks the intereruptive periods of a volcanic system. Fluid permeability distribution, ruled by regional tectonic and/or caldera ring faults, controls the pathway toward the surface for magmas and hydrothermal fluids. Its changes have important implications in terms of mineralization, geothermal exploration, and the assessment of volcanic hazard [
1,
2,
3,
4,
5,
6,
7]. Furthermore, the soil degassing activity can generate gas hazard, asphyxiation, or poisoning in depressed areas, allowing the accumulation of harmful gases, especially under low wind conditions [
8,
9].
The best-known example worldwide is the event that occurred at Lake Nyos (Cameroun) in 1986 [
10], where 1700 people died due to the release of a large amount of CO
2 from the lake during the night. In the same country, two years earlier (1984), a limnic eruption occurred at Lake Monoun, where the release of a large amount of CO
2 killed 38 people. In addition to sudden catastrophic events, attention must also be paid to the long-term release of hazardous gases that can affect human health: prolonged contact with harmful gases, albeit at low concentrations, can cause irreversible damage to health.
Among the volcanic/hydrothermal gases, hydrogen sulfide and carbon dioxide are the most commonly related to gas hazard conditions and are heavier than air. Hydrogen sulfide is an irritant, asphyxiant, inhibitor of metabolic enzymes [
11], and at high concentrations is classified as poisonous [
12,
13]. It has a low odor threshold (its smell may be detected below 1 ppm), but at concentrations above 100 ppm, its detection ability is affected by a rapid temporary paralysis of the olfactory nerves, resulting in loss of the sense of smell. It can generally provoke headache, nausea, vomiting, confusion, paralysis, diarrhea, cough, breath shortness, pulmonary oedema, and eye and throat irritation. Carbon dioxide is asphyxiant and odorless, and that makes it extremely insidious. Health hazards related to CO
2 exposure may occur depending on the CO
2 concentration inhaled and related exposure times, with progressive harmful effects ranging from headaches to increased frequency of heartbeat and, finally, death. For these reasons, these gases are named “the silent killers”.
Critical gas hazard conditions occur in volcanic areas with a high touristic vocation, where thousands of people arrive mainly in the summer season, such as at Vulcano Island in the Aeolian archipelago (Italy). For this reason, we focused our attention on the anomalous soil degassing area of Baia di Levante, where critical concentrations of harmful gases have been detected in the past. Here, in the summer of 1988, two children died of asphyxiation [
9,
14,
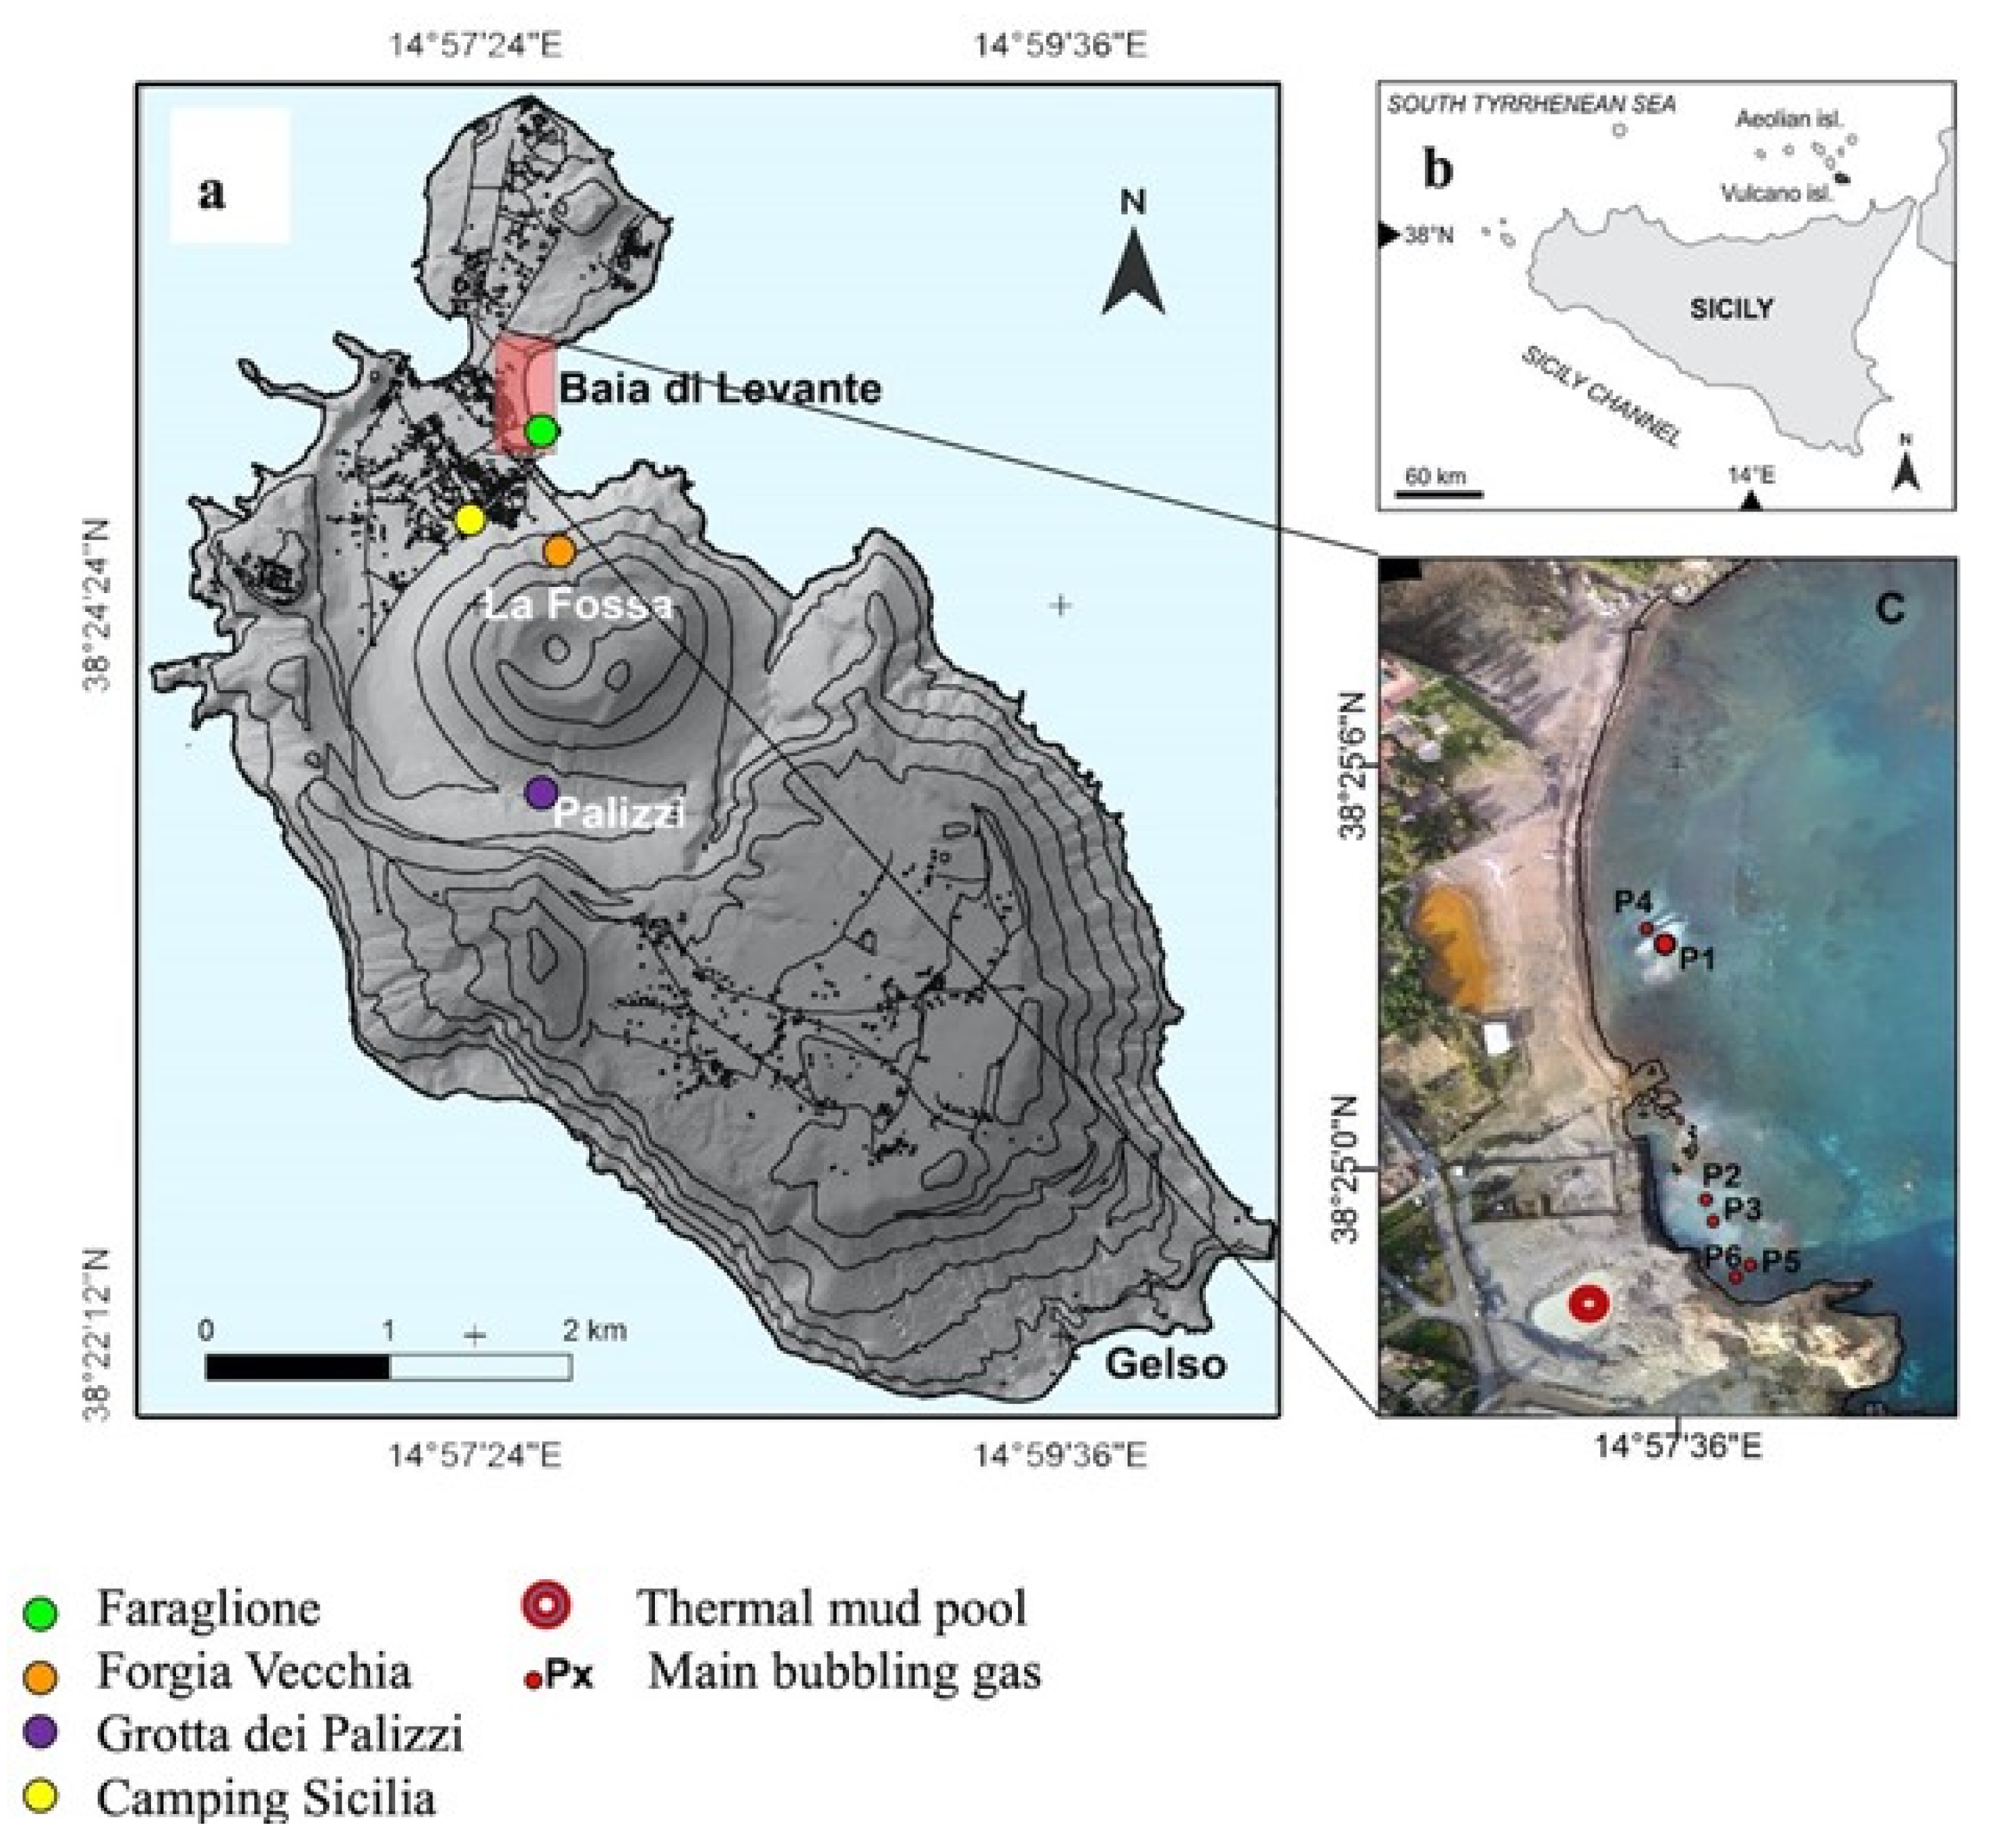
15]. Again, in April 2015, a 9-year-old French child, closely approaching an undersea vent near the shoreline of the Baia di Levante area (
Figure 1), was seriously intoxicated/asphyxiated by the emitted gases.
This last episode further marked the need for gas hazard evaluation in the Baia di Levante area, prompting the present work that is based on a multiparametric approach articulated in (i) identification and positioning of the main fluids emissions, (ii) determination of the chemical composition of the emitted fluids, (iii) quantification of diffuse soil CO2 flux, (iv) thermal mapping of the area by both direct measures and thermal imagery, and (v) determination of atmospheric concentrations of H2S and CO2 at ground level.
All these data were plotted on high-resolution digital elevation models (DEMs), digital surface models (DSMs), and orthophotos from unmanned aerial vehicles (UAVs). We compared these new measurements with previous surveys and information from the INGV volcanic monitoring program, with the aim of depicting the ongoing degassing dynamic of the Baia di Levante area and its implications for gas hazard evaluation.
2. Geologic Framework and Volcanic Activity
The central and southern part of the Aeolian Archipelago lies on NNW–SSE-trending fault of a transpressive belt [
16], characterized by a dominant right-lateral shear mechanism [
17]. The island of Vulcano (
Figure 1) resulted from a series of constructive and destructive stages of volcanic activity, from which the two main edifices lifted up: Vulcano Primordiale (120–100 ka) [
18] and La Fossa cone, active during the last 6000 years [
19]. La Fossa cone produced explosive activity events, characterized by phreatic and phreatomagmatic eruptions. The composition of the volcanic products ranges from calc-alkaline to shoshonitic series [
20,
21].
Two eruptive centers were active in the Baia di Levante area during the last 3000 years: the Faraglione tuff cone and the Vulcanello composite cone. The Faraglione Formation consists of highly fumarolized surge deposits, emplaced between 2.9 and 1.9 ka. The Vulcanello Formation is a 30 m thick succession of massive lava flows (shoshonites), associated with thin scoriae deposits and pahoehoe-type lavas (1.9 ka) [
19].
The last eruption took place at La Fossa cone from August 1888 to March 1890 [
22,
23]. Since then, the closed-conduit volcanic system has been characterized by an intense fumarolic activity on the summit of La Fossa cone, a small (391 m a.s.l., 2 km in diameter), <5 ka old pyroclastic edifice, and diffuse CO
2 degassing from the soil [
24,
25]. Fumarolic fields are mainly distributed in the northern part of the island, in the Baia di Levante area and on the top of La Fossa cone (
Figure 1a). The highest soil CO
2 fluxes are measured at Forgia Vecchia, Grotta dei Palizzi, Faraglione, and, occasionally, Camping Sicilia (
Figure 1a).
The exhalative activity is periodically modulated by degassing crises lasting from a few months to a few years, associated with a weak shallow seismicity [
26,
27,
28,
29,
30]; their main characters are increments in the diffuse soil [
31] and fumarole [
32] degassing, temperature (up to 700 °C) and steam, and other magmatic gases output increments from the fumarolic field of La Fossa cone [
33].
The first changes in exhaling activity were documented between 1913 and 1916, when the fumarolic emissions increased either in number and/or intensity [
34]. The volcanic surveillance program, active here since the early 1980s, allowed us to identify other degassing crises in 1988, 1996, 2004, and 2010 [
15,
31,
32,
35,
36], with a character resembling a long-term cyclic behavior [
29,
30] and giving clues of functional relationships with seismic activity, either volcanic or tectonic [
5,
24,
26,
28]. Episodes of intensification of soil degassing, accompanied by sporadic variations of the gas/steam ratio, both in the summit and peripheral areas of the volcanic system, have been recorded [
4,
8,
15,
24,
31,
33,
35,
37,
38,
39].
At Baia di Levante, fumaroles are fed by a shallow hydrothermal aquifer heated by magmatic gases [
39,
40,
41,
42,
43,
44,
45,
46,
47,
48,
49]. The distribution of the natural fluid discharges is strongly affected by the local fracture network [
50]. These structural discontinuities are the local expression of the deformation field, dominated by a northward motion of the island [
17,
51]. The last variation of the exhaling activity at Baia di Levante, characterized by CO
2 dominated fluids with a few percent of H
2S [
52], started in 2010 and is still ongoing.
3. Geochemical Characterization of Baia di Levante Fluids
Currently, fumaroles are widespread in the northwestern sector of the crater rim and along the Baia di Levante beach. The associated hydrothermal system, ranging from 0.5 to 1.5 km in depth [
41,
47,
53], feeds the solfataric activity. This hydrothermal system receives heat and fluids from the magmatic source, with a shallow magma chamber at a depth of 2–3 km b.s.l., and it seems to be periodically fed by deep fluids released by an underlying reservoir [
54,
55].
The Baia di Levante area is characterized by the presence of low-temperature fumaroles (<100 °C) and seafloor vents close to the shoreline, and it represents one of the most anomalous soil degassing areas of Vulcano Island [
31]. The chemical composition of bubbling gases is CO
2-dominant, associated with a few percent of H
2S and hundreds of ppm of CH
4 and H
2 [
52,
56,
57].
Table 1 reports literature data and compositions determined in this study for the main vents.
The amount of carbon dioxide has been almost constant over time, while the reducing species, such as H
2S, H
2, and CH
4, have shown large relative variations. Furthermore, H
2S contents show a wide areal variability [
52]. This variability has been ascribed to a different interaction between hydrothermal fluids and shallow waters such as seawater and weakly acid meteoric waters.
4. Methods
4.1. DEM, DSM, and Orthophotos
DEMs were acquired by using a lightweight UAV (1.1 kg quadricopter Phantom 3 Dji) equipped with an onboard digital camera, GPS, and autopilot system. This system was coupled with a well-suited photogrammetry and mapping device (Lens FOV 94°—20 mm, Sony Sensor EXMOR 1/2.3”, effective pixel resolution of 12.4 M). Data acquisition from the entire survey was accomplished by a combination of two missions in a uniform crossed-grid pattern. The missions were performed at an altitude of 50 m and a speed of 4 m s−1. The acquisition of 132 frames supplied a coverage of the entire area.
A set of ground control points (GCR) were used for georeferencing the digital model. A GPS NAVCOM SF-3040, with angular accuracy of 1 cm, allowed the locations of the selected GCRs. The photo-frame overlap was user-set in the 75–85% range, allowing for high-quality photogrammetric images matching. The technique of structure-from-motion (SfM) was applied. The SfM technique consists of an automated method for the production of high-resolution digital surface models (DSMs) with standard cameras [
58,
59,
60]. The aerial survey photographs were processed into georeferenced orthoimages, a high-resolution digital surface model (DSM), and digital elevation model (DEM) using the photogrammetric 3D reconstruction technology software by AgiSoft PhotoScan (Agisoft LLC, St. Petersburg, Russia, 2015).
4.2. Thermal Mapping
On July 2015, a Thermal Flir camera 620T, handheld and tripod-mounted, was used to estimate the surface temperatures with an accuracy of ±2 °C. The camera was set up to record temperatures in the calibration range from −20 to 250 °C, according to the environmental conditions and the variety of fumarole temperatures expected in the field survey. The camera was calibrated before and after the survey, with a variable temperature target. The initial preprocessing of the TIR imagery involved the conversion of at-sensor-radiance values to surface temperature using a first-order correction for atmospheric absorption, surface emissivity, and environmental temperature effects using the ResearchIR Software. This correction included the distance from the target to the camera, the temperature, and the humidity content of the atmosphere. An emissivity value of 0.95 was used for the first-order correction to an appropriate value for this kind of volcanic rock.
On July and September 2015, additional direct temperature measurements were performed with different instruments for a comparison with the IR thermal acquisitions. A close IR acquisition was carried out along the coastline using a “Pyrogips” instrument [
61]. The optical distance between the temperature detector of Pyrogips and the targeted surface was 0.8 m, with a maximum detectable temperature of 250 °C. During the time of measurements, the atmospheric conditions were constant and the interception of steam of vapor clouds was avoided. The restricted pixel surface (12.5 × 10
−4 m
2) and the proximity between the measuring device and the targeted surface guaranteed the thermal homogeneity at the sub-pixel scale.
The surveyed area was covered with 900 measurements, processed both with the graphical statistical approach (GSA) and the stochastic simulation approach. The GSA method allowed identifying the different populations in the datasets (
Figure 2), according to the graphical procedure as described by [
62]. The dataset was converted by normal score transformation to follow a Gaussian distribution. The normal score-transformed dataset was used to compute omnidirectional variograms and was finally interpolated with the sequential Gaussian simulations (sGs) method to produce 100 realizations.
The final maps were produced, averaging results of the 100 simulations, using the E-type post-processes method [
63,
64]. In these maps, only the dry ground was considered for temperature interpolations. Water surfaces showing constant temperatures were blanked.
4.3. Diffuse Soil CO2 Flux
Two field surveys were carried out in summer 2015 (July and September) to measure diffuse CO2 soil gas emissions in the Baia di Levante area, utilizing randomly distributed points. These measures were interpolated over a grid covering an area of 24,300 m2, using the exponential variogram model.
The soil CO
2 flux was estimated using a WEST Systems equipment, based on a LICOR LI-820 single path, dual-wavelength, nondispersive infrared gas analyzer, that measures CO
2 concentrations in the range 0–10 vol% with ± 1 ppm resolution. [
65]. The surface covered by the chamber was chosen to be as flat and as regular as possible to avoid differences of the internal volume of the chamber between different measurements.
Moreover, a further unpublished survey carried out in 2011 was utilized and integrated in our dataset. The characterization of the degassing area and the estimates of the total discharged CO2 expressed in t d−1 of the three different campaigns were derived using the sequential Gaussian simulation, which allowed the best interpolation of datasets.
4.4. Air Concentration of CO2 and H2S
In September 2015, a Multi-GAS instrument [
66] was used to measure the atmospheric concentrations of CO
2 and H
2S. The Multi-GAS sniffs air at a fixed height of ~25–30 cm over the sea/ground surface (using a sit-on-top kayak for the marine survey) to detect, in real time, the concentrations of CO
2 (by NDIR spectroscopy) and H
2S (by specific electrochemical sensor). The specific sensors mounted onboard the Multi-GAS were a Gascard Edinburgh Instruments infrared spectrometer for CO
2 (0–10,000 ppmv range, with a resolution of 0.8 ppmv), a 0–50 ppmv H
2S electrochemical sensor (from City Technology, quoting a resolution of 0.5ppmv), and a temperature–humidity Galltec sensor (T range from −30 to 70 °C and Rh range from 0 to 100%).
The Multi-GAS sensors were calibrated before the field surveys in the laboratory by using standard gas cylinders (all in nitrogen matrixes) at different concentrations within the sensor ranges. Laboratory tests indicated a typical measurement error in the CO
2/H
2S ratios ≤20% [
67]. The Multi-GAS instrumentation was equipped with a GPS to have continuous time and space coordinates during acquisition. The CO
2 and H
2S outputs were estimated using the sequential Gaussian simulation (sGs) approach and represented by maps based on the averaging of 100 simulations, using the E-type post-processes method [
61].
4.5. Gas Sampling and Undersea Vent Surveys
Free gases samples were collected in July and September 2015, from both undersea and subaerial vents, positioning a stainless-steel funnel on the emission points, connected by a Teflon tube to Pyrex sampling bottles, tapped at both ends with Thorion valves and fluxed several times with the fumarolic gases for preventing atmospheric contamination [
68]. The positions of the main undersea degassing vents were determined using a single-frequency differential GPS system, Magellan Thales, with submetric accuracy, mounted on a sit-on-top kayak; the receiving antenna was located on the vertical of each vent with the assistance of a diver, who took undersea pictures using a waterproof Canon digital camera.
Gas compositions were determined in the laboratory facilities of INGV—Sezione di Palermo. The analyses were performed utilizing a gas chromatograph (Perkin Elmer Clarus 500) equipped with a double detector (thermal conductivity detector (TCD) and a flame ionization detector (FID) with a methanizer, using Ar as the carrier gas and a 3 m packed column, Restek Shincarbon ST (see [
68] for details).
5. Results
5.1. Thermal Mapping by Direct Temperature Measurements
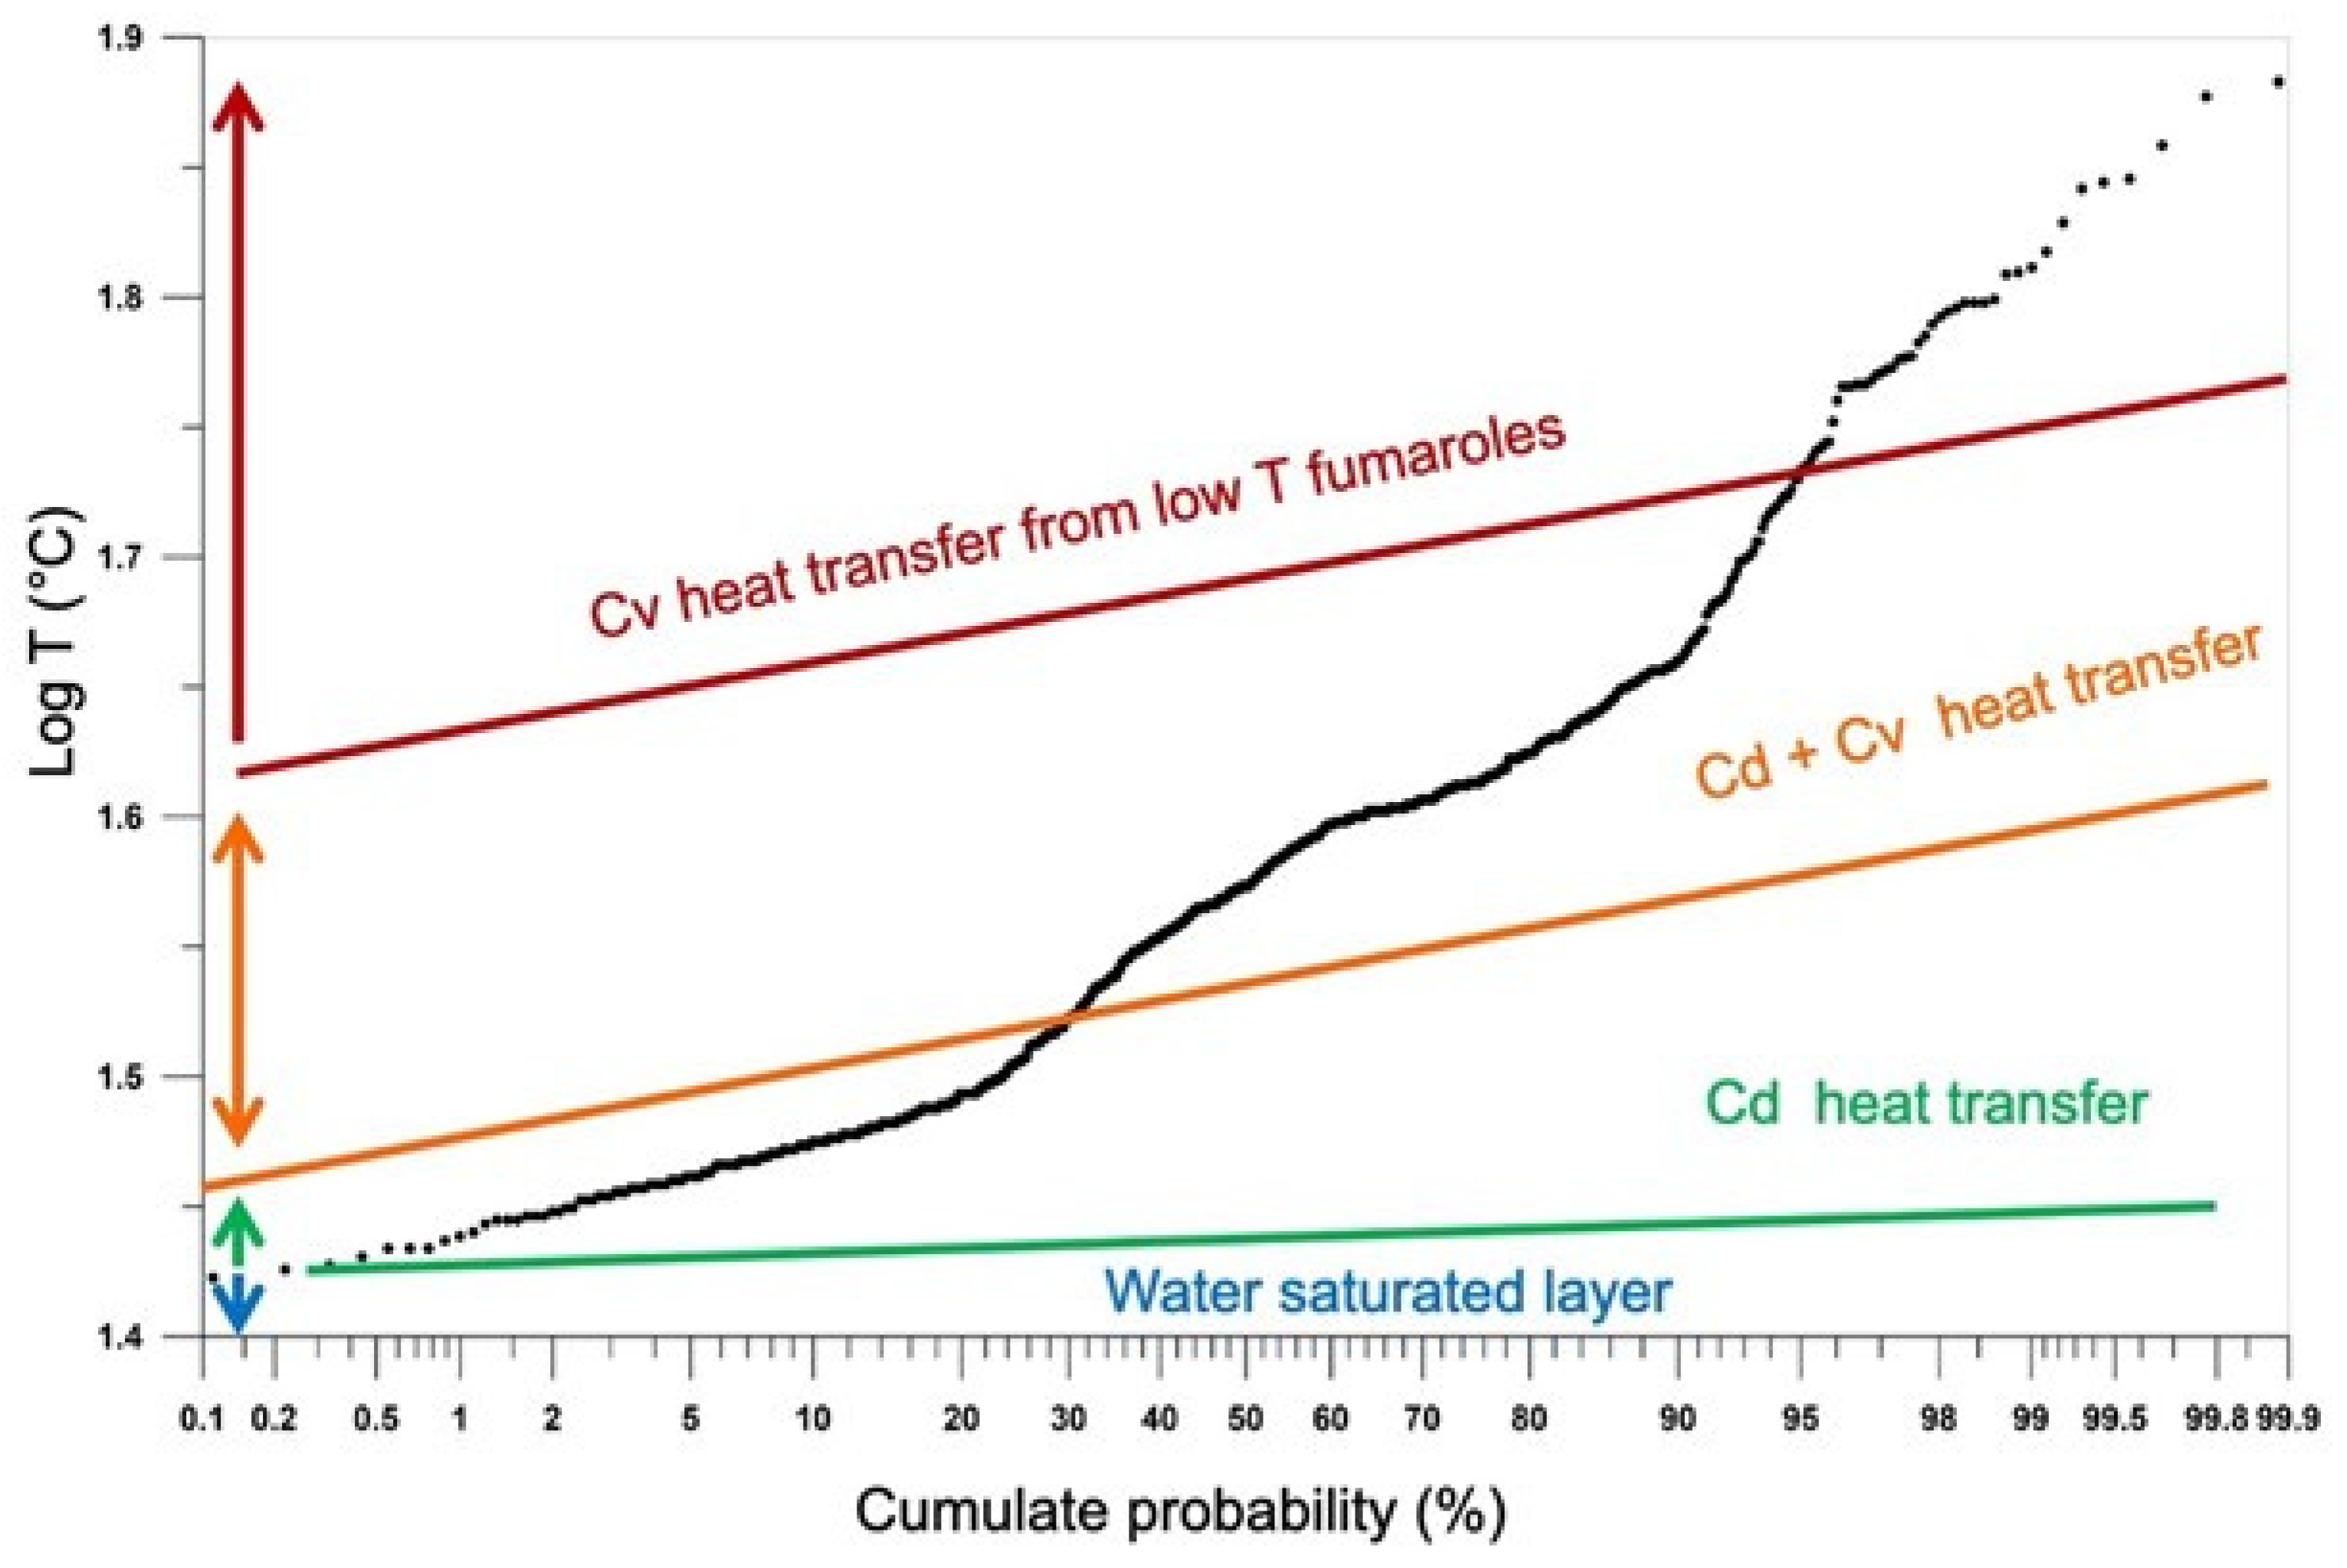
The surface temperature, as measured by Pyrogips, ranges from 24.30 to 78.20 °C. The Sinclair’s partition method (1974) suggests the identification of three populations in the September 2015 dataset (
Figure 2). The three different ranges of temperature are interpreted as surface conditions dominated by different heat transport regimes, according to the physical dominating phases (dry gases; vapor; liquid water).
The first range of temperatures (Cd in
Figure 2), including values < 29 °C, depends on different effects of the solar irradiation on the dry ground surfaces. In this lower range, the conductive law dominates the heat transfer, and no relevant steam heating processes enhance the normal ambient temperature below the ground level.
The intermediate range (from 29 to 47 °C) describes soil temperatures due to both the conductive and the convective heat transfer processes (Cd + Cv in
Figure 2). This surface is heated by the condensation process of low-pressure vapor, occurring at a very shallow level under the ground, in which the pores can be filled by a biphasic mixture of dry gas and liquid water.
The third range, including temperature values up to 72 °C, describes the soil surface where the hydrothermal activity is dominant (Cv in
Figure 2). Here, the hydrothermal circulation allows the steam to reach the atmosphere; the vapor phase is dominant in the pores and vapor visibly spreads from the main vents and surrounds.
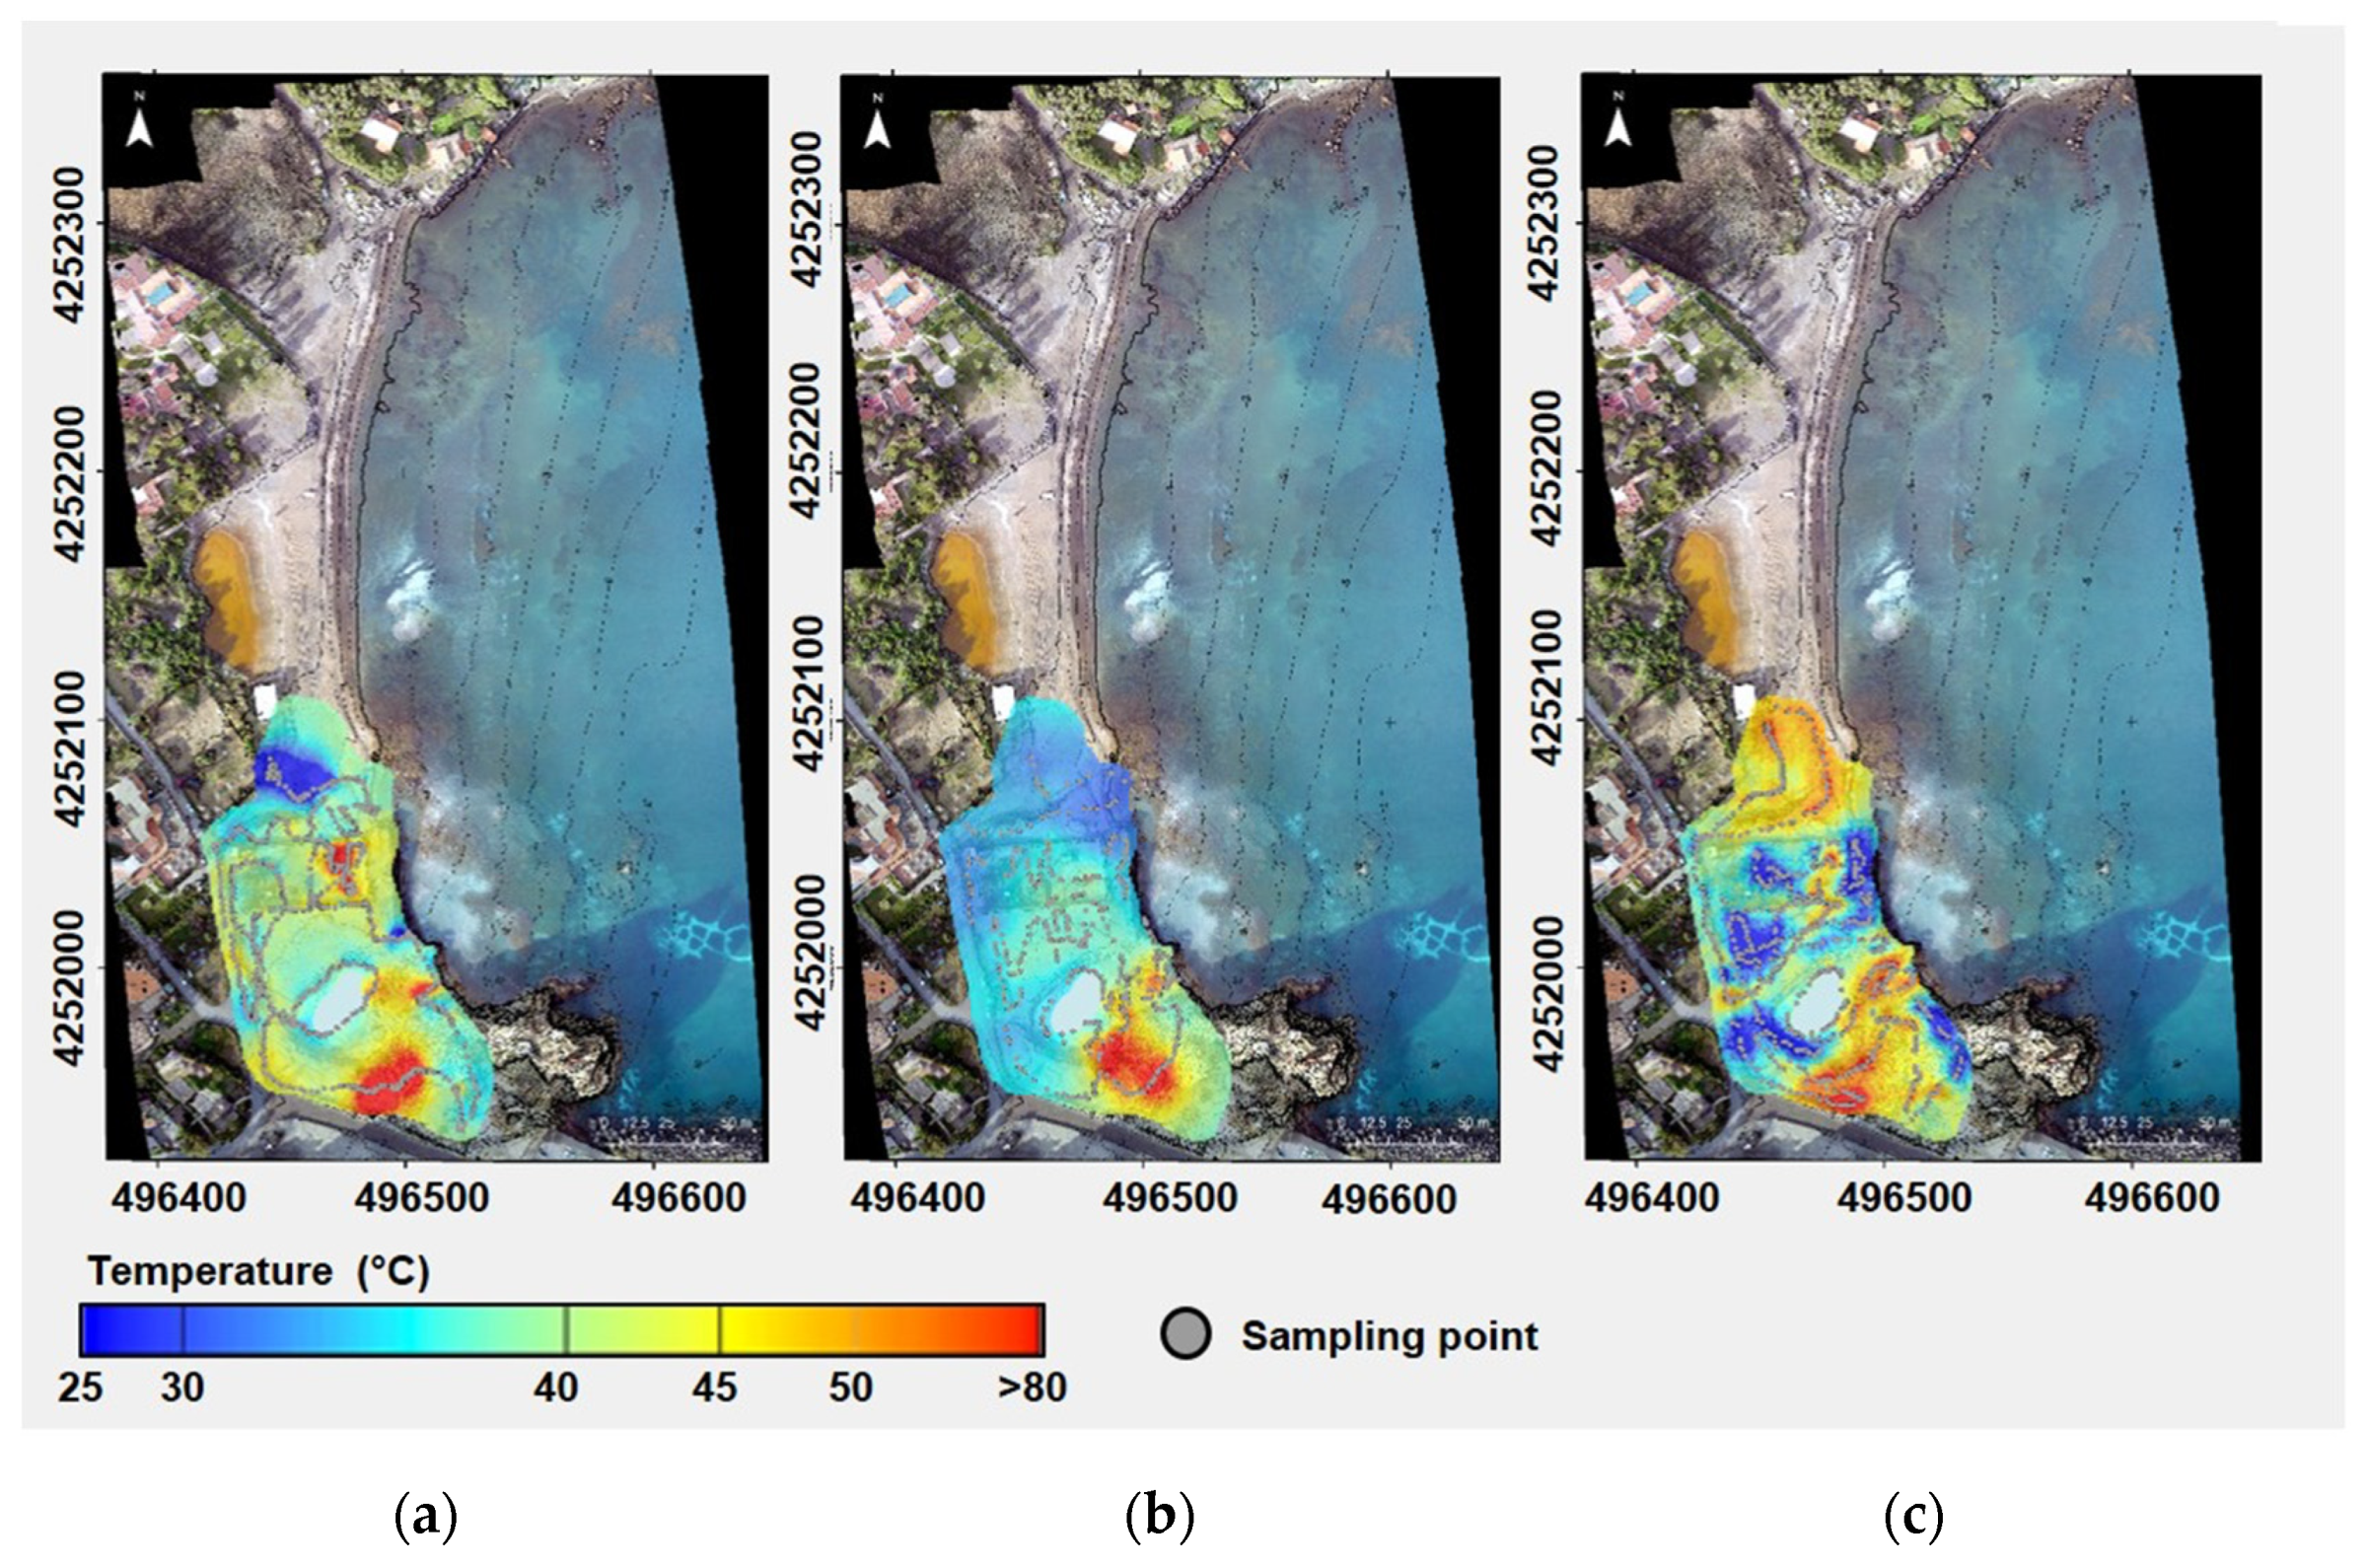
The IR maps (
Figure 3) highlight the hydrothermal heat release inside the study area. The hottest area is located in the southernmost position, and from July 2014 to September 2015 it changed in intensity and shape. Moreover, in the last survey, a new thermal anomaly appeared in the northernmost part of the map.
5.2. Thermal Mapping by Thermal Imagery
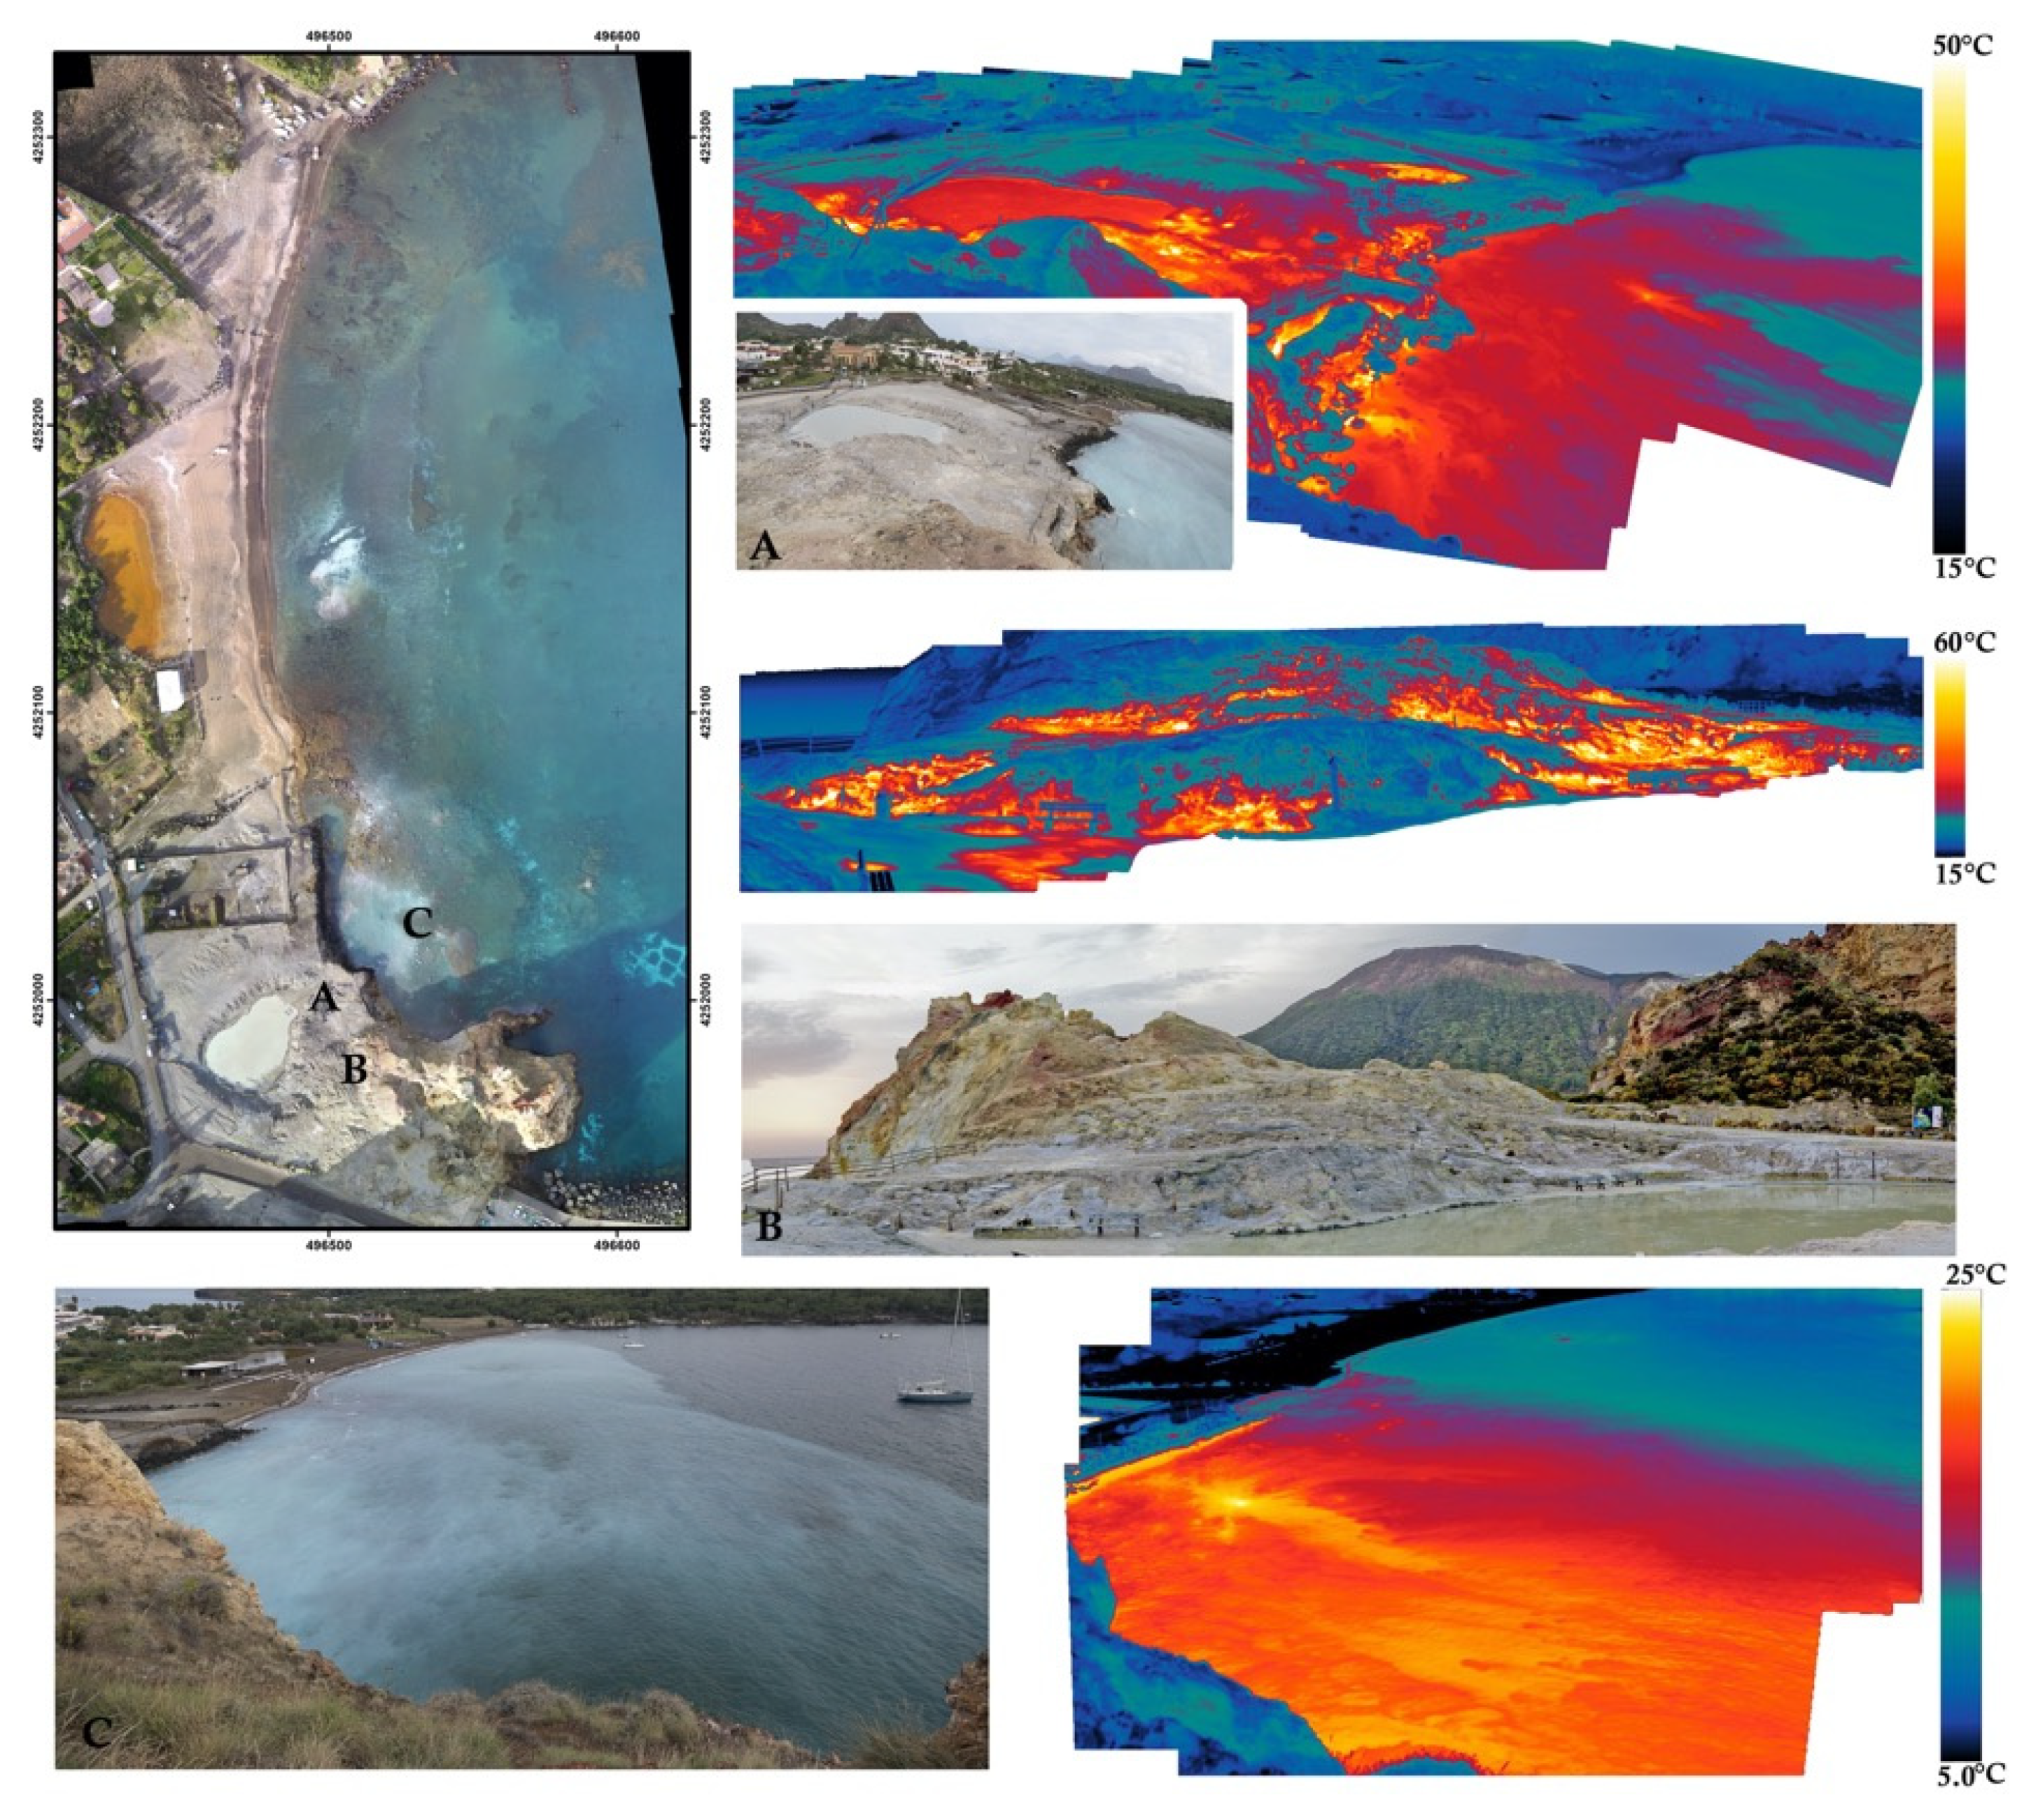
Some panoramic views of the thermal anomalies characterizing the Baia di Levante area are illustrated in
Figure 4. The photomosaic in
Figure 4A,C, shows the apparent temperature at the sea surface. The photomosaic in
Figure 4B is focused on the dry soil on the east of the mud pool, where the highest temperature was detected. The IR thermal scans are associated with their visible images. The apparent temperatures of the surface shown in the figures reach maxima of 60 °C. The highest temperatures appear both onshore and offshore. A sharp variation of temperature in the sea surface occurs in the upper right corner, extending from NW to SE. The same sharp variation is recognizable in the visible images as different turbidity of seawater. The turbidity is partially due to the gas bubbling pushing sand from the bottom and to flocculation of whitish sulfur. Moreover, along the shoreline, the surface temperature results are comparatively higher than inland (
Figure 4A,C).
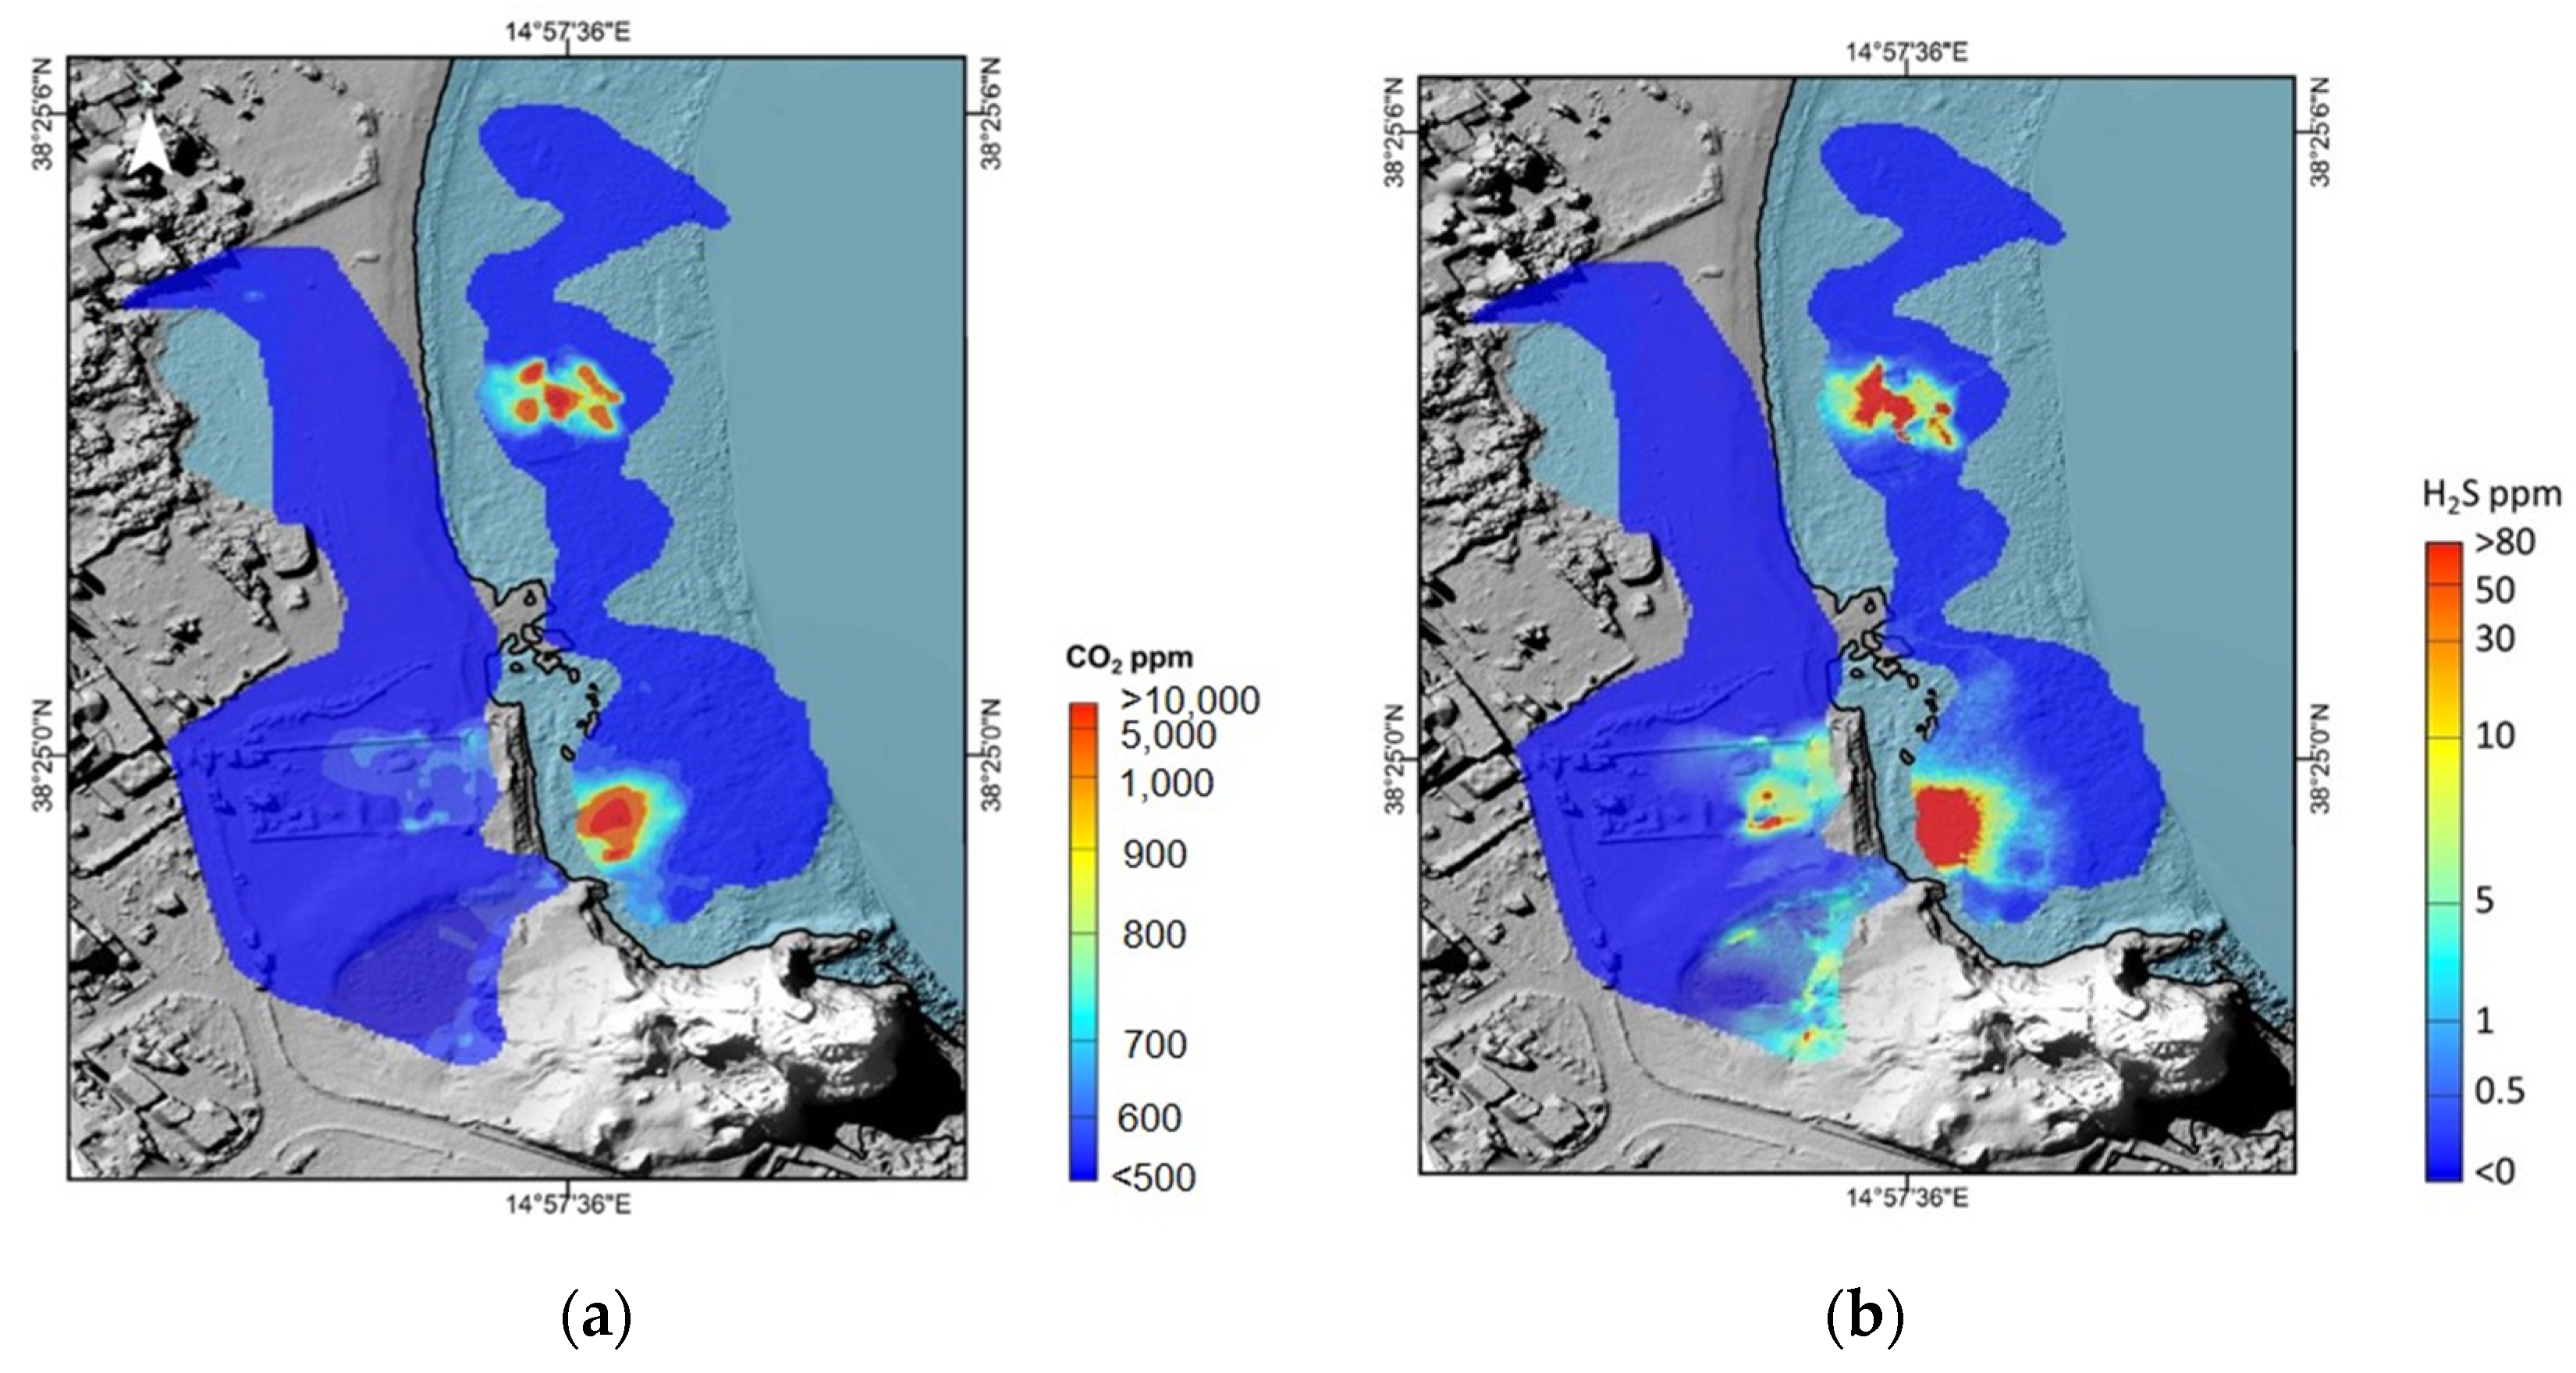
5.3. Air Concentrations of CO2 and H2S
Figure 5a shows the distribution of CO
2 atmospheric concentrations, ranging from ~500 to >10,000 ppm (July 2015). In detail, it is possible to notice that the offshore shows higher concentrations, especially above the emission vents, than the onshore. The lowest CO
2 concentrations (<400 ppm in the bay and <500 ppm in the sea) were detected far from the gas vents. In contrast, two main clusters of high CO
2 concentrations (>10,000 ppm) were detected in the proximity of the main undersea vents, where the IR spectrometer is saturated. Minor peaks of concentrations (~1000 ppm) are observed close to the fumaroles in the bay, and around the muddy pool used by tourists for mud bathing.
Figure 5b shows a map derived from the interpolation of the H
2S concentrations. Again, the H
2S anomalies are consistent with the location of the main visible undersea vents, over which peaks of concentration (>80 ppm) were recorded, leading to the oversaturation of the electrochemical sensor. Other minor anomalies (concentrations between 30 and 50 ppm) are observed close to the muddy pool. The lowest concentrations were detected far from the main fumaroles/degassing vents.
5.4. Gas Emissions from Submarine and Subaerial Vents
Two surveys were carried out in July and September 2015, sampling the main submarine gas bubbling vents (P1 and P2 sites in
Figure 1c) and one fumarole located on the beach (Mud Pool,
Figure 1c). The sampling site P1 showed the highest flux (qualitatively estimated from visual observations). Site locations are shown in
Figure 2 and chemical compositions listed in
Table 2, together with references from several investigations carried out by other authors on the same area in previous periods (1990–2011).
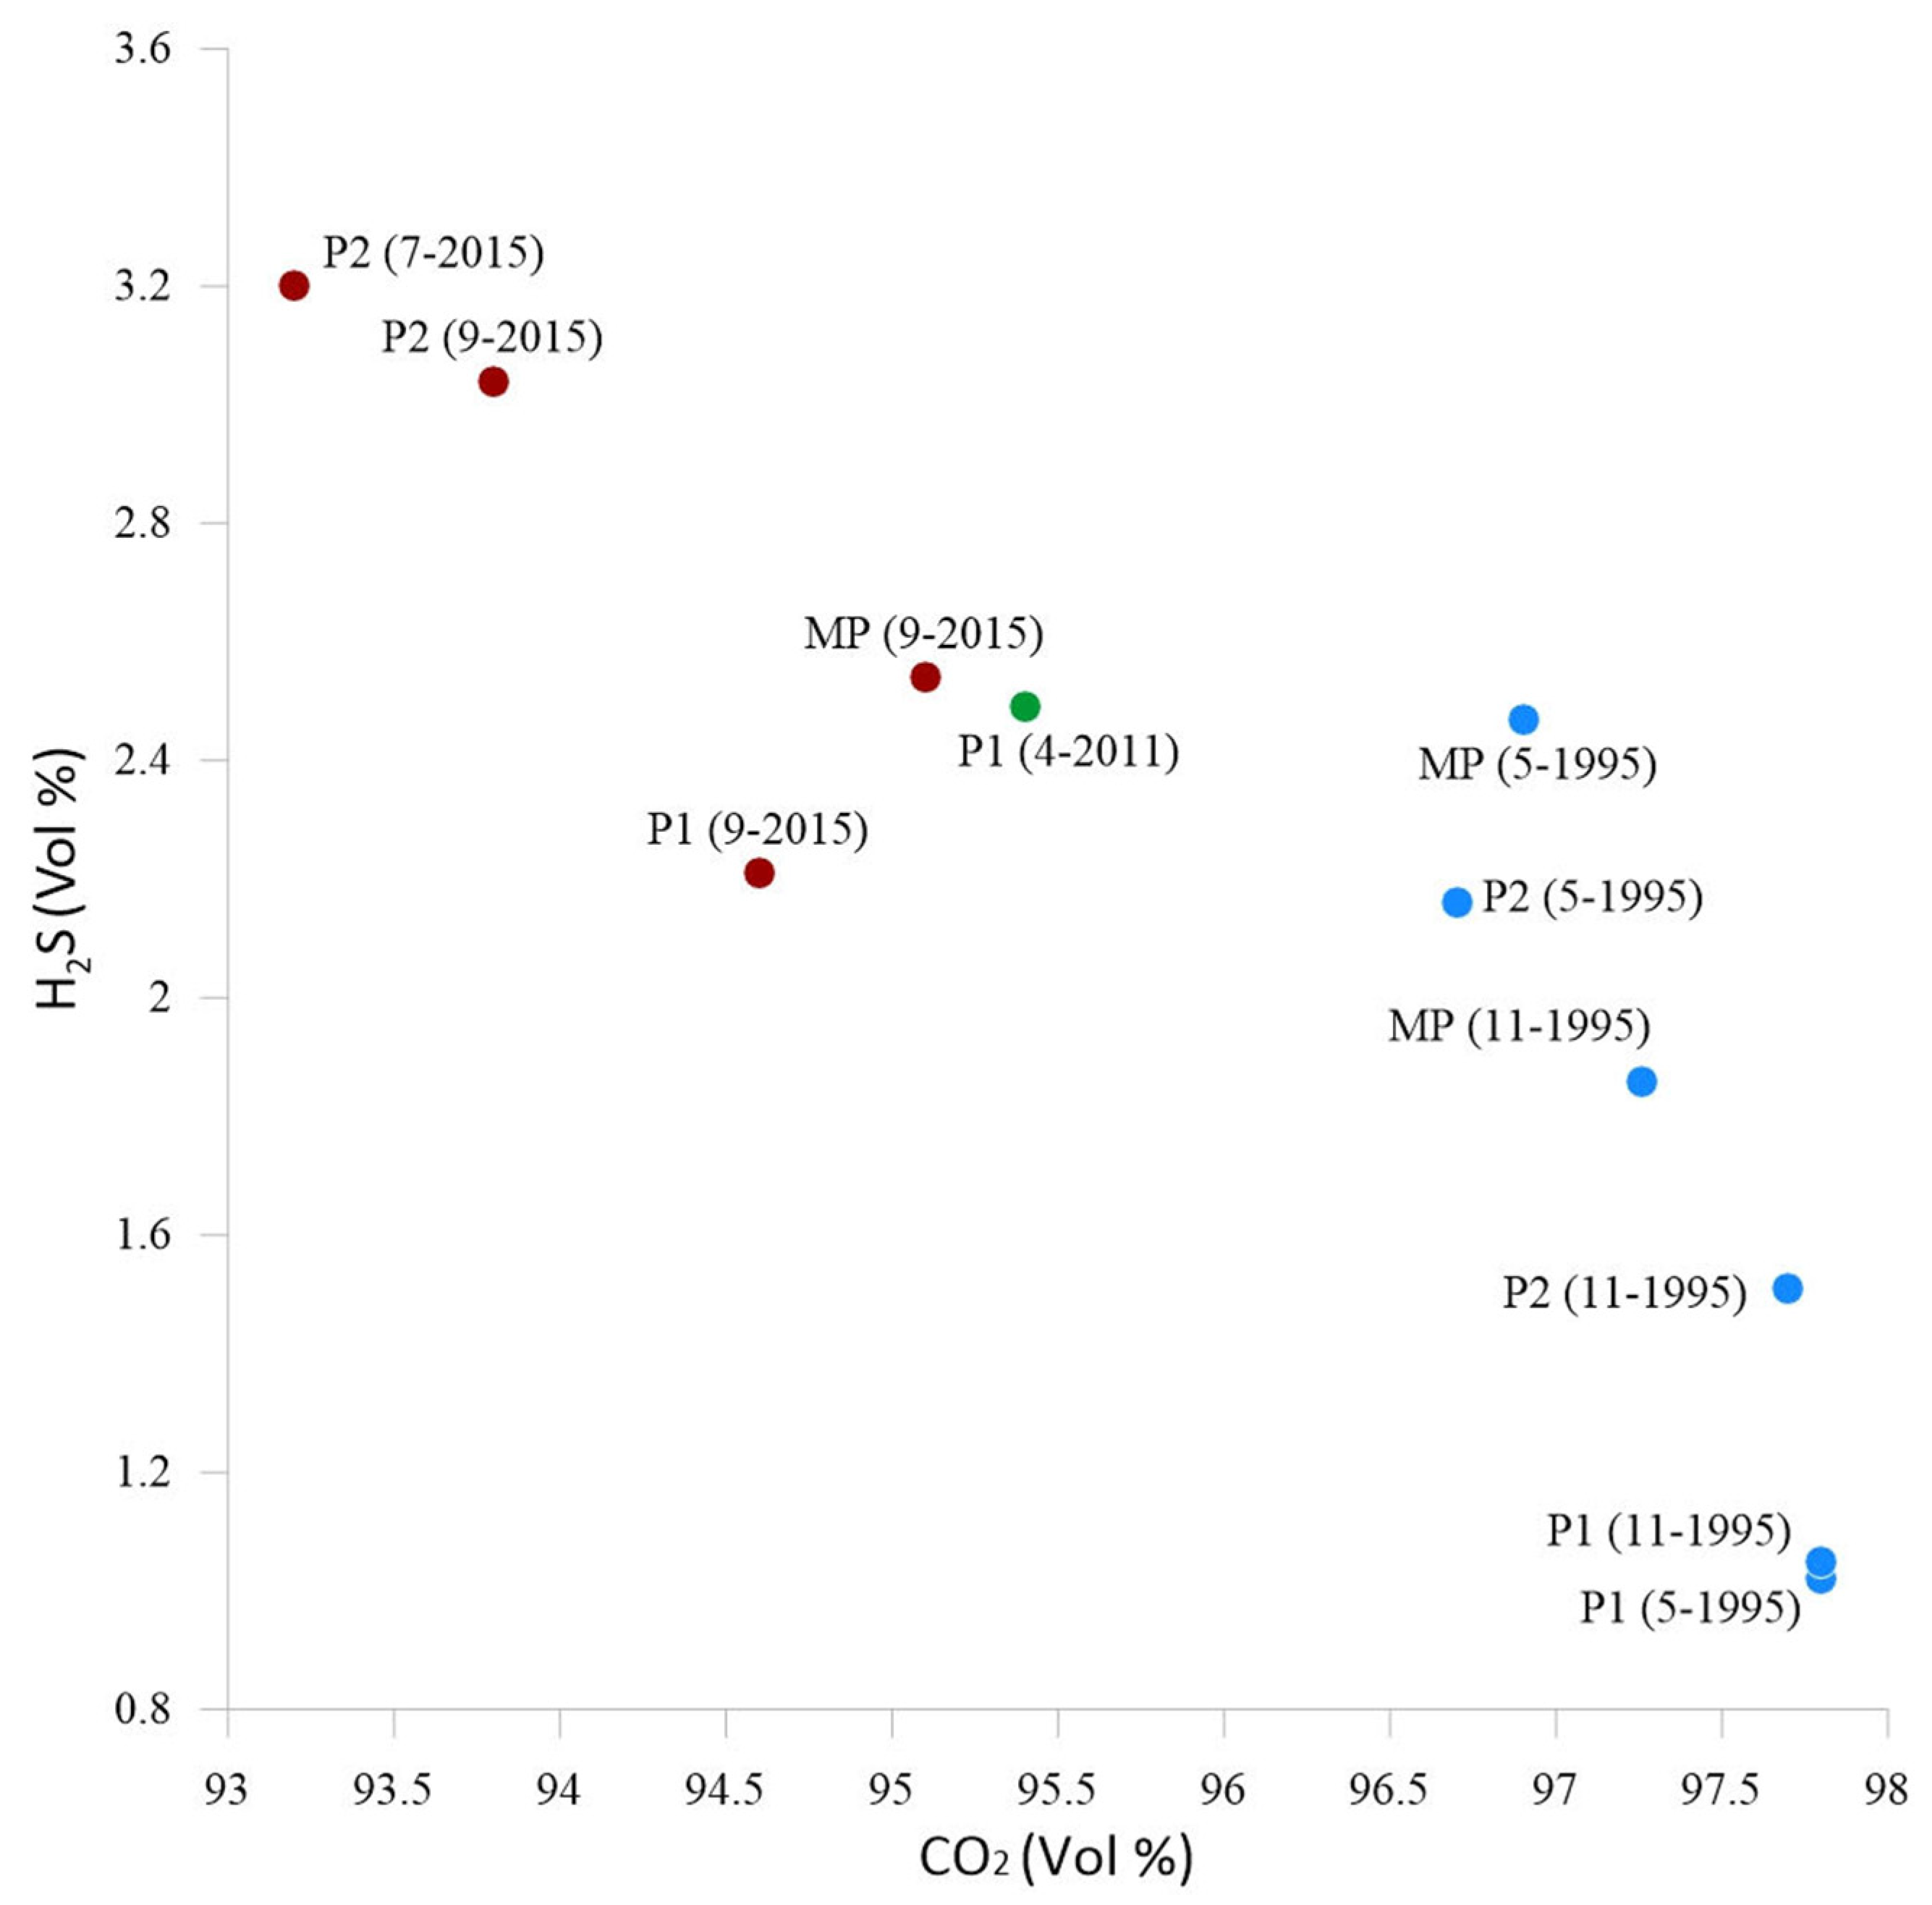
All the samples are CO
2-dominated (94–98%), with air contamination <2%, and reduced species (H
2, CH
4, and H
2S) <4%. The highest H
2S content measured in the last 20 years in the undersea vents P1 and P2 was found in July 2015 (up to 3.2%vol;
Table 1). The H
2S versus CO
2 content in the gas emissions of the undersea dry samples is plotted in
Figure 6, which highlights the great variability over time of H
2S: in 2015, it was always higher than in 1995, but the lowest value was recorded in 2011, when the total CO
2 diffuse flux from the subaerial zone was also at its relative minimum (see following Figure 9 and related text).
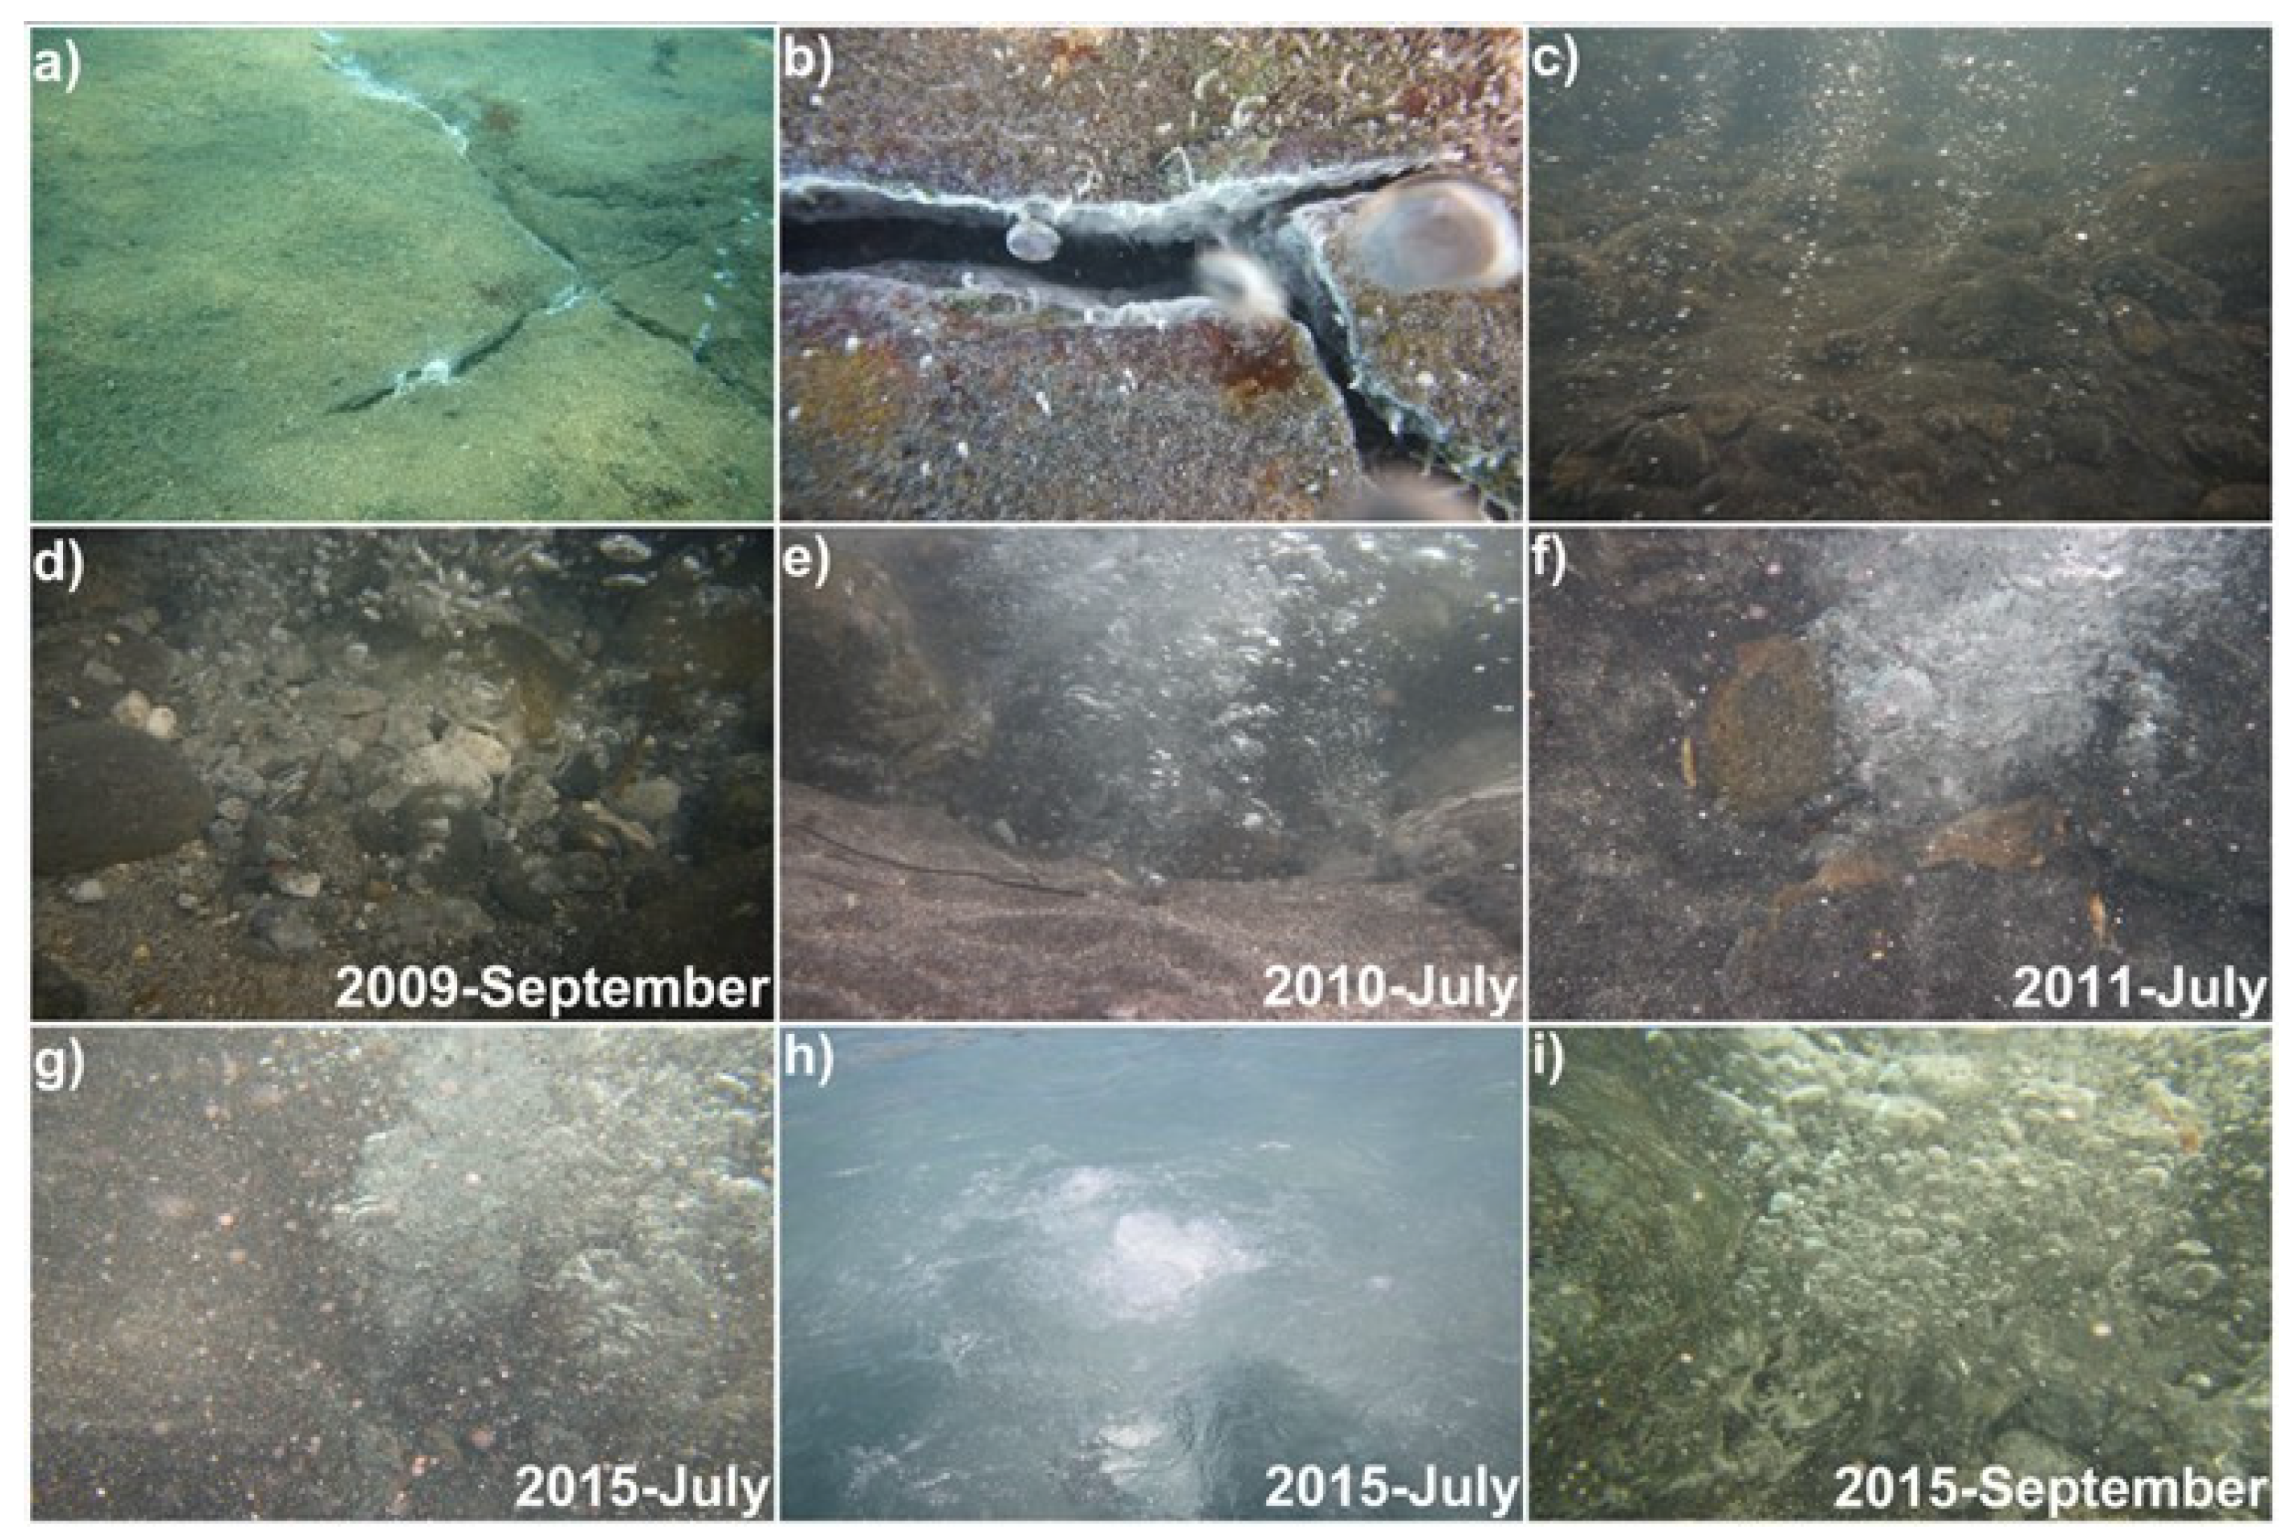
The sequence of underwater photos (
Figure 7) taken close to the shoreline of Baia di Levante, under very calm weather conditions, depicts the general character and the time variations of the bubbling gas release, with particular reference to the main vent P1 (
Figure 1). Gas bubbling occurs from the fracture network, somewhere masked by a thin sandy deposit. The sequence of pictures from
Figure 7d–g gives a qualitative evidence of flux variations that affected the main vent P1 from 2009 to 2015.
The pictures suggest a progressively increasing gas bubbling, whose energy caused the suspension of progressively increasing amounts of sediments, including sand and small gravels, which in 2015 completely masked the vision of the vent. The image of gas bubbles erupting from the sea bottom (i) remarks the presence of a restricted are where the seawater is strongly contaminated by hydrothermal gases (mainly carbon dioxide), which escape from the sea surface, locally altering the air composition.
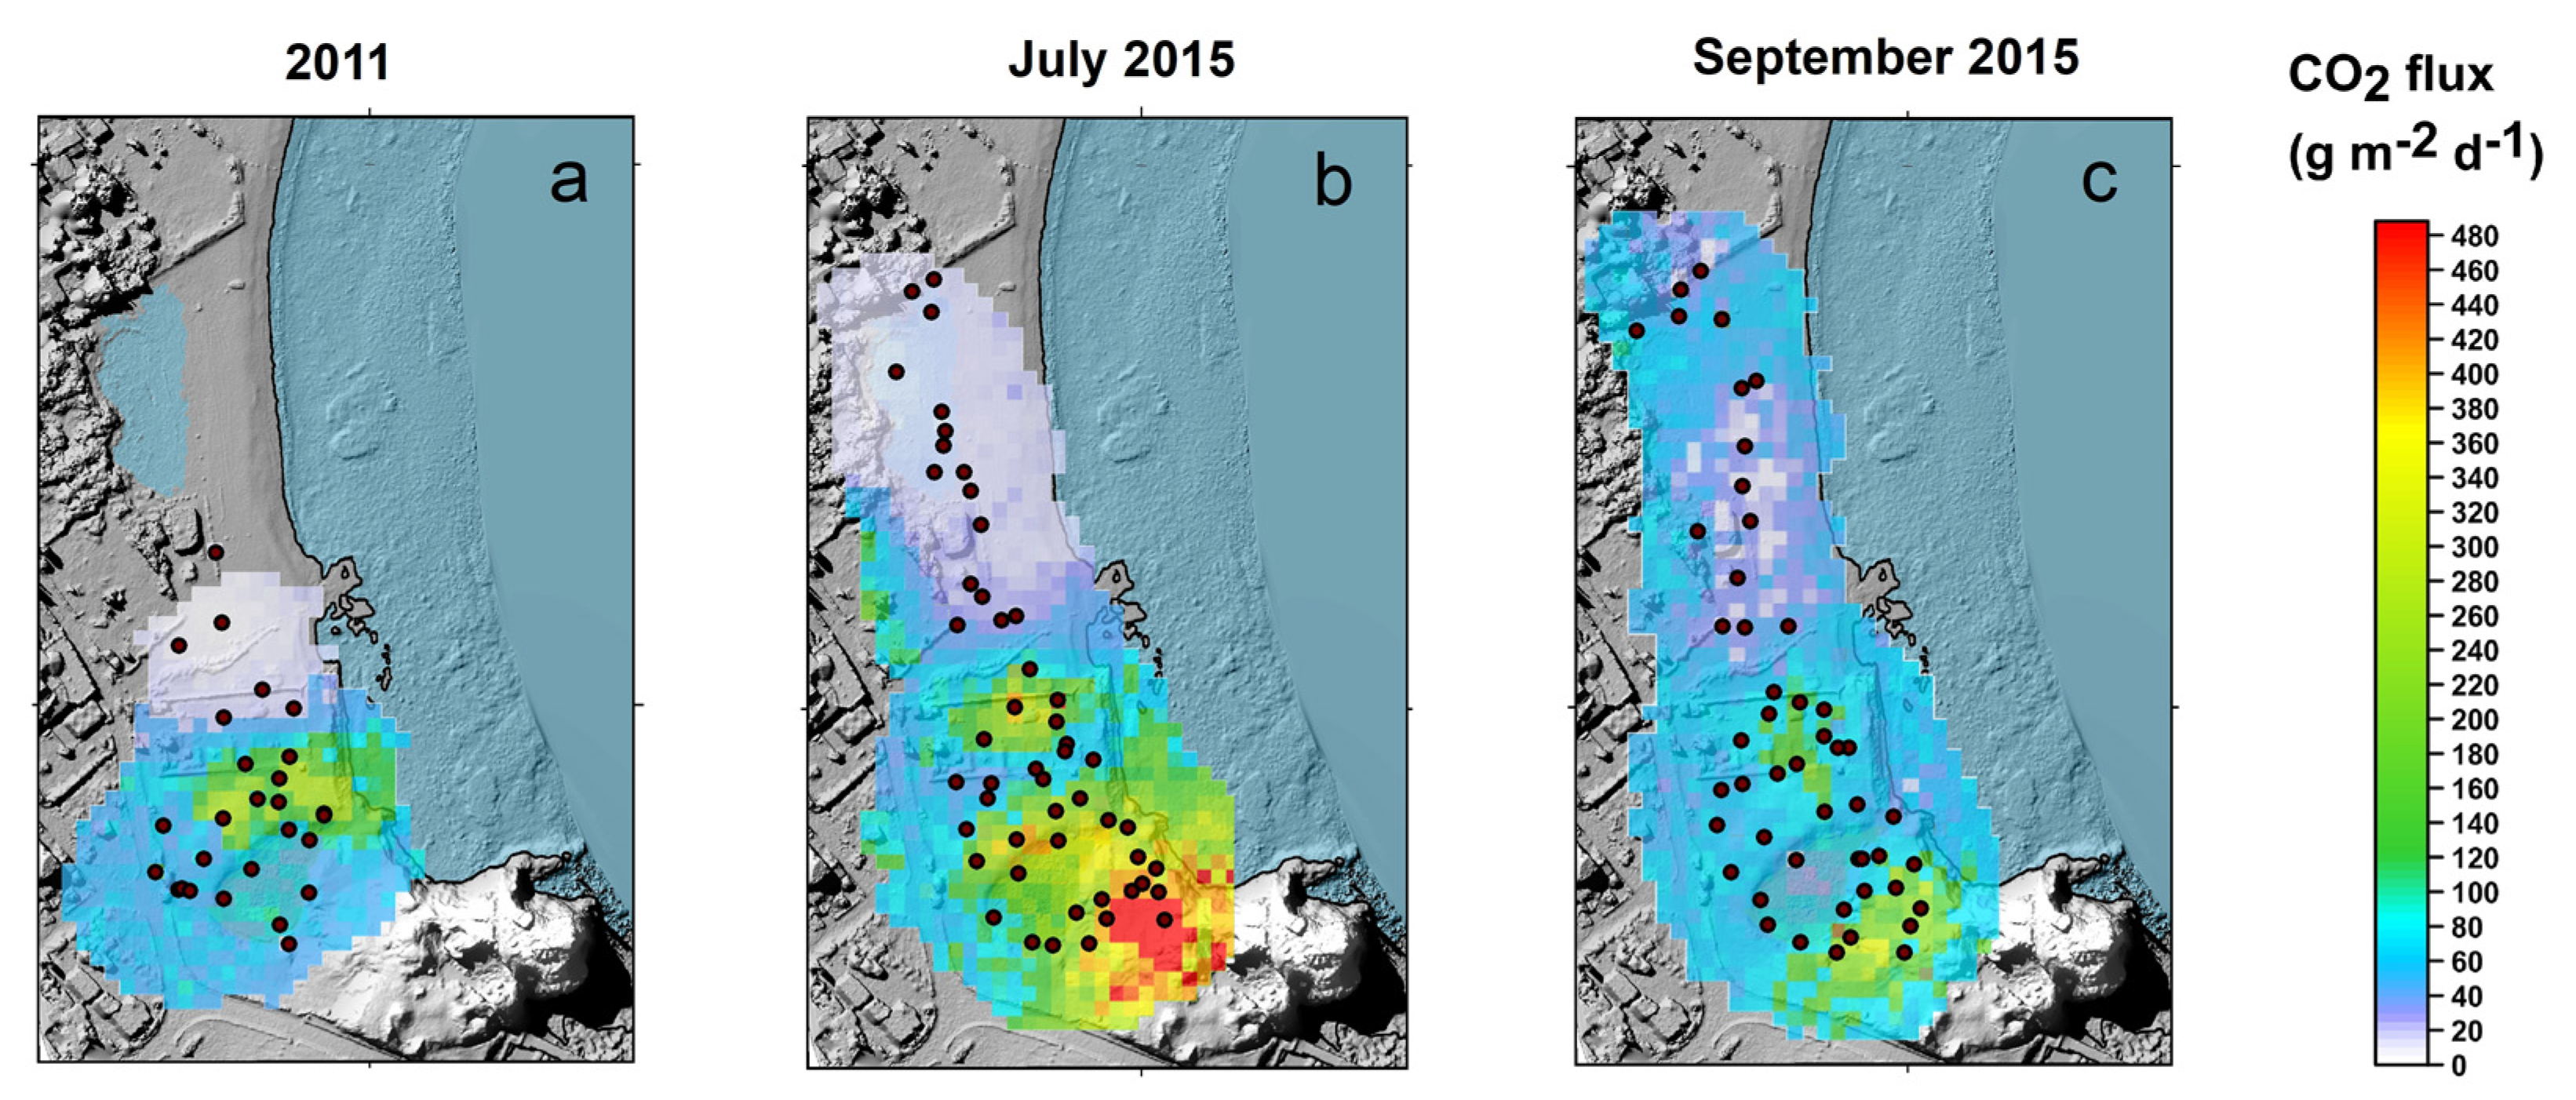
5.5. Diffuse Soil CO2 Fluxes
Results of the field surveys carried out in May 2011 and July and September 2015 are summarized in
Table 2 and are presented as contour maps in
Figure 8. The following
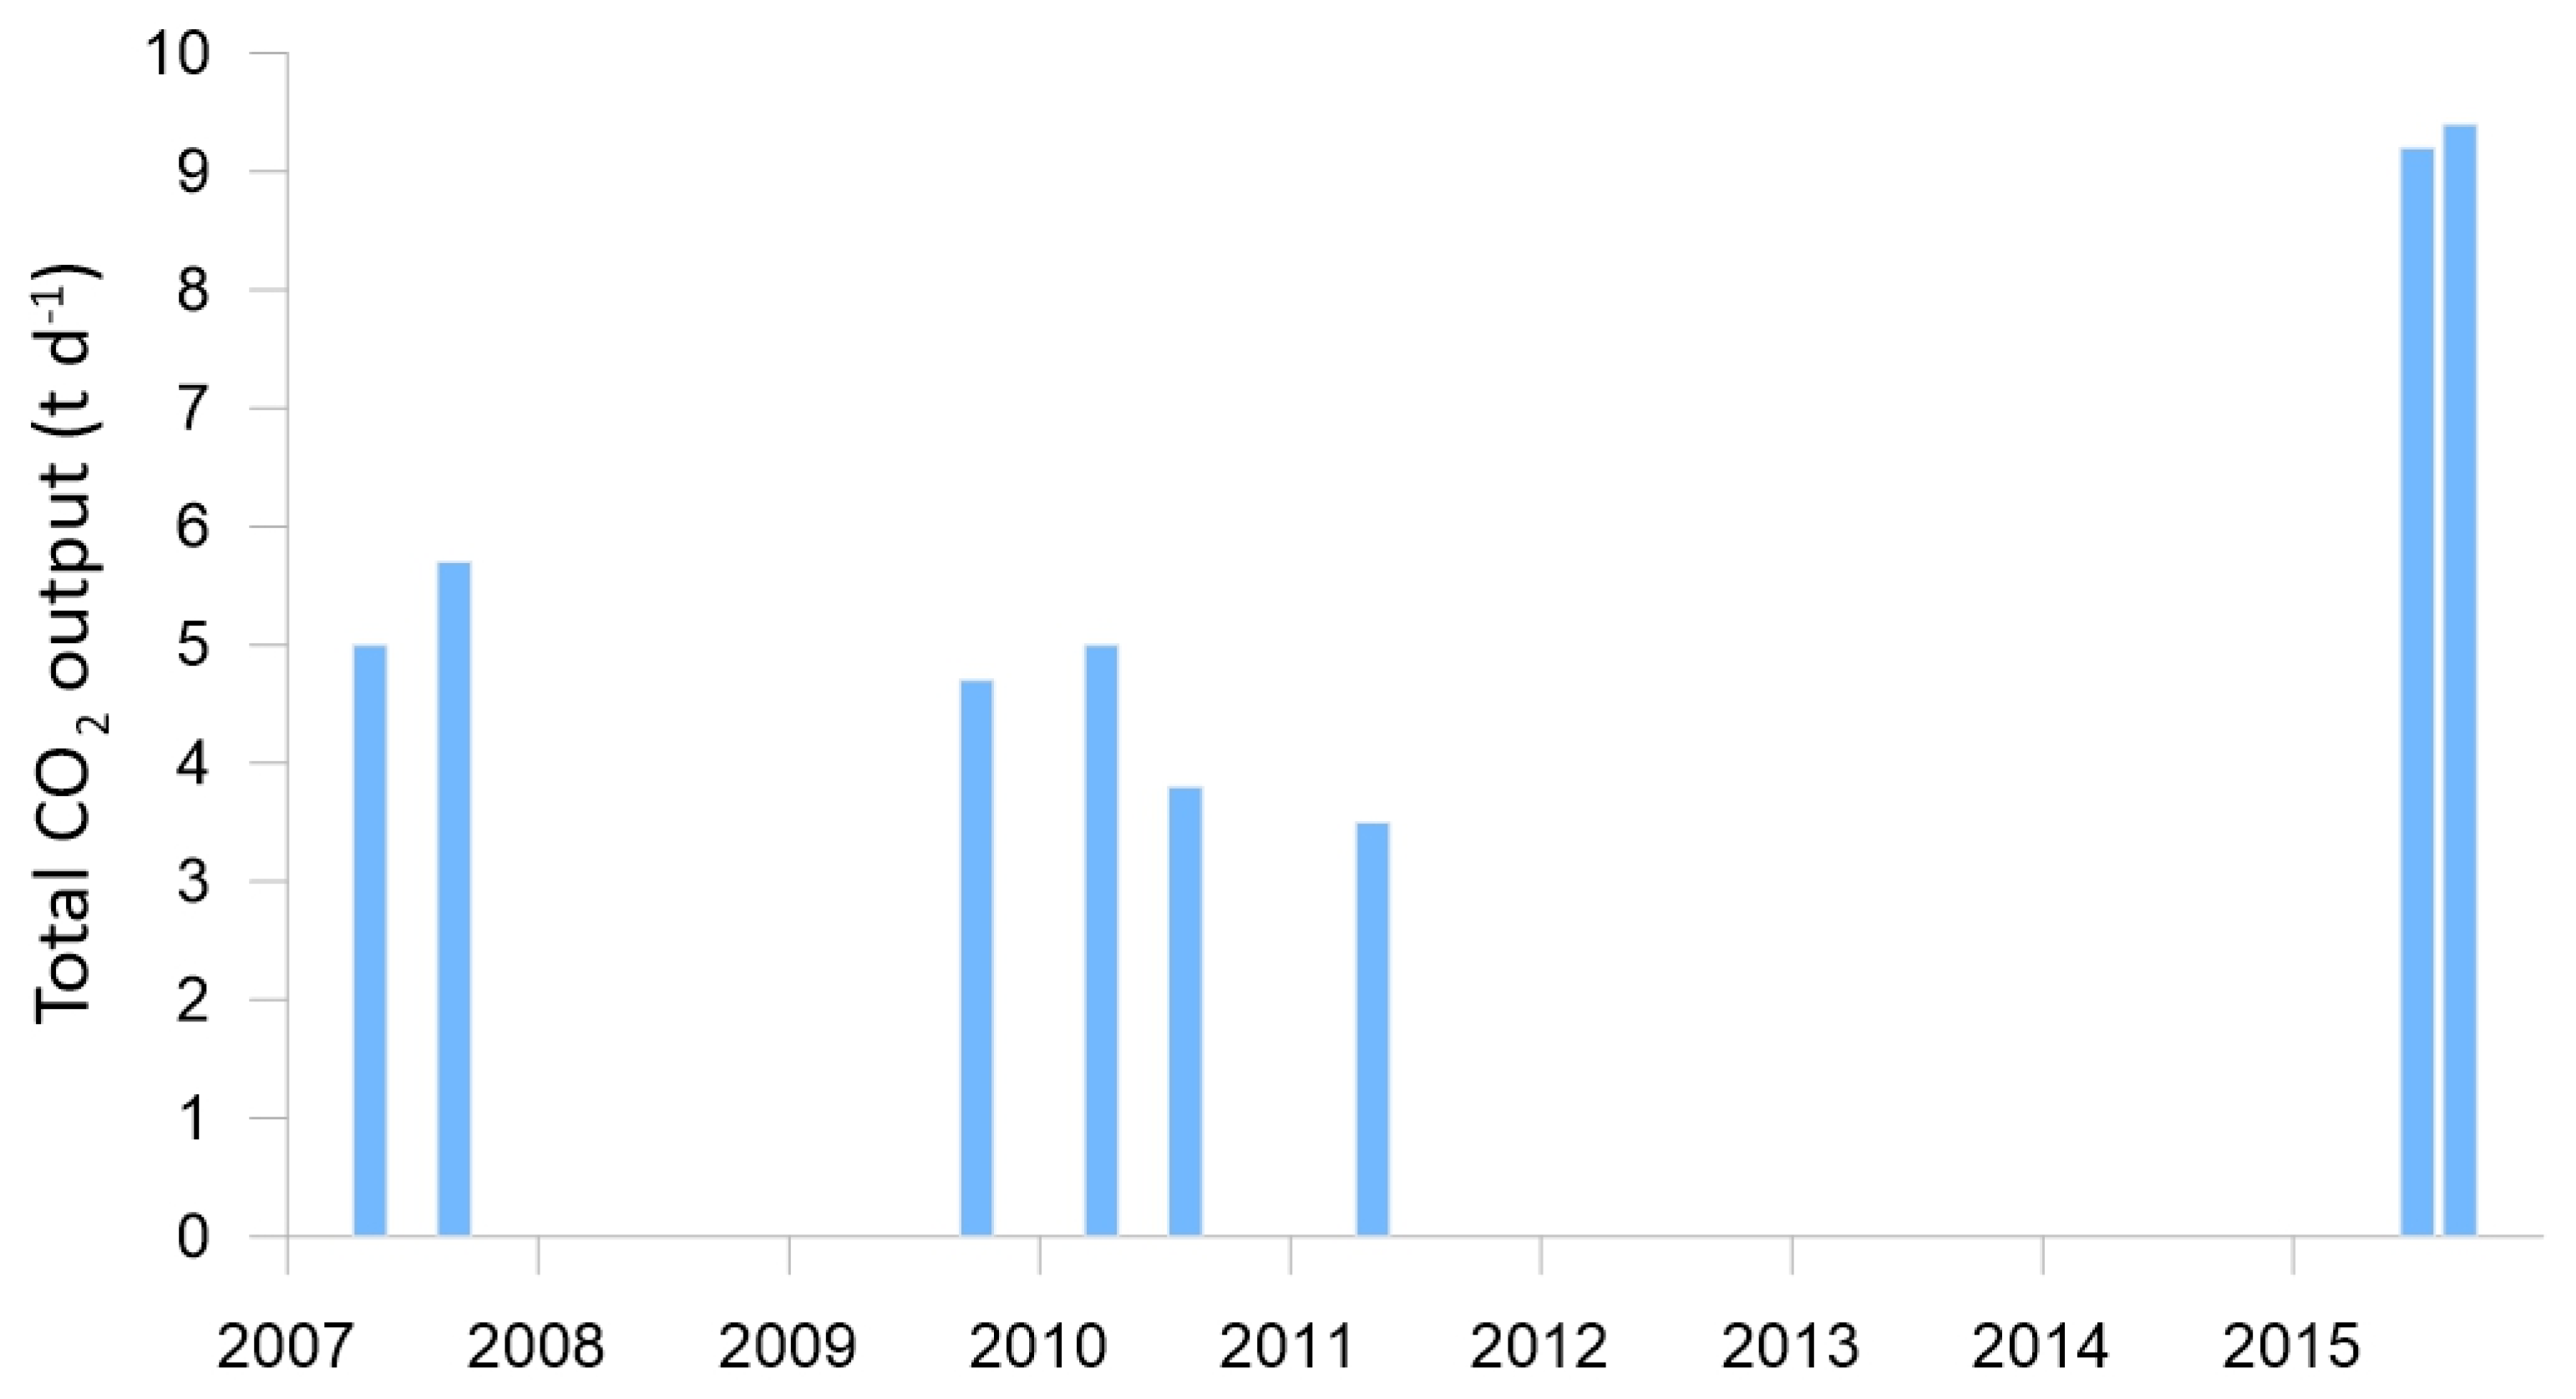
Figure 9 reports the total CO
2 outputs from the study area, estimated from these surveys, compared with previous data from literature [
9,
31]. It is worth nothing that the survey of May 2011 covered a surface smaller than those investigated in 2015, which included the northernmost sector of the beach, making the normalization to the area of the total output estimations necessary for retrieving comparable values (
Table 2 and
Figure 8).
The spatial distribution of the anomalies exhibits a feature common to all the surveys: higher fluxes in the southern sector, close to the old eruptive center of “Il Faraglione” and characterized by the highest soil temperature and hot water discharge to the sea (see
Section 5.1 and
Section 5.2). Time variations, illustrated in
Figure 9, highlight a strong increase in the total CO
2 output from the BdL area in 2015, when it reached values above 9 t d
−1, substantially higher than those detected during all the previous campaigns, in the period 2007–2011, when they ranged from 3.5 to 5.7 t d
−1. The lowest total output was recorded in May 2011, when bubbling gases were characterized by the highest air contamination (
Table 1) and the lowest H
2S/CO
2 ratio (
Figure 6), indicating a phase of minor deep volatiles contribution.
6. Discussion
The comparison among soil temperatures (
Figure 3) and the thermal images (
Figure 4A–C) and the maps of CO
2 diffuse emissions (
Figure 8) discriminates between high-temperature surfaces, associated with high CO
2 flux around the fumaroles, a widespread region with intermediate temperatures and low diffuse gas emissions, and background areas where the water-saturated layer reaches the surface, with ground temperatures <28 °C and no diffuse gas emissions.
The main discharge of heated groundwater toward the sea (
Figure 4) is mainly concentrated in the southernmost sector of Baia di Levante, close to the old eruptive center of the Faraglione [
19]. On the seaboard, (
Figure 4B,C) thermal anomalies (apparent ground temperature over 35 °C) are about 500–550 m
2 wide in sector A, and about 70–80 m
2 wide in sector B. On the seaside, the thermally anomalous surface (apparent temperature 10 °C higher than the average undisturbed sea temperature) resulted in about 4000–4500 m
2 width (
Figure 4C).
Consistent amounts of gas are constantly released into the atmosphere during the solfataric activity, both through fumaroles associated with thermal anomalies and via diffuse soil gas emissions. The diffuse soil carbon dioxide emissions mapped by our surveys (
Figure 8,
Table 2) showed significant increases in 2015 (around 9 t/d
−1) with respect to previous measurements (around 2–5 t/d
−1) (
Figure 9).
The main hazard associated with gas emission is related to the undersea vents. These release hydrothermal gas mixtures that are dominated in CO
2. They are also rich in H
2S (
Figure 1 and
Figure 7,
Table 1), of which atmospheric concentrations over the vents can reach unhealthy values (
Figure 5).
Since carbon dioxide and hydrogen sulfide are among the most harmful gas compounds for humans, their effects on human health must be primarily considered when evaluating the gas hazard at Baia di Levante. Breathing air with elevated concentrations of CO
2 and H
2S causes an increase of blood acidity, triggering adverse effects on the respiratory, cardiovascular, and central nervous systems [
32,
52]. The diffuse gas emission of CO
2 from the ground showed wide ranges of values in the investigated area. Health hazards related to CO
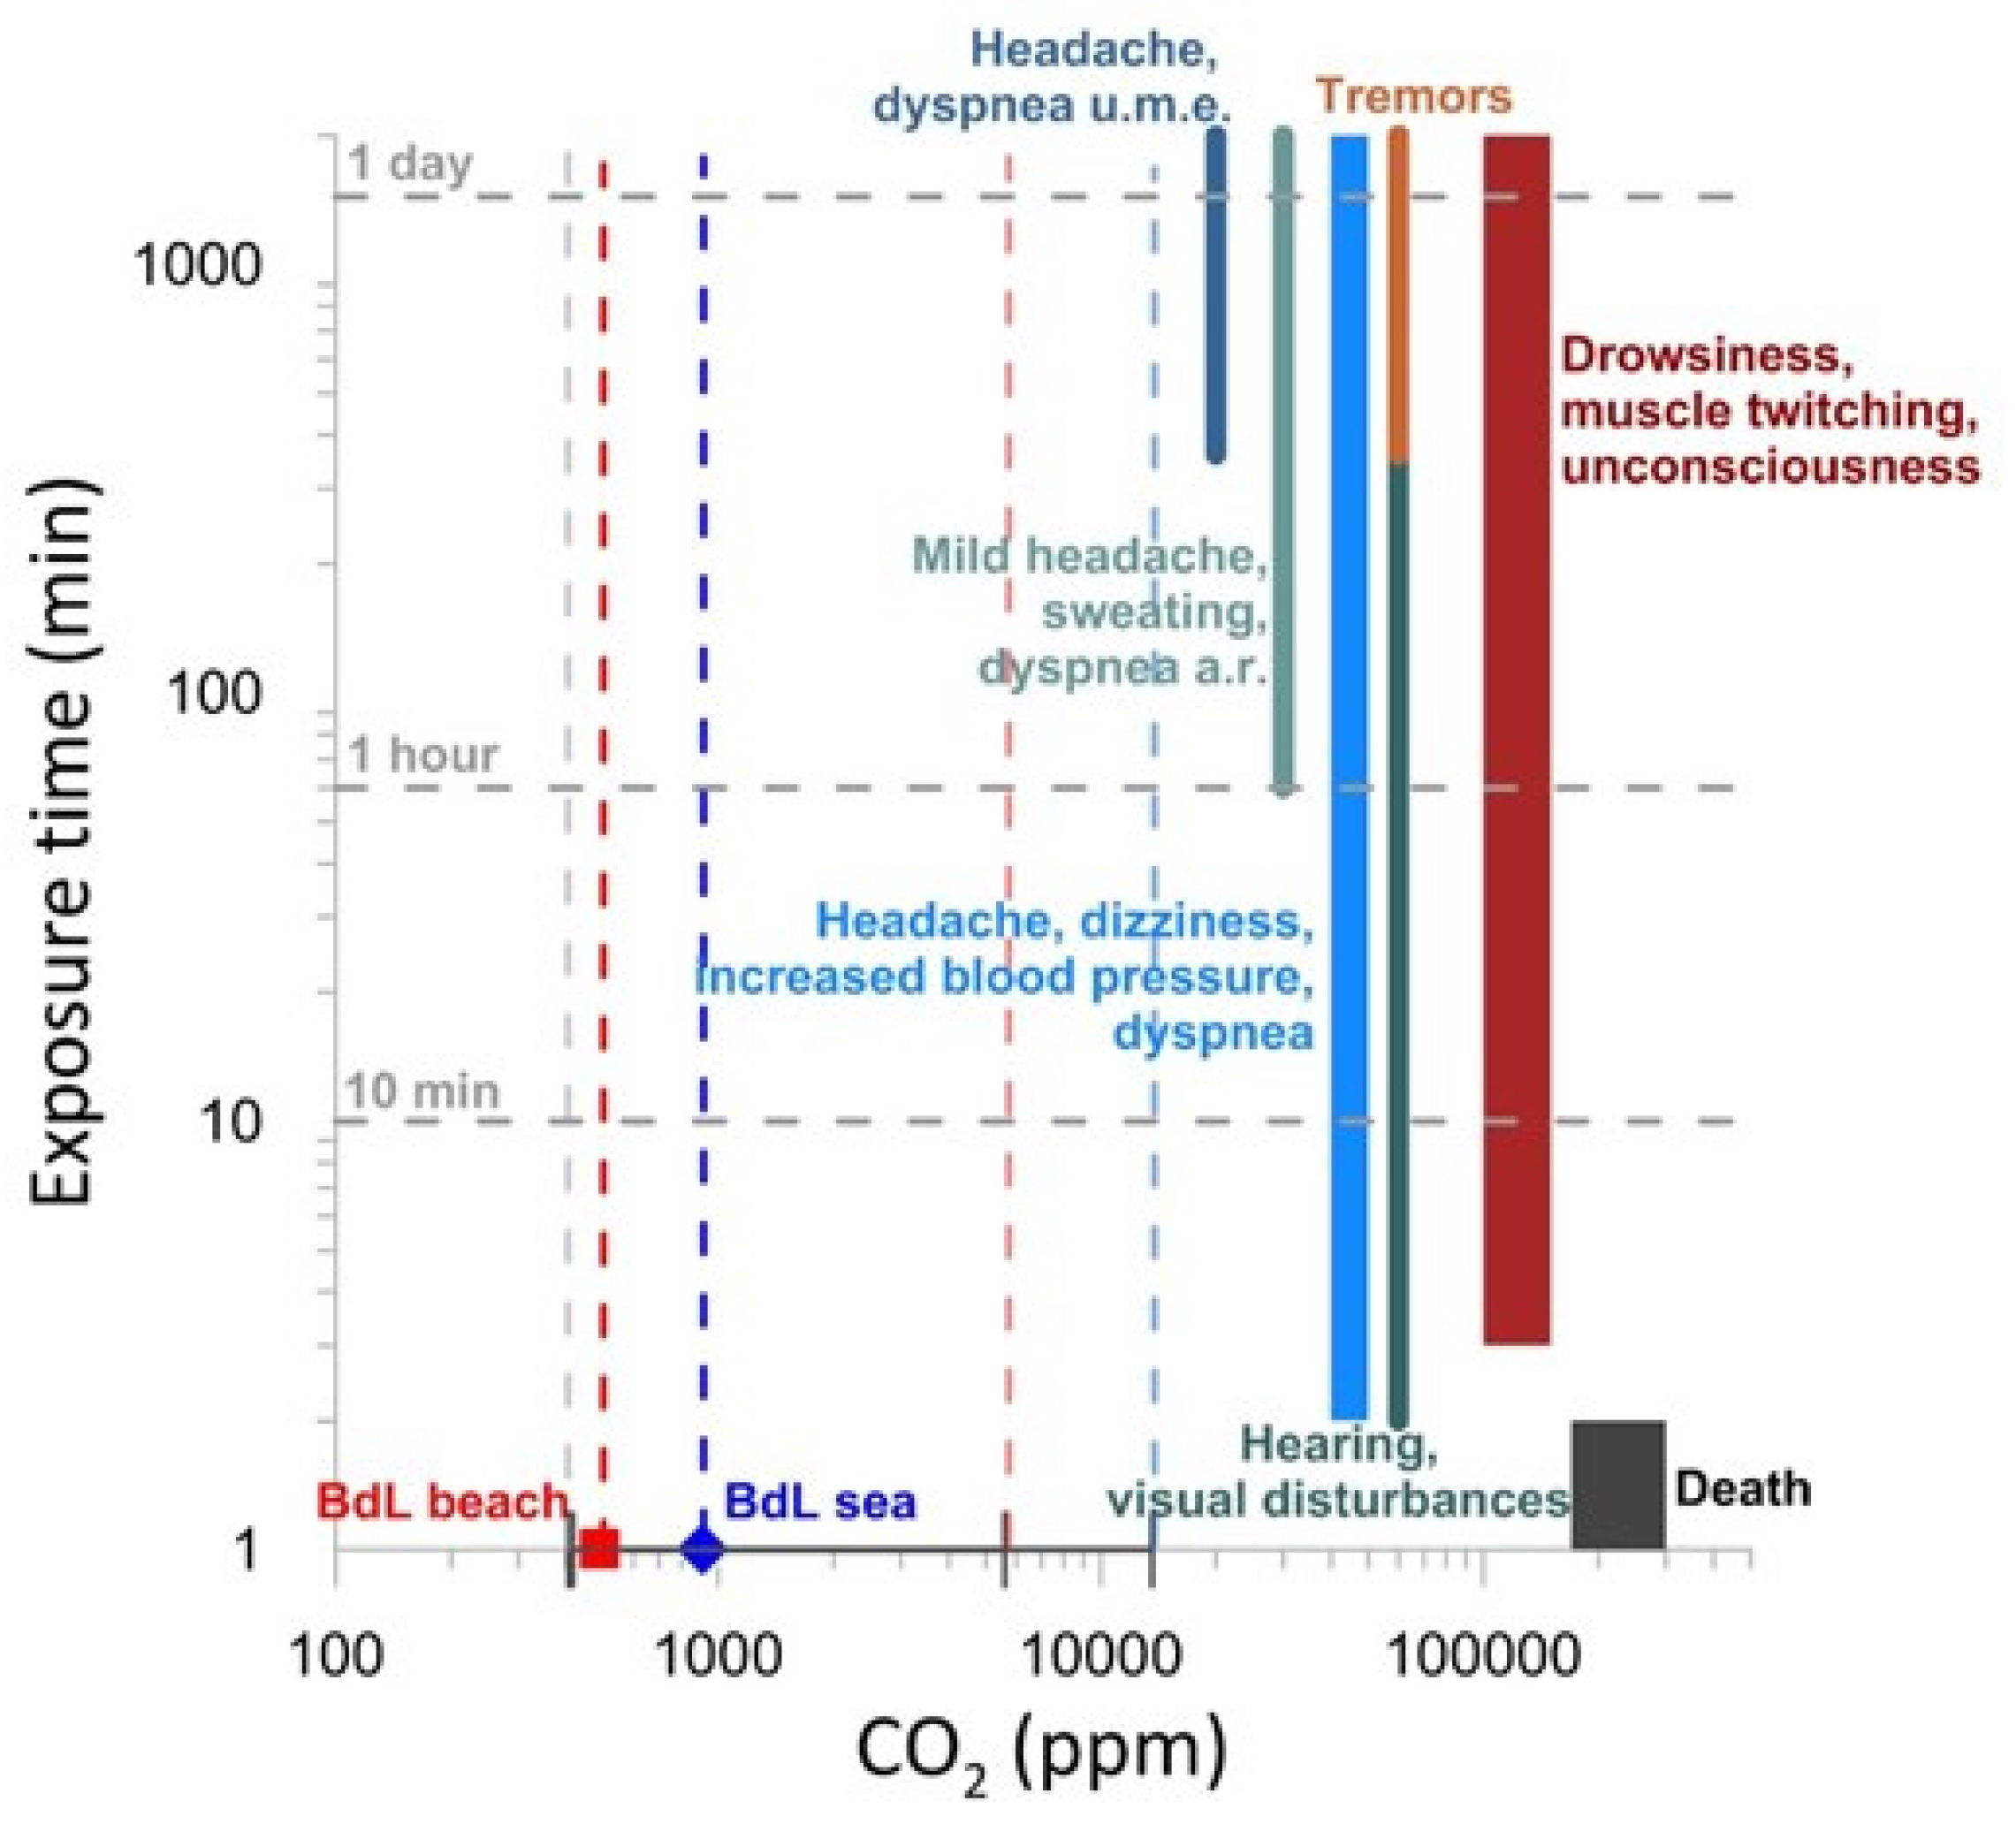
2 exposure may occur, mostly in the sandy beach where tourists have long sunbaths laying on the sand with their mouths and noses very close to the ground and where CO
2 can accumulate under absence of wind. Depending on the CO
2 concentration inhaled and related exposure times (
Figure 10), toxicological symptoms range from headaches (3% CO
2 for 1 h), increased respiratory and heart rates, dizziness, muscle twitching, confusion, unconsciousness, and finally coma (concentrations > 15% for 1 min) and death (concentrations exceeding 50%) [
32,
52,
69].
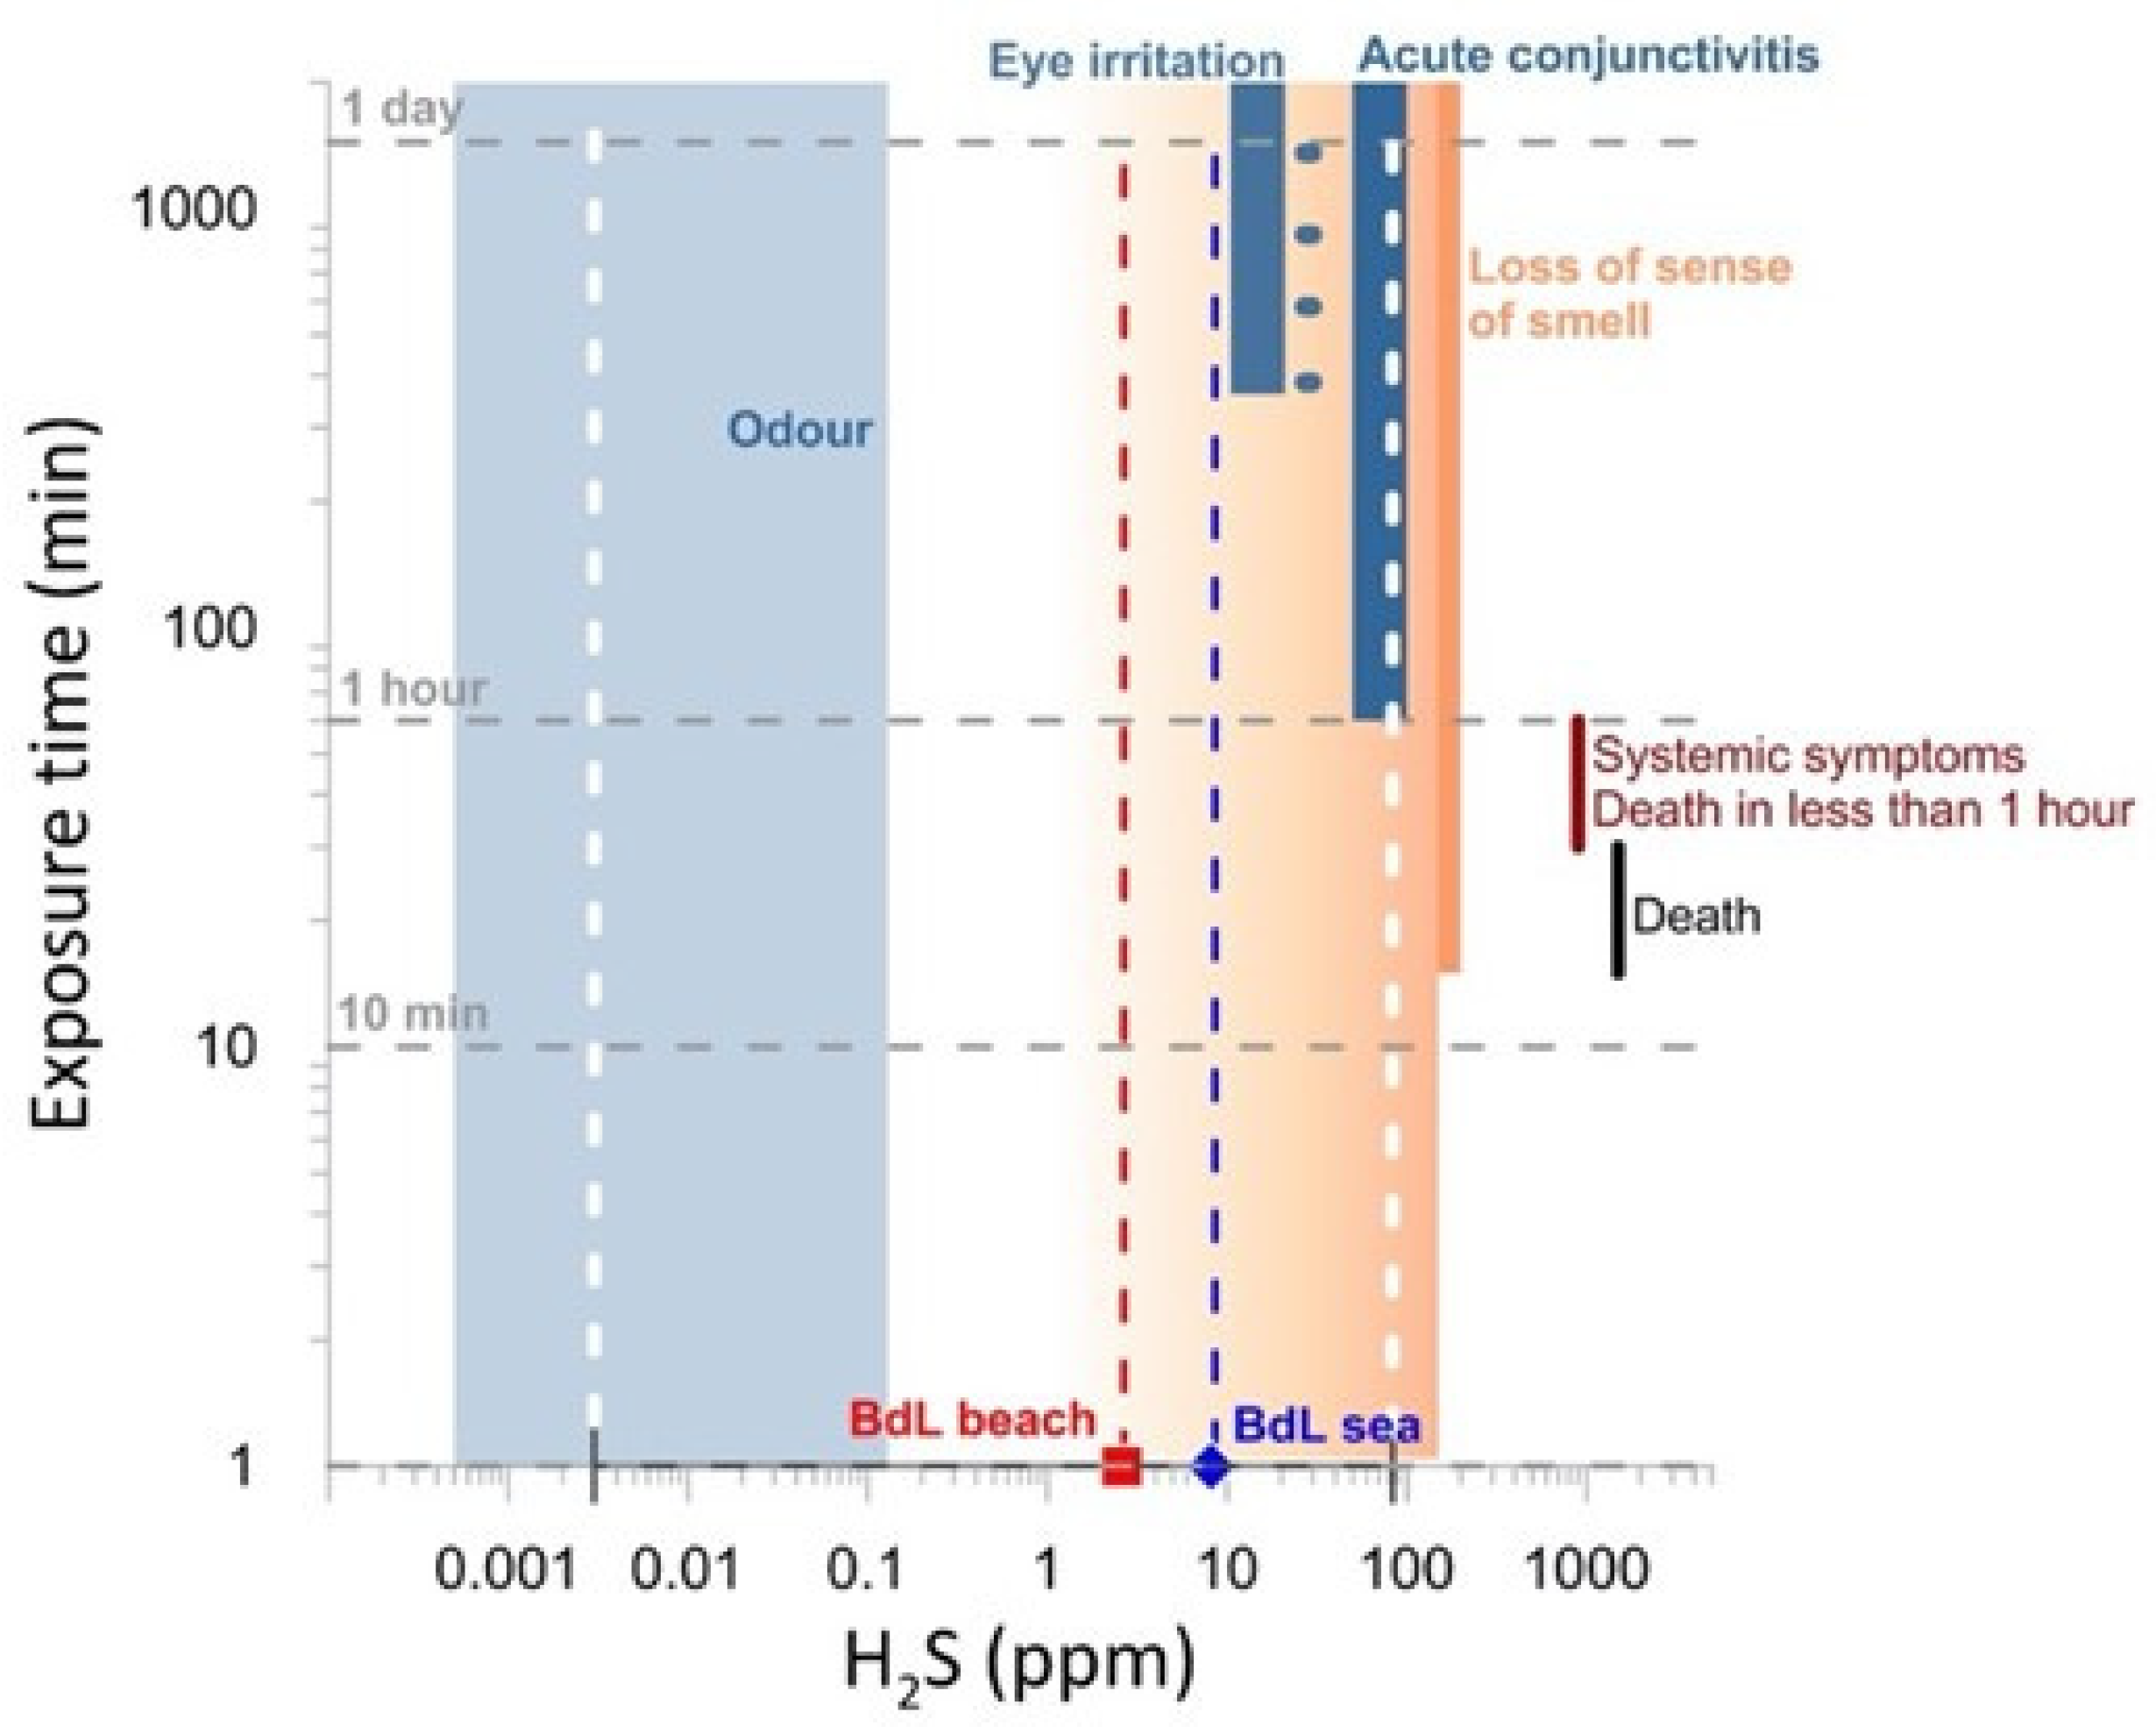
Sulphur species are another group of harmful components of the solfataric activity. The oxidation state of sulfur changes, depending on the thermodynamic condition of the system. An exposure time up to several hours to the highest value of H
2S (
Figure 11) would produce keratoconjunctivitis and pulmonary edema, while the intermittent exposures to concentrations of 70–140 mg m
−3 could cause largely subjective effects, from lingering manifestations to chronic intoxication. Various studies have associated exposure to hydrogen sulfide in concentrations as low as 16–32 mg m
−3 (10.5–21.0 ppm) for several hours with eye irritation [
12].
Figure 10 and
Figure 11 clearly show the gas hazard in context of health, and that H
2S levels are probably more of a concern than CO
2; despite emissions being dominated by CO
2, the H
2S becomes a toxic health concern at lower levels. This is worth emphasizing the different impacts of CO
2 and H
2S in contrast to their relative emissions.
By comparing the new geochemical data with previous surveys and considering the general information from the INGV monitoring program, we exclude the renewal of volcanic activity as a possible source for the observed anomalies in the Baia di Levante area. The most reliable cause for the gas flow anomalies could be referred to as a rearrangement of the local shallow permeability, possibly driven by crustal stress variations, also linked to the differential subsidence rate acting between Vulcano and Lipari Islands [
5].
However, the possibility that a resumption of volcanic activity could influence the degassing of this peripheral area cannot be totally excluded. Indeed, relationships between the peripheral and summit degassing of a volcano are well known and documented in various volcanic areas [
70,
71,
72], and the increase of volatiles degassing could be revealing an awakening of the volcanic activity in the near future.
7. Conclusions
The results of this study focus on minor space and time changes, in the activity state of an active volcanic system, that have been highlighted by repeated multiparameter surveys on the same area. Those space and time changes can foster severe gas hazard conditions in the close proximity of degassing vents, leading to significant risk levels if these features are located inside crowded areas.
The increase of hydrothermal volatile release to the atmosphere, evaluated at Baia di Levante (Vulcano Island) in 2015, during a phase of passive degassing, showed that critical concentrations of gases are achieved in open air, with possible harmful effects to human health. The exhaling activity at Baia di Levante has been characterized by CO2-dominated fluids with a few percent of H2S, and the last variation was observed started in 2015.
Although modest variations in the spatial arrangement of hydrothermal vents are negligible for the assessment of a volcanic system activity, they are crucial in terms of risk related to the gas hazard, especially in areas of intense tourism, such as in the Baia di Levante area where thousands of people overcrowd the beach in summer.
The “silent killer” investigated in this study highlighted the danger of several volcanic gases, such as H2S and CO2, in the boiling temperature discharged fluids system. However, these gases are not the only harmful gases that we can find in volcanic fluids, and the changes of thermodynamic conditions in the hydrothermal systems could produce more oxidant conditions allowing other species to be stable, (such as carbon monoxide and sulfur anhydride), representing a danger for human health even at relatively lower content in the air (with respect to CO2 content).
In fact, for example, carbon monoxide is a silent killer which is specifically more insidious than CO2 because the harmful effect on human health is not caused by direct asphyxiation due to lack of oxygen, but by indirect asphyxiation due to the chemical reaction between CO and hemoglobin, which saturates the sites of the oxygen–hemoglobin bond, no longer allowing the introduction of oxygen into the lungs with normal breathing.
Consequently, on volcanic systems with closed conduits, the continuous monitoring of extensive parameters, e.g., bulk CO2 and sulfur fluxes (SO2 and H2S fluxes), CO2 diffuse flux from soils, and the determination of atmospheric gas composition in real time, could help decision-makers in mitigating the volcanic gas hazard.
Moreover, given the close areal association between the thermal anomalies of the ground, the thermal monitoring of the anomalous areas surrounding the main vents could be used to track changes in heat release from the ground correlated to the increase of volatile emanations of hydrothermal origin.
Author Contributions
Conceptualization, I.S.D., S.I. and P.M.; data curation, M.P.J.P., M.P. and A.P.; methodology, M.C., A.L.G., M.P.J.P., P.M., A.M., M.P. and A.P.; validation, A.L.G., A.M. and M.P.; visualization, I.S.D., M.C., A.L.G. and S.I.; writing—original draft, I.S.D., S.I., P.M. and A.P.; writing—review and editing, I.S.D., M.C., S.I. and P.M. All authors have read and agreed to the published version of the manuscript.
Funding
This research was funded by the INGV-DPCN (Italian National Institute of Geophysics and Volcanology-Italian National Department for Civil Protection) volcanic surveillance program of Vulcano Island Ob-Fu 02.5.
Data Availability Statement
Not applicable.
Acknowledgments
The authors wish to thank their colleagues of Geochemical Laboratories of the Istituto Nazionale di Geofisica e Vulcanologia of Palermo for their help in analyzing the collected gas samples.
Conflicts of Interest
The authors declare no conflict of interest.
References
- Arnórsson, S. Geothermal systems in Iceland: Structure and conceptual models—I. High-temperature areas. Geothermics 1995, 24, 564–602. [Google Scholar] [CrossRef]
- Rowland, J.V.; Sibson, R.H. Structural controls on hydrothermal flow in a segmented rift system, Taupo Volcanic Zone, New Zealand. Geofluids 2004, 4, 259–283. [Google Scholar] [CrossRef]
- Caliro, S.; Chiodini, G.; Galluzzo, D.; Granieri, D.; La Rocca, M.; Saccorotti, G.; Ventura, G. Recent activity of Nisyros volcano (Greece) inferred from structural, geochemical and seismological data. Bull. Volcanol. 2005, 67, 358–369. [Google Scholar] [CrossRef]
- Fridriksson, T.; Kristjánsson, B.R.; Ármannsson, H.; Margrétardóttir, E.; Ólafsdóttir, S.; Chiodini, G. CO2 emissions and heat flow through soil, fumaroles, and steam heated mud pools at the Reykjanes geothermal area, SW Iceland. Appl. Geochem. 2006, 21, 1551–1569. [Google Scholar] [CrossRef]
- Madonia, P.; Cusano, P.; Diliberto, I.S.; Cangemi, M. Thermal anomalies in fumaroles at Vulcano island (Italy) and their relationship with seismic activity. Phys. Chem. Earth 2013, 63, 160–169. [Google Scholar] [CrossRef]
- Hutchison, W.; Mather, T.A.; Pule, D.M.; Biggs, J.; Yirgu, G. Structural controls on fluid pathways in an active rift system: A case study of the Aluto volcanic complex. Geosphere 2015, 11, 542–562. [Google Scholar] [CrossRef] [Green Version]
- Madonia, P.; Cangemi, M.; Olivares, L.; Olivieri, Y.; Speziale, S.; Tommasi, P. Shallow landslide generation at La Fossa cone, Vulcano island (Italy): A multidisciplinary perspective. Landslides 2019, 16, 921–935. [Google Scholar] [CrossRef]
- Chiodini, G.; Cioni, R.; Guidi, M.; Marini, L.; Panichi, C.; Raco, B.; Taddeucci, G. Geochemical surveillance at Vulcano island from 1993 to 1995. Acta Vulcanol. 1996, 8, 193–197. [Google Scholar]
- Carapezza, M.L.; Barberi, F.; Ranaldi, M.; Ricci, T.; Tarchini, L.; Barrancos, J.; Fischer, C.; Perez, N.; Weber, K.; Di Piazza, A.; et al. Diffuse CO2 soil degassing and CO2 and H2S soil concentrations in air and related hazards at Vulcano Island (Aeolian arc, Italy). J. Volcanol. Geotherm. Res. 2011, 207, 130–144. [Google Scholar] [CrossRef]
- Kling, G.W.; Clark, M.A.; Wagner, G.N.; Compton, H.R.; Humphrey, A.M.; Devine, J.D.; Evans, W.C.; Lockwood, J.P.; Tuttle, C.L.; Koenigsberg, E.J. The 1986 lake nyos gas disaster in cameroon, west Africa. Science 1987, 236, 169–175. [Google Scholar] [CrossRef] [Green Version]
- Edmonds, M.; Grattan, J.; Michnowicz, S. Volcanic Gases: Silent Killers. In Observing the Volcano World; Fearnley, C.J., Bird, D.K., Haynes, K., McGuire, W.J., Jolly, G., Eds.; Springer: Cham, Switzerland, 2015. [Google Scholar] [CrossRef] [Green Version]
- World Health Organization (WHO). Hydrogen Sulfide: Human Health Aspect, Concise International Chemical Assessment Document; WHO: Geneva, Switzerland, 2003; pp. 35–53. Available online: https://www.who.int/ipcs/publications/cicad/en/cicad53.pdf. (accessed on 30 November 2015).
- World Health Organization (WHO). Air Quality Guidelines for Europe, 2nd ed.; Regional Office for Europe Copenhagen, WHO Regional Office for Europe: København, Denmark, 2000; Available online: https://apps.who.int/iris/handle/10665/107335 (accessed on 30 November 2015).
- Baubron, J.C.; Allard, P.; Toutain, J.P. Diffuse volcanic emissions of carbon dioxide from Vulcano Island, Italy. Nature 1990, 344, 51–53. [Google Scholar] [CrossRef]
- Badalamenti, B.; Chiodini, G.; Cioni, R.; Favara, R.; Francofonte, S.; Gurrieri, S.; Hauser, S.; Inguaggiato, S.; Italiano, F.; Magro, G.; et al. Special field workshop at Vulcano (Aeolian Islands) during summer 1988: Geochemical results. Acta Vulcanol. 1991, 1, 223–227. [Google Scholar]
- Argnani, A.; Serpelloni, E.; Bonazzi, C. Pattern of deformation around the central Aeolian Islands: Evidence from multichannel seismics and GPS data. Terra. Nova 2007, 19, 317–323. [Google Scholar] [CrossRef]
- Mattia, M.; Palano, M.; Bruno, V.; Cannavò, F.; Bonaccorso, A.; Gresta, S. Tectonic features of the Lipari–Vulcano complex (Aeolian Archipelago, Italy) from 10 years (1996–2006) of GPS data. Terra. Nova 2008, 20, 370–377. [Google Scholar] [CrossRef]
- Keller, J. The Island of Vulcano. In The Aeolian Islands: An Active Volcanic Arc in the Mediterranean Sea; Villari, L., Ed.; Società Italiana di Mineralogia e Petrologia: Pisa, Italy, 1980; pp. 29–74. [Google Scholar]
- De Astis, G.; Dellino, P.; La Volpe, L.; Lucchi, F.; Tranne, C.A. GeologicalMap of the Island of Vulcano (Aeolian Island), Scale 1:10,000; Printed by LAC (Litografia Artistica Cartografica); University of Bari, Univeristy of Bologna, and INGV: Firenze, Italy, 2006. [Google Scholar]
- Barberi, F.; Innocenti, F.; Ferrara, G.; Keller, J.; Villari, L. Evolution of Eolian arc volcanism (sothernThyrhenian Sea). Earth Planet. Sci. Lett. 1974, 21, 269–276. [Google Scholar] [CrossRef]
- Barberi, F.; Neri, G.; Valenza, M.; Villari, L. 1987–1990 unrest at Vulcano. Acta Vulcanol. 1991, 1, 95–106. [Google Scholar]
- Mercalli, G.; Silvestri, O. Le eruzioni dell’isola di Vulcano incominciate il 3 Agosto 1888. Ann. Uff. Centr. Meteor. Geodin. X 1888, 10, 1–213. [Google Scholar]
- Silvestri, O.; Mercalli, G. Modo di rappesentarsi e cronologia delle esplosioni di Vulcano cominciate il 3-8-1888. Ann. Uff. Centr. Meteor. Geodin. IV 1891, 10, 120–190. [Google Scholar]
- Diliberto, I.S.; Gurrieri, S.; Valenza, M. Relationships between diffuse CO2 emissions and volcanic activity on the island of Vulcano (Aeolian Islands, Italy) during the period 1984–1994. Bull. Volcanol. 2002, 6, 219–228. [Google Scholar] [CrossRef]
- Inguaggiato, S.; Calderone, L.; Inguaggiato, C.; Mazot, A.; Morici, S.; Vita, F. Long-time variation of soil CO2 fluxes at the summit of Vulcano Island (Italy). Bull. Volcanol. 2012, 74, 1859–1863. [Google Scholar] [CrossRef]
- Montalto, A. Seismic events at Vulcano (Italy) during 1988–1992. J. Volcanol. Geotherm. Res. 1994, 60, 193–206. [Google Scholar] [CrossRef]
- Milluzzo, V.; Cannata, A.; Alparone, S.; Gambino, S.; Hellweg, M.; Montalto, P.; Cammarata, L.; Diliberto, I.S.; Gresta, S.; Liotta, M.; et al. Tornillos at Vulcano: Clues to the dynamics of the hydrothermal system. J. Volcanol. Geotherm. Res. 2010, 198, 377–392. [Google Scholar] [CrossRef]
- Cannata, A.; Diliberto, I.S.; Alparone, S.; Gambino, S.; Gresta, S.; Liotta, M.; Madonia, P.; Milluzzo, V.; Aliotta, M.; Montalto, P. Multiparametric Approach in Investigating Volcano-Hydrothermal Systems: The Case Study of Vulcano (Aeolian Islands, Italy). Pure Appl. Geoph. 2012, 169, 167–182. [Google Scholar] [CrossRef]
- Diliberto, I.S. Time series analysis of high temperature fumaroles monitored on the island of Vulcano (Aeolian Archipelago, italy). J. Volcanol. Geotherm. Res. 2013, 264, 150–163. [Google Scholar] [CrossRef]
- Diliberto, I.S. Long-term monitoring on a closed-conduit volcano: A 25 year long time-series of temperatures recorded at La Fossa cone (Vulcano Island, Italy), ranging from 250 °C to 520 °C. J. Volcanol. Geotherm. Res. 2017, 346, 151–160. [Google Scholar] [CrossRef]
- Inguaggiato, S.; Mazot, A.; Diliberto, I.S.; Inguaggiato, C.; Madonia, P.; Rouwet, D.; Vita, F. Total CO2 output from Vulcano island (Aeolian Islands, Italy). Geochem. Geoph. Geosys. 2012, 13, Q02012. [Google Scholar] [CrossRef]
- Vita, F.; Inguaggiato, S.; Bobrowski, N.; Calderone, L.; Galle, B.; Parello, F. Continuous SO2 flux measurements at Vulcano island, Italy. Ann. Geophys. Italy 2012, 55, 2. [Google Scholar] [CrossRef]
- Paonita, A.; Federico, C.; Bonfanti, P.; Capasso, G.; Inguaggiato, S.; Italiano, F.; Madonia, P.; Pecoraino, G.; Sortino, F. The episodic and abrupt geochemical changes at La Fossa fumaroles (Vulcano Island, Italy) and related constraints on the dynamics, structure, and compositions of the magmatic system. Geochim. Cosmochim. Acta. 2013, 120, 158–178. [Google Scholar] [CrossRef]
- De Fiore, O. I fenomeni eruttivi avvenuti a Vulcano (Isole Eolie). Boll. Soc. Sism. Ital. 1920, 22, 1–19. [Google Scholar]
- Capasso, G.; Favara, R.; Francofonte, S.; Inguaggiato, S. Chemical and isotopic variations in fumarolic discharge and thermal waters at Vulcano Island (Aeolian Island, Italy) during 1996: Evidence of resumed volcanic activity. J. Volcanol. Geotherm. Res. 1999, 88, 167–175. [Google Scholar] [CrossRef]
- Capasso, G.; Federico, C.; Madonia, P.; Paonita, A. Response of the shallow aquifer of the volcano-hydrothermal system during the recent crises at Vulcano Island (Aeolian Archipelago, Italy). J. Volcanol. Geotherm. Res. 2014, 273, 70–80. [Google Scholar] [CrossRef]
- Granieri, D.; Carapezza, M.L.; Chiodini, G.; Avino, R.; Caliro, S.; Ranaldi, M.; Ricci, T.; Tarchini, L. Correlated increase in CO2 fumarolic content and diffuse emission from La Fossa crater (Vulcano, Italy): Evidence of volcanic unrest or increasing gas release from a stationary deep magma body? Geophys. Res. Lett. 2006, 33, L13316. [Google Scholar] [CrossRef]
- Chiodini, G.; Cioni, R.; Marini, L.; Panichi, C. Origin of fumarolic fluids of Vulcano Island, Italy and implications for volcanic surveillance. Bull. Volcanol. 1995, 57, 99–110. [Google Scholar] [CrossRef]
- Capasso, G.; Favara, R.; Inguaggiato, S. Chemical features and isotopic gaseous manifestation on Vulcano Island (Aeolian Island): An interpretative model of fluid circulation. Geochim. Cosmochim. Acta 1997, 61, 3425–3442. [Google Scholar] [CrossRef]
- Paonita, A.; Favara, R.; Nuccio, P.M.; Sortino, F. Genesis of fumarolic emissions as inferred by isotope mass balances: CO2 and water at Vulcano Island, Italy. Geochim. Cosmochim. Acta 2002, 66, 759–772. [Google Scholar] [CrossRef]
- Carapezza, M.; Nuccio, P.M.; Valenza, M. Genesis and evolution of the fumaroles of Vulcano (Aeolian Islands, Italy): A Geochemical Model. Bull. Volcanol. 1981, 44, 547–563. [Google Scholar] [CrossRef]
- Cioni, R.; D’Amore, F. A genetic model for the fumaroles of Vulcano Island (Sicily, Italy). Geothermics 1984, 13, 375–384. [Google Scholar] [CrossRef]
- Capasso, G.; Dongarra, G.; Hauser, S.; Favara, R.; Valenza, M. Isotope composition of rain water, well water and fumarole steam on the island of Vulcano, and their implications for volcanic surveillance. J. Volcanol. Geotherm. Res. 1992, 49, 147–155. [Google Scholar] [CrossRef]
- Panichi, C.; Noto, P. Isotopic and chemical composition of water, steam and gas samples of the natural manifestations of the Island of Vulcano (Aeolian Arc, Italy). Acta Vulcanol. 1992, 2, 297–312. [Google Scholar]
- Bolognesi, L.; D’Amore, F. Isotopic variation of the hydrothermal system on Vulcano Island, Italy. Geochim. Cosmochim. Acta. 1993, 57, 2069–2082. [Google Scholar] [CrossRef]
- Italiano, F.; Nuccio, P.M. Variazione del rapporto isotopico dell’elio nelle fumarole di Vulcano. In Progetto Vulcano: Risultati dell’Attivita di Ricerca 1993–1995; la Volpe, L., Dellino, P., Nuccio, P.M., Privitera, E., Sbrana, A., Eds.; Felici Editore: Pisa, Italy, 1997; pp. 124–127. [Google Scholar]
- Nuccio, P.M.; Paonita, A.; Sortino, F. Geochemical modeling of mixing between magmatic and hydrothermal gases: The case of Vulcano Island (Italy). Earth Planet. Sci. Lett. 1999, 167, 321–333. [Google Scholar] [CrossRef]
- Federico, C.; Capasso, G.; Paonita, A.; Favara, R. Effects of steam-heating processes on a stratified volcanic aquifer: Stable isotopes and dissolved gases in thermal waters of Vulcano Island (Aeolian archipelago). J. Volcanol. Geotherm. Res. 2010, 192, 178–190. [Google Scholar] [CrossRef]
- Oliveri, Y.; Cangemi, M.; Capasso, G.; Saiano, F. Pathways and fate of REE in the shallow hydrothermal aquifer of Vulcano island (Italy). Chem. Geol. 2019, 512, 121–129. [Google Scholar] [CrossRef]
- Madonia, P.; Capasso, G.; Favara, R.; Francofonte, S.; Tommasi, P. Spatial Distribution of Field Physico-Chemical Parameters in the Vulcano Island (Italy) Coastal Aquifer: Volcanological and Hydrogeological Implications. Water 2015, 7, 3206–3224. [Google Scholar] [CrossRef] [Green Version]
- Bonforte, A.; Gugliemino, F. Transpressive strain on the Lipari-Vulcano volcanic complex and dynamics of the “La Fossa” cone (Aeolian Islands, Sicily) revealed by GPS surveys on a dense network. Tectonophysics 2008, 457, 64–70. [Google Scholar] [CrossRef]
- Capaccioni, B.; Tassi, F.; Vaselli, O. Organic and inorganic geochemistry of low temperature gas discharge at the Baia di Levante beach, Vulcano Island, Italy. J. Volcanol. Geotherm Res. 2001, 108, 173–185. [Google Scholar] [CrossRef]
- Chiodini, G.; Cioni, R.; Falsaperla, S.; Montalto, A.; Guidi, M.; Marini, L. Geochemical and seismological investigations at Vulcano (Aeolian Islands) during 1978–1989. J. Geophys. Res. 1992, 97, 11025–11032. [Google Scholar] [CrossRef]
- Clocchiatti, R.; Del Moro, A.; Gioncada, A.; Joron, J.L.; Mosbah, M.; Pinarelli, L.; Sbrana, A. Assessment of a shallow magmatic system: The 1888–1890 eruption, Vulcano Island, Italy. Bull. Volcanol. 1994, 56, 466–486. [Google Scholar] [CrossRef]
- Nuccio, P.M.; Paonita, A. Magmatic degassing of multi-component vapours and assessment of magma depth: Application to Vulcano Island (Italy). Earth Planet. Sci. Lett. 2001, 193, 467–481. [Google Scholar] [CrossRef]
- Boatta, F.; D’Alessandro, W.; Gagliano, A.L.; Liotta, M.; Milazzo, M.; Rodolfo-Metalpa, R.; Hall-Spencer, J.M.; Parello, F. Geochemical survey of Levante Bay, Vulcano Island (Italy), a natural laboratory for the study of ocean acidification. Marine Pollut. Bull. 2013, 73, 485–494. [Google Scholar] [CrossRef] [Green Version]
- Italiano, F.; Nuccio, P.M.; Sommaruga, C. Gas/steam and thermal energy release measured at the gaseous emissions of the Baia di Levante of Vulcano Island, Italy. Acta Vulcanol. 1984, 5, 89–94. [Google Scholar]
- Fonstad, M.A.; Dietrich, J.T.; Courville, B.C.; Jensen, J.; Carbonneau, P.E. Topographic Structure from Motion: A new development in photogrammetric measurement. Earth Surf. Proc. Land. 2013, 38, 421–430. [Google Scholar] [CrossRef] [Green Version]
- Javernicka, L.; Brasington, J.; Caruso, B. Modeling the topography of shallow braided rivers using Structure-from-Motion photogrammetry. Geomorphology 2014, 213, 166–182. [Google Scholar] [CrossRef]
- Agisoft, L.L.C. Agisoft PhotoScan User Manual, Professional Edition; Version 1.2.6; 2016. Available online: http://www.agisoft.com/downloads/installer/ (accessed on 30 November 2015).
- Cappuzzo, S.; Cosenza, P.; Gagliano, A.L.; Diliberto, I.S. Sviluppo di un sistema strumentale per il rilievo speditivo della temperatura su superfici esposte. Rapp. Tec. INGV 2015, 316, 1–26. [Google Scholar]
- Sinclair, A.J. Selection of threshold values in geochemical data using probability graphs. J. Geochem. Explor. 1974, 3, 129–149. [Google Scholar] [CrossRef]
- Deutsch, C.V.; Journel, A.G. GSLIB Geostatistical Software Library and User’s Guide, 2nd ed.; Oxford University Press: New York, NY, USA, 1988. [Google Scholar]
- Cardellini, C.; Chiodini, G.; Frondini, F. Application of stochastic simulation to CO2 flux from soil: Mapping and quantification of gas release. J. Geophys. Res. 2003, 108, 2425. [Google Scholar] [CrossRef]
- Chiodini, G.; Cioni, R.; Guidi, M.; Raco, B.; Marini, L. Soil CO2 flux measurements in volcanic and geothermal areas. Appl. Geochem. 1998, 13, 543–552. [Google Scholar] [CrossRef]
- Aiuppa, A.; Federico, C.; Giudice, G.; Gurrieri, S. Chemical mapping of a fumarolic field: La Fossa Crater, Vulcano Island (Aeolian Islands, Italy). Geophys. Res. Lett. 2005, 32, L13309. [Google Scholar] [CrossRef] [Green Version]
- Pedone, M.; Viveiros, F.; Aiuppa, A.; Giudice, G.; Grassa, F.; Gagliano, A.L.; Francofonte, V.; Ferreira, T. Total (fumarolic + diffuse soil) CO2 output from Furnas volcano. Earth Planets Space 2015, 67, 174. [Google Scholar] [CrossRef] [PubMed] [Green Version]
- Inguaggiato, S.; Diliberto, I.S.; Federico, C.; Paonita, A.; Vita, F. Review of the evolution of geochemical monitoring, networks and methodologies applied to the volcanoes of the Aeolian Arc (Italy). Earth-Sci. Rev. 2017, 176, 241–276. [Google Scholar] [CrossRef]
- Summary of Occupational Risks, Effects, and Standards for CO2. International Volcano Health Hazard News (IVHHN). Gas and Aerosol Guidelines: Carbon Dioxide, 2005. Discussion of Known CO2 Poisoning Events Associated with Volcanology. Available online: http://seis/bris.ac.uk/~glcjh/ivhnn/guidelines/gas/co2.html (accessed on 30 November 2015).
- Inguaggiato, S.; Vita, F.; Cangemi, M.; Inguaggiato, C.; Calderone, L. The Monitoring of CO2 Soil Degassing as Indicator of Increasing Volcanic Activity: The Paroxysmal Activity at Stromboli Volcano in 2019–2021. Geosciences 2021, 11, 169. [Google Scholar] [CrossRef]
- Capasso, G.; Favara, R.; Inguaggiato, S. Interaction between fumarolic gases and thermal groundwaters at Vulcano Island (Italy): Evidences from chemical composition of dissolved gases in waters. J. Volcanol. Geotherm. Res. 2000, 102, 309–318. [Google Scholar] [CrossRef]
- Rizzo, A.L.; Federico, C.; Inguaggiato, S.; Sollami, A.; Tantillo, M.; Vita, F.; Bellomo, S.; Longo, M.; Grassa, F.; Liuzzo, M. The 2014 effusive eruption at Stromboli volcano (Italy): Inferences from soil CO2 flux and 3He/4He ratio in thermal waters. Geoph. Res. Lett. 2015, 42, 2235–2243. [Google Scholar] [CrossRef]
Figure 1.
(a) Map of Vulcano Island (elevation contour interval 100 m) with location of the Baia di Levante area and of the main anomalous soil degassing points. (b) Location of Vulcano Island. (c) Detail of the Baia di Levante area with location of the main undersea hydrothermal vents from P1 to P6.
Figure 2.
Cumulate probability plot of the measurements by Pyrogips in September 2015. The colored arrows indicate the different ranges of temperature related to different heat transfer processes. Cd represents conductive; Cv represents convective.
Figure 2.
Cumulate probability plot of the measurements by Pyrogips in September 2015. The colored arrows indicate the different ranges of temperature related to different heat transfer processes. Cd represents conductive; Cv represents convective.
Figure 3.
Maps of soil temperatures derived from interpolation of the datasets acquired by Pyrogips in (a) July 2014; (b) July 2015; (c) September 2015.
Figure 3.
Maps of soil temperatures derived from interpolation of the datasets acquired by Pyrogips in (a) July 2014; (b) July 2015; (c) September 2015.
Figure 4.
On the left, the Baia Levante beach orthophoto, the letters mark the thermal surveys: (A,B) and (C) photographs and forward-looking infrared radiometer (FLIR) thermal infrared (TIR) images documenting the anomalous thermal areas.
Figure 4.
On the left, the Baia Levante beach orthophoto, the letters mark the thermal surveys: (A,B) and (C) photographs and forward-looking infrared radiometer (FLIR) thermal infrared (TIR) images documenting the anomalous thermal areas.
Figure 5.
Maps derived from the interpolation of the datasets acquired by the Multi-GAS gas analyzer, reporting the atmospheric concentrations of CO2 (a) and H2S (b).
Figure 5.
Maps derived from the interpolation of the datasets acquired by the Multi-GAS gas analyzer, reporting the atmospheric concentrations of CO2 (a) and H2S (b).
Figure 6.
H2S vs. CO2 contents in the fluids of the Baia di Levante area, measured from 1990 to 2015.
Figure 6.
H2S vs. CO2 contents in the fluids of the Baia di Levante area, measured from 1990 to 2015.
Figure 7.
Underwater photos taken in the Baia di Levante, close to the shoreline (water depth 1 m). (a) Low degassing from the fracture network in the southern sector of the bay; (b) example of a degassing fracture with gas bubbles and whitish sulfur floccules around it; (c) degassing from coarse sandy and gravel deposits in the northern sector of the bay; (d–i) degassing from the P1 vent in different years. All the photos were taken from the same shot-point, except (h) which was taken from the surface.
Figure 8.
Maps of CO2 diffuse flux derived from interpolation of the measurements made in the Baia di Levante in different periods: (a) May 2011; (b) July 2015; (c) September 2015.
Figure 8.
Maps of CO2 diffuse flux derived from interpolation of the measurements made in the Baia di Levante in different periods: (a) May 2011; (b) July 2015; (c) September 2015.
Figure 9.
Total output of soil CO
2 (t d
−1) from the Baia di Levante area in the period 2007–15 (2011–15 this study; previous data from literature [
9,
31]).
Figure 9.
Total output of soil CO
2 (t d
−1) from the Baia di Levante area in the period 2007–15 (2011–15 this study; previous data from literature [
9,
31]).
Figure 10.
Atmospheric concentrations of CO
2 on the sea surface and on the beach of Baia di Levante area compared with associated human health risks (reference values available at
https://www.epa.gov/sites/production/files/2015-06/documents/co2appendixb.pdf). Points indicate the average concentrations measured during the surveys. Blue and red vertical dashed lines represent average values for BdL beach and BdL sea, respectively. The grey vertical dashed line represents the minimum measured value for both BdL beach and BdL sea. Light blue and light red vertical dashed lines represent the maximum values measured at BdL sea and BdL beach, respectively. The acronyms u.m.e. and a.r. represent “upon mild exertion” and “at rest”, respectively.
Figure 11.
Atmospheric concentrations of H
2S on the sea surface and on the beach of Baia di Levante area compared with associated human health risks (reference values available at
http://www.inchem.org/documents/ehc/ehc/ehc019.htm). Points indicate the average concentrations measured during the surveys. Blue and red vertical dashed lines represent average values for BdL beach and BdL sea, respectively. White vertical dashed lines represent minimum and maximum values measured both at the BdL beach and BdL sea.
Table 1.
Chemical composition of bubbling gases at Baia di Levante, from references and measured in this study (TS); the letters between brackets in the site field indicate the identifier of the point as in the original text. Values are in ppm for H2, O2, CO, and CH4, and in %vol for N2, CO2, and H2S.
| Site | Date | H2 | O2 | N2 | CO | CH4 | CO2 | H2S | Ref. |
|---|
P1
(Vulcanel. 2) | May 1995 | 774 | 0.0001 | 1 | b.d.l. | 710 | 97.8 | 1.02 | [16] |
P1
(Vulcanel. 2) | November 1995 | 568 | 0.06 | 1 | b.d.l. | 960 | 97.8 | 1.05 | [16] |
| P1 (Vent) | April 2011 | 4 | 0.21 | 1.5 | 0.4 | 1700 | 98.0 | 0.04 | [57] |
| P1 | July 2015 | 321 | 0.02 | 0.76 | 0.5 | 945 | 95.4 | 2.49 | TS |
| P1 | September 2015 | 22 | 0.07 | 0.78 | 0.5 | 1031 | 94.6 | 2.21 | TS |
P2
(Fum. Mare) | May 1995 | 4600 | 0.0001 | 0.6 | b.d.l. | 760 | 96.7 | 2.16 | [16] |
P2
Fum. Mare) | November 1995 | 6600 | 0.0002 | 0.8 | b.d.l. | 550 | 97.7 | 1.51 | [16] |
| P2 | July 2015 | 11,400 | 0.03 | 0.84 | 1.6 | 710 | 93.2 | 3.2 | TS |
| P2 | September 2015 | 13,700 | b.d.l. | 0.86 | 1.4 | 783 | 93.8 | 3.04 | TS |
Mud Pool
(Vasca Ipp.) | May 1995 | 479 | b.d.l. | 0.69 | 0.2 | 2010 | 96.9 | 2.47 | [16] |
Mud Pool
(Vasca Ipp.) | November 1995 | 554 | 5 | 0.66 | 0.15 | 2240 | 97.3 | 1.86 | [16] |
| Mud Pool | September 2015 | 2154 | 1.14 | 7.49 | 1.4 | 606 | 95.1 | 2.54 | TS |
Table 2.
Soil CO2 output in the Baia di Levante Area from field measurements in May 2011, and July and September 2015.
Table 2.
Soil CO2 output in the Baia di Levante Area from field measurements in May 2011, and July and September 2015.
| | Field Parameters and Output Data | May 2011 | July 2015 | September 2015 |
|---|
| Basics statistics | Points (number) | 28 | 51 | 49 |
| Area (m2) | 12,600 | 23,200 | 24,300 |
| Average CO2 flux (g m2 d−1) | 160.8 | 432.0 | 379.8 |
| σ (g m2 d−1) | 27.5 | 19.7 | 17.0 |
| Minimum CO2 flux (g m2 d−1) | 0.7 | 3 | 0 |
| Maximum CO2 flux (g m2 d−1) | 972 | 5782 | 4281 |
| Results from sGs | Total CO2 output from sGs (t d−1) | 1.8 | 8.8 | 9.4 |
| σ (t d−1) | 0.13 | 0.77 | 0.75 |
| Normalized (to area 24,300 m2) total CO2 output (t d−1) | 3.5 | 9.2 | 9.4 |
| Publisher’s Note: MDPI stays neutral with regard to jurisdictional claims in published maps and institutional affiliations. |
© 2021 by the authors. Licensee MDPI, Basel, Switzerland. This article is an open access article distributed under the terms and conditions of the Creative Commons Attribution (CC BY) license (https://creativecommons.org/licenses/by/4.0/).


 ,
, 


