1. Introduction
Back-arc basins are common features associated with subduction zones; they develop behind volcanic arcs as a consequence of extensional stresses in the overriding plates. Rifting of the lithosphere yields to crustal thinning accompanied by normal faulting and, in some cases, can lead to continental breakup, seafloor spreading, and formation of new oceanic basins [
1]. Although the process of seafloor spreading in back-arc basins is similar to that happening at mid-ocean ridges in large oceanic basins, the morphology of back-arc basins is often quite complicated, reflecting the complex regional tectonic history. The relationship between extensional processes in the back-arc and subduction dynamics is key to understanding morphologies, structures, and evolution of back-arc basins [
2]. Significantly, trench velocity and upper-plate stresses, which directly affect the evolution of the basins, are not steady-state features, but can significantly vary within a few millions of years. How changes in trench velocity affect the formation and evolution of back-arc basins is the main focus of this work.
Presently, many back-arc basins are characterised by multiple mid-ocean spreading centres. Classic examples are the Izu–Bonin–Mariana [
3], Tonga-Kermadec [
4], South Sandwich [
5], and Lesser Antilles [
6] intra-oceanic subduction zones (
Figure 1). In the Lau Basin, the back-arc basin of the Tonga subduction zone, new segments of the spreading centre progressively developed along-strike, as rifting and spreading propagated southward [
4]. In most cases, however, multiple spreading centres form across-strike due to ridge jumps that generate new basins progressively younger towards the trench. A variety of processes have been suggested for the occurrence of ridge jumps in back-arc basins, including: collision of a buoyant indenter and consequent slab rotation [
2], interaction between the slab and the upper–lower mantle transition zone [
7], and the energy unbalance between the strength of transform faults bounding the basins and the strength of the overriding plate in narrow subduction zones [
8]. Regardless of the mechanism, it is clear that extensional stresses in back-arc basins are transient [
2]. This is also the case for back-arc basins that initially form in continental settings, as shown in the next paragraphs.
Break-up of continental overriding plate and formation of oceanic back-arc basins has been largely studied in 2D (e.g., [
9,
10,
11]) and 3D numerical models (e.g., [
12,
13,
14,
15,
16]). These models highlighted the role of lateral heterogeneities within the subducting plate on trench migration and on extensional stresses in the overriding plate. In particular, lateral collision of buoyant indenters can cause slab rotation, trench retreat acceleration, and back-arc basin opening. However, lithospheric scale deformation, particularly plastic rheology, is often simplified in these large-scale models because it is computationally challenging to numerically resolve high viscosity contrasts in localised, small regions. In this study, instead, we use 2D models that are able to create fault-like structures typical of rifting environments through plastic (brittle) deformation and brittle strain weakening, which take into account the accumulated stresses and finite strain over time. This allows us to investigate the dynamics and structural evolution of back-arc basins during episodic extension and ridge jumps from continental extension to the formation of new oceanic basins.
Intra-Continental Back-Arc Basins
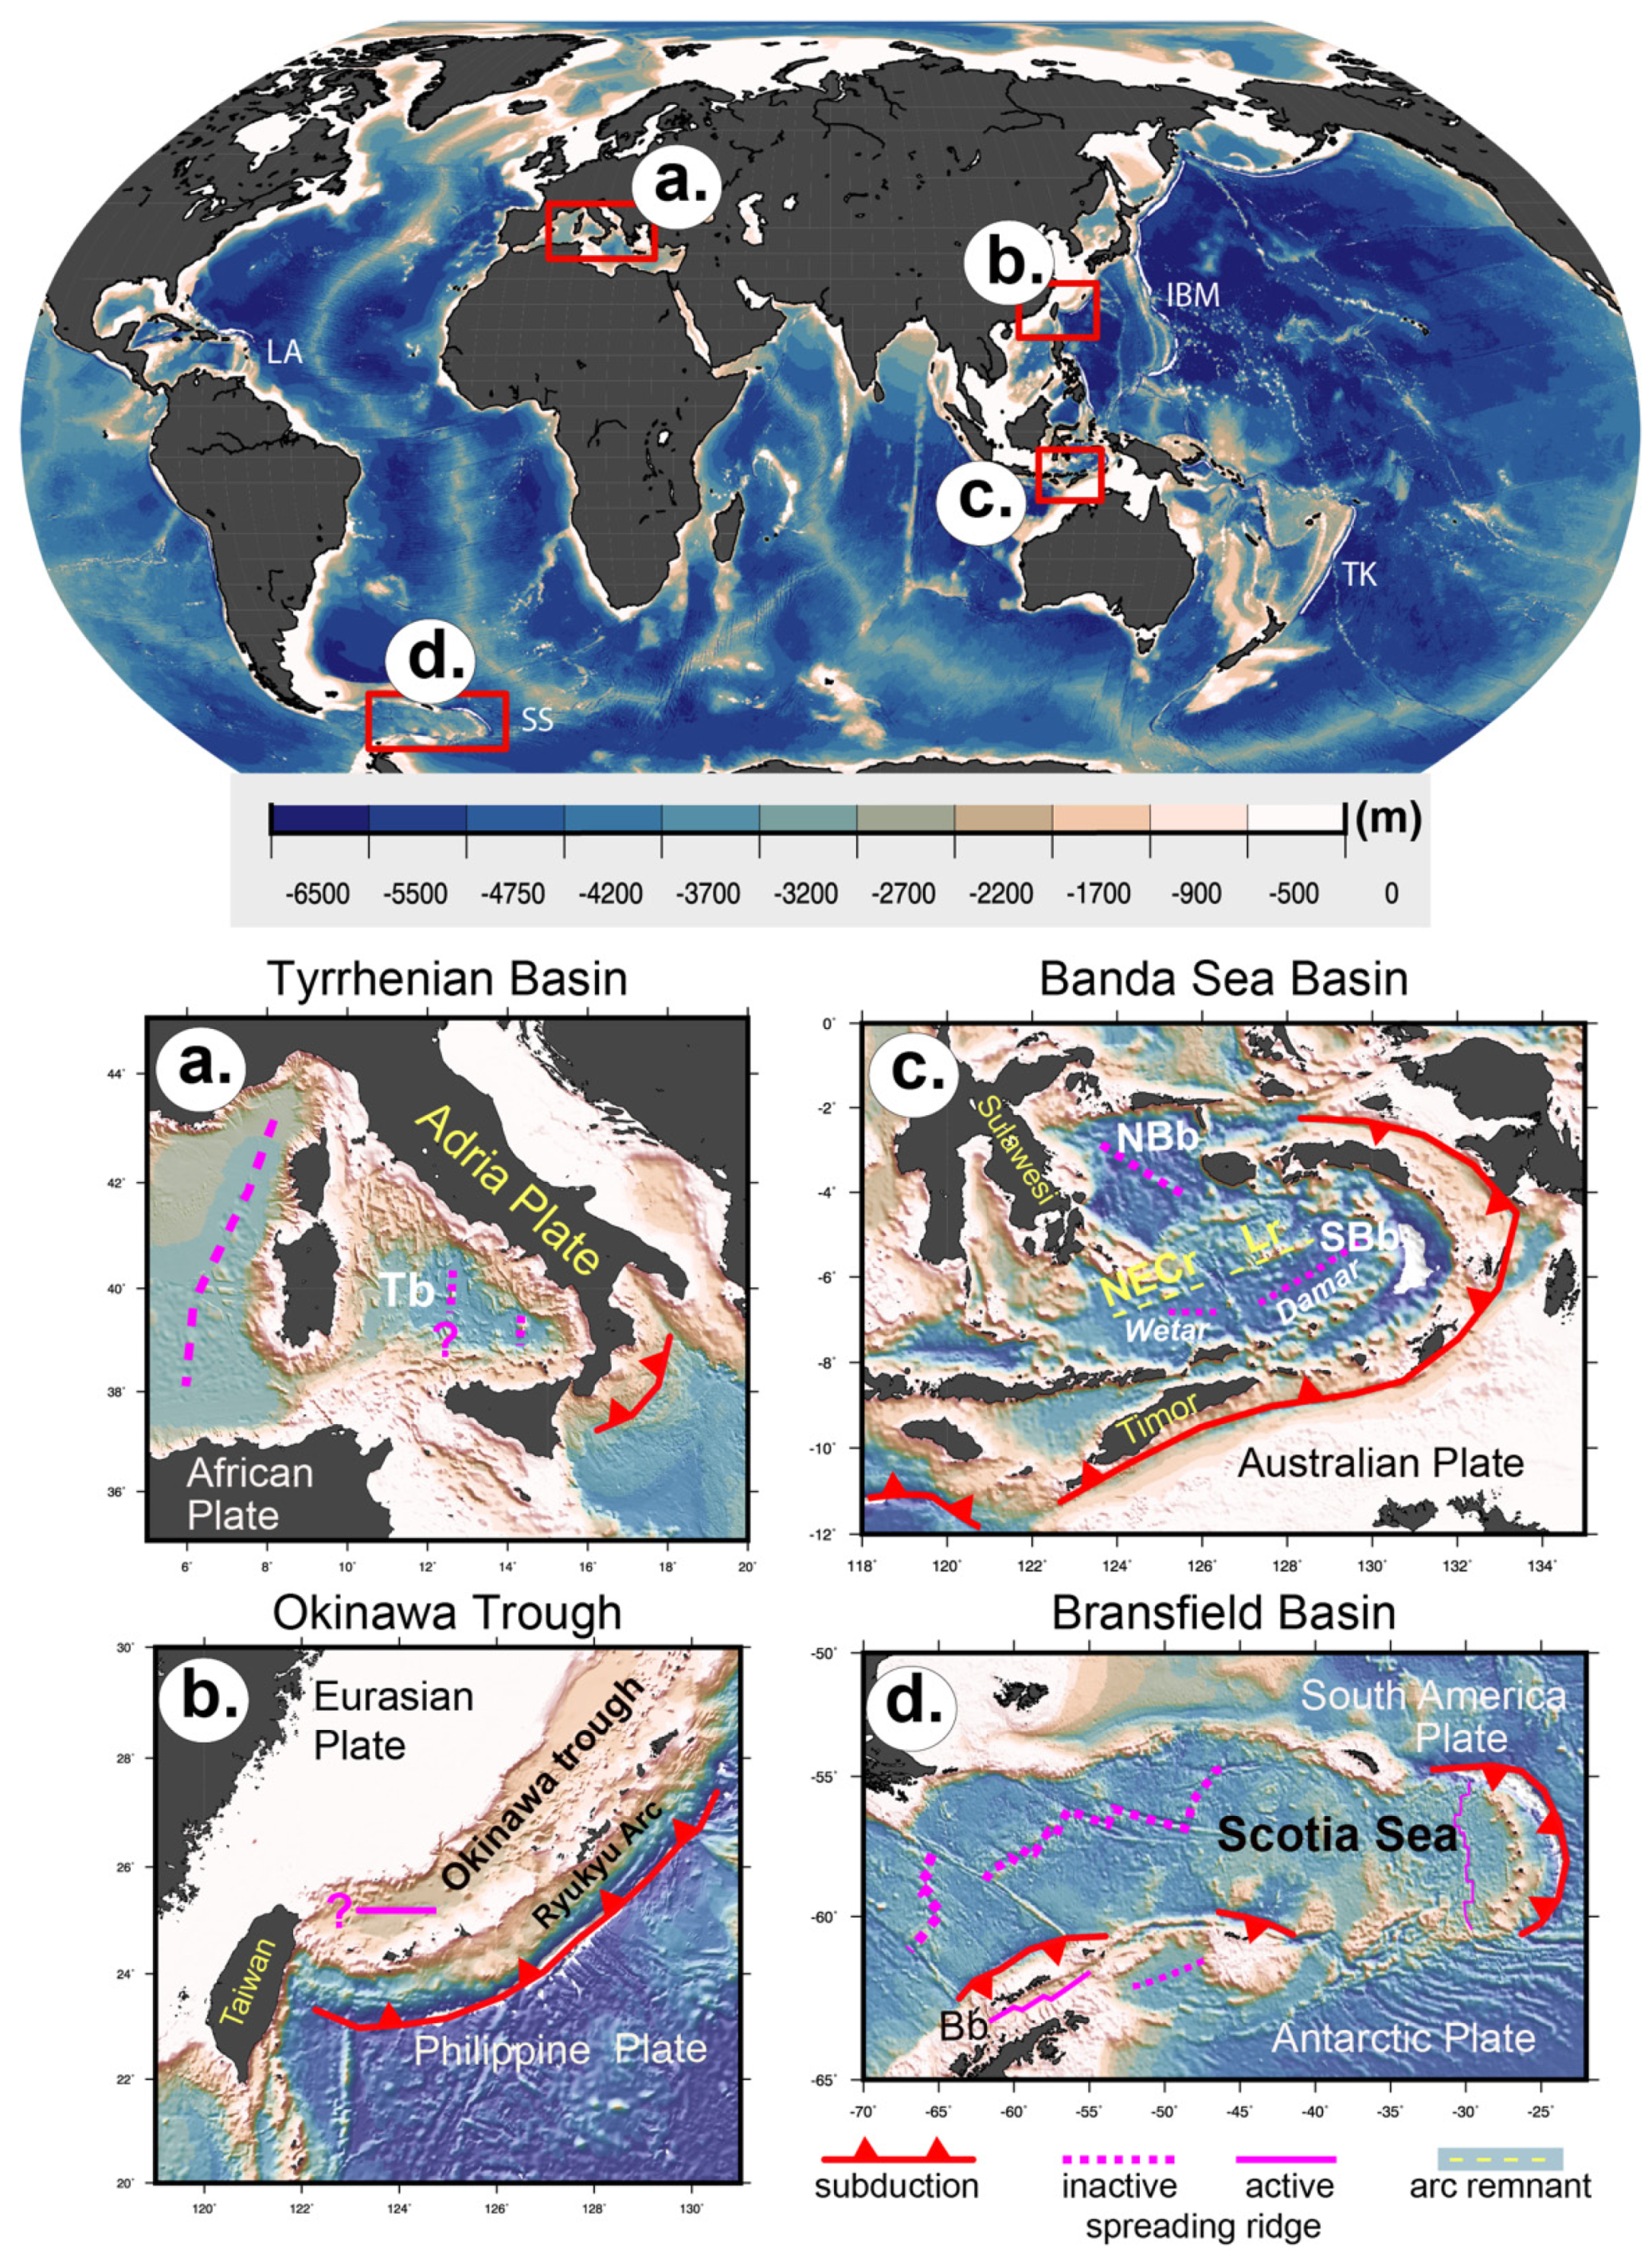
Back-arc basins formed in intra-continental setting are often floored not only by oceanic crust, but also of exhumed mantle material, off-axis magmatic intrusions, and also contain continental fragments. This is the case of the Tyrrhenian Basin, which formed by back-arc extension due to retreat of the Calabrian slab in the Central Mediterranean region (
Figure 1a). It is characterized by multiple sub-basins that progressively formed closer to the trench, following the path of the slab that retreats towards South-East [
17]. The nature of the basement in the Tyrrhenian is still debated. Some studies suggest the basin is mainly composed of oceanic crust [
18,
19,
20], whereas others argue for the presence of exhumed serpentinised mantle [
21,
22]. The most recent geophysical studies seem to point at the presence of exhumed mantle intruded by magmatic bodies and thinned continental crust between the sub-basins [
21,
23]. This reflects a complex extensional history, which is still not fully understood.
Other interesting examples of multiple extensional phases that affect the morphology of the back-arc basin include the southern Okinawa Trough and the Banda subduction zone. The southern Okinawa Trough, located behind the arc of the Ryukyu subduction zone (
Figure 1b), is an example of continental rifting that underwent two distinct extensional phases; a first phase between 6 and 10 Ma and a second one <2 Ma [
24]. It is still debated whether oceanic spreading has already begun in the South [
25,
26]. Recent geophysical studies suggest that the basement of the back-arc basin is made of thinned continental crust intruded by magmatic bodies, suggesting that, although seafloor spreading might not have started yet, magmatism associated with extension is certainly occurring [
25]. Interestingly, in a seismic profile perpendicular to the trench, they observed two magma bodies, 15 km apart from each other; one is the magma chamber below the rift axis, whereas the location of current magmatism is slightly offset towards the trench. This shows not only that a jump in the location of magmatism has occurred in the southern Okinawa Trough, but also that back-arc volcanism is not continuously distributed, especially during the incipient phase of seafloor spreading.
In the Banda subduction zone, the formation of the highly curved trench is associated to extension in the back-arc and opening of the Banda Sea basin (
Figure 1c). The Banda Sea is divided in multiple sub-basins, which reflect the complex tectonic history of this region. The age of the oceanic seafloor in the North Banda Sea, or Sula Basin, is ~10 Ma [
27], whereas the basins in the South, Damar, and Wetar basins are younger. Here, spreading started at about 7 Ma after the arc split leaving the Nieuwerkerek-Emperor of China and Lucipara ridges in the northern margin of the basin as remnant arc [
28] (
Figure 1c). Magnetic anomalies in the Damar Basin clearly show that a segmented spreading ridge produced new oceanic crust until 3.5 Ma, which corresponds to the time the oceanic Banda embayment completely subducted and the Australian continental shelf collided with the trench [
28,
29,
30].
The examples above show, once again, how subduction dynamics and back-arc basins architecture are tightly link. To understand the structures that we observe in back-arc basins today, we use thermo-mechanical forward models of lithospheric deformation that take into account the main driving forces of back-arc extension and their characteristic transient nature. Style of continental rifting can be controlled by many factors, among them the strength and thermal structure of the lithosphere and the extension rate [
31,
32,
33,
34,
35,
36]. Variations of these parameters result in a wide range of time, geometries, and crustal structures. In this study, we perform a parametric study to investigate the role of duration of extensional phases and extensional rates on the final architecture of a back-arc basin.
Figure 1.
Natural examples of back-arc basins with ridge jumps and complex architectures described in the main text. (
a) Tyrrhenian Basin, (
b) Okinawa Trough, (
c) Banda Sea Basin, and (
d) Bransfield Basin. Question marks next to spreading ridges show the uncertainties on whether there is or has been active spreading in that region. Background image is the global bathymetry ETOPO1 [
37]. Bb: Bransfield Basin, IBM: Izu-Bonin Mariana, LA: Lesser Antilles, Lr: Lucipara Ridge, NBb: North Banda Basin (or Sula Basin), NECr: Nieuwerkerek-Emperor of China ridge, SBb: South Banda Basin, SS: South Sandwich, Tb: Tyrrhenian Basin, TK: Tonga-Kermadec.
2. Methods
We model continental lithospheric extension in a 2D Cartesian geometry with the thermal-mechanical finite element code ASPECT (e.g., [
38,
39]), which solves the Stokes and thermal advection–diffusion equations (see Data Availability for code and parameter files). Although a 2D setup cannot capture all the three-dimensional complexities of a subduction zone, one can still take into account the changes in subduction dynamics, hence in trench migration, by implementing time dependent extensional rates that simulate episodic trench retreat. Furthermore, the 2D setup allows for a high resolution that is needed to resolve the brittle structures in the crustal layers.
The Stokes system is defined as
where
is the velocity,
is the viscosity,
is the second deviator of the strain rate tensor,
is pressure,
is density, and
is gravitational acceleration.
Temperature evolves through a combination of advection, heat conduction, shear heating, and adiabatic heating:
where
is the heat capacity,
is temperature,
is time,
is thermal diffusivity,
is the linear thermal expansion coefficient, and
is the rate of internal heating. Respectively, the terms on the right-hand side correspond to internal head production, shear heating, and a simplified form of adiabatic heating. Density varies linearly as a function of the reference density (
), thermal expansivity (
), reference temperature (
), and temperature:
The models’ setup derives from those developed by Naliboff et al. (2020) [
40] and Gouiza and Naliboff (2021) [
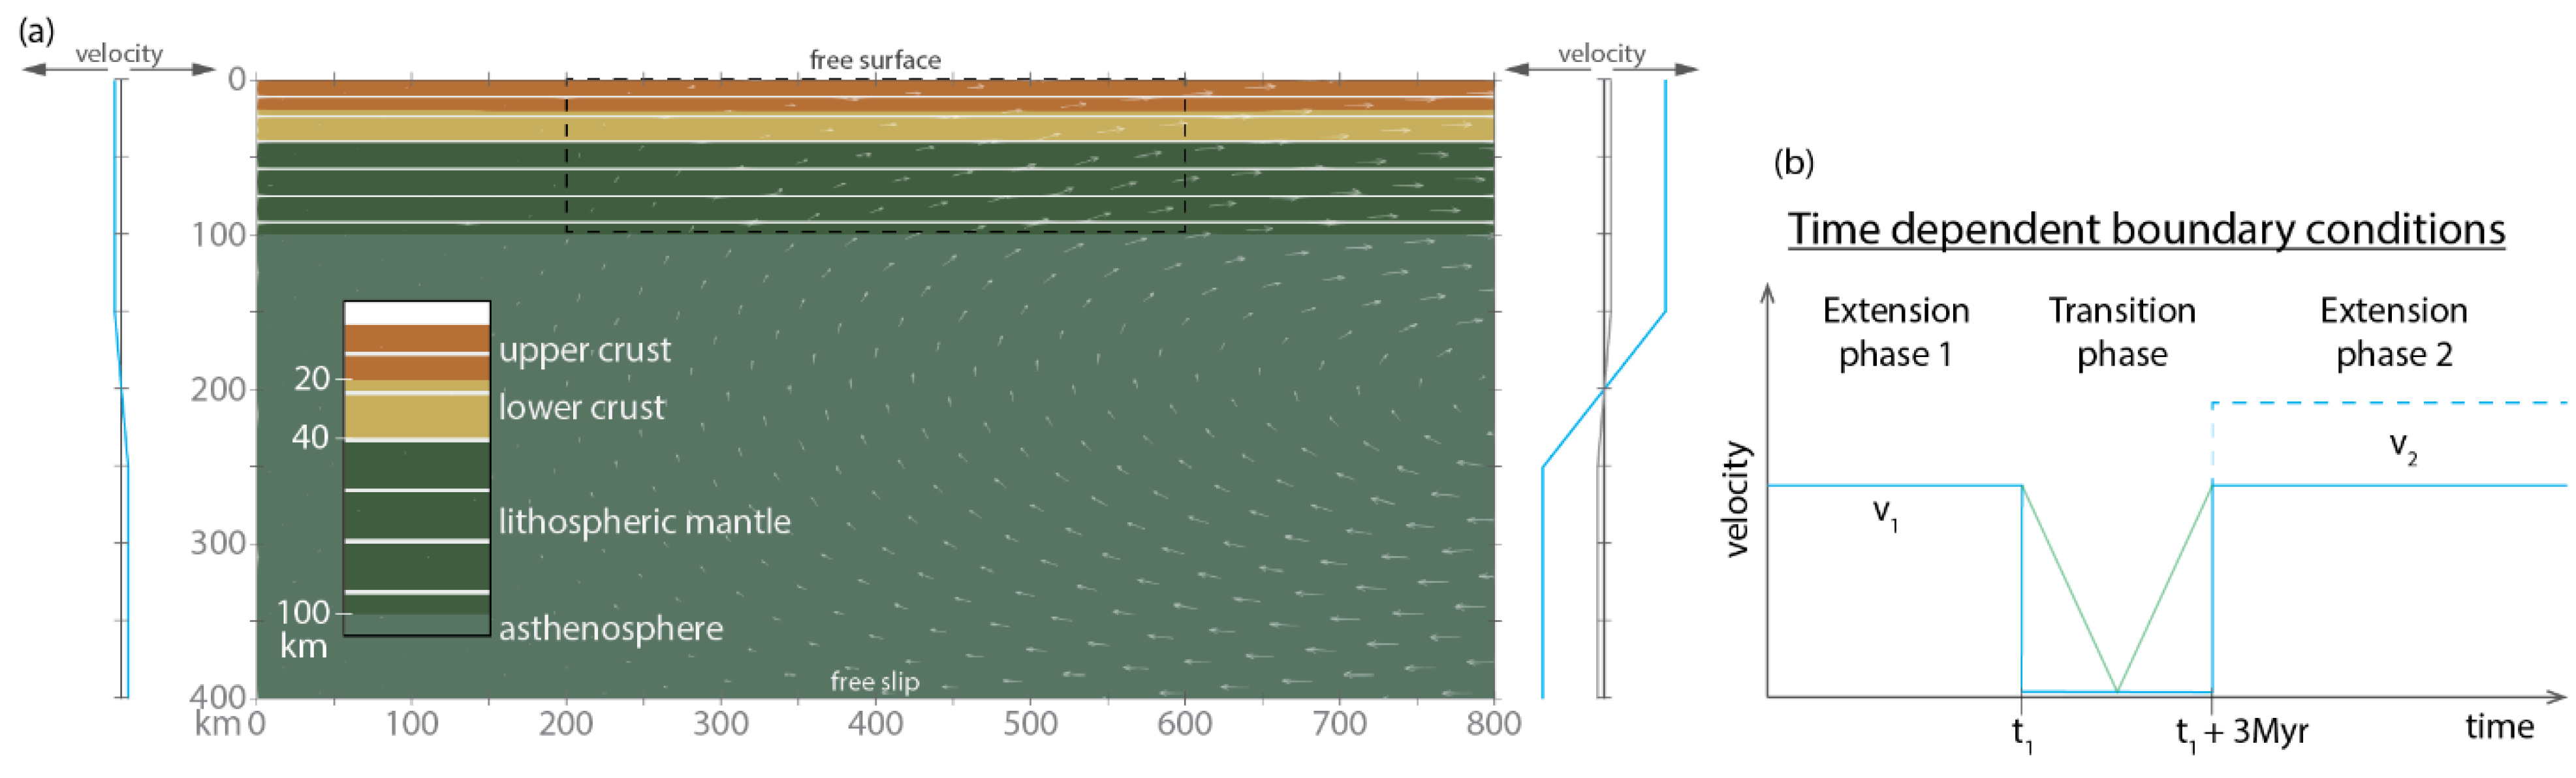
41], which have been modified to use the extended Boussinesq approximation, include the asthenosphere, and prescribe asymmetric velocity boundary conditions. The model domain spans 800 × 400 km, with an initially 100 km thick lithosphere and asthenospheric mantle extending from 100 to 400 km (
Figure 2a). The mesh is quadrilateral and its resolution is finer in the region where lithospheric deformation occurs to make sure that stress localisation and faulting can occur and are well resolved. Specifically, between 150 and 650 km along the
x-axis, the mesh has a 1.25 km resolution until 50 km of depth and 2.5 km resolution from 50 to 100 km. Outside these domains, the resolution is 5 km. These resolutions follow those used by Naliboff et al. (2020) [
40], who found transitioning from a resolution of 2.5 to 1.25 km in the upper 50 km produced similar first-order patterns of deformation, but more highly refined shear zones. The Stokes solution is solved on Q2Q1 elements, while fields tracking composition and temperature utilize Q2 elements. The non-linear Stokes system is solved using defect-correction Picard iterations [
42] to a tolerance of 1 × 10
−5.
Distinct lithologies and other parameters, such as plastic strain, are tracked with compositional fields. The continental lithosphere is comprised of a 20 km thick layer of upper crust, a 20 km layer of lower crust, and a 60 km layer of lithospheric mantle [
43]. The properties of each lithology are shown in
Table 1. At 200 < x < 600 km, within the lithosphere, we impose an initial random field of plastic strain, with randomly assigned a value of 0.5 or 1.5. Significantly, this range corresponds with the strain weakening interval, over which the cohesion and friction linearly decrease by a factor 4 (see below for details on rheology). This approach simulates heterogeneities within the lithosphere and facilitates strain localisation (e.g., [
40]). To be able to better compare results of the parametric study, all models presented in this work have the same initial plastic strain field that is produced before the models start, stored in a separate file, which is read to define the initial model composition values, including those for lithologies. However, we tested multiple initial random fields to make sure that our observations and conclusions are robust. The initial temperature profile is computed following [
44] for the continental geotherm, which is merged with an adiabatic profile. We specify surface heat flow of 53 mW/m
2, which results in a temperature at the base of the Moho of 587 °C and 1258 °C at the base of the lithosphere.
To produce extension, we impose an outward flow in the top half of the side boundaries. For mass conservation, the same flow is imposed inward in the bottom half of those boundaries (
Figure 2). To simulate the asymmetric type of extension in back-arc basins, during the extensional phases the imposed velocity on the right boundary (1–5 cm/yr) is larger than that of the left side (1 mm/yr). In the other boundaries, free slip is imposed at the bottom and free surface at the top. No heat flow is allowed across the side boundaries (i.e., thermal insulating boundary conditions) and an initial temperature of 0 °C and 1430 °C is imposed at the surface and bottom (fixed) respectively.
We use a visco-plastic rheology by computing effective stresses for both viscous and brittle deformation at each point and using the minimum value between these different deformation mechanisms [
40,
45]. For the viscous flow in the lithosphere and asthenosphere, we use dislocation and diffusion creep following the expression:
where
is the second invariant of the effective stress,
A is the rheological pre-exponential factor,
n is the stress exponent,
is the effective strain rate,
E and
V are the activation energy and volume respectively,
P is pressure,
R is the gas constant, and
T is temperature.
Brittle failure (plasticity) is computed as follows:
where
C is cohesion and
is the angle of internal friction.
Finally, we take into account strain weakening mechanisms by decreasing values of friction coefficient and cohesion by a factor 4 as a function of accumulated plastic strain. In detail, the cohesion and friction are linearly reduced between plastic strain values 0.5 and 1.5, which also corresponds to the initial range of randomized plastic strain values imposed at the start of the model at 200 < x < 600 km. This allows rapid localization of brittle deformation through the crust and mantle. At each point, the viscosity is then computed at each point for the different deformation mechanisms and the minimum value is taken as the effective viscosity. The structural evolution of the fault networks and individual faults from the initial stage of distributed extension to more localized deformation and eventual breakup follow the first-order patterns observed in Naliboff et al. (2020) [
40] and Gouiza and Naliboff (2021) [
41]. We refer the readers to these studies for additional details on the initiation and evolution of fault networks under a variety of rifting conditions.
In all models, we compute equilibrium melt fraction as a function of temperature and pressure for an anhydrous peridotitic composition during postprocessing following the parametrization of [
46]. Thus, the presence of melt does not affect temperature, composition (e.g., depletion), and physical properties of the mantle.
Parametric Study
To investigate how episodic trench retreat controls the final architecture of the back-arc basin, we focus on key parameters such as the duration and rate of extension. The extensional history of most models is shown in
Figure 2b and can be divided in three phases: (1) Extension phase 1—initial phase of extension until t
1; (2) Transition phase—a 3 Myr long phase with a very low extension rate (1 mm/yr outflow velocity on the right boundary), which we refer to as a phase of no extension for simplicity; and (3) Extension phase 2—a final phase in which extension is resumed with the same (or higher) extensional rate as extension phase 1. We also ran a set of models in which the transition between the various phases is smoother, with a linear deceleration and following acceleration during the pause phase (
Figure 2b). We note that imposing a period of low extension rates between faster rift phases follows the approach used in Naliboff and Buiter (2015) [
33] to examine how durations of conductive cooling during tectonic quiescence controls the transition between continental rift reactivation and migration.
To obtain different geometries before the pause phase (e.g., thinned continental lithosphere, continental break-up, oceanic spreading, we vary the duration of extension phase 1 (from 4 to 14 Myr). We also tested different durations of the transition phase (2 and 4 Myr), but we found that although the timing of rift jumps changes, the same final geometries are observed. We, thus, decided to only present results of models with a 3 Myr long pause phase.
The other key parameter is extension velocity, which is 1 and 2 cm/yr during extension phases 1, and 1, 2, and 5 cm/yr during extension phase 2. These values are within the range of the present day back-arc deformation rates of the majority of subduction zones in which the overriding plate is under extension with the exception of a few outliers, such as Tonga and New Britain subduction zones that have higher values [
50].
3. Results
Results from our parametric study can be divided in three main groups (i.e., scenarios) according to their evolution: asymmetric margins, continental fragment formation, and intra-oceanic ridge jump. In the following paragraphs, we first describe the dynamics and resulting basin structure of each scenario, second, the magmatic production, and, finally, we draw a comparison between the different scenarios. For each scenario, we describe in detail one model, referred to a reference model, that most clearly illustrates the key features characteristic of each scenario.
3.1. Asymmetric Margins
The reference model for this scenario is a model with an extension velocity on the right boundary of 1 cm/yr for both phases of extension and with the duration of extension phase 1 t
1 = 8 Myr (
Figure 3). Lithospheric deformation is widespread in the first 2 Myr of the model, with distributed high-angle normal faulting across the initial plastic strain damage zone within brittle sections of the upper, lower crust, and uppermost few km of the lithospheric mantle. At these early stages of extension, brittle faults in these layers are separated by ductile layers at the base of the upper and lower crust, although low-angle ductile shear zones may connect brittle faults at different depths. Initially, three basins about 70 km long and with a subsidence of 0.5 km develop. After 2 Myr, however, deformation mainly localizes in the central basin that continues to subside. Below this basin, lithospheric thinning is underway (
Figure 3a). At this stage, the ductile layers in the upper and lower crust have thinned sufficiently that high-angle brittle faults may extend from the surface to the brittle–ductile transition in the mantle lithosphere. Lower-angle brittle structure observed in the plastic strain field (
Figure 3, right column) reflect rotation of previously high-angle structure (e.g., [
40,
51]).
During lithospheric thinning in the central basin, the lower crustal layer thins faster than the rest of the lithosphere and, by 7 Myr from the onset of extension, breaks up, leaving the upper crust in direct contact with the lithospheric mantle (
Figure 3b). By the end of extension phase 1 (8 Myr), the continental lithosphere in its thinnest point is only ~19 km thick (6 km of upper crust and 13 km of lithospheric mantle), subsidence reaches 1 km, and the basin is ~140 km long with about 20 km in the centre that misses the lower crustal layer. During the 3 Myr of the transition phase, thermal thickening of the lithosphere occurs as conductive cooling outpaces advective heat transfer from the asthenosphere (
Figure 3c). As the extension rate is much lower, but not zero, stretching of the continental crust continues, albeit very slowly.
Quickly after extension is resumed for the second phase (at 11 Myr), the lithospheric mantle exhumes through large displacement along the rift-bounding normal faults onto the ocean floor in the same location where rifting was occurring during extension phase 1 (
Figure 3d). Subsequently, the location of extensional deformation migrates closer to the trench (i.e., closer to the right boundary) (
Figure 3e). After 7 million years of resumed extension, continental break-up occurs in this new location. As a result, the right flank of the rift from extension phase 1 hyperextends and becomes the left flank of the new rift. Following continental break-up, a seafloor spreading centre develops almost 50 km away from the previous location of rifting, forming an oceanic basin in the back-arc (
Figure 3f).
In this scenario, the final architecture of the basin is characterized by a strongly asymmetric geometry, with a hyperextended margin of the basin on the left side (about 120 km long in this model) and a much shorter margin on the right (~40 km), the side closer to the trench (
Figure 3f). On the hyperextended margin, we observe necking of the lithosphere; the thinnest part is where mantle is exhumed, which also corresponds to the first location of rifting. Closer to the oceanic basin, between the first and the second rifting axis location, continental lithosphere experienced the largest amount of stretching. Here, we observe a ~50 km long region of <1 km thick layer of upper crust and <5 km thick layer of lithospheric mantle, that gradually thinness towards the ocean. On the other side of the basin, the transition between continent and ocean is more abrupt.
In our parametric study, models that show this behaviour and final margin architecture are those with the shortest duration of extension phase 1, regardless of the imposed velocities. In the two models with low extension rate (i.e., 1 cm/yr) and t
1 = 10 Myr, the relocation of the rift happens towards the left side of the model. In this case, the asymmetric margins are still observed, but the longest margin is on the right side of the basin (
Figure S1).
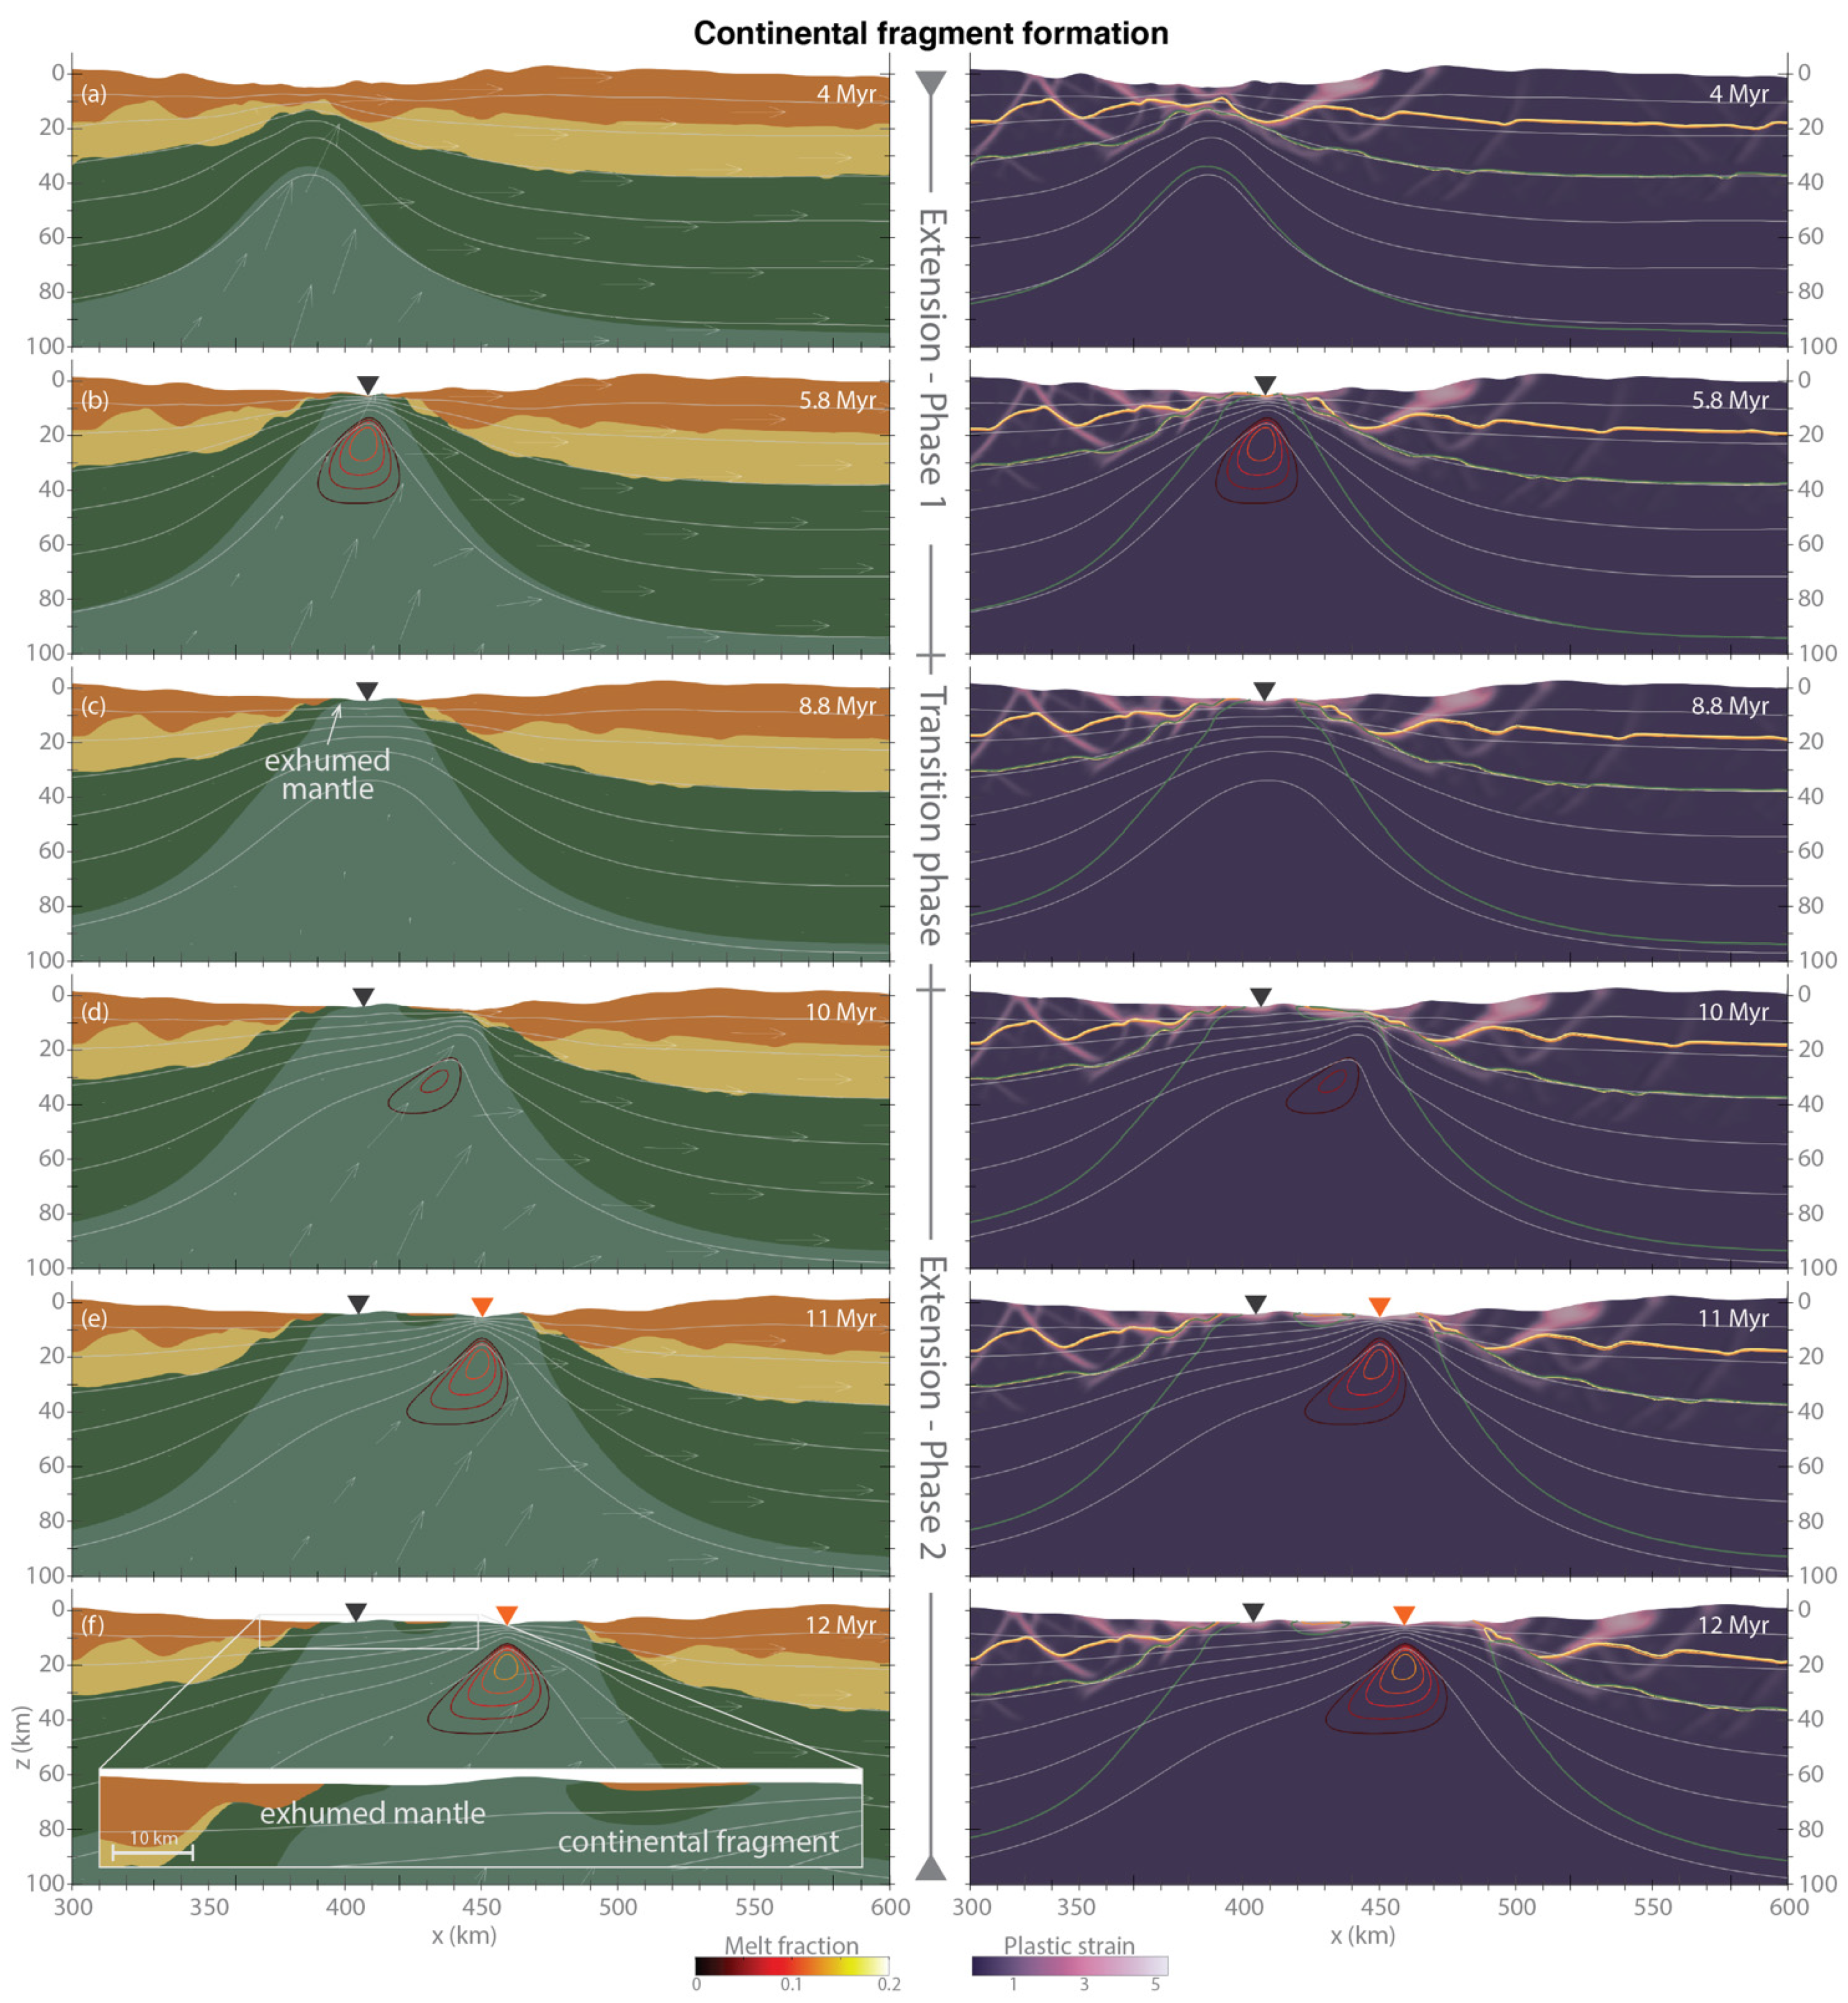
3.2. Continental Fragment Formation
When extension phase 1 lasts longer than in the previous case, we observe a scenario in which a continental fragment detaches from the main continent. The dynamics of the continental rifting in the first phase of extension are similar to those described in the previous section, with the formation of multiple basins, followed by localisation of extension in the central basin that progressively lengthens and deepens (
Figure 4a). The reference model for this scenario is a model with an extension velocity on the right boundary of 2 cm/yr for both phases of extension and with the duration of extension phase 1 t
1 = 6 Myr (
Figure 4). In this case, the lower crust breaks up after 4.4 Myr from the beginning of the model, followed by the break-up of the upper crustal layer at 5.4 Myr. A thin layer of lithospheric mantle subsequently exhumes to the surface in the central part of the basin. Full continental break-up and the onset of extension within exhumed mantle occur just prior to the end of extension phase 1. As for the previous scenario, during the transition phase, the lithosphere thermally thickens and predicted melting of upwelling mantle stops (more details on magmatism in
Section 3.4). At this point, the rifted margins are fairly symmetric, except in distal regions where the exhumed mantle on the left margin is ~20 km long (
Figure 4c).
As soon as extension starts again at 9 Myr, deformation localises on the right margin, towards the trench, where the lithosphere has been highly stretched by the first extensional phase and only contains thin layers of upper crust and lithospheric mantle (
Figure 4d). Here, continental break-up reoccurs less than 2 Myr after extension is resumed and about 35 km away from the location of the previous spreading centre. The development of a new spreading centre produces an oceanic basin closer to the trench (
Figure 4e). Thus, ridge jump creates a continental fragment, which was originally part of the continental margin situated to the right in our model, and which after the ridge jump remains stranded between two oceanic basins. This continental fragment is about 25 km long and 4.5 km thick at its thickest point. It is made of a very thin layer of upper continental crust and of lithospheric mantle, which also outcrops for ~4 km on the left side, adjacent to the first oceanic basin (
Figure 4f).
At the end of models that fall into this scenario, the floor of resulting back-arc basin contains a complex sequence structure: starting from the margin farthest from the trench (left margin), we observe a transitional zone of thinned continental lithosphere that ends in a region of outcropping lithospheric mantle, a small oceanic basin, another region of exhumed lithospheric mantle from the continental fragment, continental upper crust, and a second oceanic basin (
Figure 4f).
In models with a lower extensional velocity during phase 1 (i.e., v
1 = 1 cm/yr) that show this behaviour, ridge jump occurs away from the trench (i.e., to the left of the first spreading centre) (
Figure S2). Therefore, in these cases, the small oceanic basin is the one closer to the trench and the continental fragment comes from the left margin. However, the final structure of the basin is very similar to the reference model, in that it is characterized by the presence of a continental fragment and adjacent exhumed mantle material in between two oceanic basins.
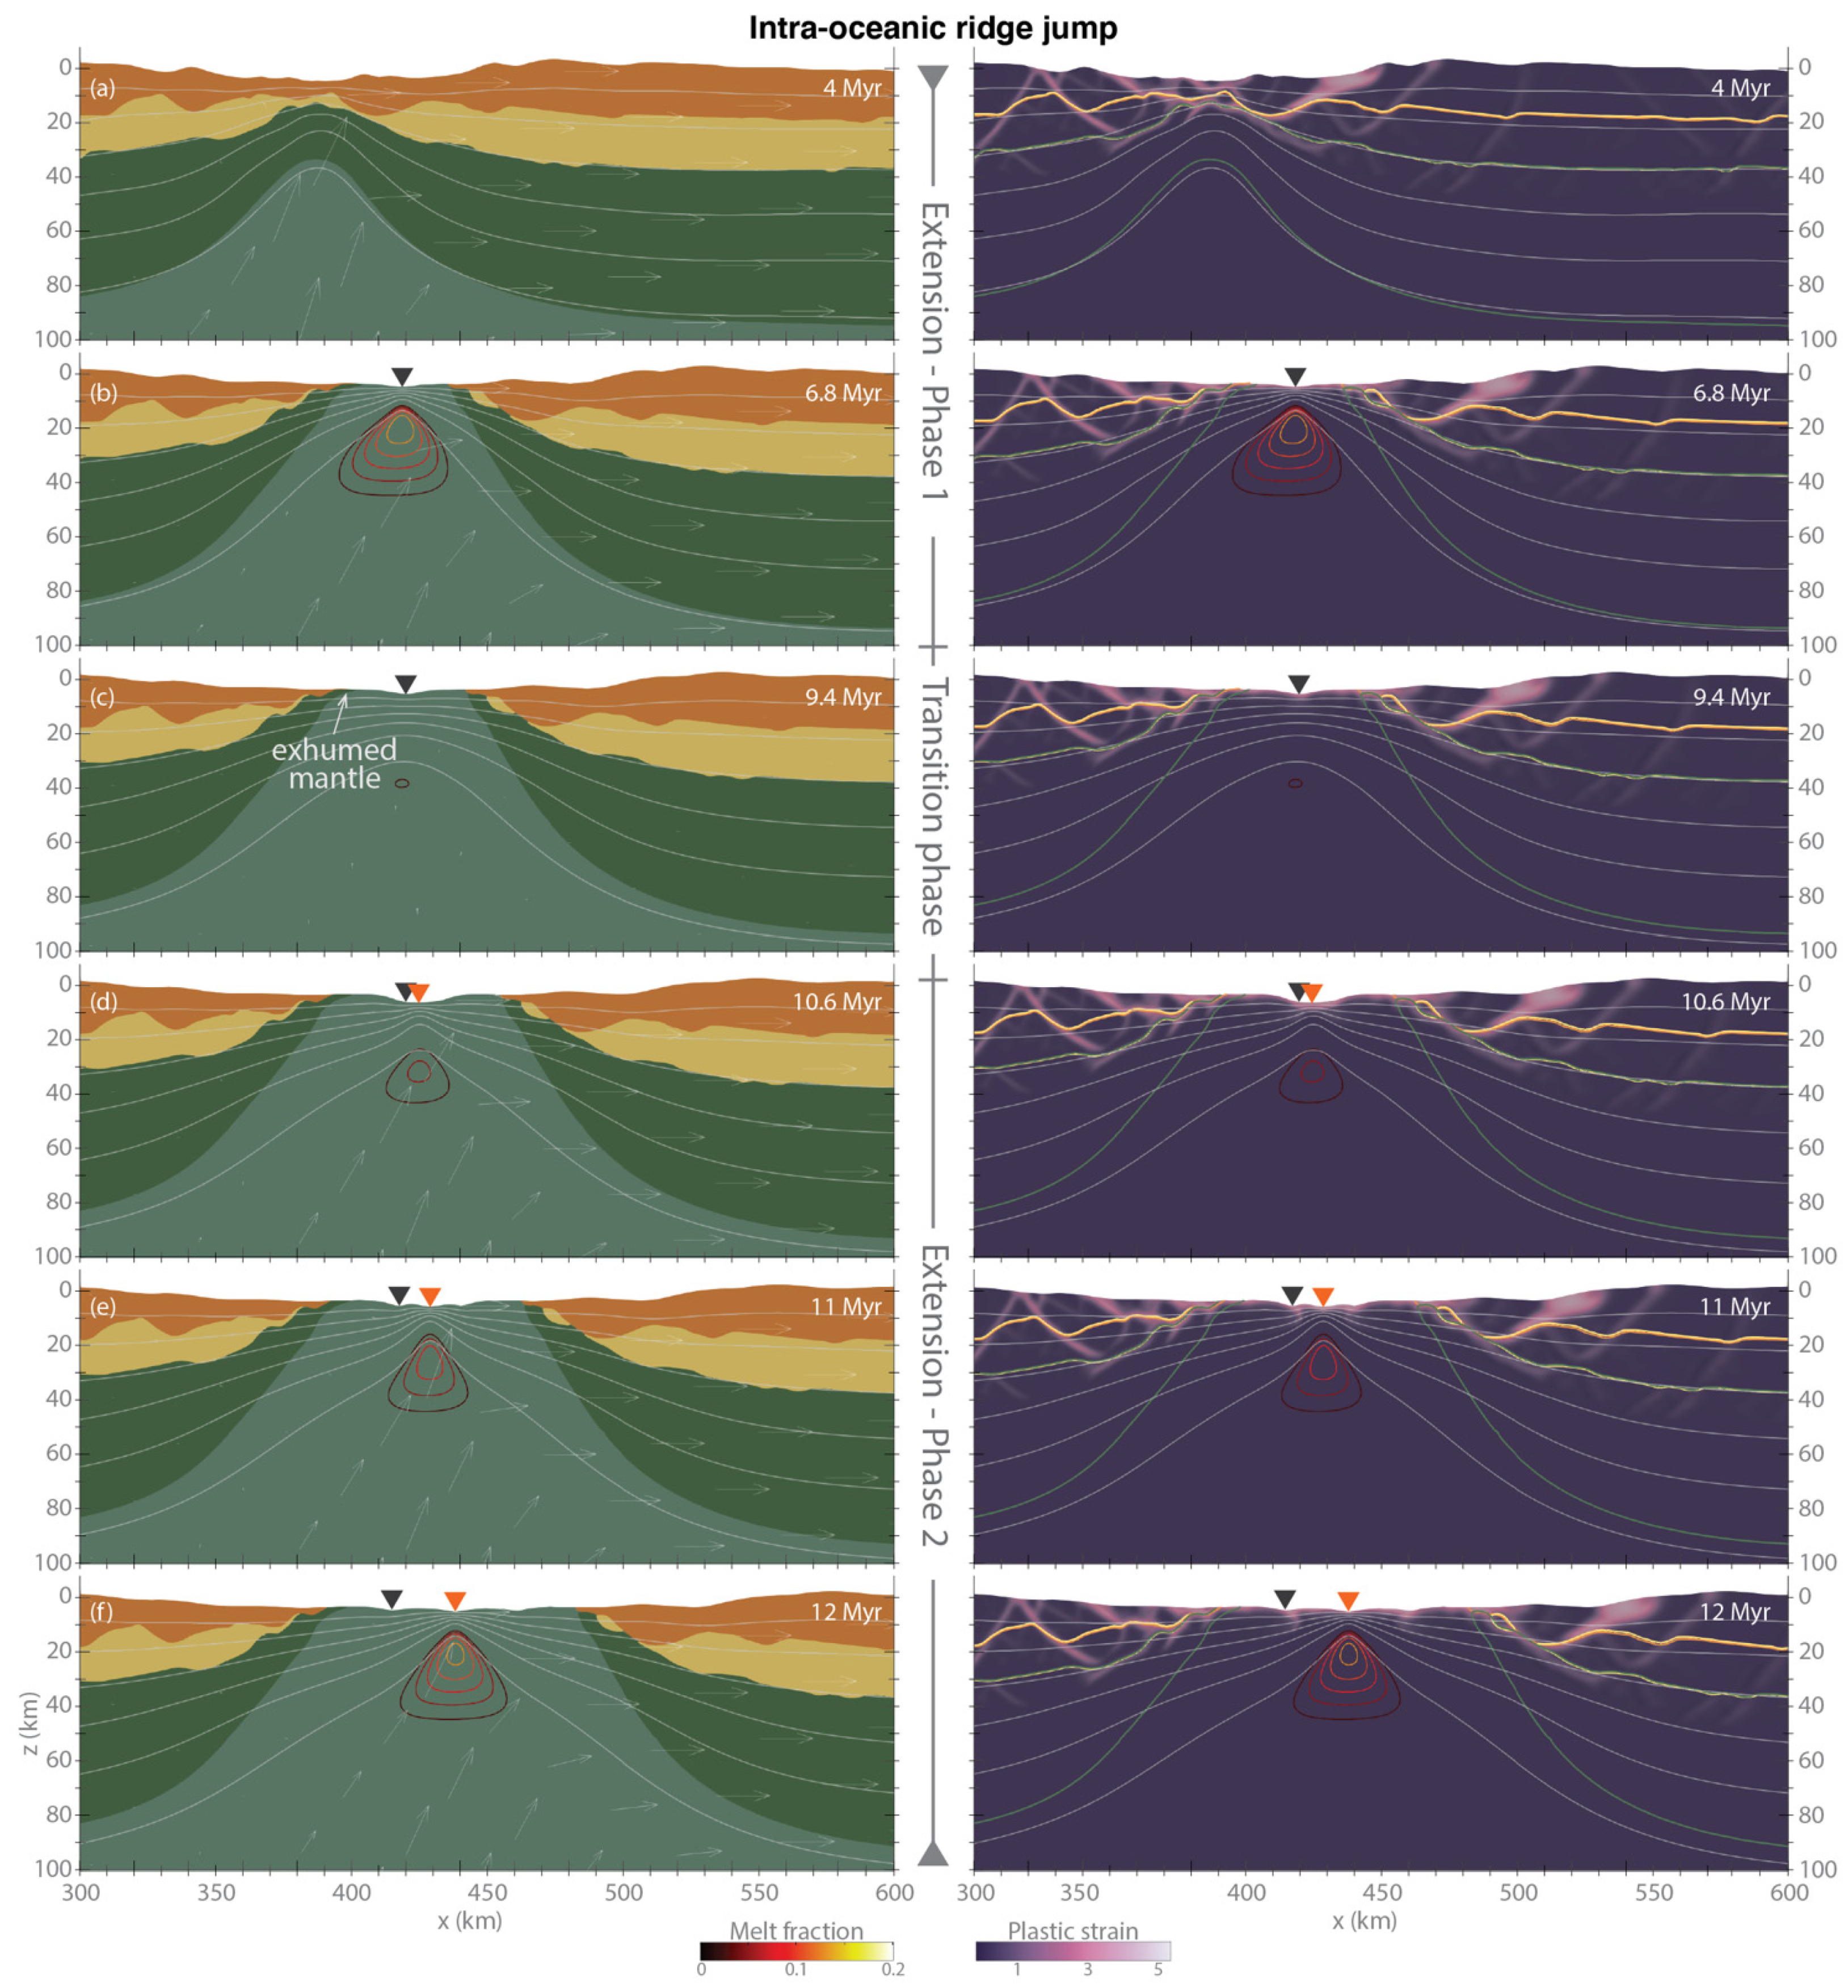
3.3. Intra-Oceanic Ridge Jump
Models with the longest extension phase 1 have time to develop a larger oceanic basin during the first stage. This is the case, for instance, in the model with an extension velocity on the right boundary of 2 cm/yr for both phases of extension and with the duration of extension phase 1 t
1 = 7 Myr. In this model, the initial stages of extension are the same as for the reference model of continental fragment formation (
Figure 5a). However, because extension phase 1 lasts longer, the oceanic basin that forms after continental break-up is more developed, (i.e., about 30 km long) (
Figure 5b). During the transition phase, the lithosphere thickens and melt production gradually decreases (
Figure 5c). When extension resumes, fast subsidence followed by the formation of a new spreading centre occur in less than 1 Myr (
Figure 5d,e). The location of the new spreading centre is only a few kilometres to the right of the old one, towards the trench. Therefore, in this scenario, only one spreading ridge and oceanic basin forms because the length of the ridge jump is very small.
The final architecture of the basin is fairly simple, with a slightly longer margin away from the trench, which ends in a few kilometres of exhumed lithospheric mantle material and one oceanic basin that formed through pulses of magmatic activity (
Figure 5f).
3.4. Episodic Mantle Melting
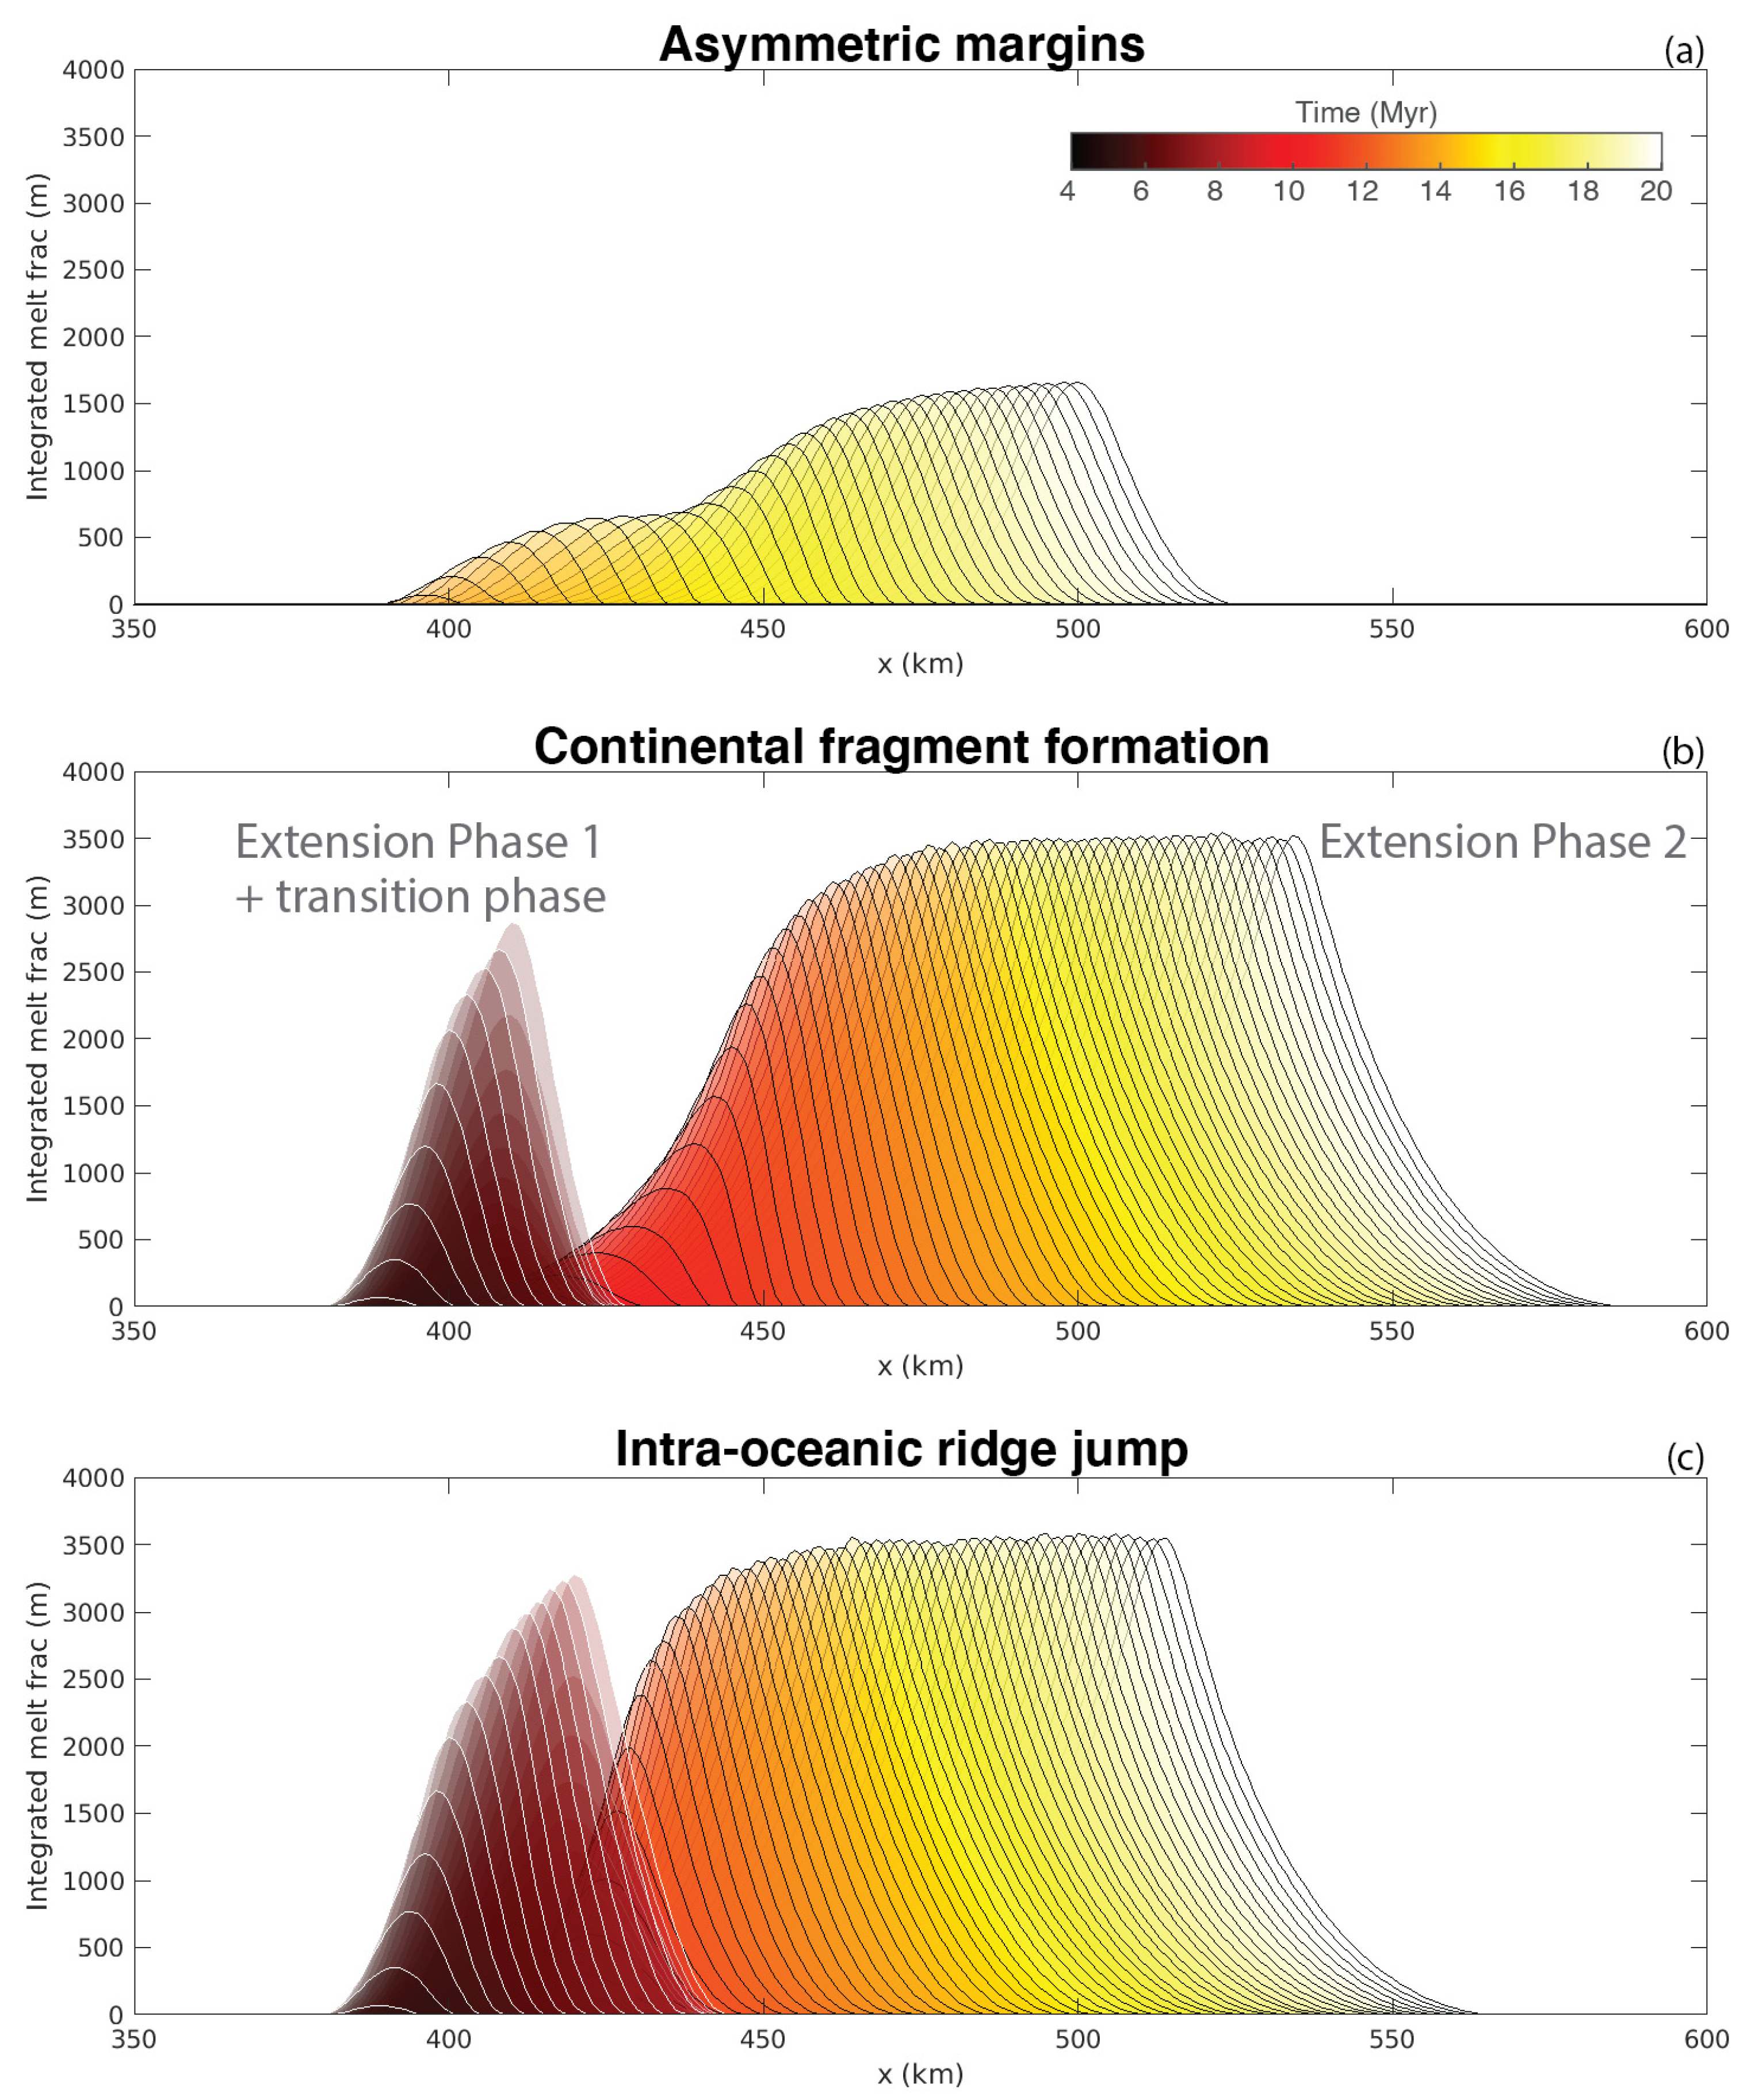
The different scenarios described above have also very interesting differences in terms of predicted melt generation through adiabatic decompression of asthenospheric mantle that rises during extension. In these models, melt is computed at a postprocessing stage and represents the equilibrium melt fraction as a function of pressure and temperature.
Figure 6 shows the amount (volume) and location (x-coordinate) of predicted mantle melts during the evolution of the reference models for each scenario. In models that result in asymmetric margins, very little or no melt is produced during the first phase of extension. This is because extension phase 1 does not last long enough to break the continental lithosphere apart and/or to thin it to a point that allows the mantle rising towards the surface to melt via adiabatic decompression melting. As thinning of the lithosphere continues during the second phase of extension, the initial location of rifting established during the first phase is abandoned and the mantle starts rising in a new location, closer to the trench. In the reference model, because the extension rate is low, this process is slower and the amount of mantle melt is lower compared to models with 2 or 5 cm/yr extension velocities. Nevertheless, a spreading ridge eventually forms. The location of this spreading ridge gradually migrates towards the trench due to the asymmetric boundary conditions (
Figure 6a).
In the other two scenarios, we can clearly observe two distinct sets of peaks of melt production that are results of ridge jumps (
Figure 6b,c). In the case of continental fragment formation, there is almost no overlap between location of melting during the first and second phases (
Figure 6b). This is because the first set of peaks corresponds to melt and new oceanic crust that form the first small basin, whereas the second set of peaks corresponds to the melt produced under the younger basin on the other side of the continental fragment. When the ridge jump is within the same basin (intra-oceanic ridge jump scenario), the location of melt before and after the pause phase is almost the same, although it keeps migrating towards the trench. Indeed, the two sets of peaks largely overlap (
Figure 6c). However, it is still possible to observe a slight jump in the location of the spreading ridge between the two extensional phases.
3.5. Length and Time of Rift and/or Ridge Jumps
The duration of the first extensional phase controls the type of scenario (
Figure 7 and
Table 2). Models with the shortest phase 1 display asymmetric margins that result from the combination of the continental lithosphere not being fully broken up at the end of phase 1 and relocation of rifting during phase 2. In contrast, symmetric margins happen when phase 1 lasts longer, allowing for continental break-up and oceanic basin formation during phase 1. Continental fragment formation happens when phase 1 lasts slightly longer than the asymmetric margins scenario and is characterized by large jumps that result in the formation of a second oceanic basin. Finally, when extension phase 1 lasts even longer, a single well-developed oceanic basin is formed and ridge jumps during phase 2 are shorter, occurring near the former oceanic spreading.
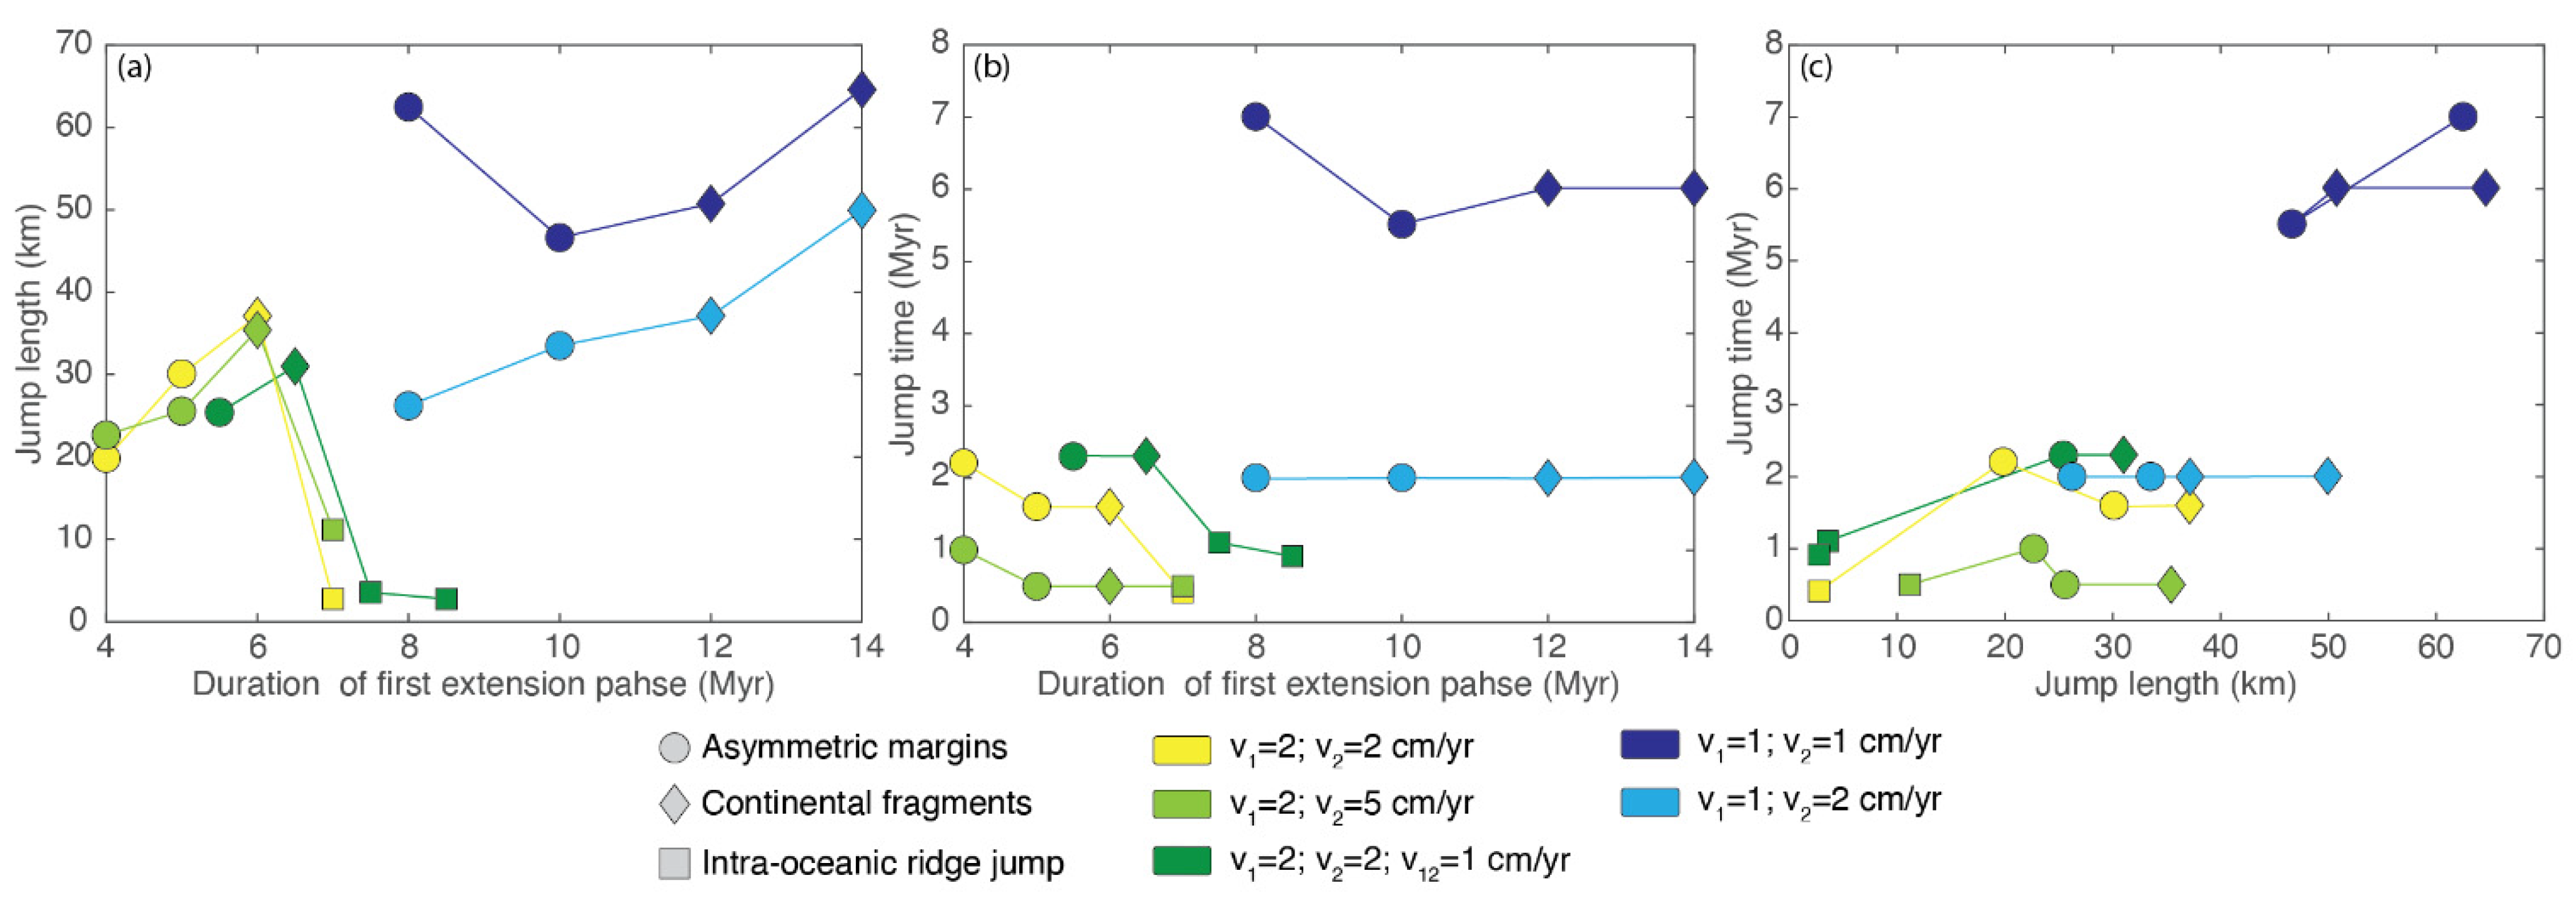
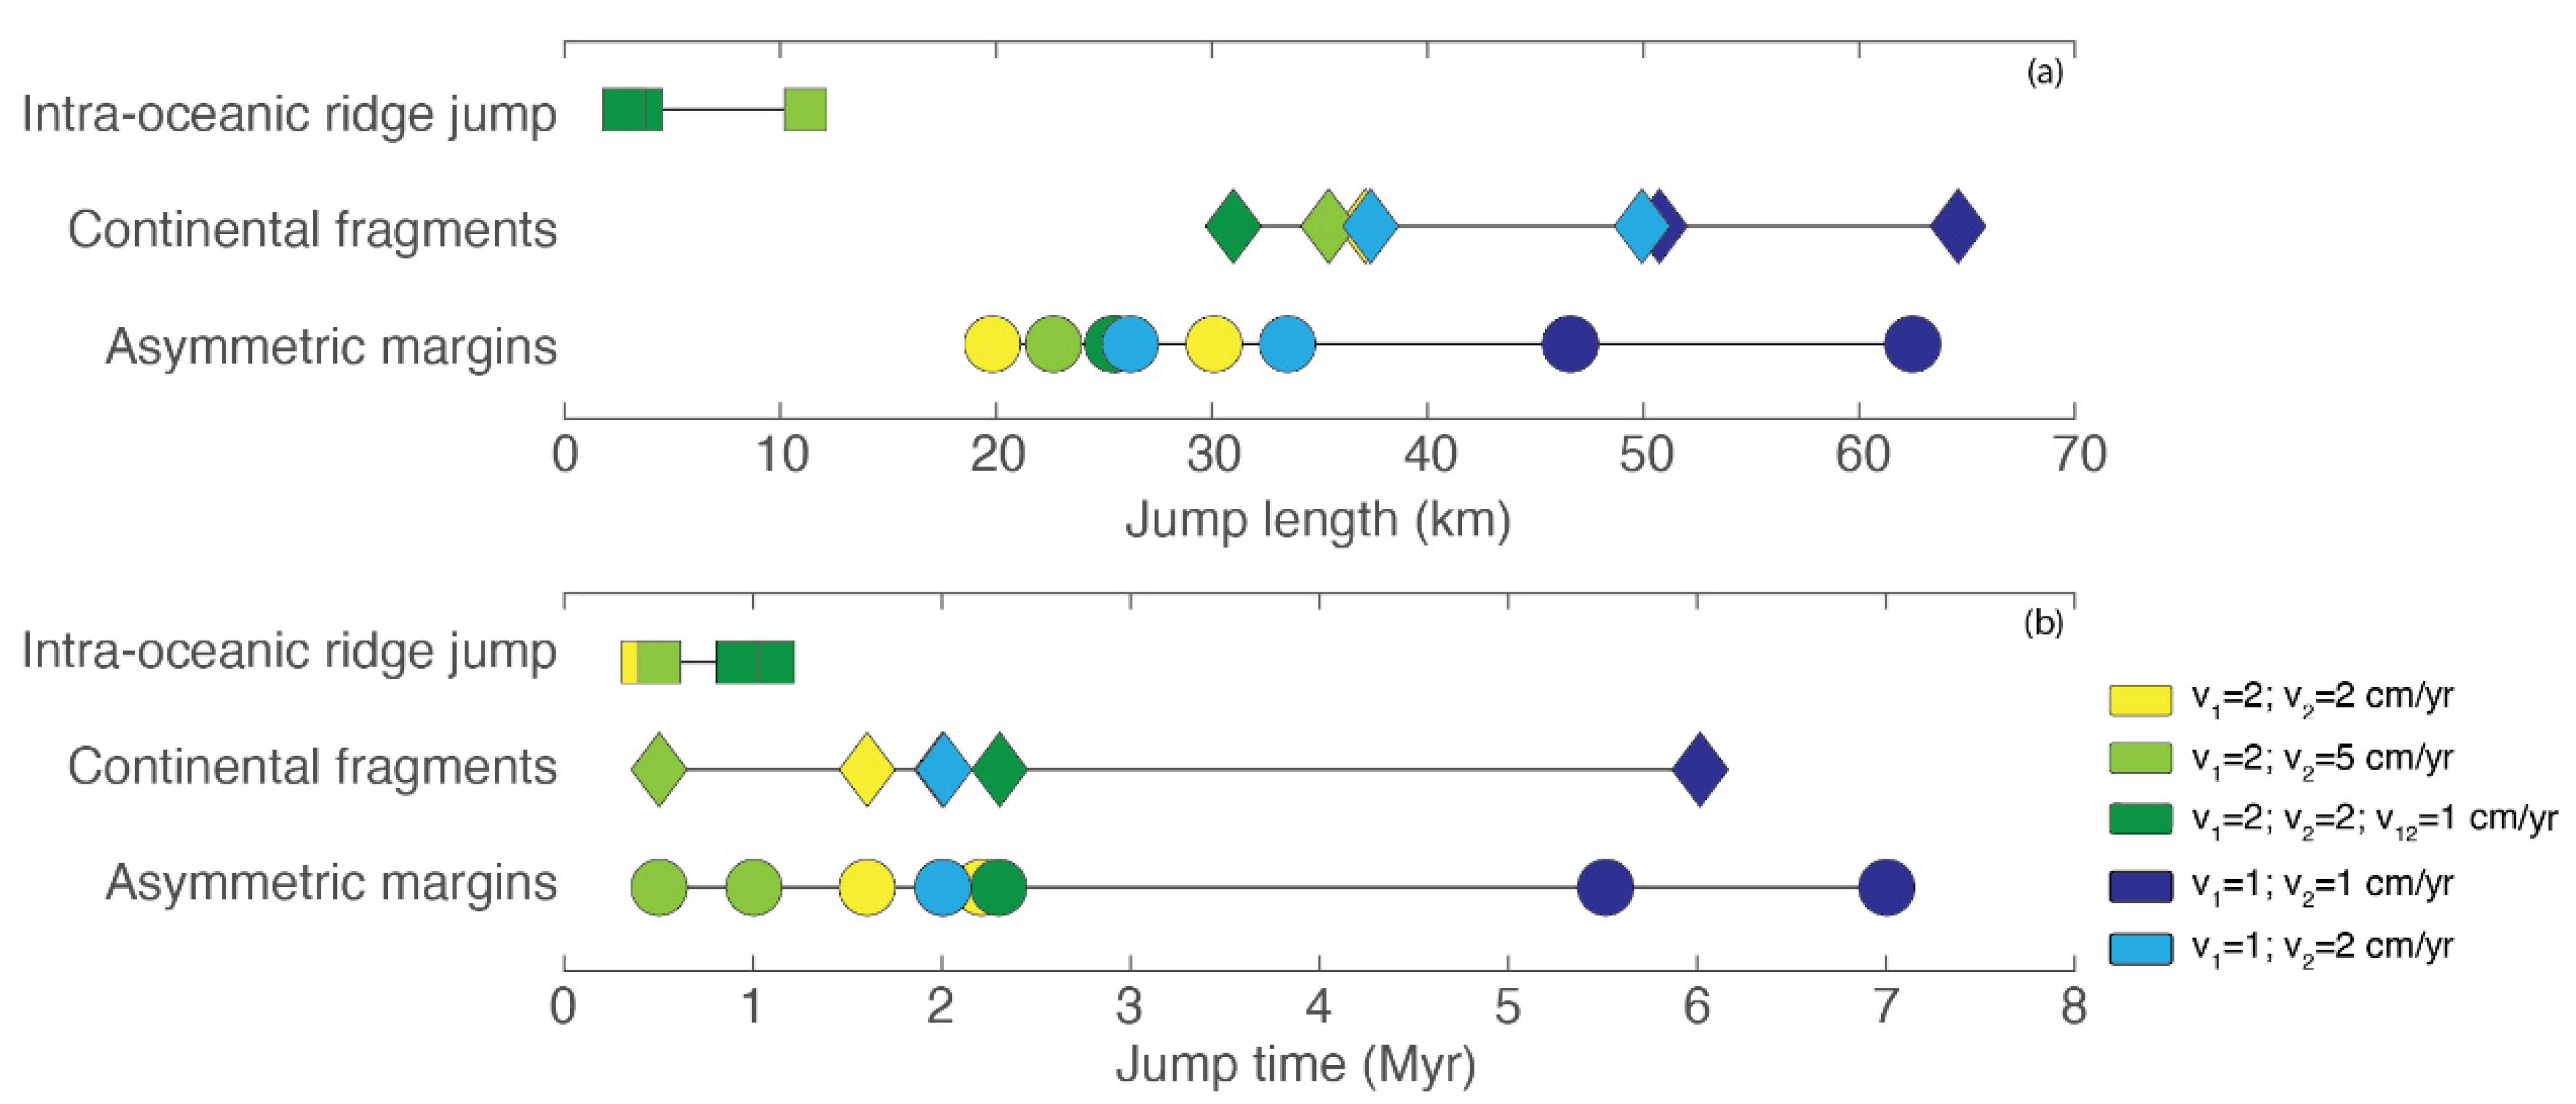
The time necessary to produce a new spreading ridge after the onset of the second extensional phase spans between 0.4 and 7 Myr, whereas the length of the jump ranges between about 1 and 65 km (
Figure 8). We observe the shortest jumps (<2 km) in the intra-oceanic ridge jump scenario and the fastest within each group of models with the same extensional velocities. The asymmetric margins scenario presents the largest range of values of both time (0.5–7 Myr) and length (23–62 km) of rift to ridge jumps. In the continental fragment scenario, the length of the jump is always >30 km. Models with the highest velocity in the second phase of extension show consistently shorter time of the ridge jump compared to the other models.
Generally, longer jumps require more time to occur, however this is more evident in models with low extensional rates. Importantly, extensional rate of the second phase controls the time of the jump: the lower the extensional rate, the longer it takes for a new spreading centre to occur, which is to be expected.
4. Discussion
Our numerical study shows that episodic extension exerts a first-order influence on rift and ridge jumps. In back-arc basins settings, discontinuous extension can be caused by episodic trench retreat and, more generally, by changes in subduction dynamics. In this work, we focused on the lithospheric scale deformation that leads to the formation of oceanic basins starting from a continental overriding plate. The initial dynamics of continental extension are similar to many previous numerical models that studied rifting processes [
31,
32,
34,
36,
40,
52]. Two important differences between these previous models and this study are the asymmetry and time-dependency of the velocity boundary conditions (similar to [
33]), which we use to simulate changes in trench retreat. Interestingly, although the imposed extension in our models is asymmetric, the final architecture of the margins is symmetric in some cases. Indeed, in the continental fragment formation and intra-oceanic ridge jump scenarios the margins of the basins are rather symmetric. However, we do observe asymmetric margins in models with the shortest first phase of extension, in which only one margin is hyperextended. Therefore, the largest asymmetry is not due to the boundary conditions, but it is created by the fact that jumps in extension location happens before the continent is fully broken up and the second extensional phase continues stretching continental material only at one margin. This is consistent with results from Brune et al. (2014) [
32] and Naliboff and Buiter (2015) [
33], who showed that rift migration can explain continental margin asymmetry. Moreover, this asymmetric geometry is found in basins, such as the Bransfield Strait, which is the back-arc basin of the South Shetland subduction zone (
Figure 1d). This is an example of a continental back-arc basin that is still at a rifting stage, which started about 4–5 Myrs ago, but close to the spreading phase, since magmatism is already active [
53]. Similarly to our models, the flanks of the basin are asymmetric, in that the margin close to the trench is steeper than the margin on the Antarctic side, which is more stretched [
54].
Rift and/or ridge relocation is a direct consequence of a period of no or little extension that allows cooling and thickening of the lithosphere after the first extensional phase [
55]. This process strengthens the lithosphere to a point that the first rift is not the weakest point any longer. Thus, when extension is resumed, deformation localizes somewhere else. Numerical models of multiphase extension by Naliboff and Buiter (2015) [
33] showed that it is the relative integrated brittle strength between the initial rift and the surrounding regions that controls the occurrence of rift migration. Relocation of the rift and/or ridge away from the trench occurs only in models with the slowest extension rate. van Wijk and Cloething (2002) [
55] suggested that when extension is very slow (<1 cm/yr), syn-rift cooling can play a role in basin migration. Thus, rift relocation in our models with slow extension is potentially also affected by this process in addition to the episodic extension, resulting, in some cases, in a jump on the opposite side compared to the rest of the models.
We find that only continuous and constant extension generates an oceanic basin completely floored with new oceanic crust. This is the case for the models with intra-oceanic ridge jump scenario, where the first phase of extension is long enough to form a large oceanic basin with continuous production of mantle melts. However, in subduction zones it is more common that extensional rates in the overriding plate change often and rapidly. In this case, we observe that the final structure of the basin is more complex than a ‘classic’ oceanic basin. Indeed, models in which ridge jumps occur within the continental lithosphere result in highly thinned continental lithosphere at the margin and exhumed mantle material inside the basin. Moreover, small pieces of continent can remain entrained between the old and new spreading ridge locations. It is, therefore, possible to find in back-arc basins an alternation of oceanic crust, exhumed mantle, and continental crust. This is in very good agreement with the structure observed in the basement of the Tyrrhenian Basin [
21] (
Figure 1a). We suggest that the episodes of fast and slow retreat of the Calabrian slab [
17] cause multiple basins to form (via ridge jumps) and allow mantle exhumation and continental fragment formation in the Tyrrhenian Basin. Moreover, in our models, magmatism is not only active during clear phases of spreading, but gradually decreases and increases again during the end of one extensional phase and the beginning of the next one, respectively. This can result in intrusive magmatism in the thinned parts of continental lithosphere, as it is the case in the Tyrrhenian Basin. The Southern Okinawa Trough (
Figure 1b) is another example of a basin floored with thinned continental crust intruded by magmatic bodies. A recent 15 km trenchward shift in location of magmatism observed in geophysical data [
25] could be linked to the onset of a new extensional phase (<2 Ma) after a ~4 Myr old pause [
24].
Model Limitations
Length and time of ridge jumps in the models are partly dependent on the rheological properties of the continental lithosphere, which feature large uncertainties. In our models, we observe jumps of the order of tens of kilometres. The distance observed within the different sub-basins in the examples reported above is in most cases larger. However, this can be due to the fact that the region experienced more extension since the moment the jump happened. Another factor that could affect the distance between the old and the new location of extension is the mantle flow associated to the slab dynamics. Although we model the flow of the mantle towards the trench by imposing asymmetric boundary conditions, this does not include the larger mantle flow that involves the entire upper mantle. It is also important to note that, although we impose a random initial field of heterogeneities, we do not model larger-scale pre-existing weaknesses that could be inherited from previous orogenesis. These structures can be reactivated during rifting and can control the final shape of the basin [
56]. van den Broek et al. (2020) showed that these inherited weaknesses might be responsible for formation of much larger continental fragments and micro continents, compared to what we observe in our models. Indeed, in this study we look at structures on a smaller scale that do not need pre-existing weak regions to form. Furthermore, lithosphere in back-arc settings is usually considered to be hotter than the typical continental lithosphere as a consequence of ongoing extension. In this work, we looked at how the lithosphere deforms from the onset of the extension without imposing a pre-existing hotter region. Ad hoc models with initially hotter geotherms and inherited structures could be used to study specific regions. Future 3D ad hoc models could also take into account changes in the direction of trench migration, hence in the direction of extension in the back-arc.
The calculation of melt production and volumes here is solely a postprocessing feature that does not have any feedback on the physical properties of the system. In reality, mantle melting would generate new oceanic crust and leave a depleted mantle. A rheology that takes into account the presence of new oceanic lithosphere could have an effect on the time and length of the ridge jumps in models that show a spreading ridge relocation within the same oceanic basin. Moreover, we do not consider the potential presence of fluids that derive from the vicinity to the slab that dehydrates at depth. The presence of fluids could increase the amount of melt produced at the back-arc and generate a thicker than average oceanic crust, as observed for instance in the Lau Basin [
57]. Finally, here we focus on extension located in the back-arc, but it is also possible that extension localises in the volcanic arc splitting the arc itself. Future work that includes all these complexities is needed, especially when looking at ridge jumps in oceanic back-arc basins.


