Whole-Rock Elemental and Sr-Nd Isotope Geochemistry and Petrogenesis of the Miocene Elmadağ Volcanic Complex, Central Anatolia (Ankara, Turkey)


Geological Engineering Department, Konya Technical University, Konya TR-42250, Turkey
Geosciences 2020, 10(9), 348; https://doi.org/10.3390/geosciences10090348
Submission received: 15 August 2020
/
Revised: 27 August 2020
/
Accepted: 31 August 2020
/
Published: 3 September 2020
(This article belongs to the Section Geochemistry)
Abstract
:This study presented whole-rock elemental and Sr-Nd isotope geochemistry data with the purpose to decipher the origin and evolution of the Miocene Elmadağ Volcanic Complex, Central Anatolia (Ankara, Turkey). Volcanic products spanned in composition from mildly alkaline basaltic (47–52 wt% SiO2) and medium- to high-K calc-alkaline intermediate (54–62 wt% SiO2; andesite to trachyandesite) to felsic (64–74 wt% SiO2; dacite to rhyolite) units. Despite a homogeneous major element composition, basaltic rocks were characterized by two distinct trace element and isotopic signatures, which have been correlated with different mantle sources. The first group of basaltic rocks was similar to those of oceanic island basalts (OIB) and was derived from asthenospheric mantle source. The second group had geochemical characteristics of orogenic basalts derived from subduction-modified lithospheric mantle source and represented parental magma of the intermediate to felsic rocks. By coupling geochemical and textural analyses of the rocks from the Elmadağ Volcanic Complex, I suggest that crystallization of olivine + clinopyroxene + apatite played an important role in the evolution of basaltic rocks, while plagioclase + amphibole + apatite + Fe-Ti oxides ± zircon crystallization was major process involved in the evolution of intermediate to felsic rocks. The EVC basaltic rocks were associated with the post-collisional extensional tectonic regime in the Central Anatolia, but the coexistence of the OIB-like volcanism implies variations in the extension dynamics during Miocene.
1. Introduction
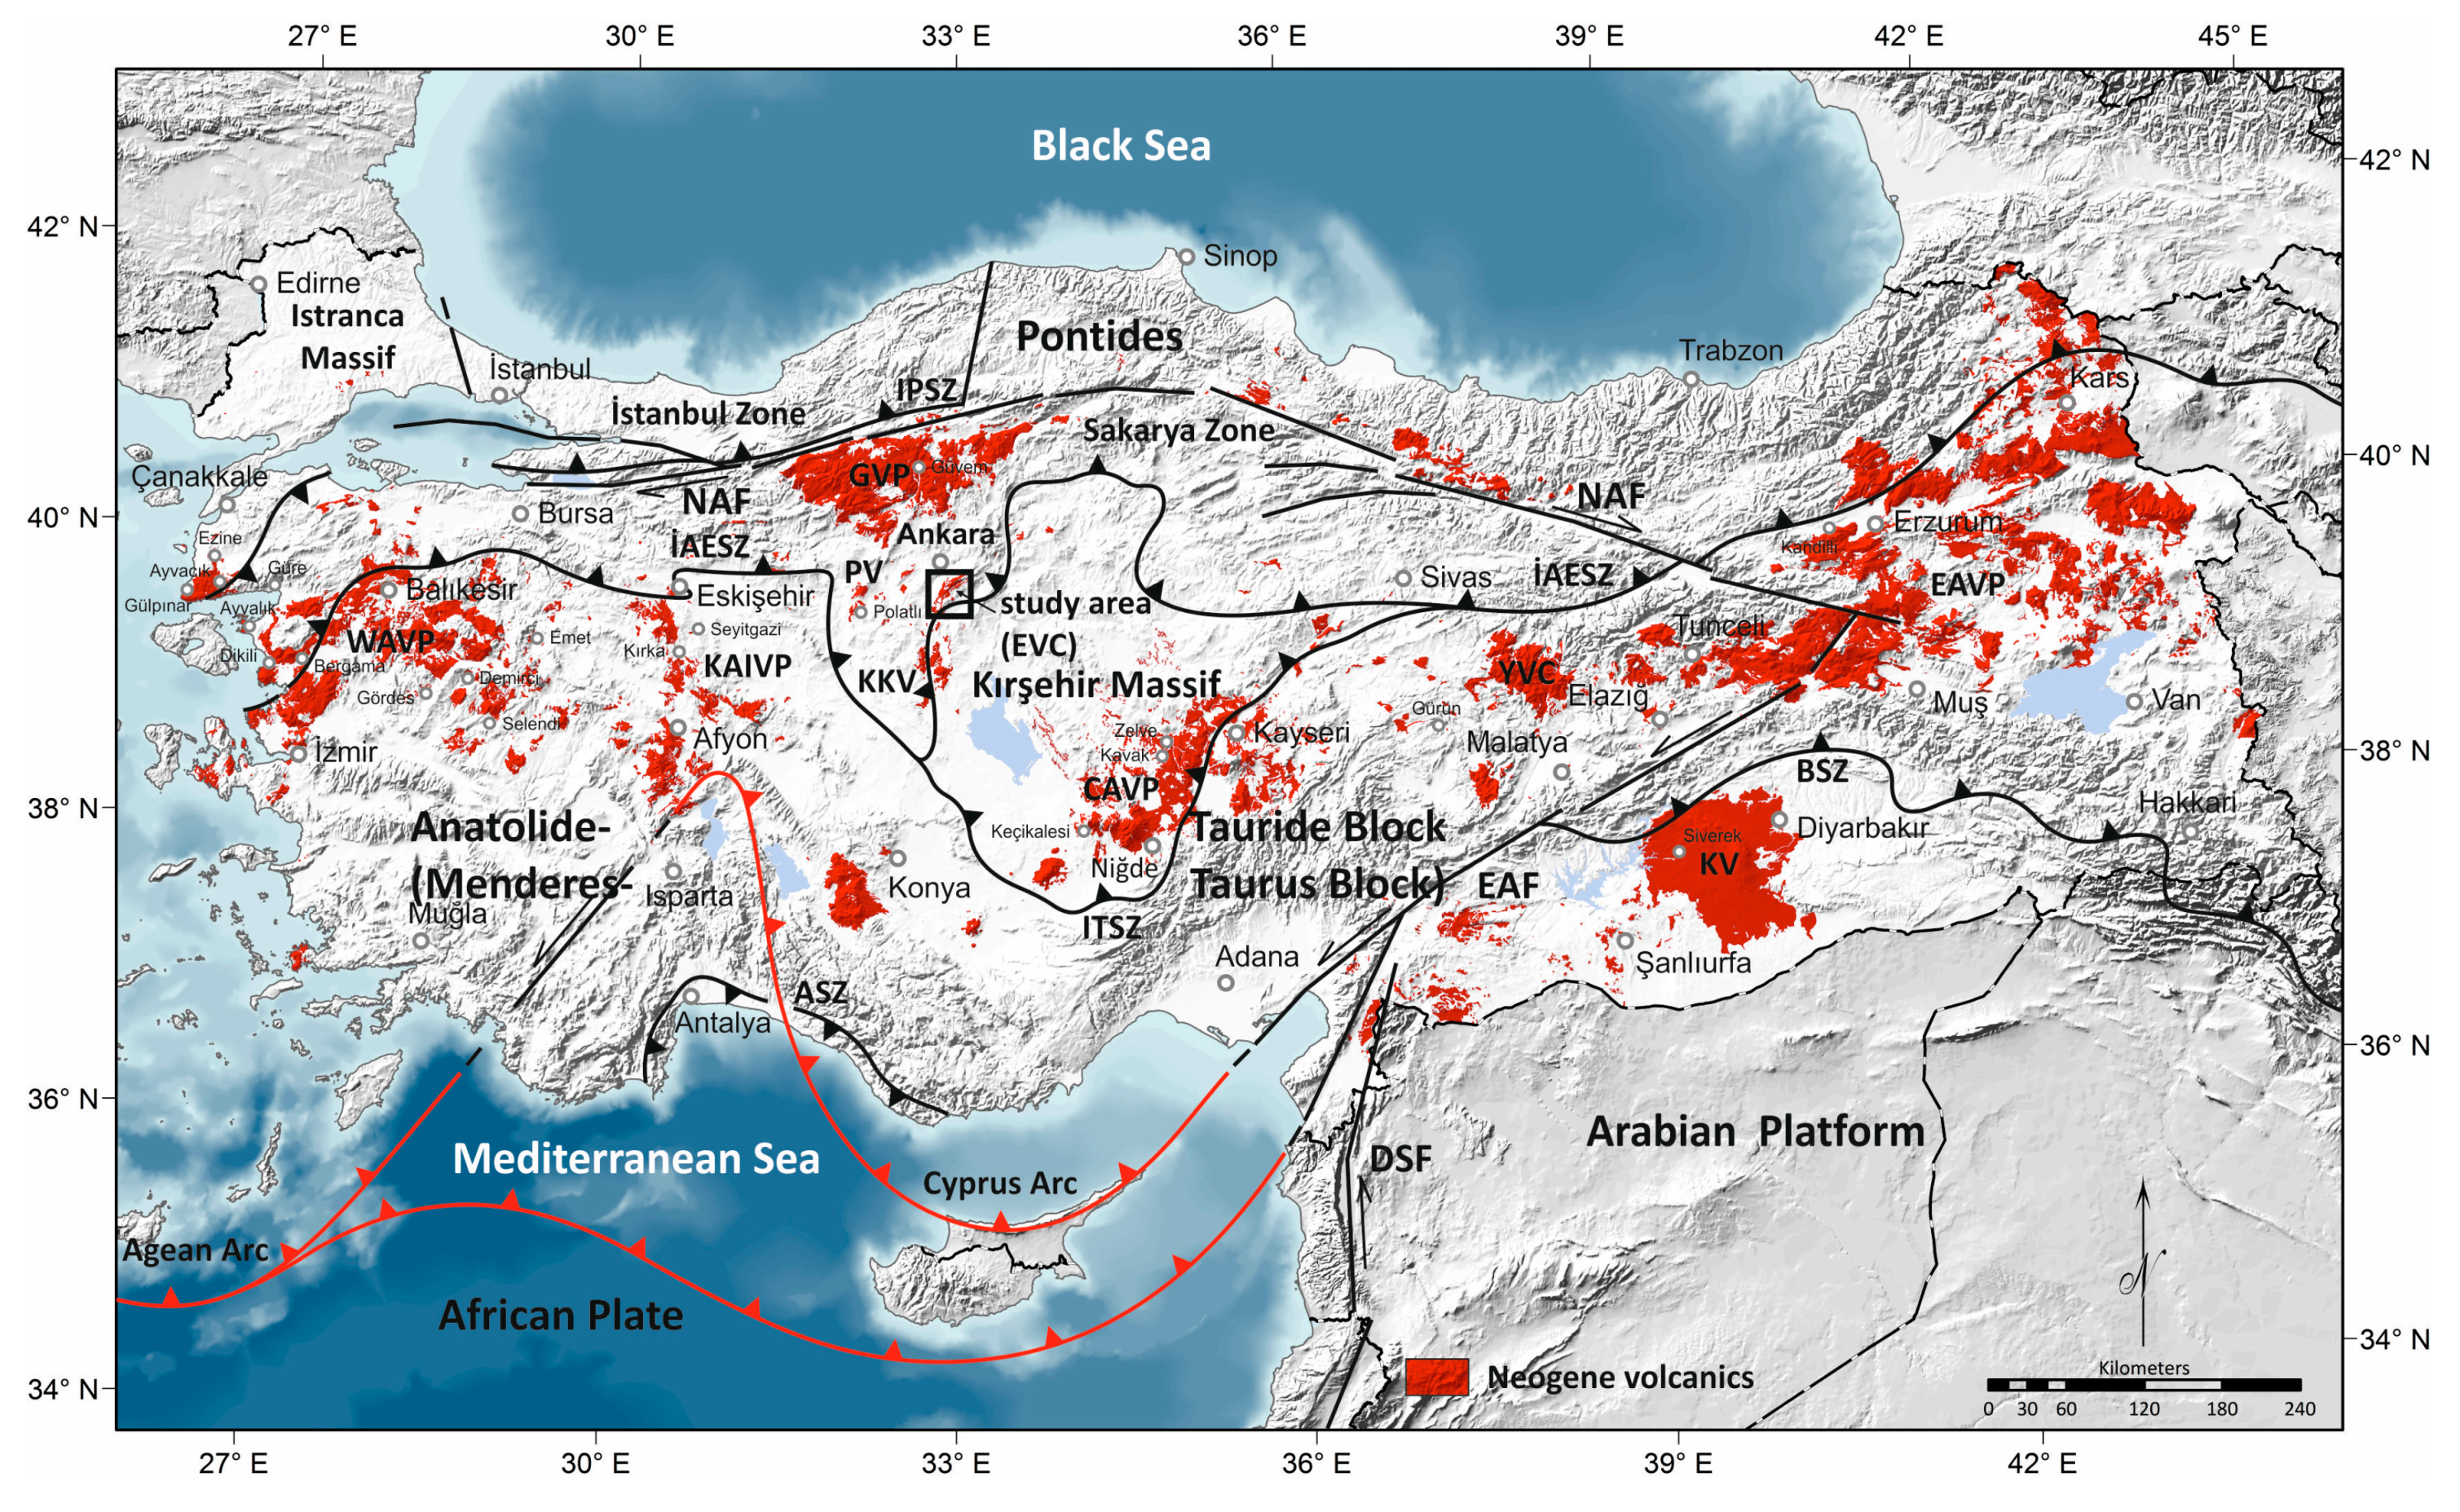
As a part of the Alpine-Himalayan orogenic belt, the Anatolia represents the amalgamation of four main tectonic units that were accreted along major suture zones (e.g., “Intra-Pontide”, “İzmir-Ankara-Erzincan”, “Inner Tauride”, “Antalya”, and “Bitlis” Suture Zones) during the closure of the various branches of the Neotethys Ocean [1,2,3,4,5,6,7] (Figure 1). Three of these tectonic units are simply called “the Pontides”, “the Kırşehir Massif”, and “the Arabian Platform”, but the fourth one was differently named by researchers as “the Anatolide-Tauride Block” or “the Menderes-Taurus Block” based on whether the controversial Inner Tauride Suture Zone exists. The İzmir-Ankara-Erzincan Suture Zone (İAESZ), which marks the boundary between the Pontides and the Anatolide-Tauride Block, is the result of the complete closure of the northern branch of Neotethys. The İAESZ is thought to represent the opening of an ocean during Early Triassic and the closing by northward subduction during Late Cretaceous to Eocene [3,5,6]. The floor of this ocean was generated mainly during Early Jurassic to Early Cretaceous. It was a fairly wide ocean, containing diverse environments of mid-ocean ridges, supra-subduction ocean floor, and numerous ocean-islands [3]. The İAESZ is the largest suture zone seen along the Anatolia and has a ca. 2000-km length from west to east. It separates the Sakarya Zone of the Pontides from the Kırşehir Massif and the various units of the Anatolide-Tauride Block. The İAESZ is strongly segmented, forming several major loops along its length, and includes various structures with a profound stratigraphic, structural, metamorphic, and magmatic break in the field. The final continental collision along the İAESZ was slightly diachronous and occurred in the earliest Palaeocene to the west and in the Late Palaeocene to the east [6]. The aforementioned oceanic closure-related plate tectonics was accompanied by widespread subduction to post-collisional volcanism throughout the whole Anatolia. In northwest Central Anatolia, the Elmadağ Volcanic Complex (EVC) and the other Miocene volcanic occurrences (i.e., Galatia Volcanic Province, Polatlı Volcanics, Kulu-Karacadağ Volcanics), which are mainly represented by extensive calc-alkaline intermediate to felsic rocks and subordinate Na-alkaline basaltic rocks, straddle the İAESZ (Figure 1), and therefore are thought to be characterized by post-collisional events [8,9,10,11,12,13].
Contrasting igneous suites were emplaced during the post-collisional period starting soon after the completion of the continent-continent collisional event. Two main suites have been identified in the post-collisional setting as “orogenic” and “anorogenic” rocks. The orogenic associations are represented by peraluminous silicic rocks to metaluminous mafic-felsic rocks, ranging from medium-K to high-K calc-alkaline to shoshonitic to ultrapotassic. On the other hand, anorogenic associations mainly include Na-rich OIB-like rocks and their differentiates [15]. Linked with the Alpine Orogeny, the orogenic and anorogenic rock associations are typical for the Mediterranean region, and there is a temporal sequence of two distinct types of igneous activity [16,17,18]. Although anorogenic activity mostly postdates the orogenic one in the Alpide Belt, an overlap between the two types of magmatic activity or the orogenic activity postdating the anorogenic cycle has also been recorded in rare cases [17]. As an example of the association of orogenic and anorogenic rocks, the Elmadağ Volcanic Complex (EVC) may be an ideal place to study such a temporal variation in magma geochemistry. The EVC is a Miocene volcanic field located near the İAESZ on the Pontides and is constituted of a large range of volcanic rocks, from basaltic to rhyolitic compositions. Although there have been published geochemical and geochronological data on the adjacent volcanic complexes (e.g., GVP and PV) belonging to the Pontides [10,11,12,13], few data have existed on the EVC rocks [19,20]. The present study was based on whole-rock major and trace elements and Sr-Nd isotope geochemical data from the effusive rocks of the EVC in order to establish its origin, evolution, and geodynamic setting.
2. Geology of the EVC and Its Basement
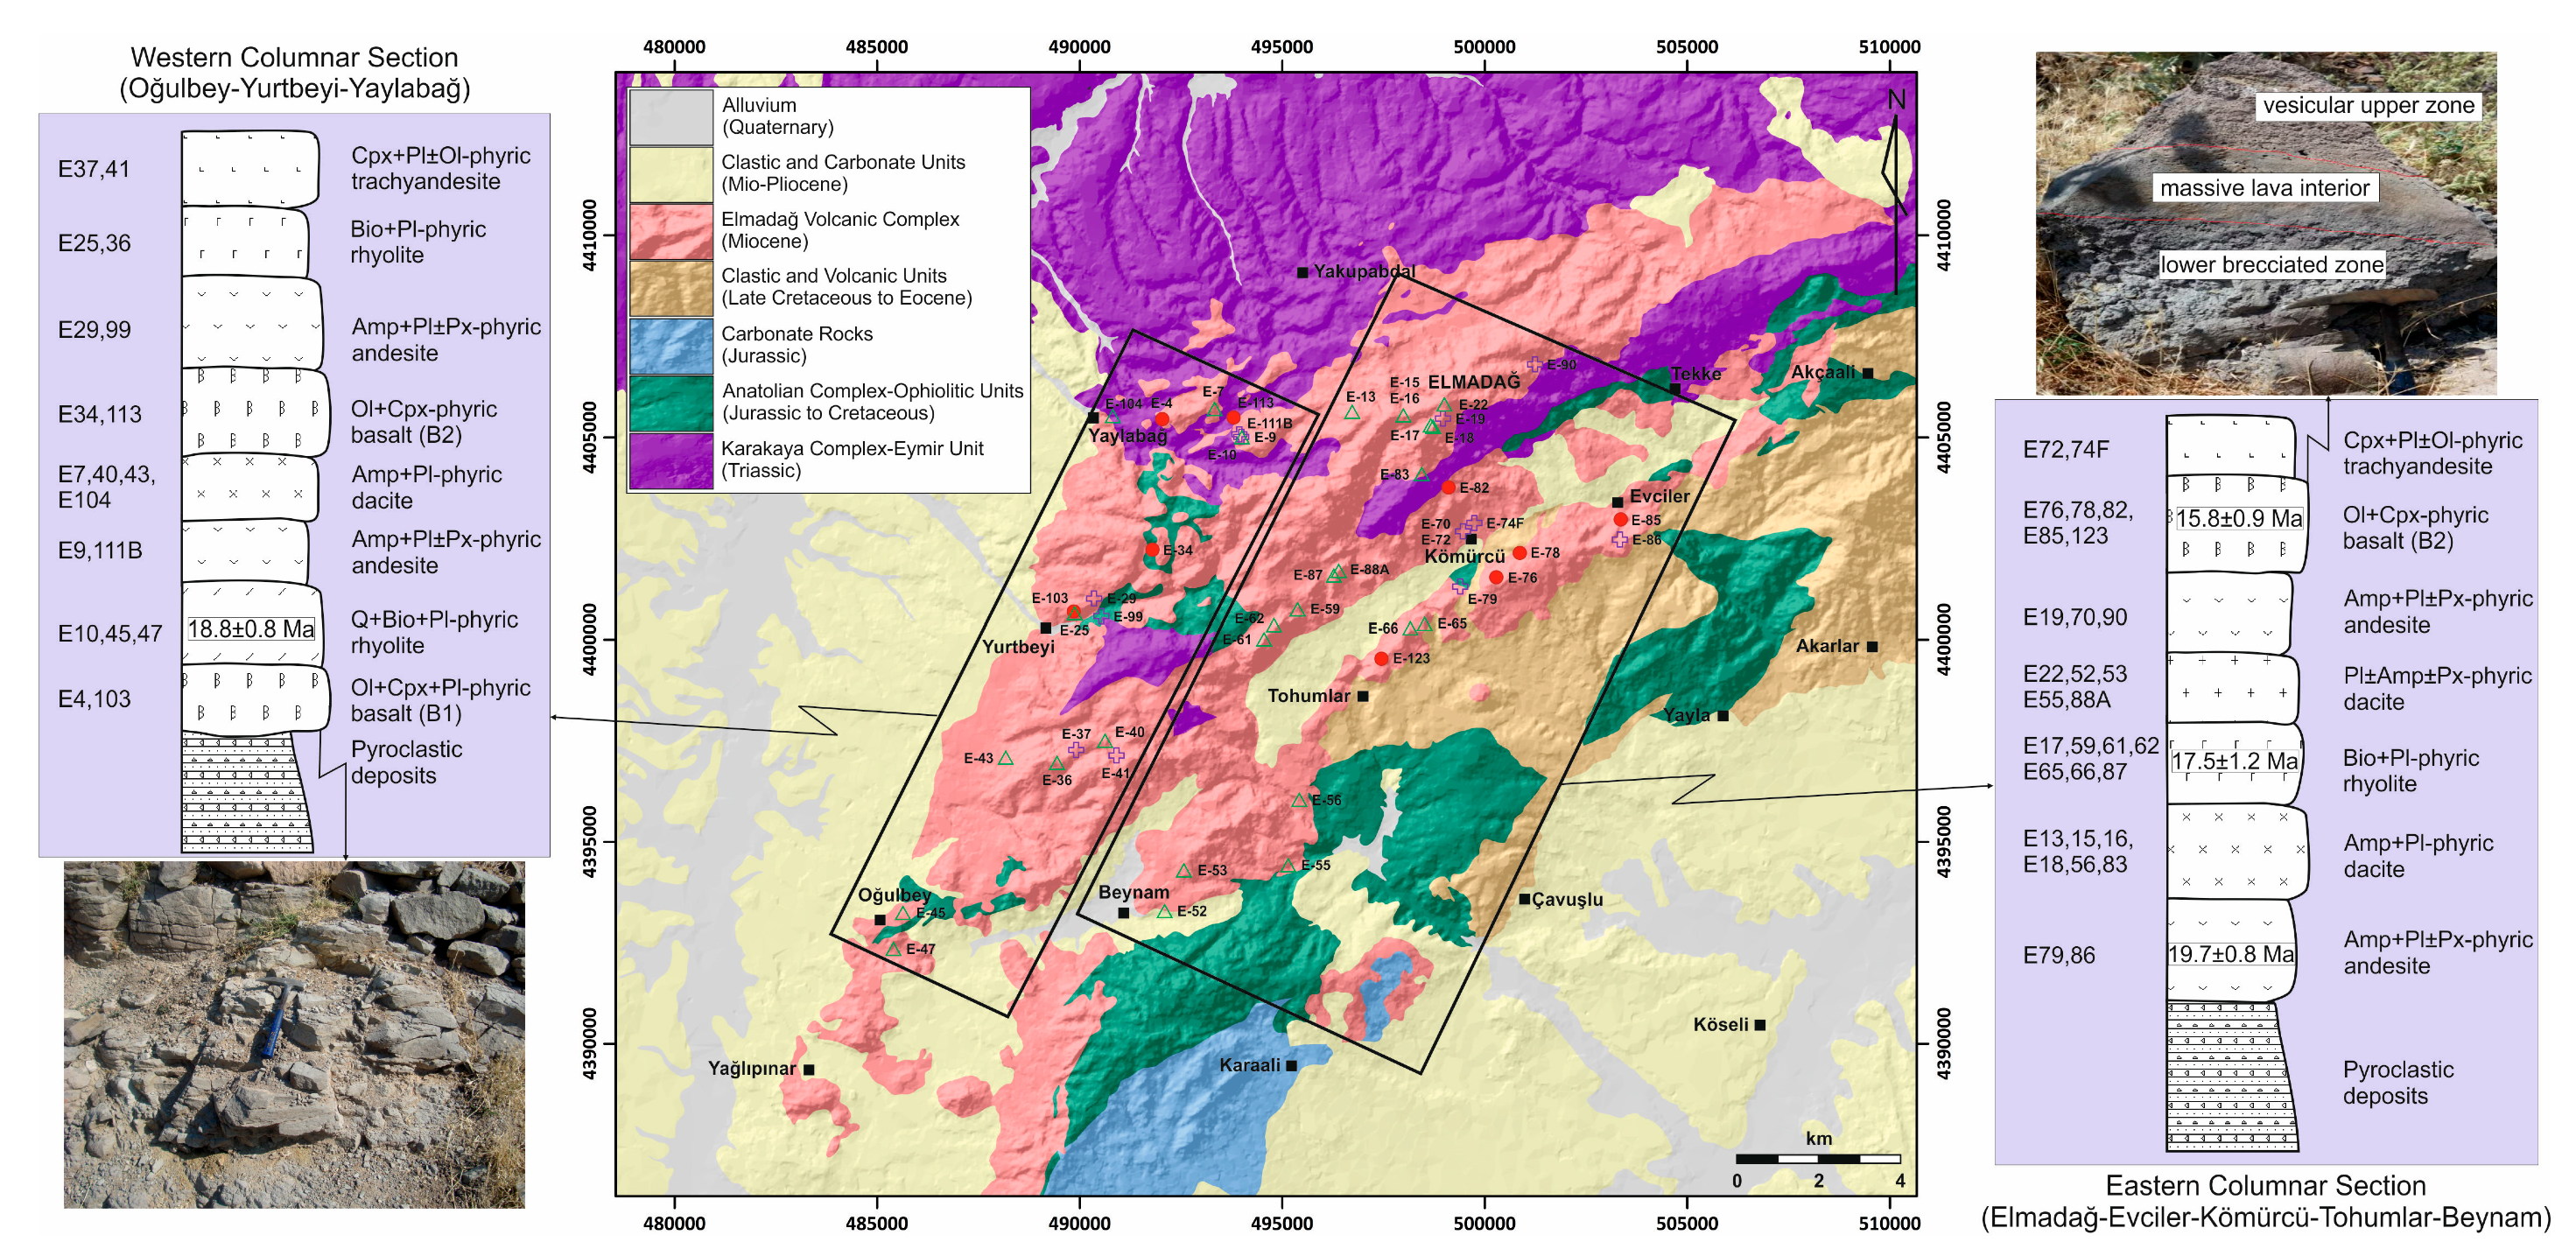
The Elmadağ Volcanic Complex (EVC) is a multicenter volcanic complex made of lava flows, domes, dikes, and pyroclastic deposits. The volcanic activity in the EVC started with the explosive eruption of pyroclastic deposits that can be found at the base of volcanic successions. In distal areas, the volcanic units are interbedded with sedimentary deposits, suggesting that their deposition was coeval. The EVC has a minimum areal extent of ca. 171 km2 (e.g., ~8 km2 of basaltic rocks and ~163 km2 of intermediate to felsic rocks) based on the known outcrop using ArcGIS. Although the EVC rocks display a broad range of composition from basalts to rhyolites, andesites and dacites are volumetrically dominant in the EVC. K-Ar dating indicates that the volcanic activity occurred during the Early to Middle Miocene (19.7–15.8 Ma) in the EVC [19]. The Early Miocene volcanic phase was the most intense, comprising of voluminous intermediate to felsic rocks associated with small volumes of basalts. In contrast, the Middle Miocene volcanic phase was mostly basaltic in composition. Field observations, together with the published radiometric age data, point out that basaltic volcanism was active from Early to Middle Miocene in the EVC. Although a systematic temporal variation does not exist among the lavas of the EVC, in general, the volcanic succession tends to be more basaltic toward the top, which is consistent with the published radiometric age data. Two types of basaltic flows were identified in the field in terms of their stratigraphic position and internal structures, which are termed as B1 and B2 basalts throughout the article. B1 basalts are seen at the base of volcanic sequence and form massive lava flows with well-developed joints (Figure 2, western columnar section). On the other hand, B2 basalts are located to the top of the sequence and are characterized by three zones (i.e., lower brecciated zone, massive lava interior, and vesicular upper zone), resembling those of Aa flows (Figure 2, eastern columnar section). Based on the mineral- and whole-rock major/trace element chemistry, Görmüş [20] argued that the EVC rocks show both alkaline and calc-alkaline affinity, and their parental magmas were generated by 2 to 10 melting of the spinel lherzolite lithospheric source, and fractional crystallization, magma mixing, and crustal assimilation processes played a role in the evolution of the volcanic rocks. He also suggested that the EVC rocks have a subduction-related origin as a result of collision of the Sakarya Zone of the Pontides and Kırşehir Massif. Around the EVC, Paleozoic to Neogene rock units crop out (Figure 2). The Karakaya complex forms the basement of the EVC. Considered as a tectonic/sedimentary melange that comprises several tectonostratigraphic units, the Karakaya Complex represents the subduction-accretion units of a Permo-Triassic and possibly older Palaeo-Tethyan ocean [5,21,22]. The variably deformed and metamorphosed clastic rock assemblages known as “Eymir Unit” are widespread around the study area as a part of the Karakaya Complex. The Triassic-aged Eymir Unit is composed of greywacke and arkosic sandstone intercalated with shales (or their metamorphic equivalents) [23]. The Eymir unit metaclastics were intruded by diabase dikes with the back-arc basin signature [22]. The Jurassic-Cretaceous Anatolian complex, comprising various ophiolitic units, is tectonically related to the pre-Liassic Karakaya units. The Anatolian complex is overlain by the Karakaya units, but it tectonically overlies the cover of the Karakaya complex [24]. This basement is unconformably overlain by Late Cretaceous to Eocene sedimentary units formed as a forearc basin along the Northern branch of Neotethys [25,26,27] and by Neogene sedimentary and volcanic rocks.
3. Materials and Methods
For petrographic and geochemical analyses, 130 lava samples were collected from the EVC. After petrographic examination of the collected samples, a representative subset of the freshest samples was selected for whole-rock geochemical analyses (49 samples for major and trace elements, and 21 samples for Sr-Nd isotopes). Analytical results are given in Tables S1 and S2.
Following removal of weathered surfaces, samples were crushed in a jaw-crusher, and then powdered in an agate ball mill for whole-rock major, trace, and rare earth elements, and Sr-Nd isotope analyses. Major elements were analyzed by inductively coupled plasma atomic emission spectroscopy (ICP-ES), following a lithium borate fusion and dilute acid digestion of a 0.2-g sample pulp. Trace and rare earth elements were determined by inductively coupled plasma mass spectroscopy (ICP-MS) from pulps after 0.2-g samples of rock powder were dissolved by four acid digestions at the ACME Laboratories (Canada). In-house standards (e.g., Reference Materials STD SO-18, and STD OREAS45CA) were analyzed together with the samples, and they were used for the calibration of the dataset. Quality Control (QC) data including the analyzed standard materials were also given in Table S1. Based on replicate analyses on the reference materials, precision was estimated to be better than 1% for major elements and 5% for trace and rare earth elements, except for few trace elements (e.g., better than 10% for Th, Mo, Pb, Zn, and Ni).
Sr and Nd isotopic analyses were carried on ~100 mg of bulk sample powders in Class 1000 clean rooms at the GEOMAR (Germany). The powders were weighed in Teflon beakers and digested in a solution of concentrated ultra-pure HF and HNO3 at 150 °C for 60 h. Ion chromatography was carried out following the procedures of Hoernle and Tilton [30], Geldmacher et al. [31], and Hoernle et al. [32]. After chemical purification and separation, samples were dried again for later plasma-mass-spectrometry measurements. Before loading into the multicollector inductively coupled plasma mass spectroscopy (MC-ICP-MS), the samples were dissolved again in 5% HNO3. All isotope measurements were performed on a Nu Plasma MC-ICP-MS NP059 following usual protocols. The used standards are JNdi-1 (143Nd/144Nd = 0.512115, Tanaka, et al. [33] and NBS 987 (87Sr/88Sr = 0.710248, McArthur, et al. [34]). The measured Nd isotopic composition was corrected for instrumental mass bias to 146Nd/144Nd = 0.7219 applying an exponential mass fractionation law. Over the course of this study, the average JNdi-1 εNd value was determined to be -10.2 ± 0.4 (n = 10, 2 standard deviations of the mean, 2σ). The measured Sr isotopic composition was corrected for instrumental mass bias to 86Sr/88Sr = 0.1194. The average NBS 987 value measured during the course of analytic sessions resulted in 0.710243 ± 0.000006 (n = 10, 2σ), which is statistically indistinguishable from the accepted value of 0.710248.
4. Results
4.1. Petrography
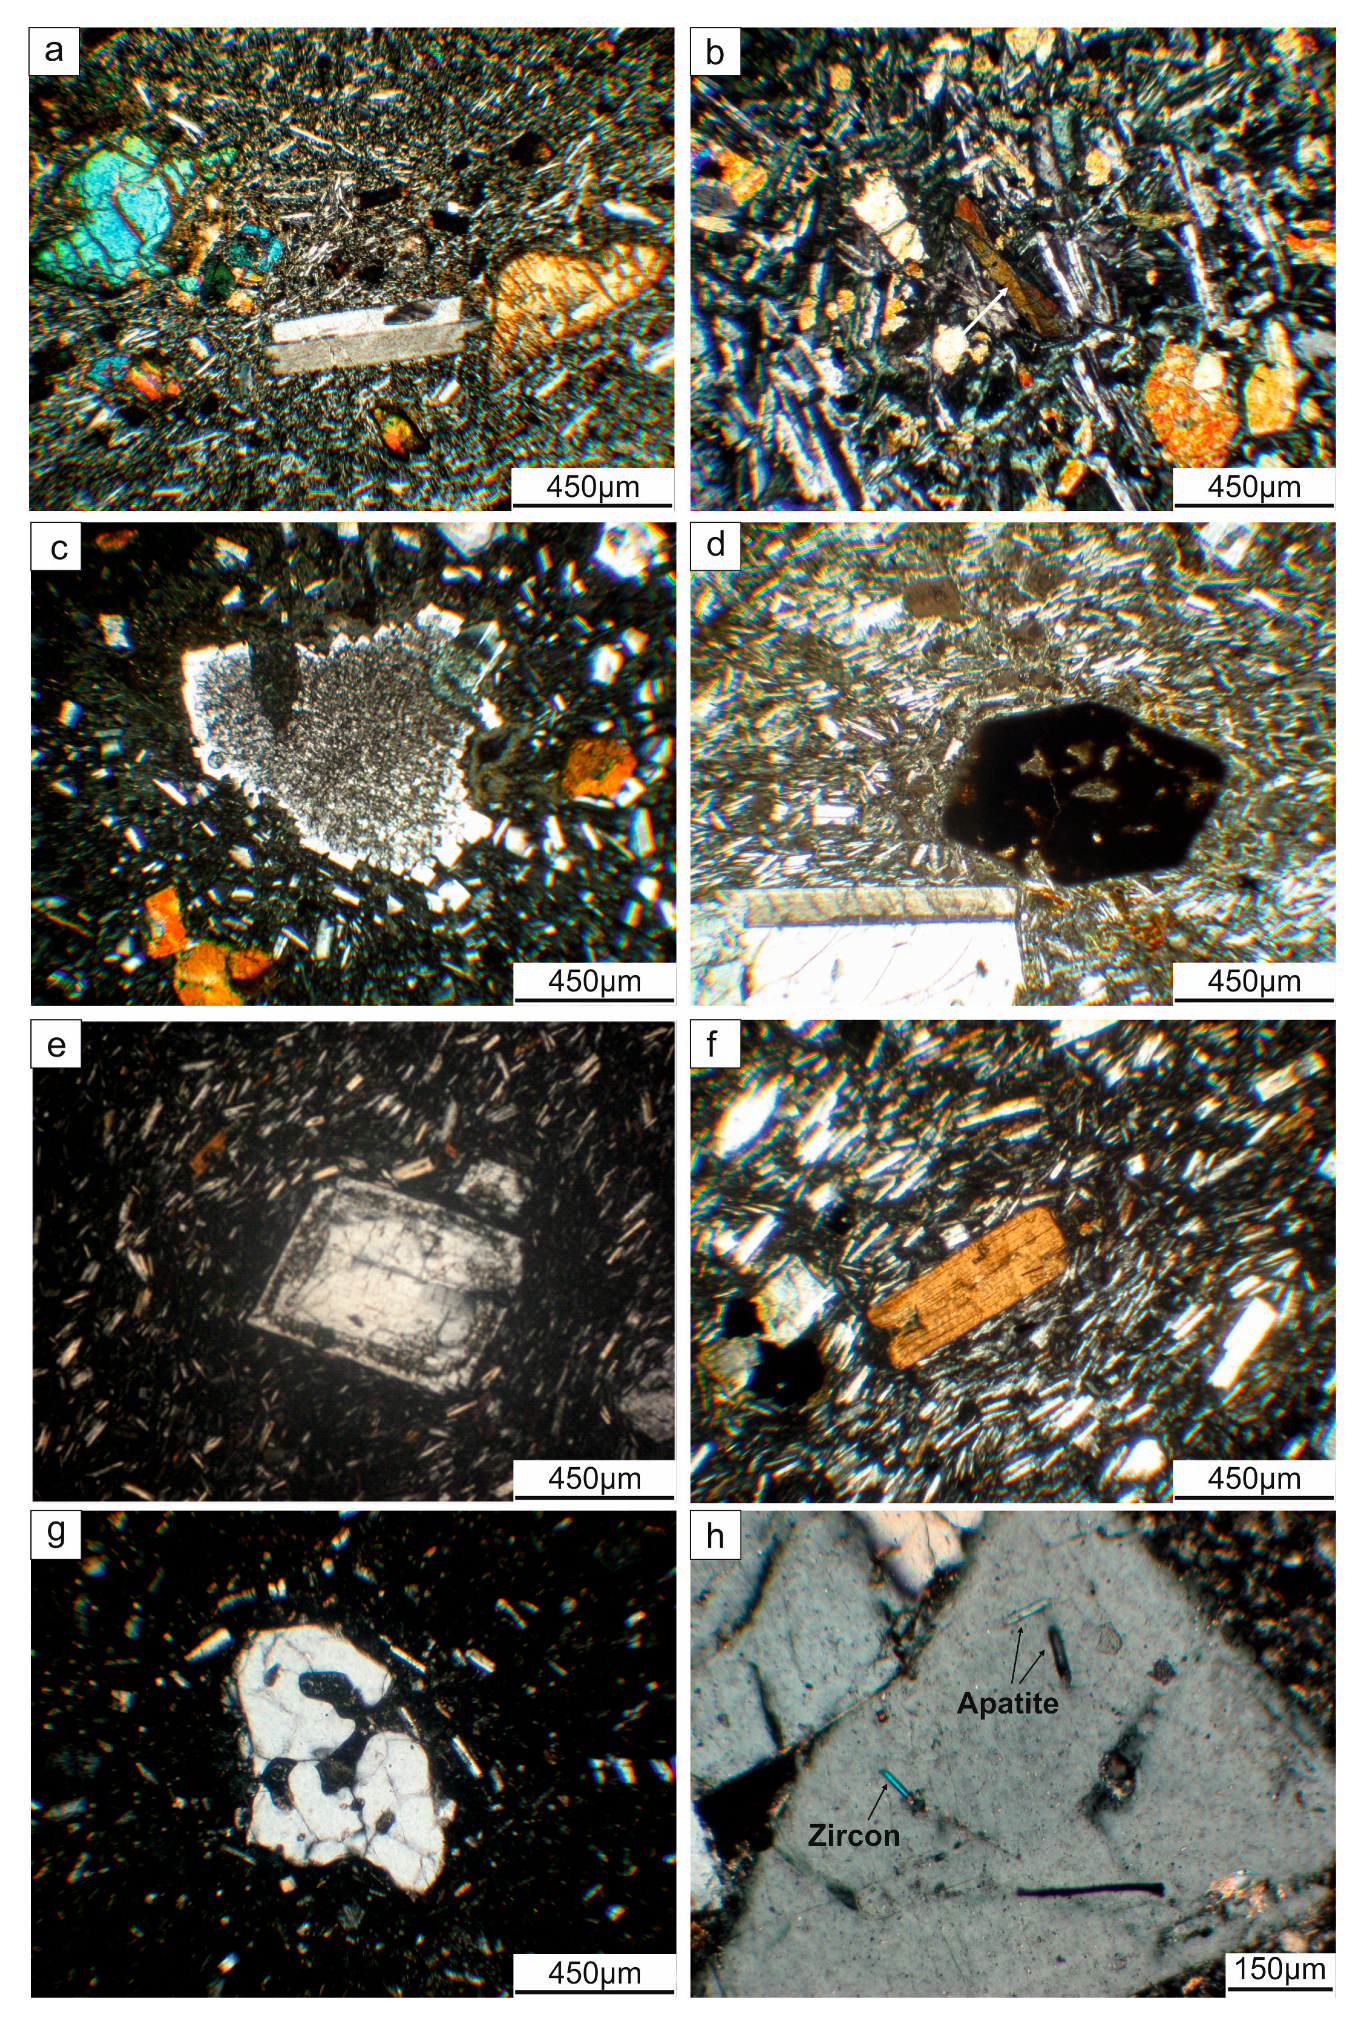
B1 and B2 basalts were represented by different textural features and phenocryst mineralogy. B1 basalts showed porphyritic texture with olivine, clinopyroxene, and plagioclase phenocrysts embedded in a fine-grained microlitic groundmass including Fe-Ti oxide, plagioclase, and clinopyroxene (Figure 3a). B2 basalts included olivine and clinopyroxene phenocrysts (without or with rare plagioclase phenocryst) in an intergranular to trachytic, well-crystallized groundmass dominated by medium grained lath-shaped plagioclase with clinopyroxene, Fe-Ti oxides and rare K-feldspar (Figure 3b). B1 and B2 basalts were mainly characterized by subhedral to euhedral, unzoned, unresorbed, and unsieved crystal populations, although “disequilibrium” (see end of this section for definition) crystal forms were also occasionally present.
Intermediate rocks were characterized by aphyric to slightly porphyritic textures with plagioclase (Figure 3c), amphibole (Figure 3d), clinopyroxene, and rare orthopyroxene, olivine (iddingsitized) and Fe-Ti oxide phenocrysts. Groundmass was glassy to microlitic with trachytic textures, and made up of mainly plagioclase, and lesser clinopyroxene and Fe-Ti oxides. Disequilibrium textures were widespread in the EVC intermediate lavas.
Felsic rocks showed textures ranging from slightly to strongly porphyritic textures. They were mainly composed of phenocrysts of plagioclase (Figure 3e), biotite (Figure 3f), amphibole, Fe-Ti oxides, and rare quartz (Figure 3g), K-feldspar, and orthopyroxene in a glassy to microlite-rich groundmass, with hyalopilitic and rare felsitic textures. Accessory phases (e.g., zircon and apatite) were widespread in felsic rocks (Figure 3h). Similar to intermediate rocks, felsic rocks sometimes displayed disequilibrium textures.
Textural features of volcanic rocks and their minerals carry a lot of messages sent from magma chambers because minerals respond texturally and compositionally to changing magmatic environments [35]. Thus, the EVC rocks showed many textural features that can be attributable to magmatic processes. The textural features of the EVC basaltic rocks were mainly dominated by monotonous, unzoned, and euhedral crystal populations (Figure 3a,b). However, the intermediate to felsic rocks show textural features as in the basaltic rocks but also showed complex textural features called “disequilibrium textures.” The disequilibrium textures observed were zoning, resorption, or sieve textures, reaction rims, mineral pseudomorphs, and overgrowths on existing minerals, and were recorded in plagioclase, amphibole, and clinopyroxene phenocrysts. Three different populations of amphibole phenocrysts were observed in the EVC intermediate to felsic rocks: (1) Green to brown euhedral, clear, and unresorbed phenocrysts; (2) brown subhedral to euhedral phenocrysts surrounded by tiny opaque reaction rims, (3) anhedral resorbed and opacitized amphibole pseudomorphs (Figure 3d). All three textural types also showed zoning and could be found in the same sample. The juxtaposition of amphiboles showing such distinct textural features in the same sample implies magma mixing [36]. Plagioclase phenocrysts displayed a wide range of textures characterized by zoning, resorption, or sieve textures and overgrowths. Some phenocrysts were rounded with an anhedral appearance by resorption. Various sieve-textured plagioclase phenocrysts were commonly seen in the intermediate to felsic rocks (Figure 3c,e). Of these, some plagioclases had a spongy appearance in their cores but mantled by euhedral overgrowths in their rims. Although such textural features can be attributable to decompression [37], most researchers advocate magma mixing for this [38,39,40]. Clinopyroxene phenocrysts from the intermediate rocks sometimes showed zoning and spongy textures due to resorption, similar to those of plagioclase. They show also anhedral resorbed cores surrounded by euhedral growth. Taken as a whole, disequilibrium textures observed in the EVC intermediate to felsic rocks suggest that most of the phenocrysts were not in equilibrium with their host melts as a response to changing temperature or composition in the magmatic conditions.
4.2. Whole-Rock Geochemistry
4.2.1. Major Elements and Chemical Classification
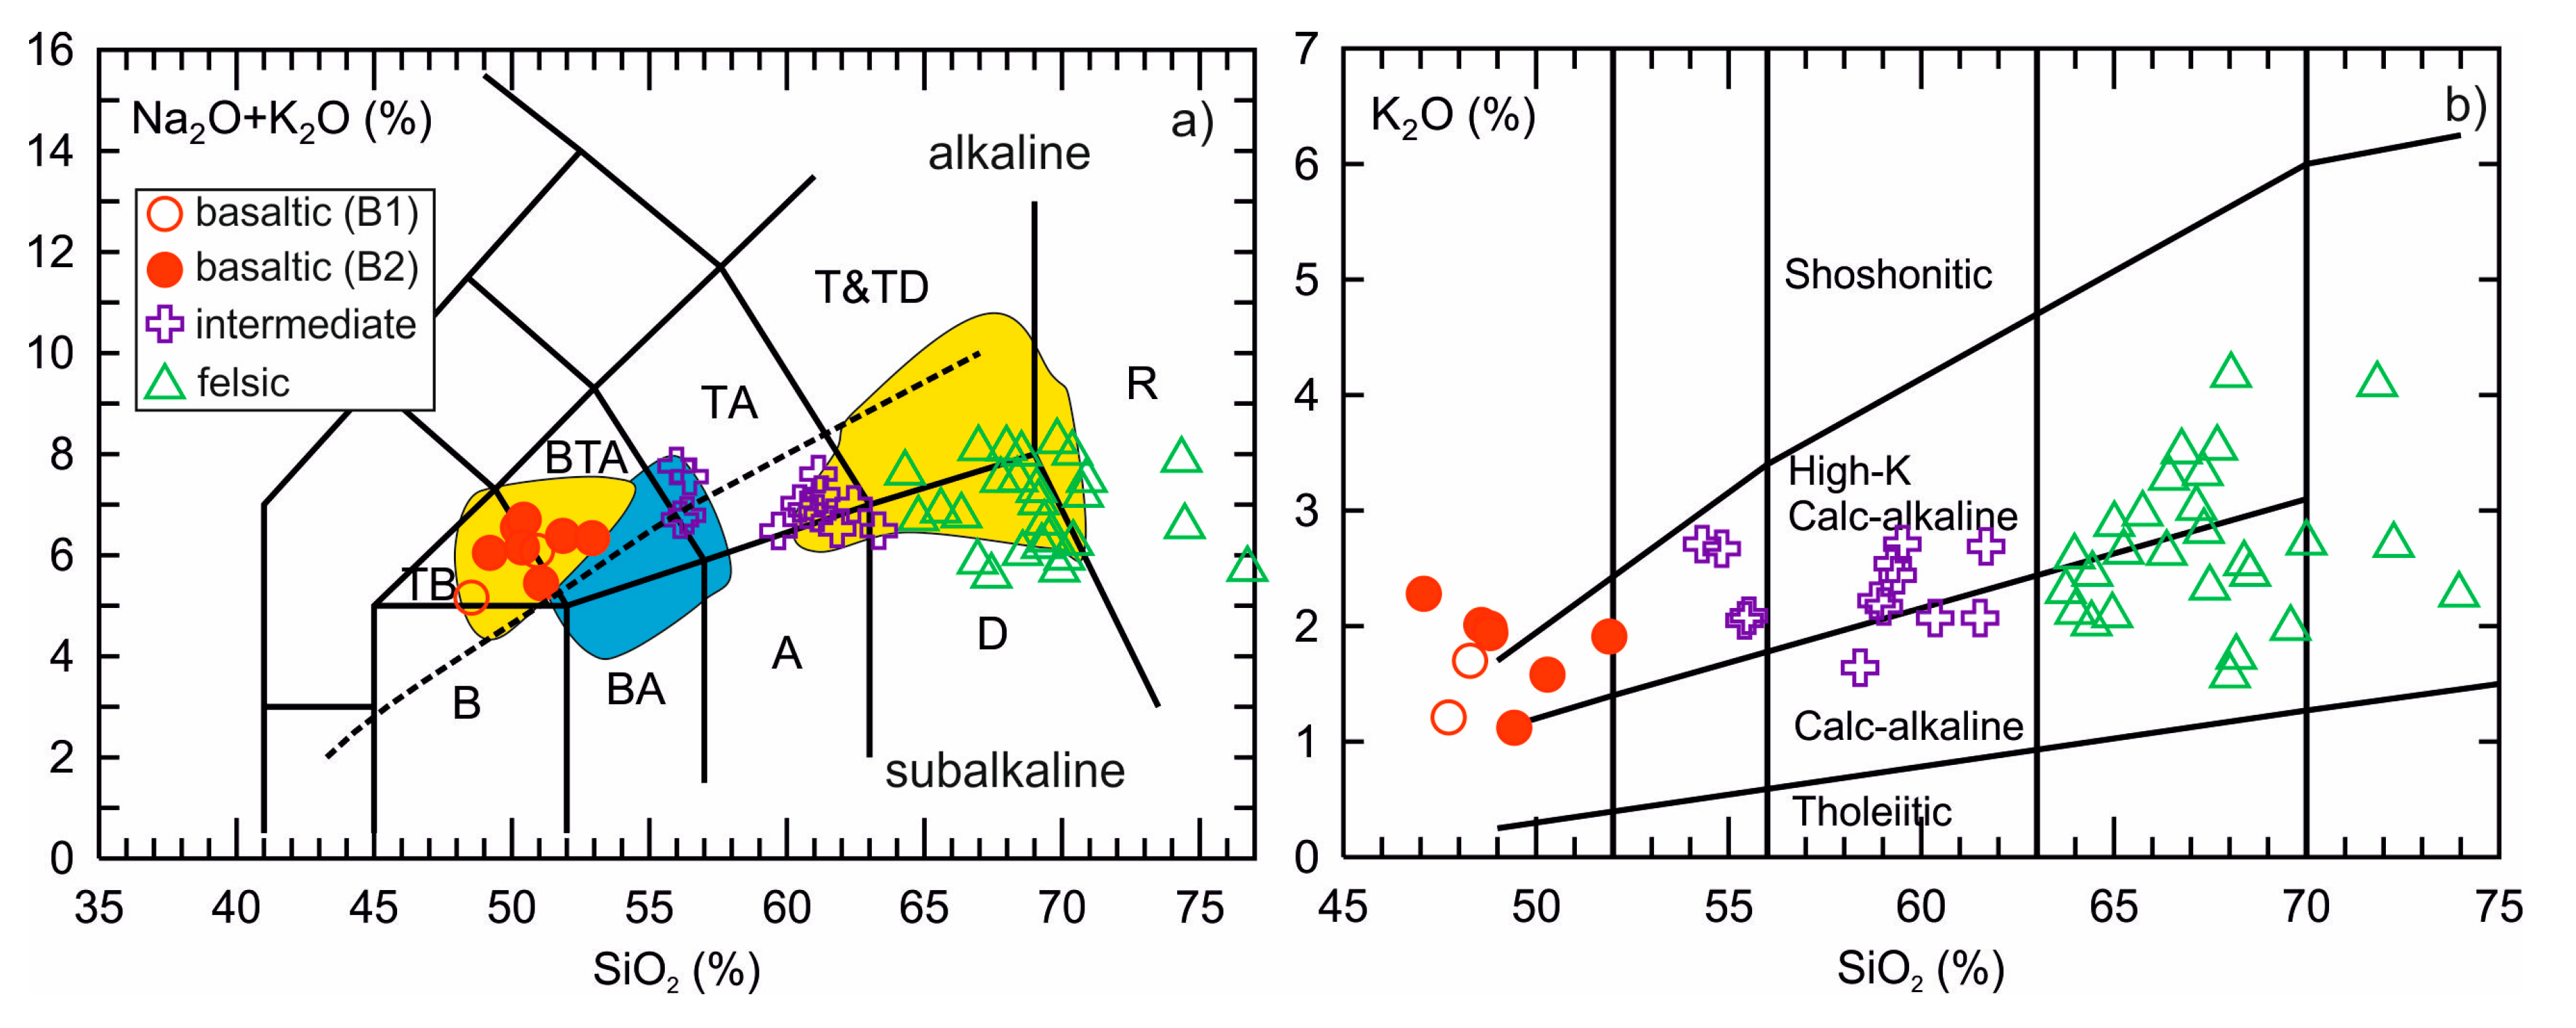
The EVC rocks spanned in composition from basalts (47 wt% SiO2) to rhyolites (74 wt% SiO2) (Table S1). The EVC basaltic rocks were characterized by a large compositional range (47 wt% to 52 wt% SiO2 and 4.0 wt% to 8.0 wt% MgO), and in the TAS diagram (Figure 4a), they were plotted into trachybasalt to basaltic trachyandesite fields. The EVC intermediate rocks (54 wt% to 62 wt% SiO2) were andesites and trachyandesites and formed chemical link between basaltic and felsic compositions. The EVC felsic units (64 wt% to 74 wt% SiO2) were represented by dacites and rhyolites. The basaltic rocks and few intermediate compositions were (sodic) alkaline, while part of the intermediate and all the felsic rocks were subalkaline (Figure 4a). The EVC rocks mainly straddled the boundary between medium-K and high-K calc-alkaline fields in the K2O vs. SiO2 diagram, but some basaltic rocks were plotted in shoshonitic field of this diagram (Figure 4b).
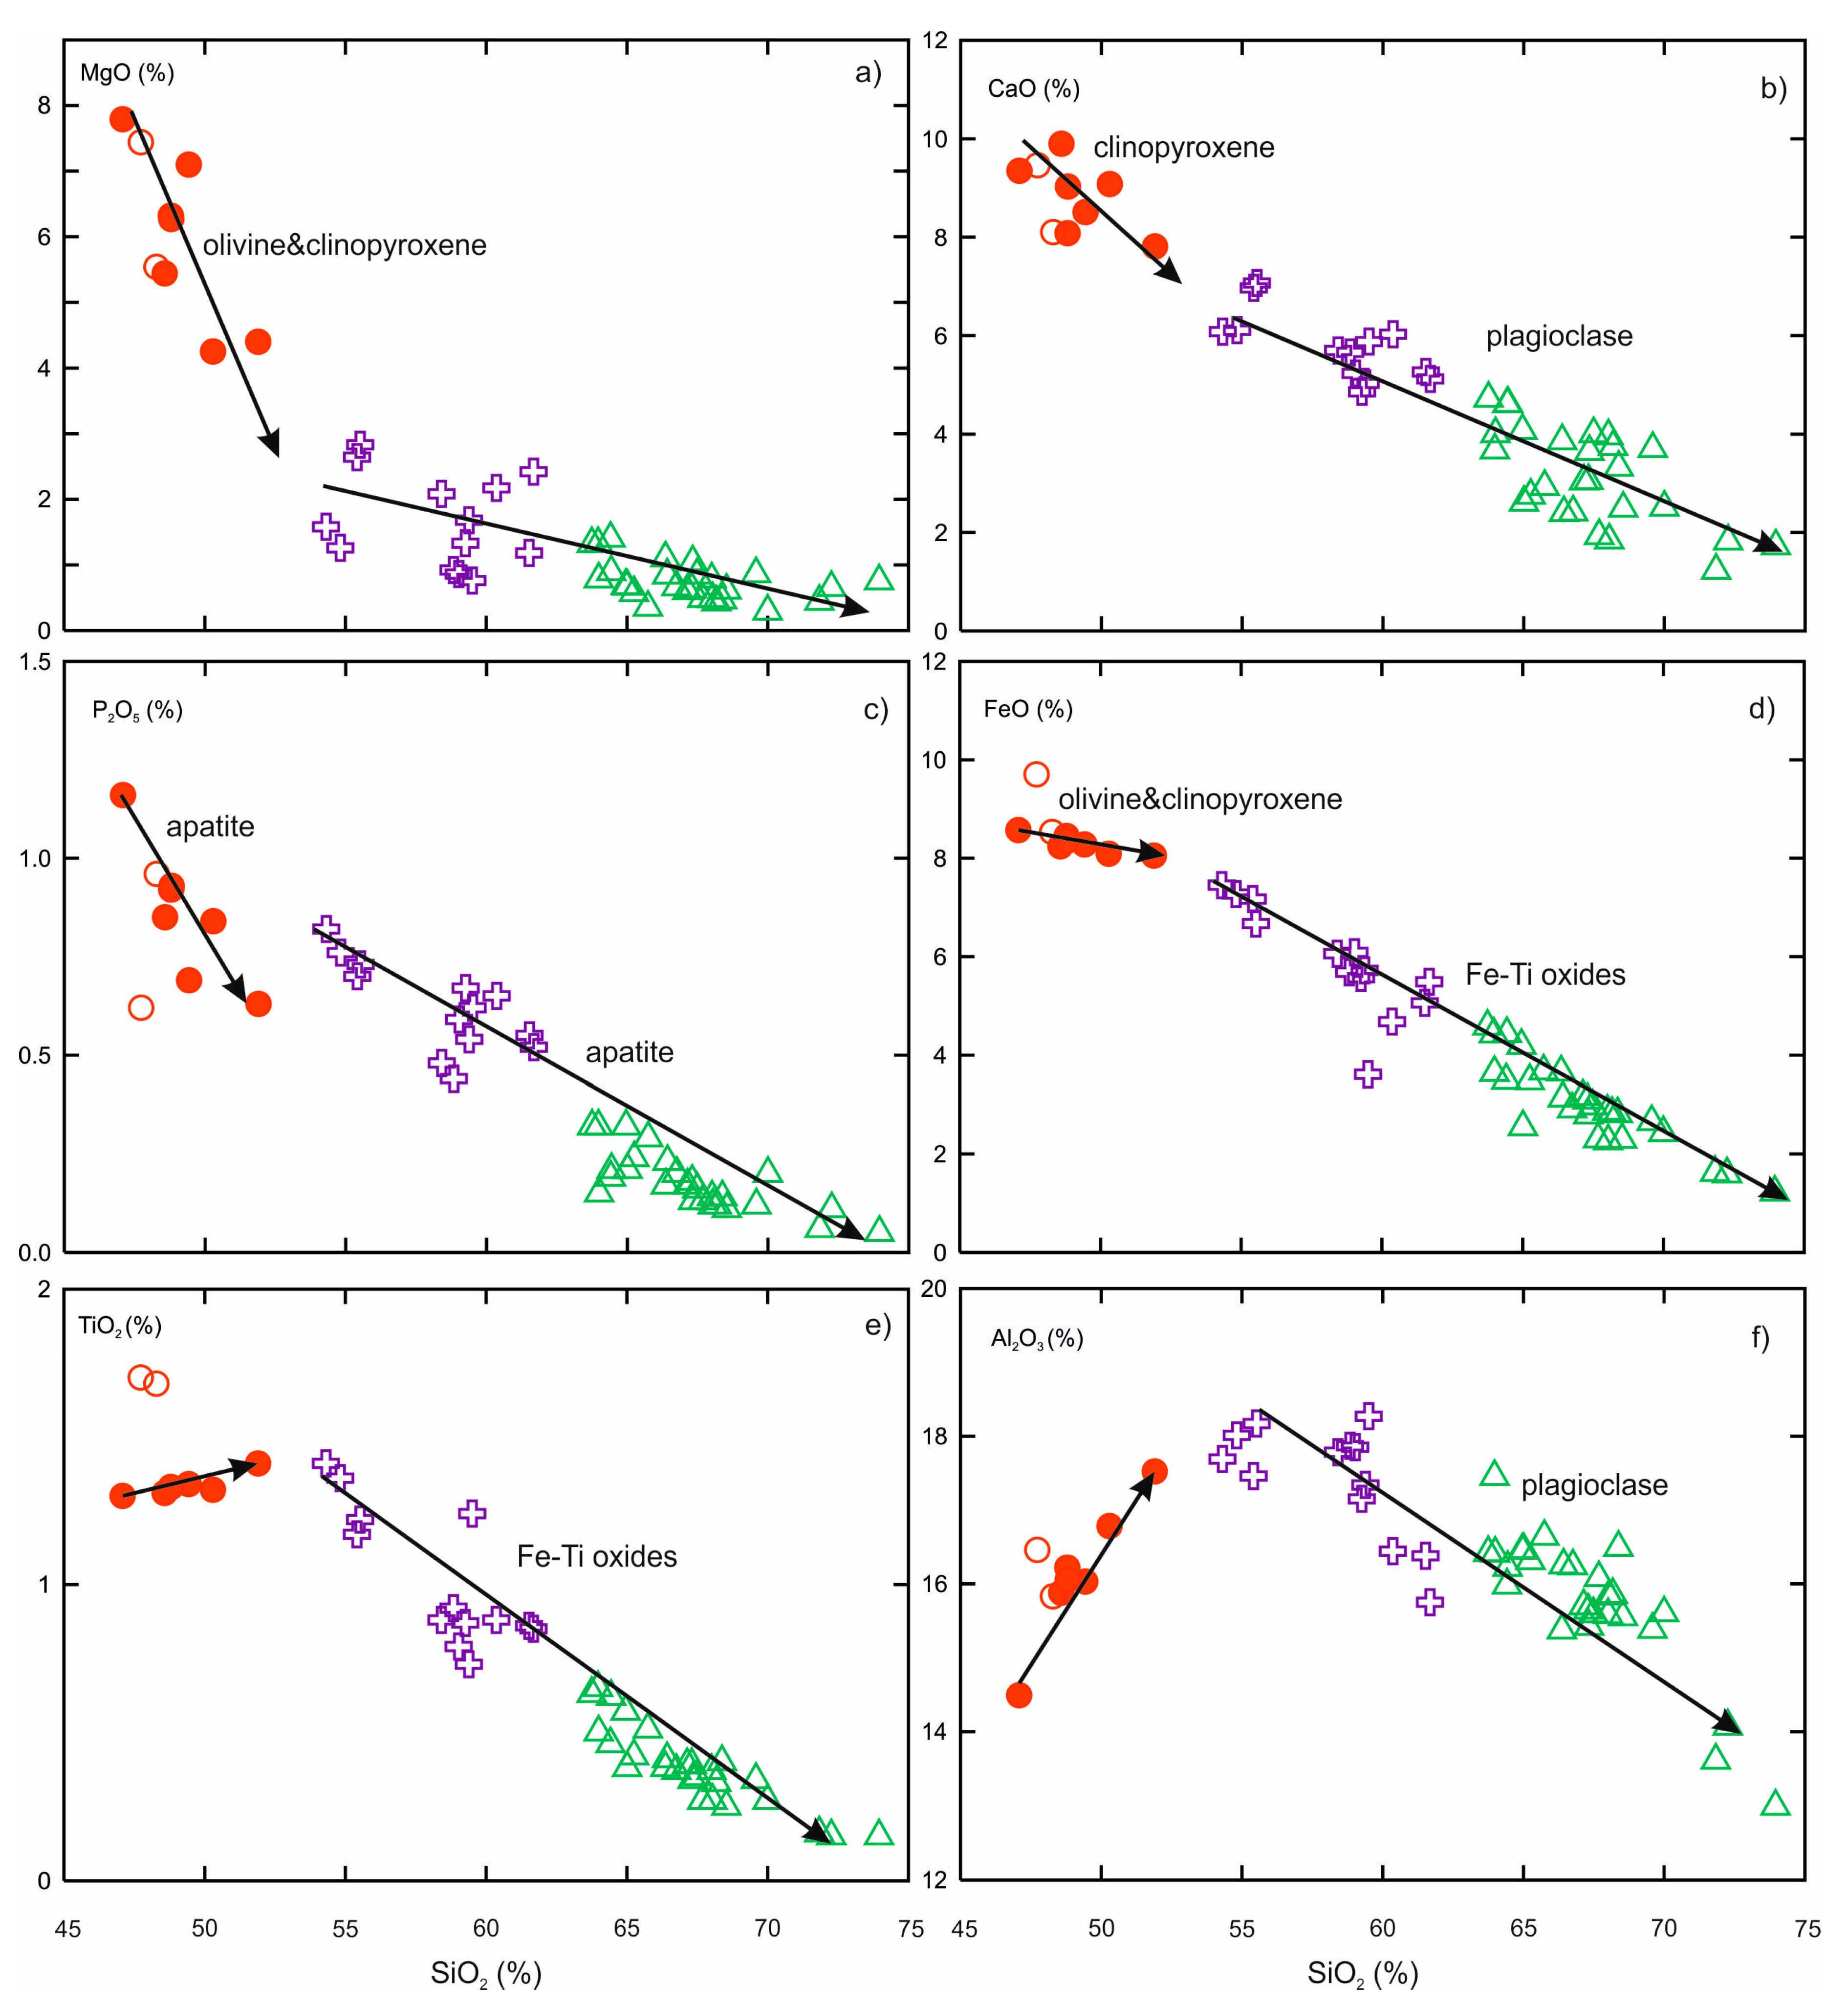
Harker-type major element variation diagrams (Figure 5) showed straight linear, curved, or inflected trends with progressive differentiation, from basalts to rhyolites. These diagrams were characterized by two different trends of evolution between basaltic and intermediate to felsic lavas. The SiO2 vs. MgO plot displayed a curved negative trend with a sharp MgO decrease for basaltic rocks, but MgO varied relatively little for intermediate to felsic rocks (Figure 5a). CaO and P2O5 moderately decreased in the basaltic range, then they sharply decreased in the intermediate to felsic compositions (Figure 5b,c). SiO2 vs. FeO and TiO2 variations were characterized by straight linear decreases in the intermediate to felsic compositions, but their variations in the basaltic range showed a flat trend or slightly increased except two basalt samples (Figure 5d,e). The SiO2 vs. Al2O3 plot showed an increasing trend in the basaltic range, then decreased in the intermediate to felsic compositions (Figure 5f).
4.2.2. Trace Elements
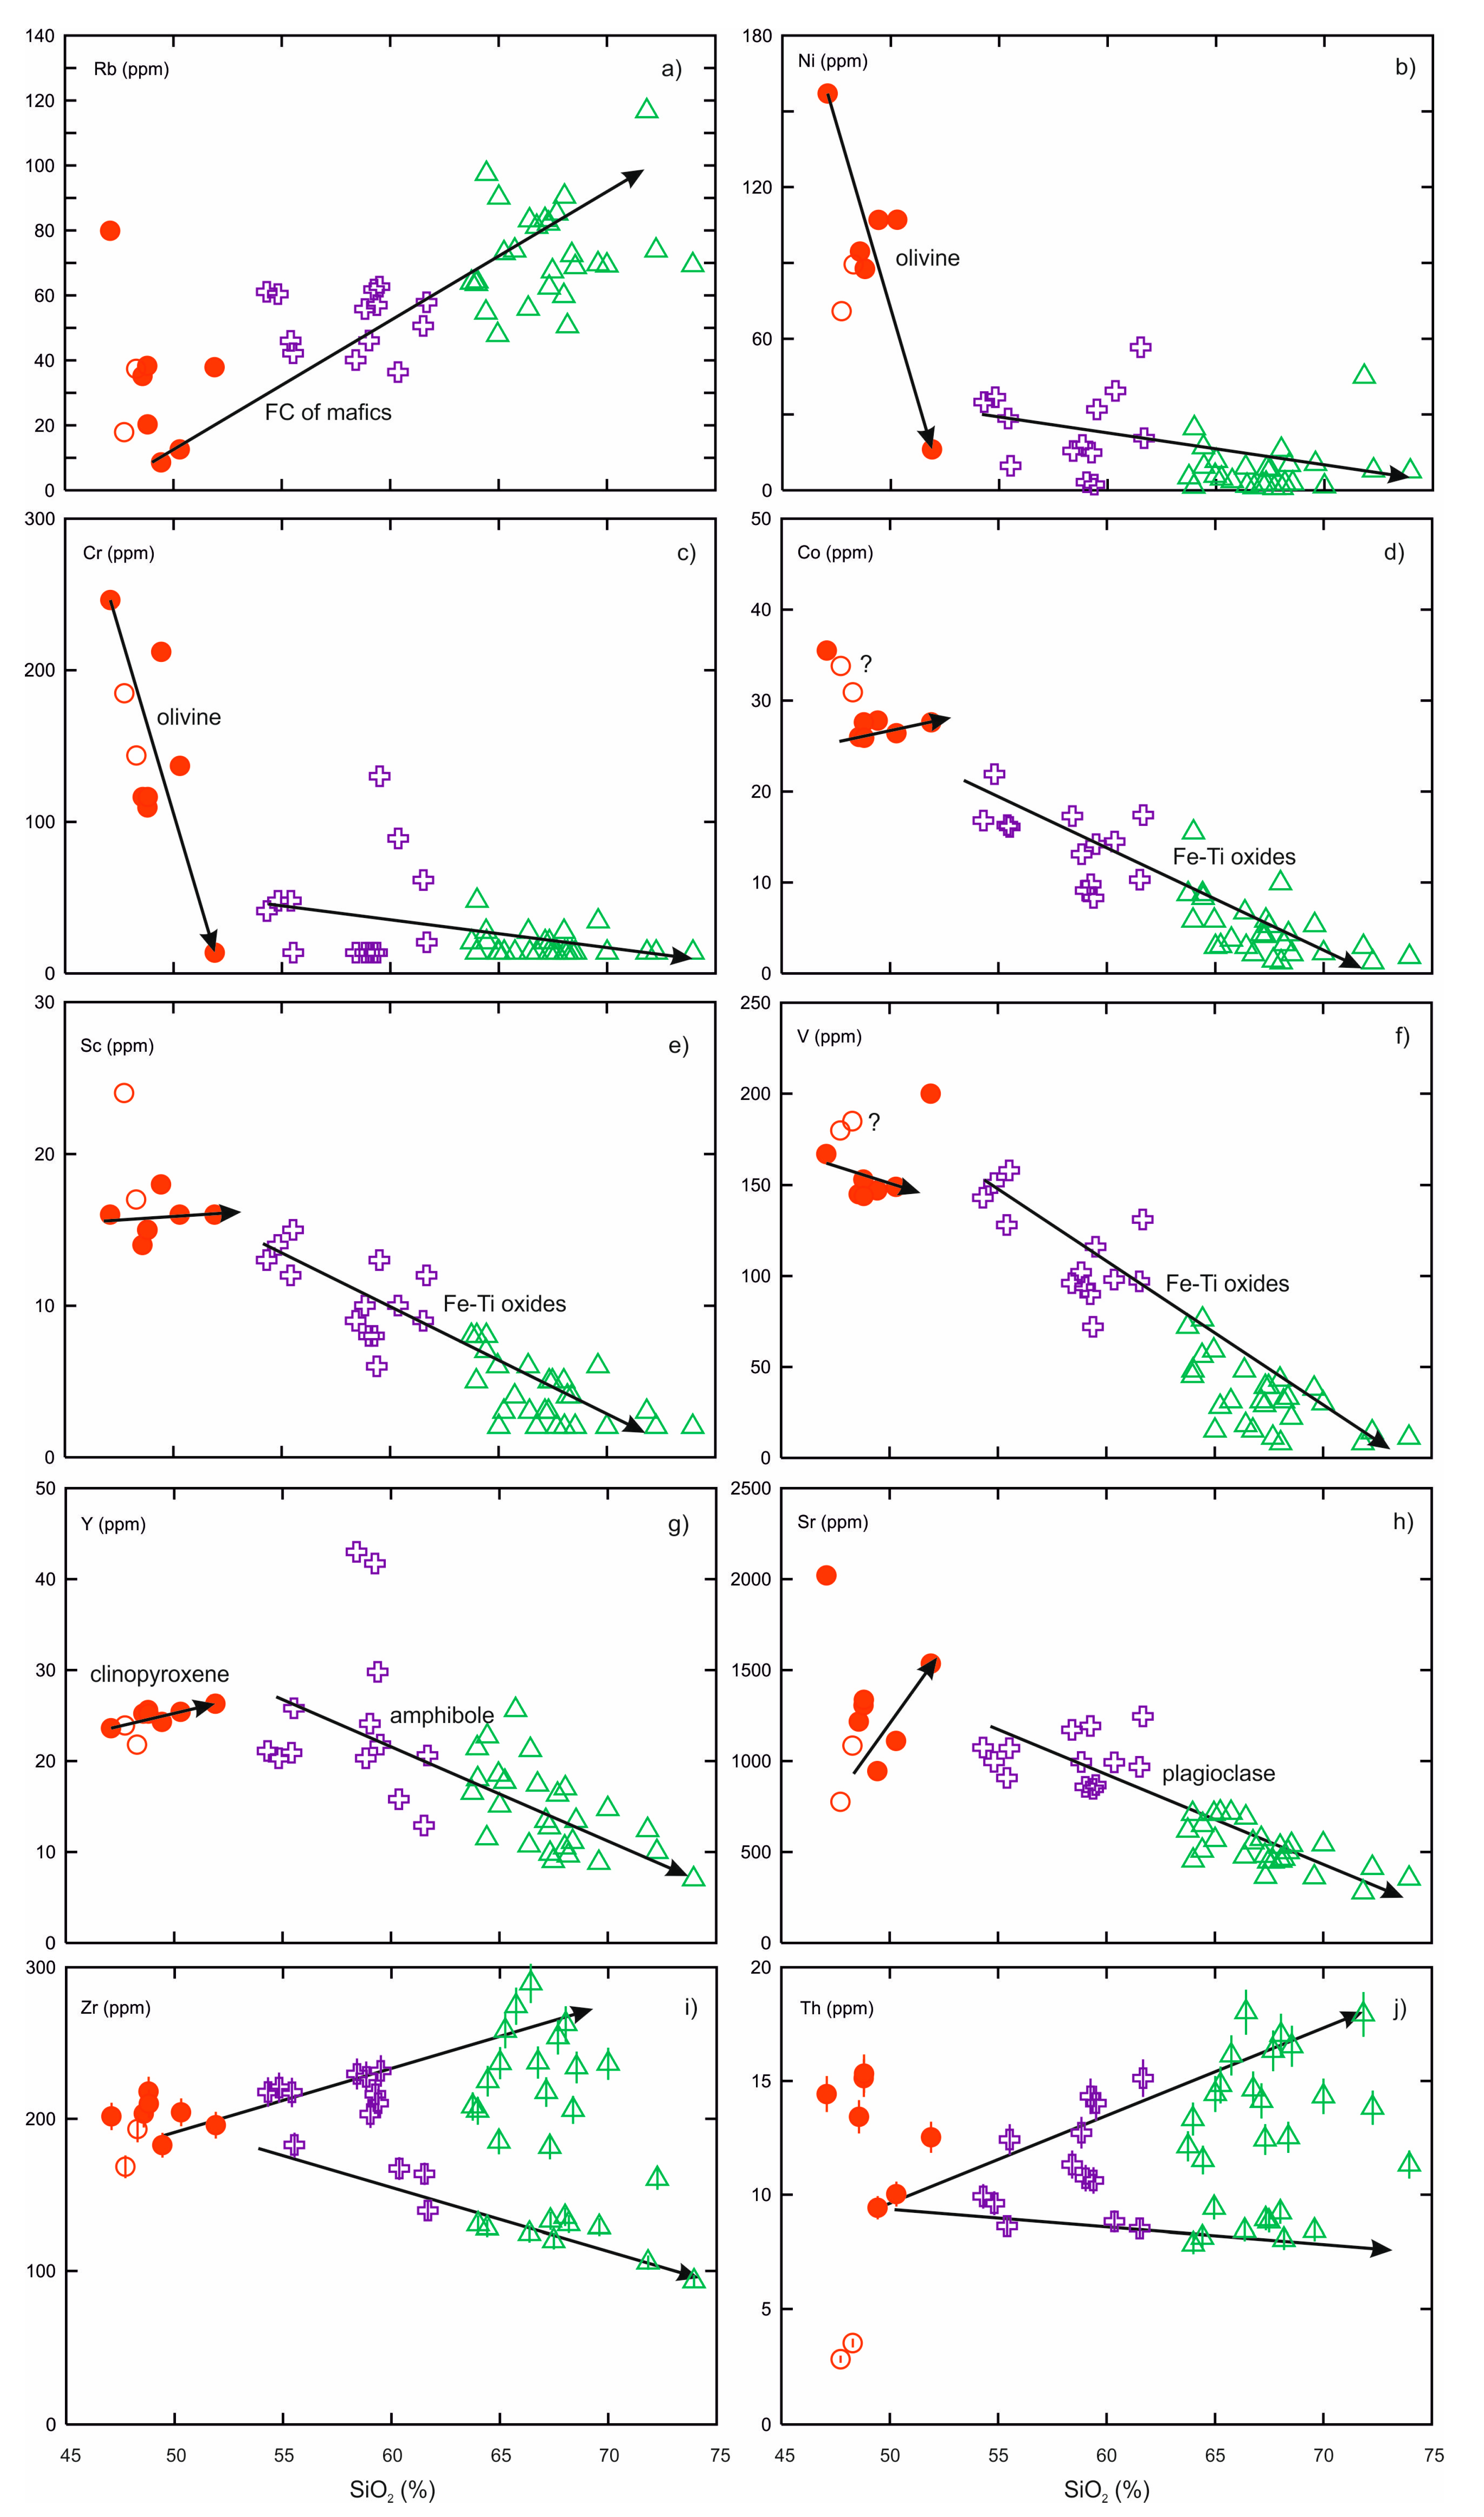
Most of the trace elements formed well-defined trends on variation diagrams (Figure 6), consistent with the major element variations. Rb, as an incompatible trace element, increased with increasing SiO2 (Figure 6a), similar to K2O (Figure 4b). Contrarily, Ni and Cr sharply decreased for the basaltic rocks, but they showed little decreasing in the intermediate to felsic rocks (Figure 6b,c) as in the MgO variations (Figure 5a). Co, Sc, V, and Y (Figure 6d–g), similar to FeO and TiO2 (Figure 5d,e), linearly fell from the intermediate to felsic rocks with increasing SiO2, but their variations in the basaltic range were obscured (e.g., poor correlation and/or slight increase or decrease). As in Al2O3 variation (Figure 5f), Sr increased in the basaltic range, and then decreased from the intermediate to felsic compositions (Figure 6h). Zr and Th showed different variations than the other trace elements (Figure 6i,j). They were positively correlated with SiO2 for most of the samples ranging from basaltic to felsic compositions, but a subset of samples from the intermediate to felsic rocks showed negative correlation between SiO2 and Zr, Th.
4.2.3. Multielement and REE Patterns
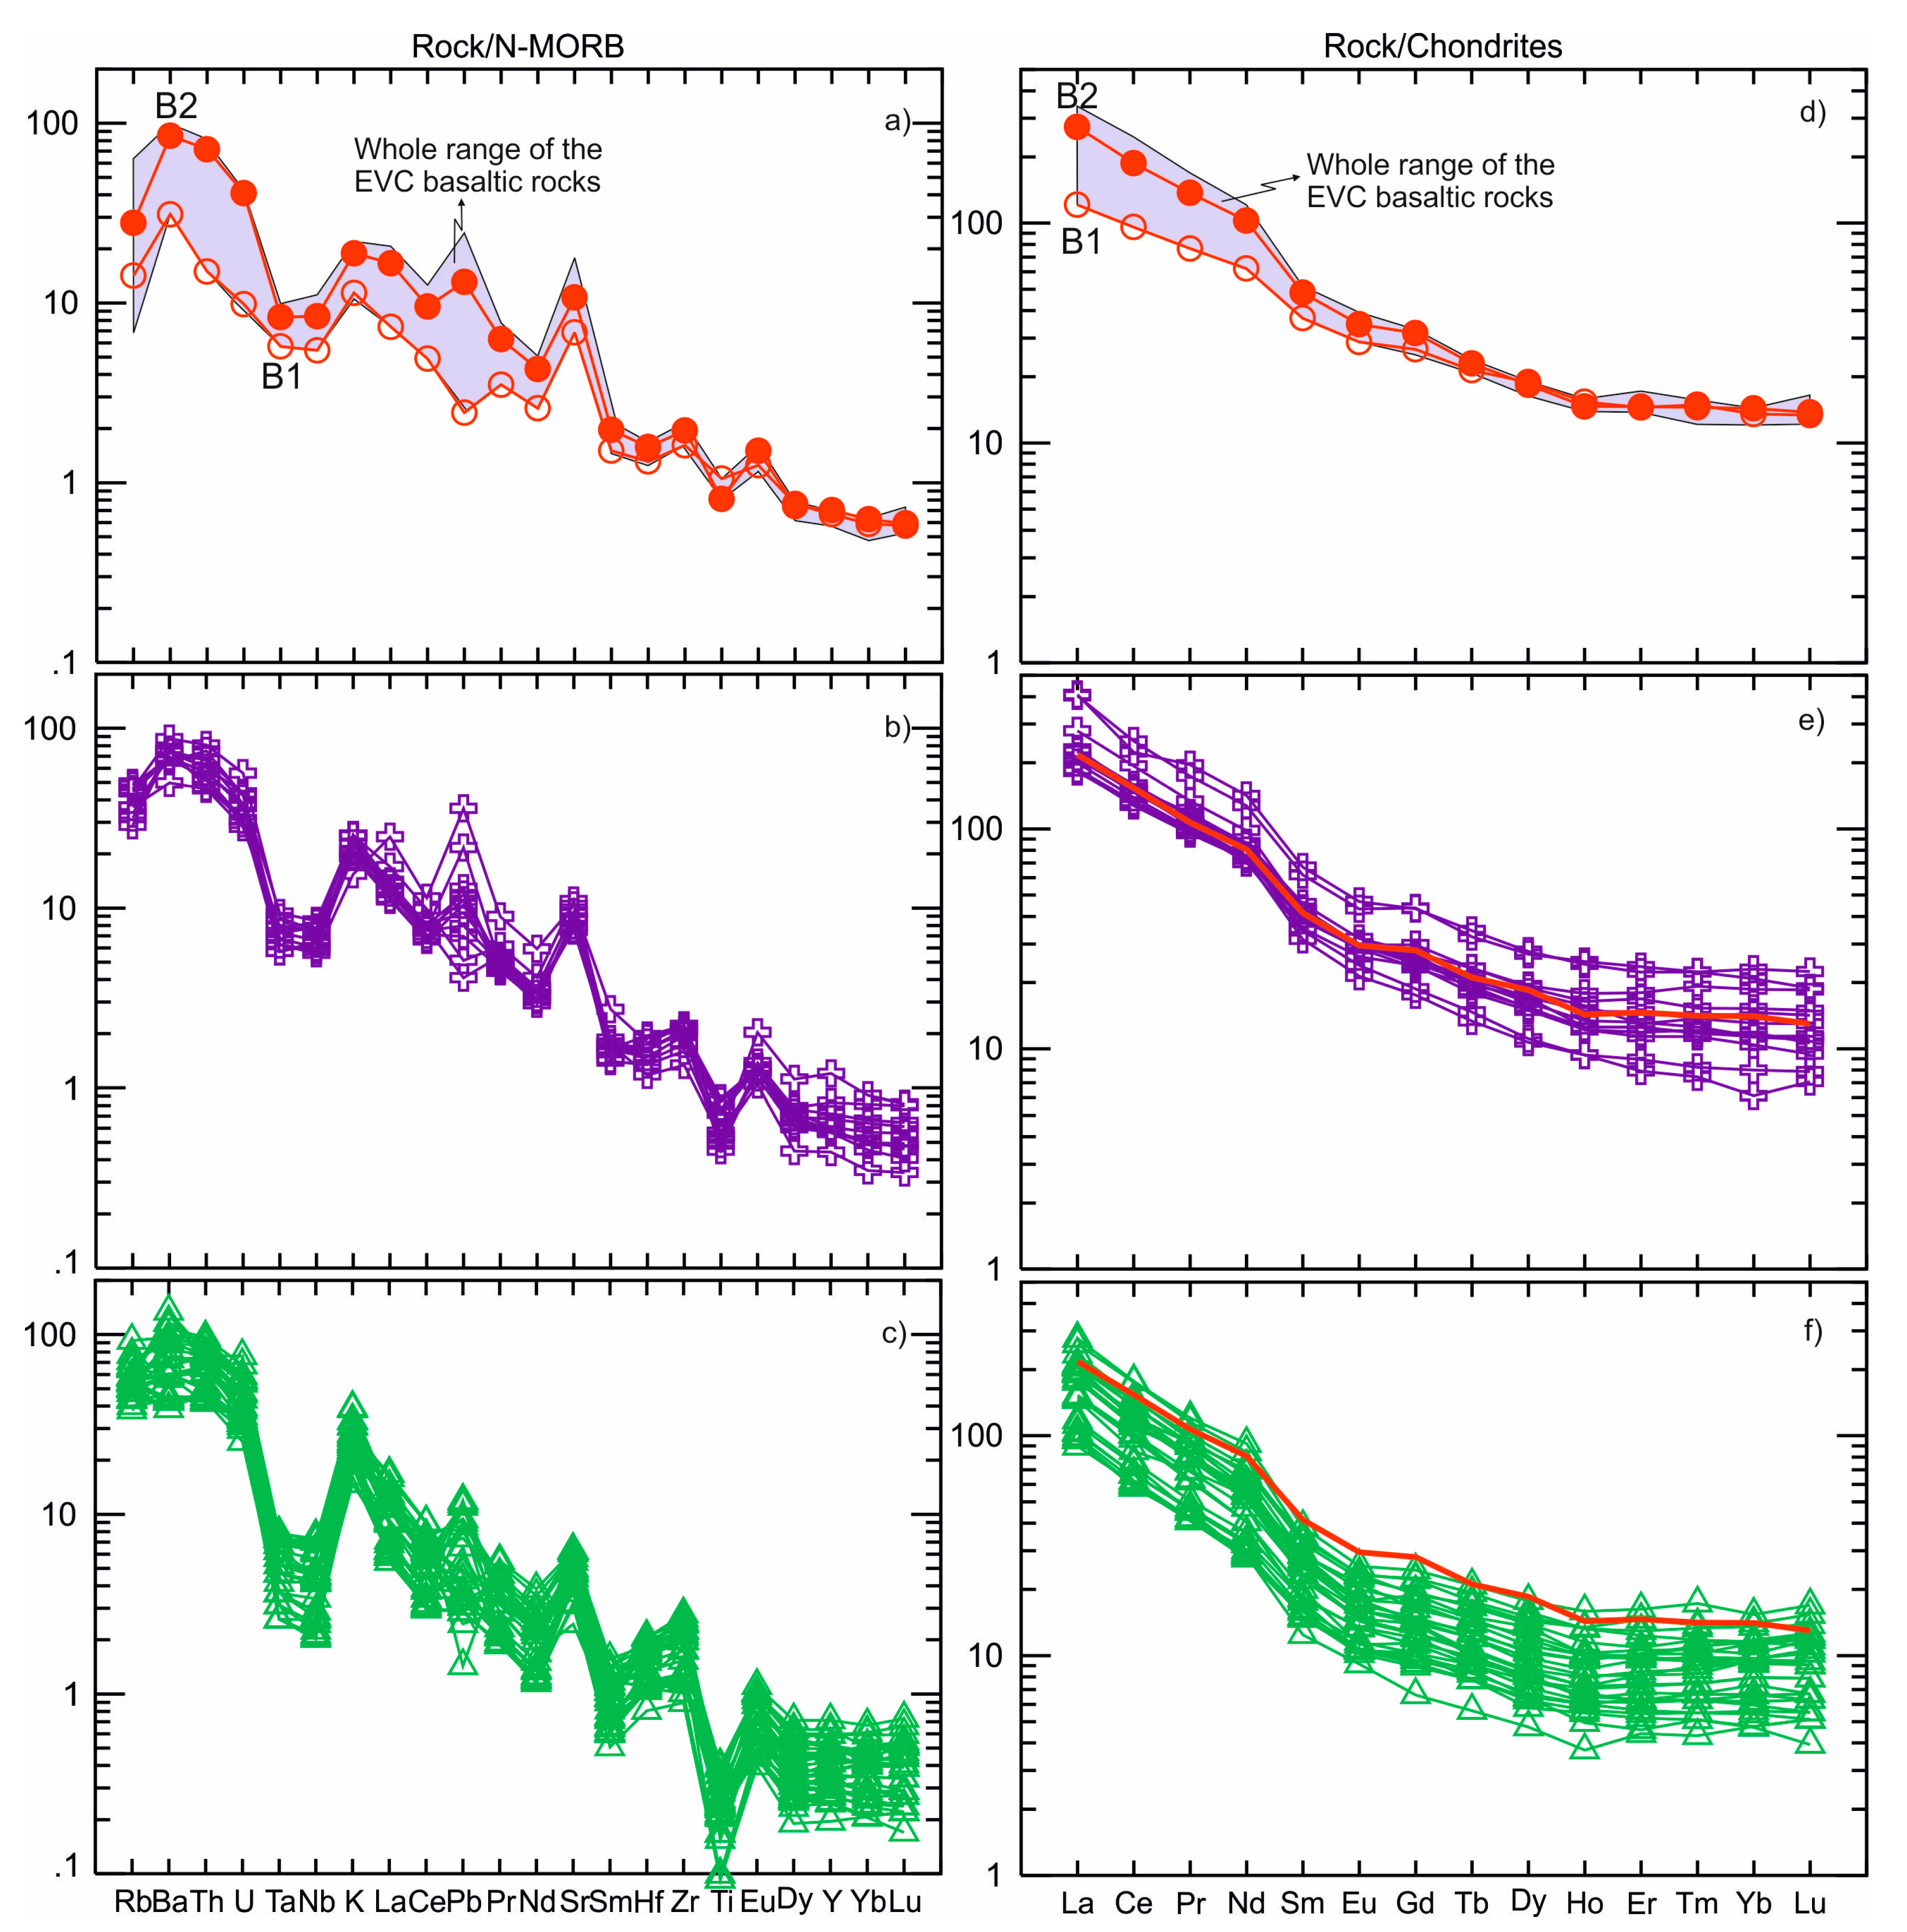
The N-MORB-normalized trace element patterns of two most primitive B1 and B2 basaltic samples from the EVC displayed an enrichment in large ion lithophile elements (LILE; Ba, Rb, K, Sr), Th, U, and light rare earth elements (LREE; La, Ce) relative to high field strength elements (HFSE; Nb, Ta, Zr, Ti, Y) (Figure 7a). However, the B2 basaltic sample was characterized by a more enriched pattern from Rb to Sm relative to B1 sample, which is discussed in the next section. On the other hand, the EVC intermediate and felsic lavas (Figure 7b,c) exhibited patterns that were largely comparable with those of the B2 basaltic lavas, but more evident Nb-Ta anomalies, and strong Ti depletions in their patterns.
The EVC most primitive basaltic samples exhibited fractionated LREE (La to Nd) but unfractionated, relatively flat MREE (Sm to Ho) to heavy REE (HREE; Er to Lu) patterns (Figure 7d). There was no distinction between two basaltic samples in terms of HREE content, but B2 was more LREE-enriched (~300 times of chondrites) than B1 (~100 times of chondrites), resembling the situation in Figure 7a. The B2 basaltic sample (e.g., E-34) has been plotted on REE diagrams of the intermediate to felsic rocks as a reference line (Figure 7e,f). Thus, the intermediate to felsic rocks were represented by three different REE patterns without a negative Eu anomaly relative to the reference line. They were characterized by enrichment in all REE (1), depletion in all REE (2), and enrichment in LREE, but depletion in MREE to HREE (3).
4.2.4. Sr-Nd Isotopes
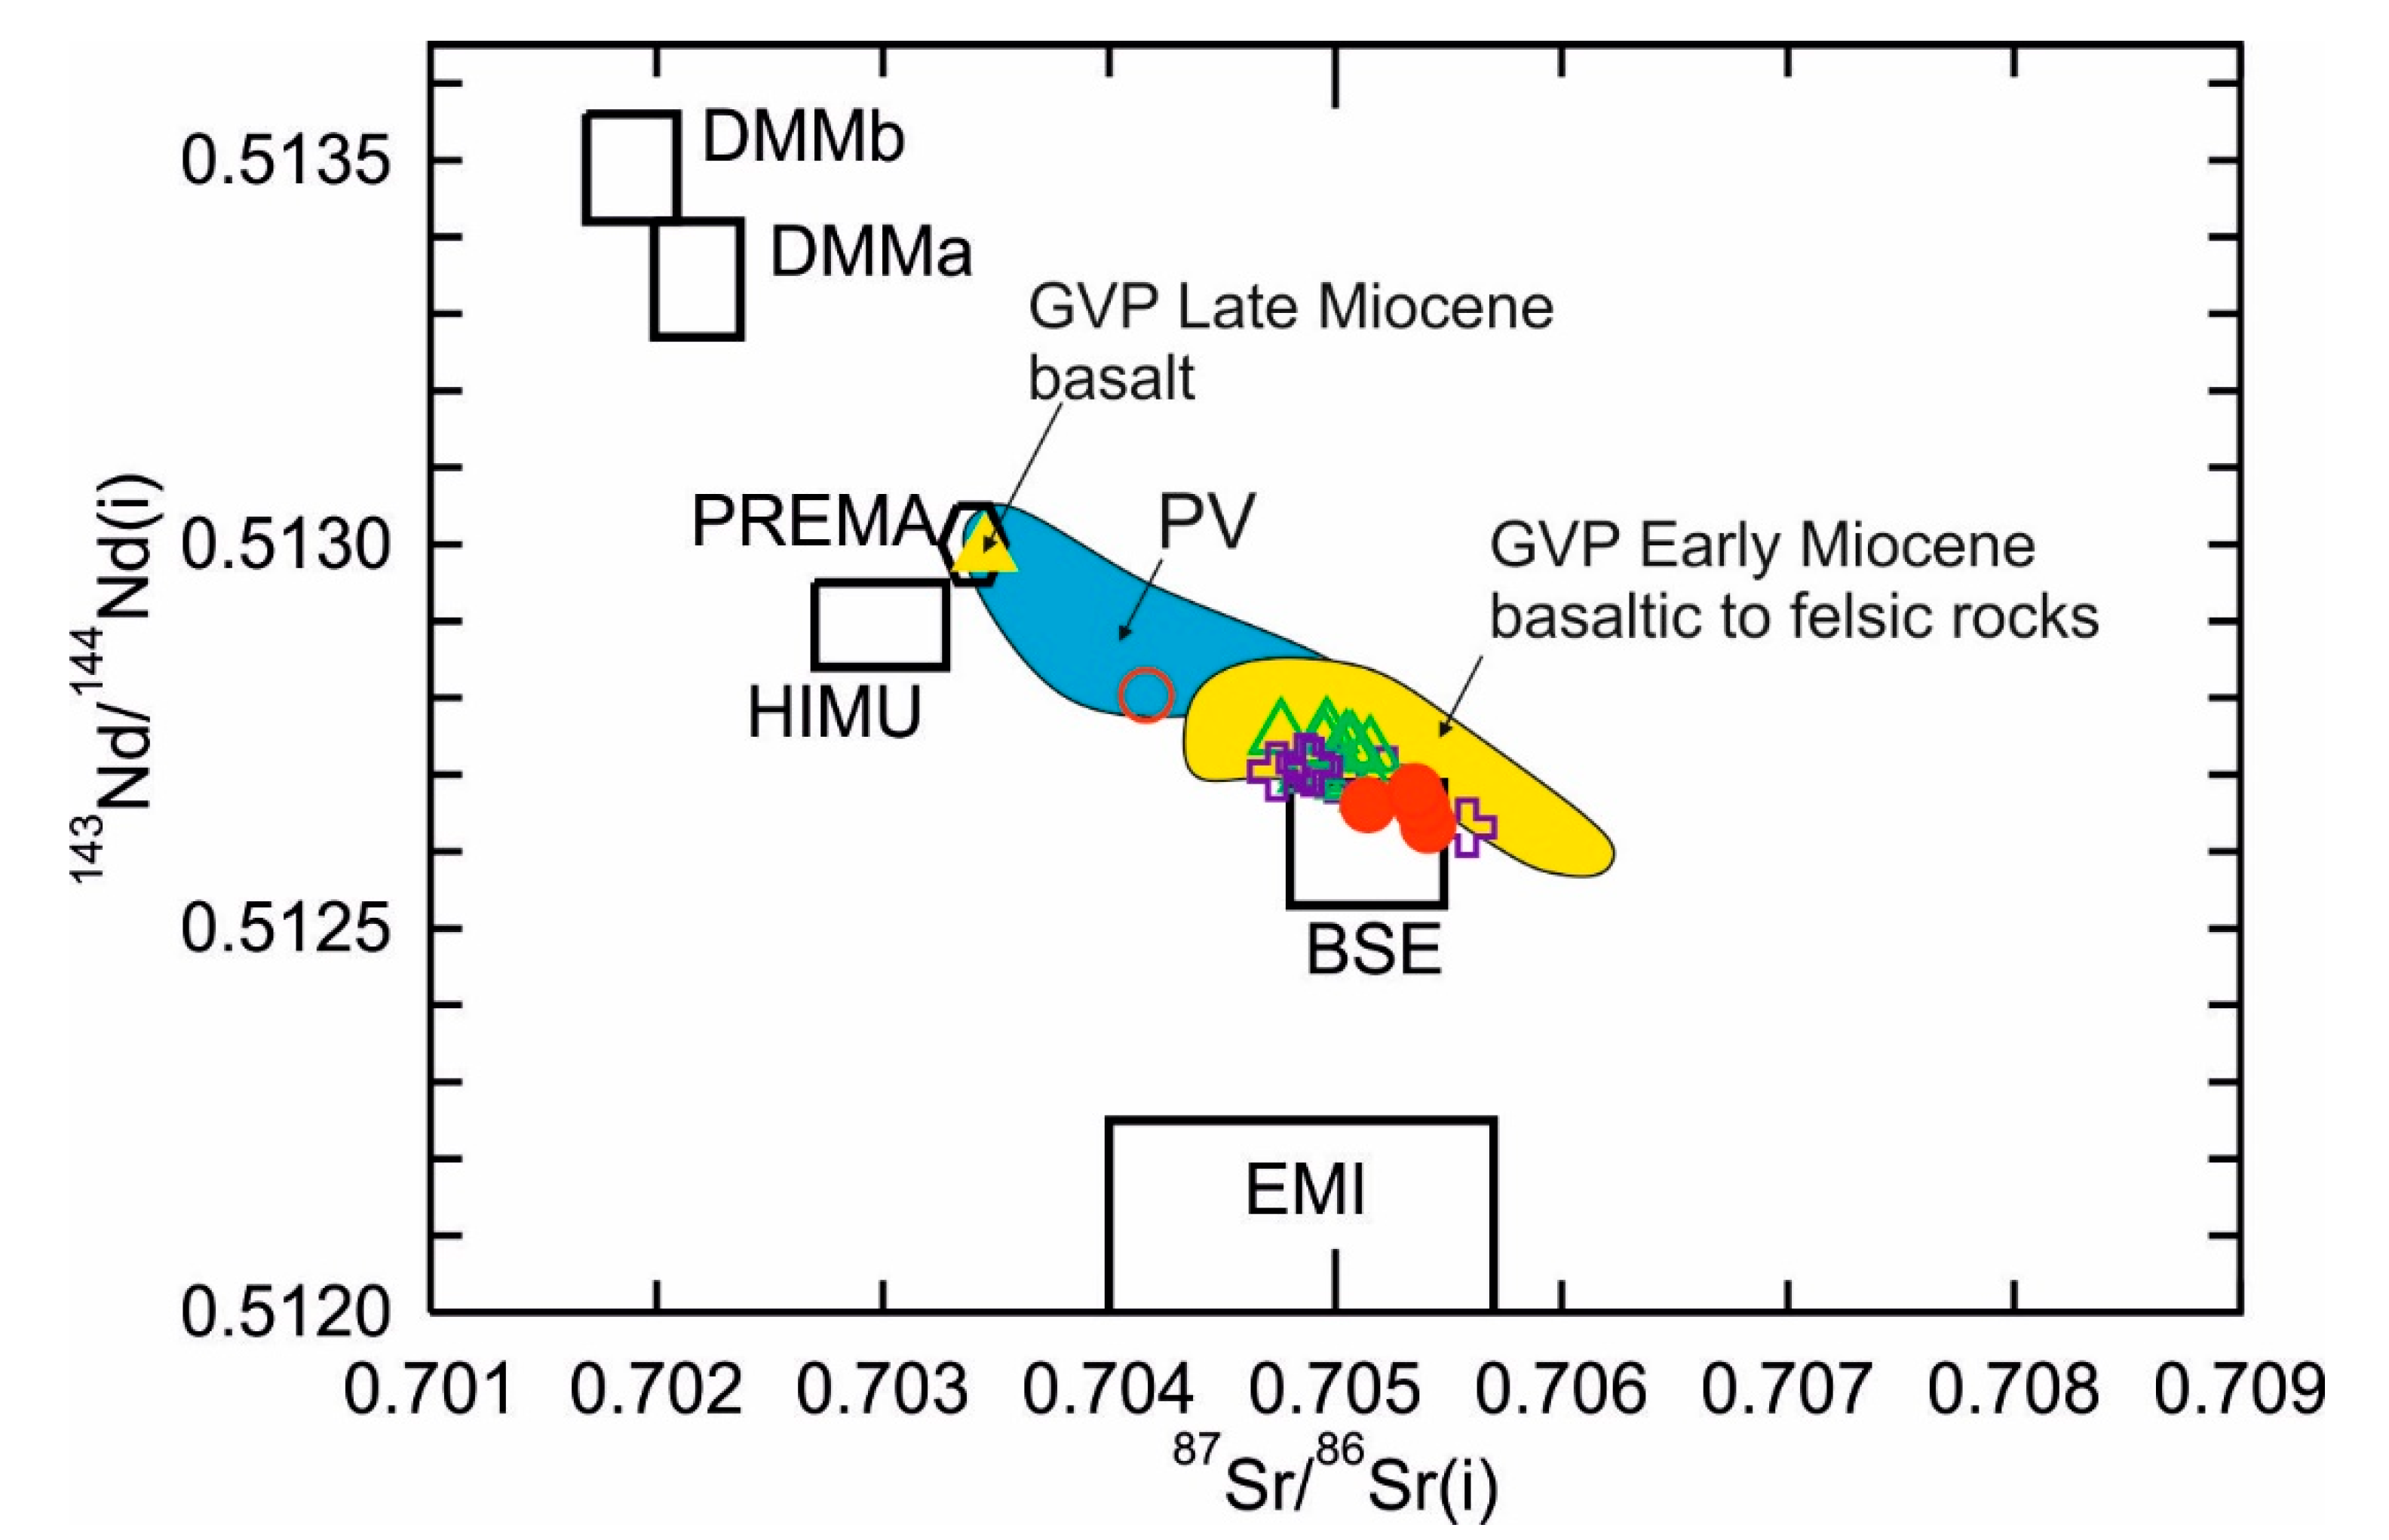
The EVC rocks defined a relatively narrow range in 87Sr/86Sr(i) (0.704165–0.705583) and 143Nd/144Nd(i) (0.512631–0.512803) isotopic ratios (Table S2). The corresponding εNd(t) values varied from +0.3 to +3.7. In the Sr-Nd isotope correlation diagram (Figure 8), the B2 basalts samples were plotted within the bulk silicate earth (BSE) field. However, a sample with the relatively highest Nd and lowest Sr isotope ratios from B1 basalts was plotted in a different area than other samples, arraying to the PREMA or HIMU-type reservoirs. On the other hand, isotopic compositions of the intermediate to felsic rocks ranged between those of B1 and B2 basalts, excluding one sample.
Figure 8 also compares the EVC rocks with the geographically adjacent volcanic areas (e.g., GVP: Galatia Volcanic Province, represented by basaltic to felsic rocks; PV: Polatlı Volcanites, represented by mainly basaltic rocks) in terms of Sr-Nd isotope compositions. Samples belonging to PV were plotted in between the BSE and PREMA-type reservoirs, while samples from GVP mainly fell in or near the BSE field. A sample representing the Late Miocene GVP basalt (e.g., yellow triangle symbol) was plotted within the PREMA field. EVC samples were mainly plotted within the compositional data field of the GVP Early Miocene basaltic to felsic rocks, and the less evolved B1 basaltic sample had an isotopic fingerprint similar to that of PV samples.
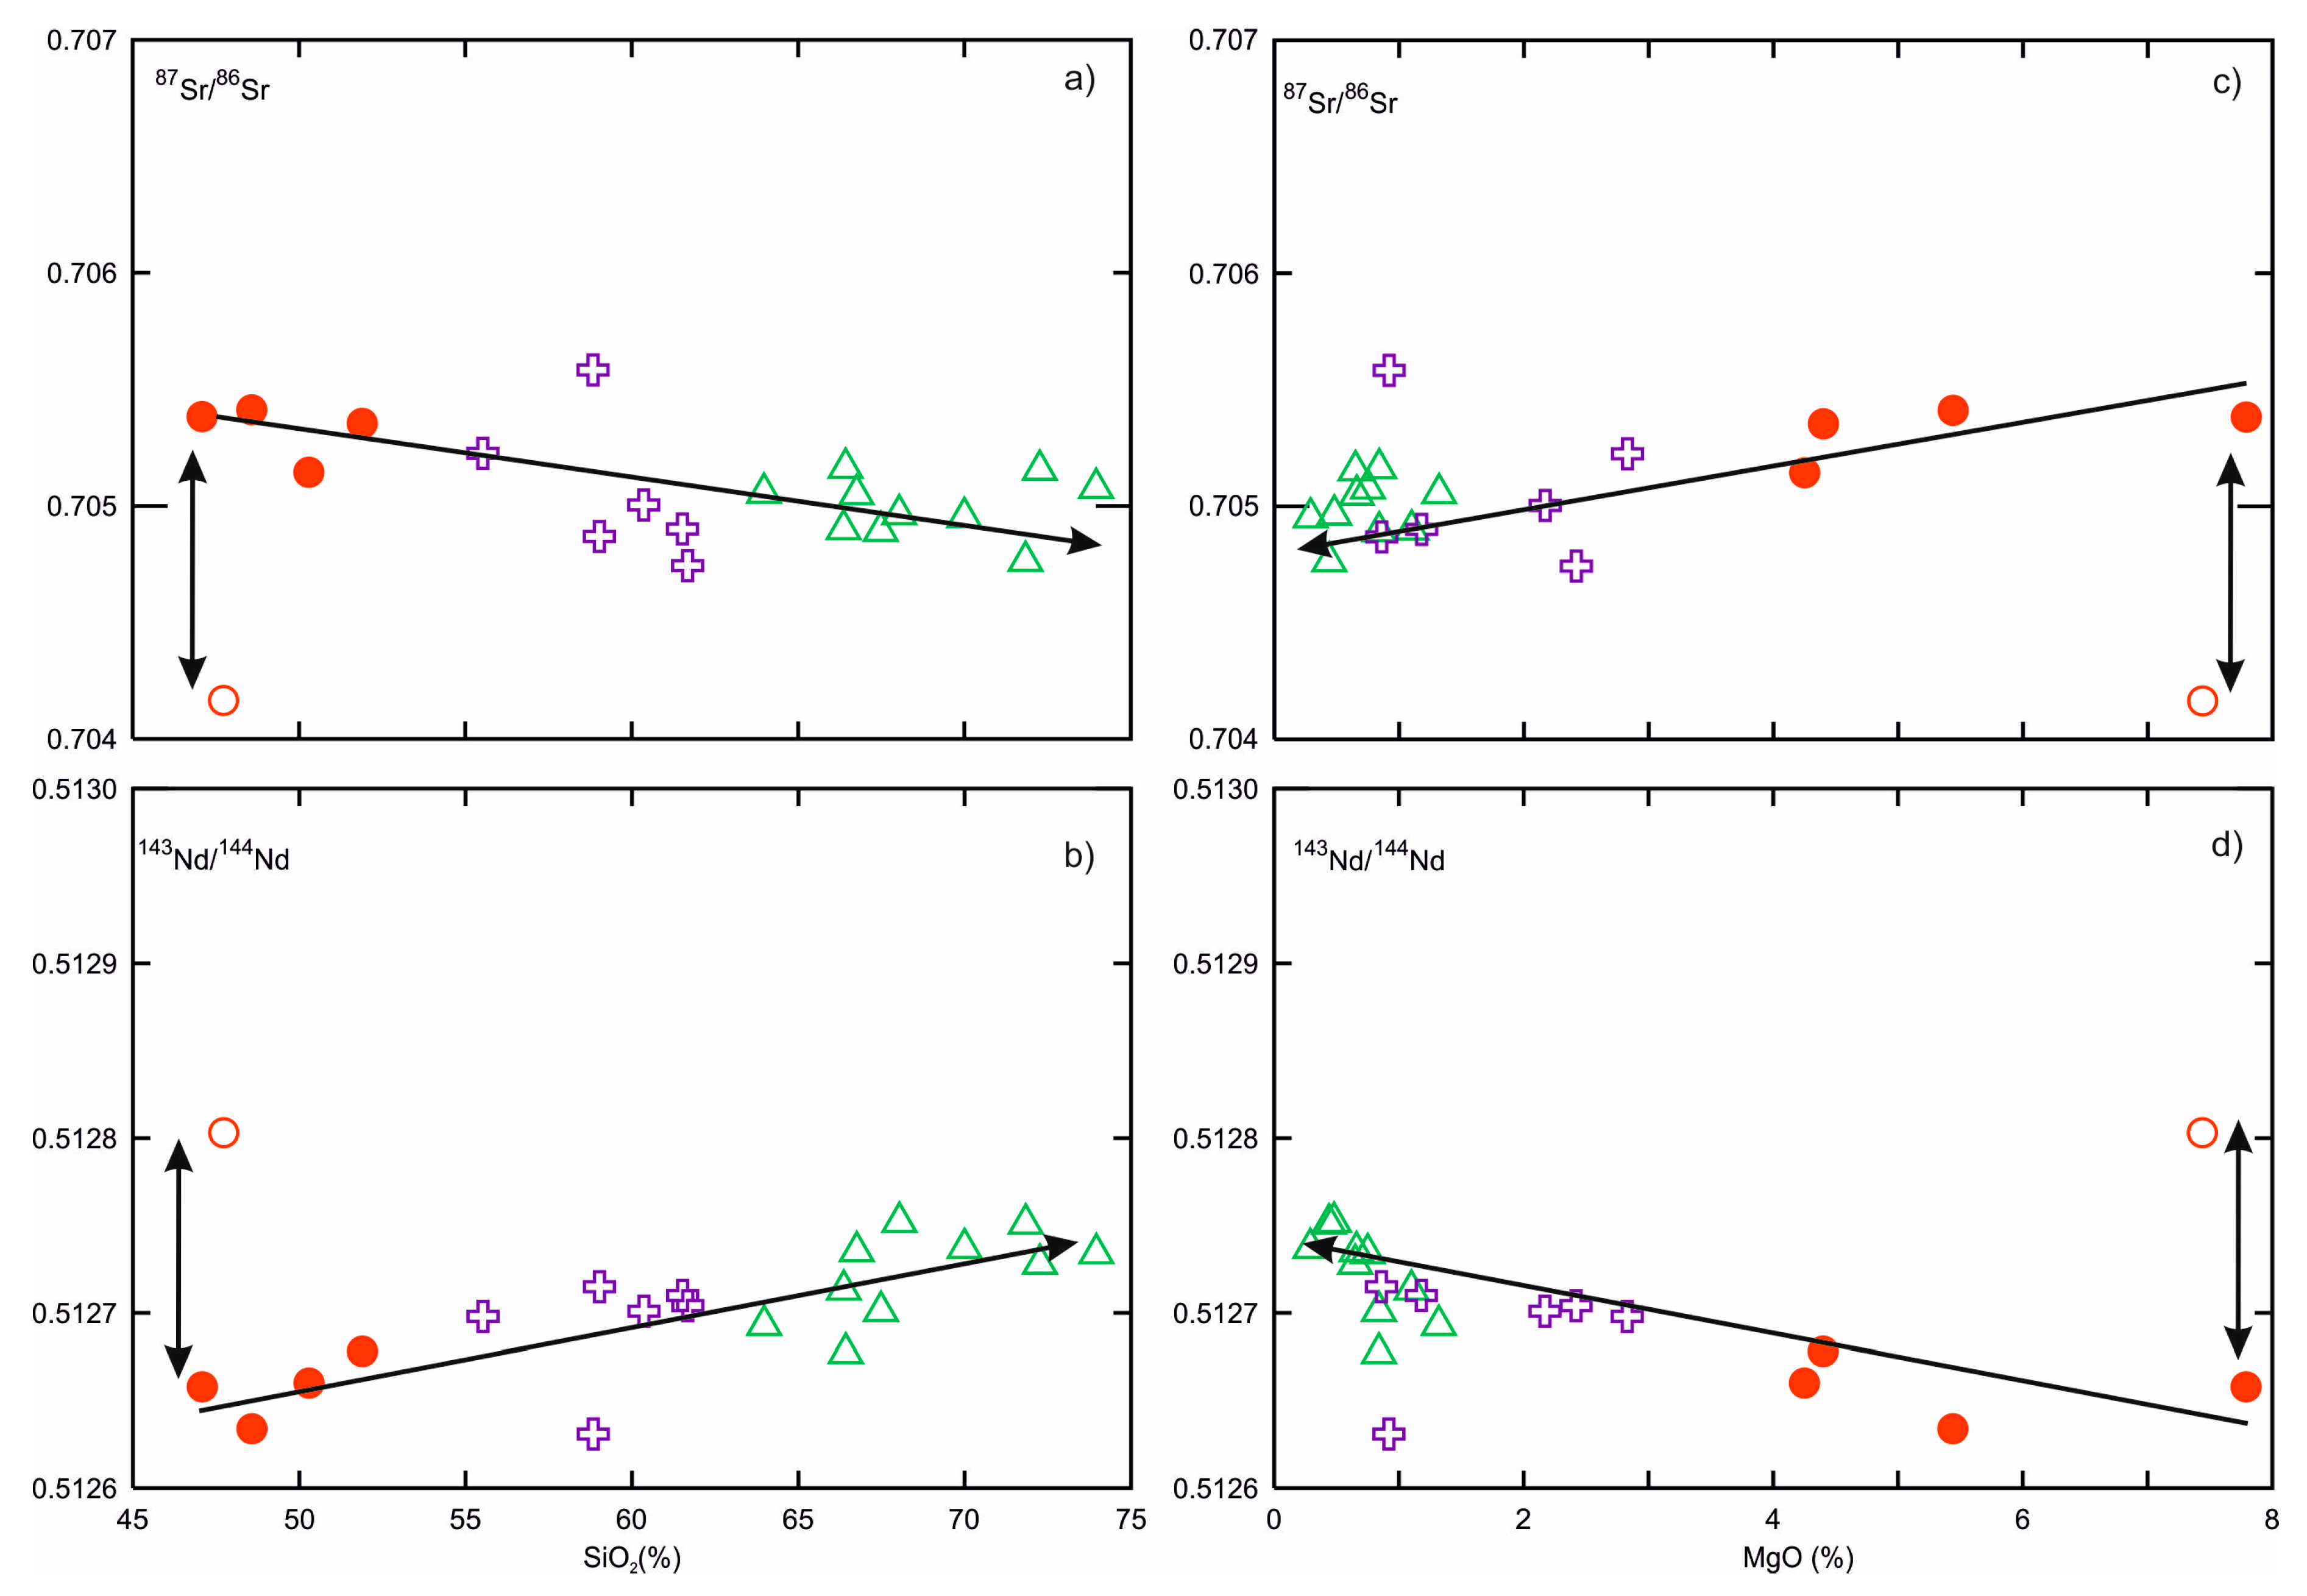
The SiO2 and MgO vs. 87Sr/86Sr(i) and 143Nd/144Nd(i) plots showed two main trends rather than a single, simple trend, suggesting a complex magmatic history for the EVC rocks (Figure 9). The first trend was a vertical array in the most primitive basalts (e.g., B1 and B2), and can be attributable to the heterogeneity as seen in their trace element geochemistry. I think isotopic differences between B1 and B2 basalts reflect their mantle characteristics, as discussed in Section 5.1. Thus, the lower Sr and higher Nd isotope ratios of B1 basalts required a more depleted mantle source (e.g., asthenosphere) than those of B2 basalts (e.g., lithospheric mantle). The second trend started from B2 basaltic parents and can be found in the intermediate to felsic rocks. This trend was characterized by positive or negative variations. As SiO2 increased, 87Sr/86Sr(i) decreased (Figure 9a) and 143Nd/144Nd(i) increased (Figure 9b), but the opposite situation occurred when SiO2 was changed with MgO (Figure 9c,d). These variations suggest an interaction between B2 basaltic magmas and crustal wall rocks, but they cannot be explained by assimilation-fractional crystallization (AFC)-style contamination because the AFC was characterized by an increasing trend in 87Sr/86Sr, but a decreasing trend in 143Nd/144Nd with increasing silica.
5. Discussion
5.1. Mantle Source Characteristics and Origin of the Basaltic Units
The EVC basaltic volcanism was characterized by mildly alkaline basalts (up to 8 wt% normative nepheline). The EVC basalts had relatively low MgO (<8.0 wt%) and Cr-Ni contents (<250 ppm), suggesting that they did not represent primary mantle-derived melts. Two distinct basaltic rocks have been identified on the chemical grounds in the EVC, as relatively less enriched basalt (B1) and more enriched basalt (B2) in terms of incompatible trace elements (e.g., Figure 7) and Sr isotopes (Figure 8 and Figure 9). The incompatible trace element pattern of the most primitive B1 basalt sample was similar to those within plate alkali basalts and displayed enrichments in LILE and LREE relative to HSFE and HREE. This also had the lowest Sr and highest Nd isotope compositions, trending to the field of HIMU-type source in the Sr-Nd isotope correlation diagram (Figure 8). On the other hand, the B2 basalt sample was characterized by a more enriched pattern, which was comparable in many respects to those of the B1 sample. However, the B2 basalt displayed distinctly negative Nb and Ta anomalies typical for orogenic (subduction-related) volcanic rocks or crustal contamination, and also had a more radiogenic Sr isotope composition, plotting in the BSE field (Figure 8).
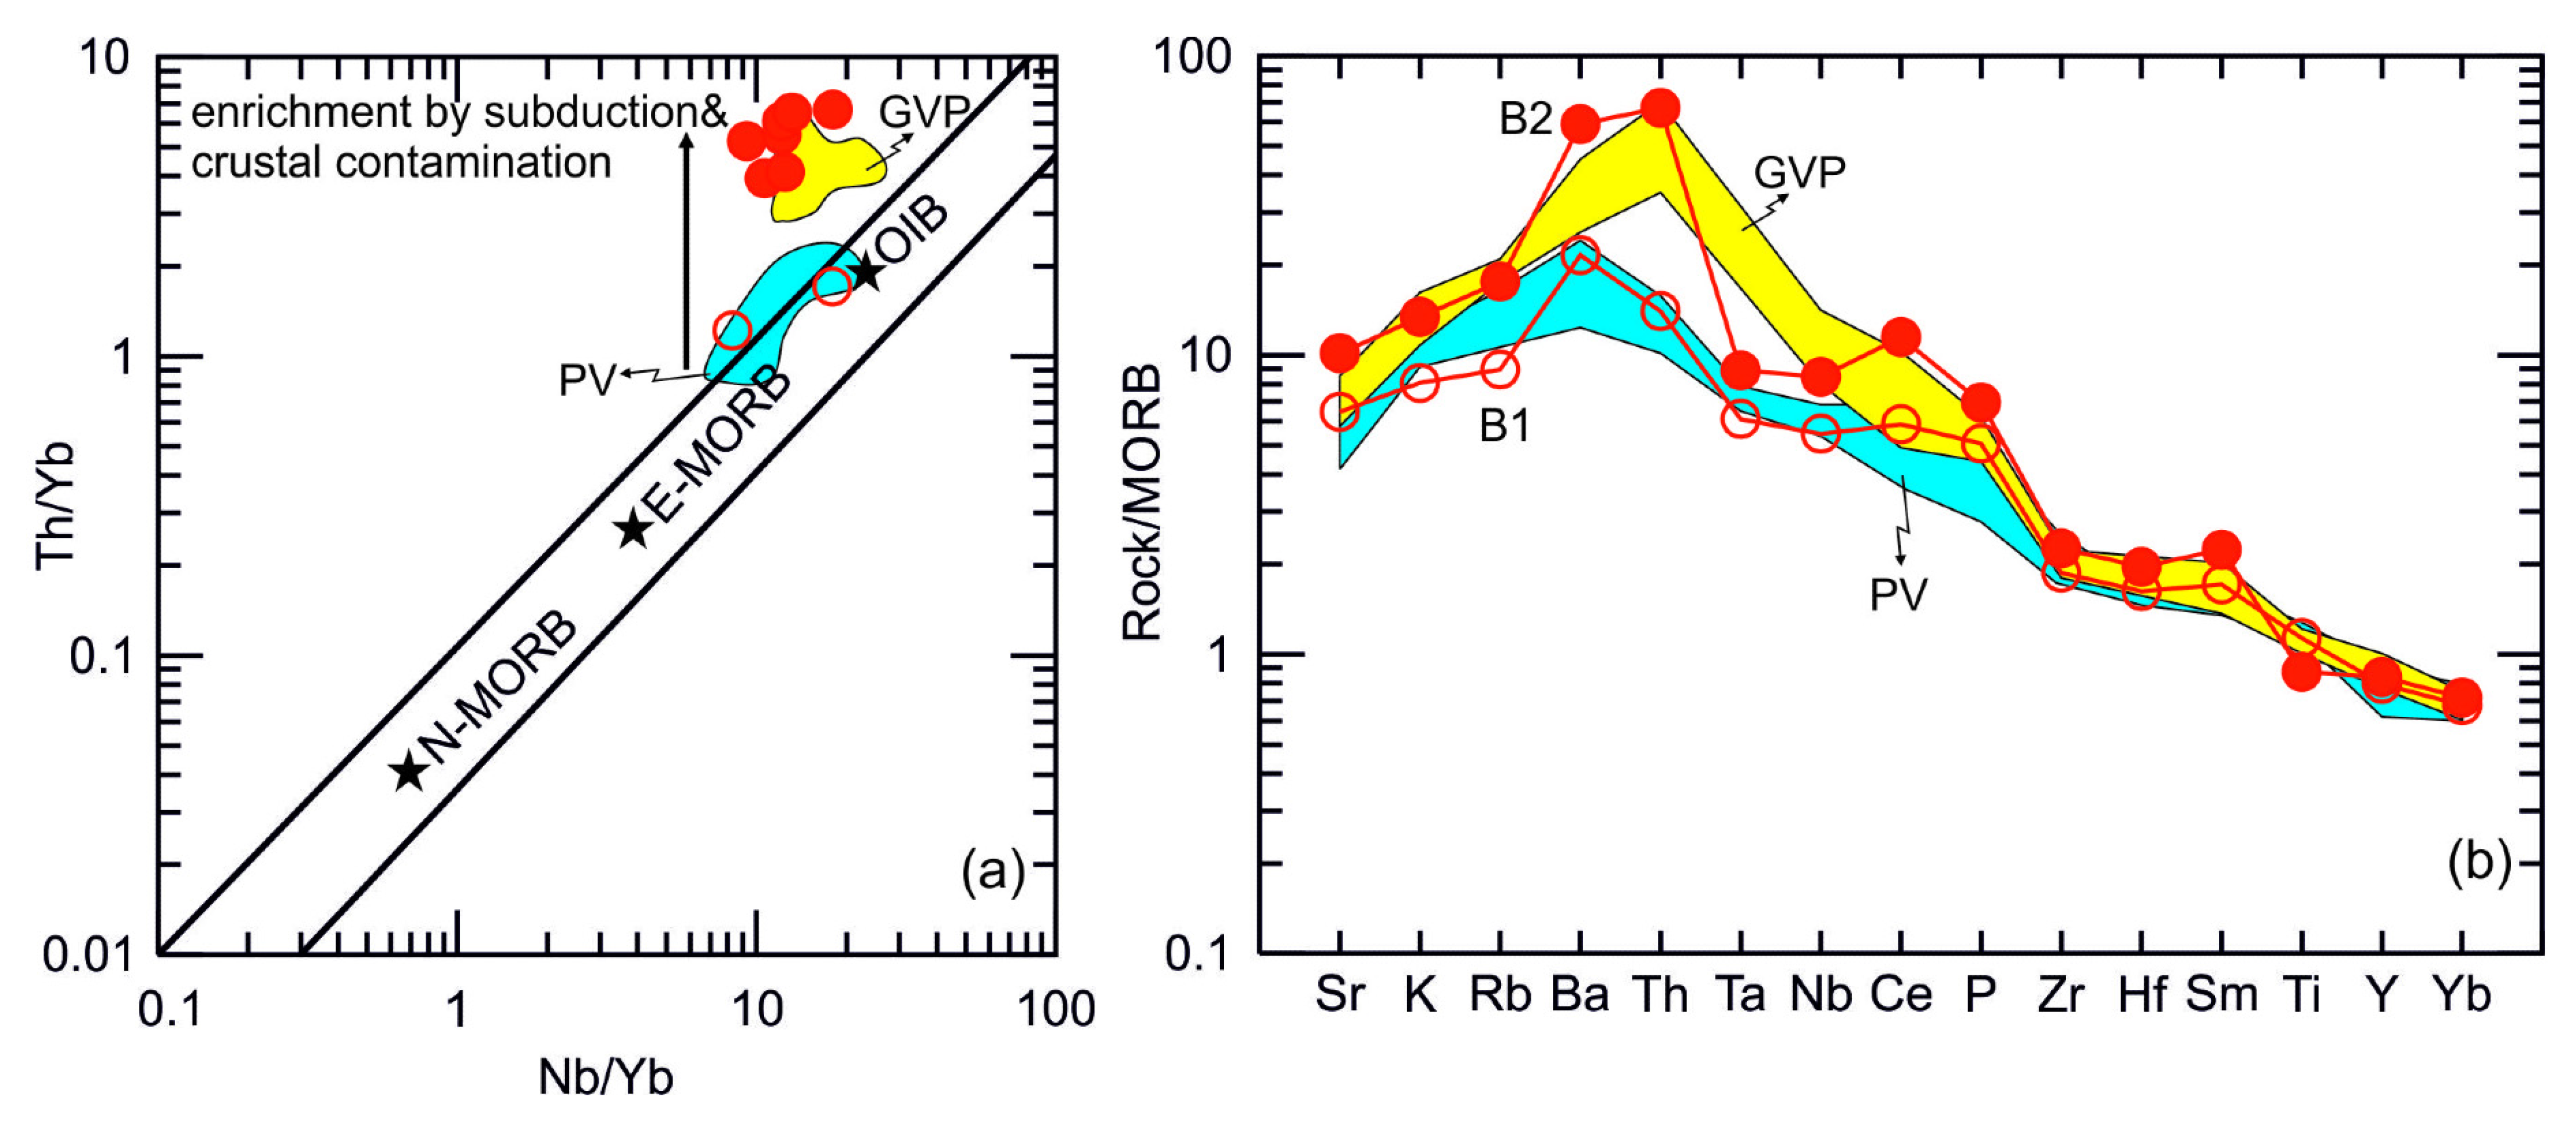
The geochemical difference in the EVC basalts was also evident in the Nb/Yb vs. Th/Yb plot, providing useful constraints for source components (Figure 10a). The B1 basalts had lower Th/Yb ratios, and were plotted on the OIB trend, but the B2 basalts with higher Th/Yb ratios deviated from this trend. The higher Th/Yb ratio, as in B2, was typical for orogenic volcanic rocks, but also attributable to crustal contamination. Figure 10a also compares the EVC basaltic rocks with the adjacent volcanic occurrence and shows that B1 basalts were plotted within the field defined by the Polatlı Volcanics (PV), whereas B2 basalts were in the field of the Galatia Volcanic Province (GVP). Figure 10b is another comparison of the EVC basaltic rocks with basalts from the GVP and PV in terms of incompatible trace element patterns. The trace element pattern of B1 basalt was similar to those of basalts from the PV, while the pattern of B2 basalts was similar to those of the GVP basalts. Temel, Yürür, Alıcı, Varol, Gourgaud, Bellon, and Demirbağ [11] discussed the origin of the GVP and PV and concluded that they were derived from different mantle sources. Therefore, they suggested that the GVP were derived from a subduction-modified (lithospheric) mantle source, but the PV originated from an OIB-like asthenospheric mantle source with minor subduction component and/or crustal contamination. However, the GVP geochemically includes two different basalts [10,13] as in the EVC. So, Wilson, Tankut and Guleç [13] suggested two GVP basalts were derived from different mantle sources: One (e.g., Early Miocene basalt) was from subduction-modified lithospheric mantle source, the other one (e.g., Late Miocene basalt) from asthenospheric mantle source with HIMU-OIB affinity. Based on their geochemistry and comparison with the adjacent volcanic occurrence, B1 and B2 basalts from the EVC may have been derived from different mantle sources: B1 basalts showing OIB-type affinity were derived from asthenospheric mantle source, but B2 basalts with orogenic signature appear to be derived from a subduction-modified lithospheric mantle source.
5.2. Differentiation of the EVC Rocks
Major and trace element variations (Figure 5 and Figure 6) and REE systematics (Figure 7) suggest that fractional crystallization (FC) of the observed phenocryst phases played an important role in the evolution of the EVC rocks. However, isotopic variations (Figure 9) and disequilibrium textural features (Figure 3) in the rocks required a role for open-system processes, such as assimilation and magma mixing in their evolution. I state here that if differentiation from a more basaltic magma is one of the important petrologic processes for the generation of intermediate and silicic units, diverse basaltic end members may have been involved because the EVC basalts display a prominent geochemical heterogeneity. In the following, I first interpreted major and trace element variations and REE systematics, and then evaluated the role fractional crystallization, crustal assimilation, and magma mixing in the evolution of the EVC rocks.
5.2.1. Interpretations of Major and Trace Element Variations
Harker diagrams (Figure 5 and Figure 6) displayed decreases in compatible elements and increases in incompatible elements with increasing SiO2, consistent with the fractional crystallization of the observed phenocryst phases in the EVC rocks.
The SiO2 vs. MgO, Ni, and Cr plots (Figure 5a and Figure 6b,c) were characterized by sharp decreases, but Al2O3 (Figure 5f) and Sr (Figure 6h) increased with SiO2 in the basaltic range, suggesting the progressive crystallization of olivine without plagioclase. The decrease of CaO (Figure 5b) and increase of Y (Figure 6g) in the basaltic range can be best explained by clinopyroxene crystallization. On the other hand, P2O5 (Figure 5c) showed a decrease in the basaltic range, which was related to apatite crystallization. FeO (Figure 5d), TiO2 (Figure 5e), Co (Figure 6d), Sc (Figure 6e), and V (Figure 6f) were poorly correlated with SiO2 or showed a slight increase or decrease in the basaltic range, suggesting little or no effect of Fe-Ti oxides crystallization for the basaltic rocks. Thus, major and trace element variations of the basaltic rocks were controlled by the crystallization of mainly olivine and clinopyroxene, and apatite to some extent. Although there were some similarities between B1 and B2 basalts in terms of major and trace elements, they were plotted on different trends in the SiO2 vs. TiO2 (Figure 5e) and Th (Figure 6j) diagrams, suggesting a distinct differentiation history. Harker variation diagrams also showed that B2 basalts appeared to be potential parental magma to the differentiated rocks. Thus, some of the Harker diagrams, especially the SiO2 vs. incompatible trace element ones (e.g., Rb, Zr and Th) (Figure 6a,i,j), suggest that the sample E-34 from B2 basalts may have been an appropriate parental magma to the intermediate to felsic rocks because their variation trends appeared to start from this sample.
For intermediate to felsic rocks, with increasing SiO2, decreases in CaO (Figure 5b), Al2O3 (Figure 5f), and Sr (Figure 6h) were related to plagioclase crystallization. Decreasing in CaO, together with Y (Figure 6g) depletion for the intermediate to felsic rocks, may also be attributable to amphibole crystallization. Linear falls in P2O5 (Figure 5c) and FeO (Figure 5d), TiO2 (Figure 5e), Co (Figure 6d), Sc (Figure 6e), and V (Figure 6f) suggest crystallization of apatite and Fe-Ti oxides, respectively. On the other hand, two distinct trends were visible in the SiO2 vs. Zr (Figure 6i) and Th (Figure 6j) plots, in which the positive correlation was related to the zircon-free crystallization history, whereas the negative correlation reflects zircon crystallization in the evolution of this subset. Taken as a whole, major and trace element variations in the intermediate to felsic rocks were mainly related to the crystallization of plagioclase, amphibole, apatite, Fe-Ti oxides, and zircon to some extent.
5.2.2. Interpretation of REE Systematics
REE systematics give valuable information about the mineral assemblage removed during crystallization. Thus, I here tried to interpret REE patterns of the EVC basaltic and intermediate to felsic rocks to support the mineral assemblage suggested above based on the major and trace element variations.
All REEs were incompatible in olivine and clinopyroxene. Their incompatibilities in olivine systematically decreased from LREE (KdLaolivine ≈ 0.0067) to MREE (KdDyolivine ≈ 0.013) to HREE (KdYbolivine ≈ 0.049). The behaviors of REEs in clinopyroxene were slightly different than those of olivine: MREE (KdDyclinopyroxene ≈ 0.58) and HREE (KdYbclinopyroxenef ≈ 0.54) were equally moderately incompatible relative to LREE (KdLaclinopyroxene ≈ 0.056). Thus, if olivine and clinopyroxene crystallization occurred, all REEs increased with evolution (e.g., with increasing SiO2), but enrichments in LREEs became more visible than those in the MREE and HREE as in the EVC basalts. For example, when comparing E-34 (SiO2: 49 wt%) and E-123 (SiO2: 52 wt%) samples from B2 basalts, their chondrite-normalized Yb values (YbN: 14) were the same, but the chondrite-normalized La value was higher in E-123 (LaN: 256) relative to E-34 (LaN: 218). On the other hand, REE patterns of the basaltic rocks showed no negative Eu anomaly, suggesting that plagioclase crystallization did not play important role in their evolution. Therefore, REE patterns of the basaltic rocks can be best explained by crystallization of olivine and clinopyroxene without plagioclase.
The intermediate to felsic rocks had more complex REE patterns and showed three different systematics relative to the parental basaltic reference line (Figure 7e,f). The first-type pattern showed systematic enrichments in all REE relative to the basaltic parent. This feature can be explained by the continuation of olivine and clinopyroxene crystallization in the evolution of these samples because all REE were incompatible in these mineral phases as explained above. The second-type pattern was characterized by a distinct depletion in M-and H-REE and an enrichment in LREE relative to the parental basaltic sample, forming a trough-shaped profile. This feature argues strongly for amphibole as an important phase in the differentiation of this subset because amphibole preferentially incorporates M-REE (e.g., KdDyamphibole ≈ 1, basaltic melt) over L-and H-REE [49]. The last pattern type was characterized by depletions in all REE relative to the reference line. REEs were compatible in zircon in intermediate (KdLREE > 3; KdMREE> 31; KdHREE > 196) to felsic (KdLREE > 7; KdMREE > 95; KdHREE > 635) magmas, and their compatibility increased systemically from LREE to HREE [50,51]. Thus, the patterns of this subset of samples showing systematic depletions in REEs can be best explained by zircon crystallization. Also, these samples correspondingly showed an array on the negative trend on SiO2 vs. Zr and Th plots (Figure 6i,j). The felsic rocks also showed another style of depletions in all REEs (Figure 7f), forming a trough-shaped profile with a different manner than zircon. Apatite was another accessory phase for repository of all REEs. MREEs (e.g., KdDyapatite ≈ 61) were more compatible in apatite relative to LREEs (e.g., KdLaapatite ≈ 28) and HREEs (e.g., KdLuapatite ≈ 22) in felsic magmas [50]. Thus, the trough-shaped depleted REE profile relative to the basaltic parent suggests apatite crystallization in their evolution.
As the most remarkable point in REE profiles of the EVC rocks (Figure 7d–f), there was no negative Eu anomaly attributable to plagioclase crystallization, even in the most-silica rich samples. Water content and crystallization pressure (e.g., depth) had great effect on the crystallization assemblage and appearance of mineral phases. The presence of water and high crystallization pressure was dramatically lower the stability of plagioclase in basaltic magmas, inhibiting its crystallization, and thus increasing the proportion of Fe-Mg silicates that crystallized early. Therefore, plagioclase-rich fractionating assemblages are thought to be stable only at low pressures and low water contents [52,53,54,55]. Harker variation diagrams and plagioclase phenocryst-free nature of the EVC basaltic rocks (e.g., B2 basalts) suggest that no plagioclase crystallization occurred in their evolution, thus suggesting high crystallization pressure and high water content. However, plagioclase-phyric nature and major-trace element variations of the intermediate to felsic rocks showed that plagioclase crystallization played an important role in their evolution. Despite plagioclase crystallization, the absence of negative Eu anomaly in the intermediate to felsic rocks may be related to the oxidation state of magmatic system. Eu had two valencies (e.g., Eu+2 and Eu+3) with different partition coefficients in plagioclase. Similar to Sr, Eu+2 was more compatible in plagioclase than Eu+3. Eu+2/Eu+3 was expected to vary with oxygen fugacity, and Eu+3 was stable at high oxygen fugacity [56,57]. Thus, this suggests that plagioclase crystallization of the intermediate to felsic rocks occurred under oxidizing conditions.
5.2.3. Fractional Crystallization
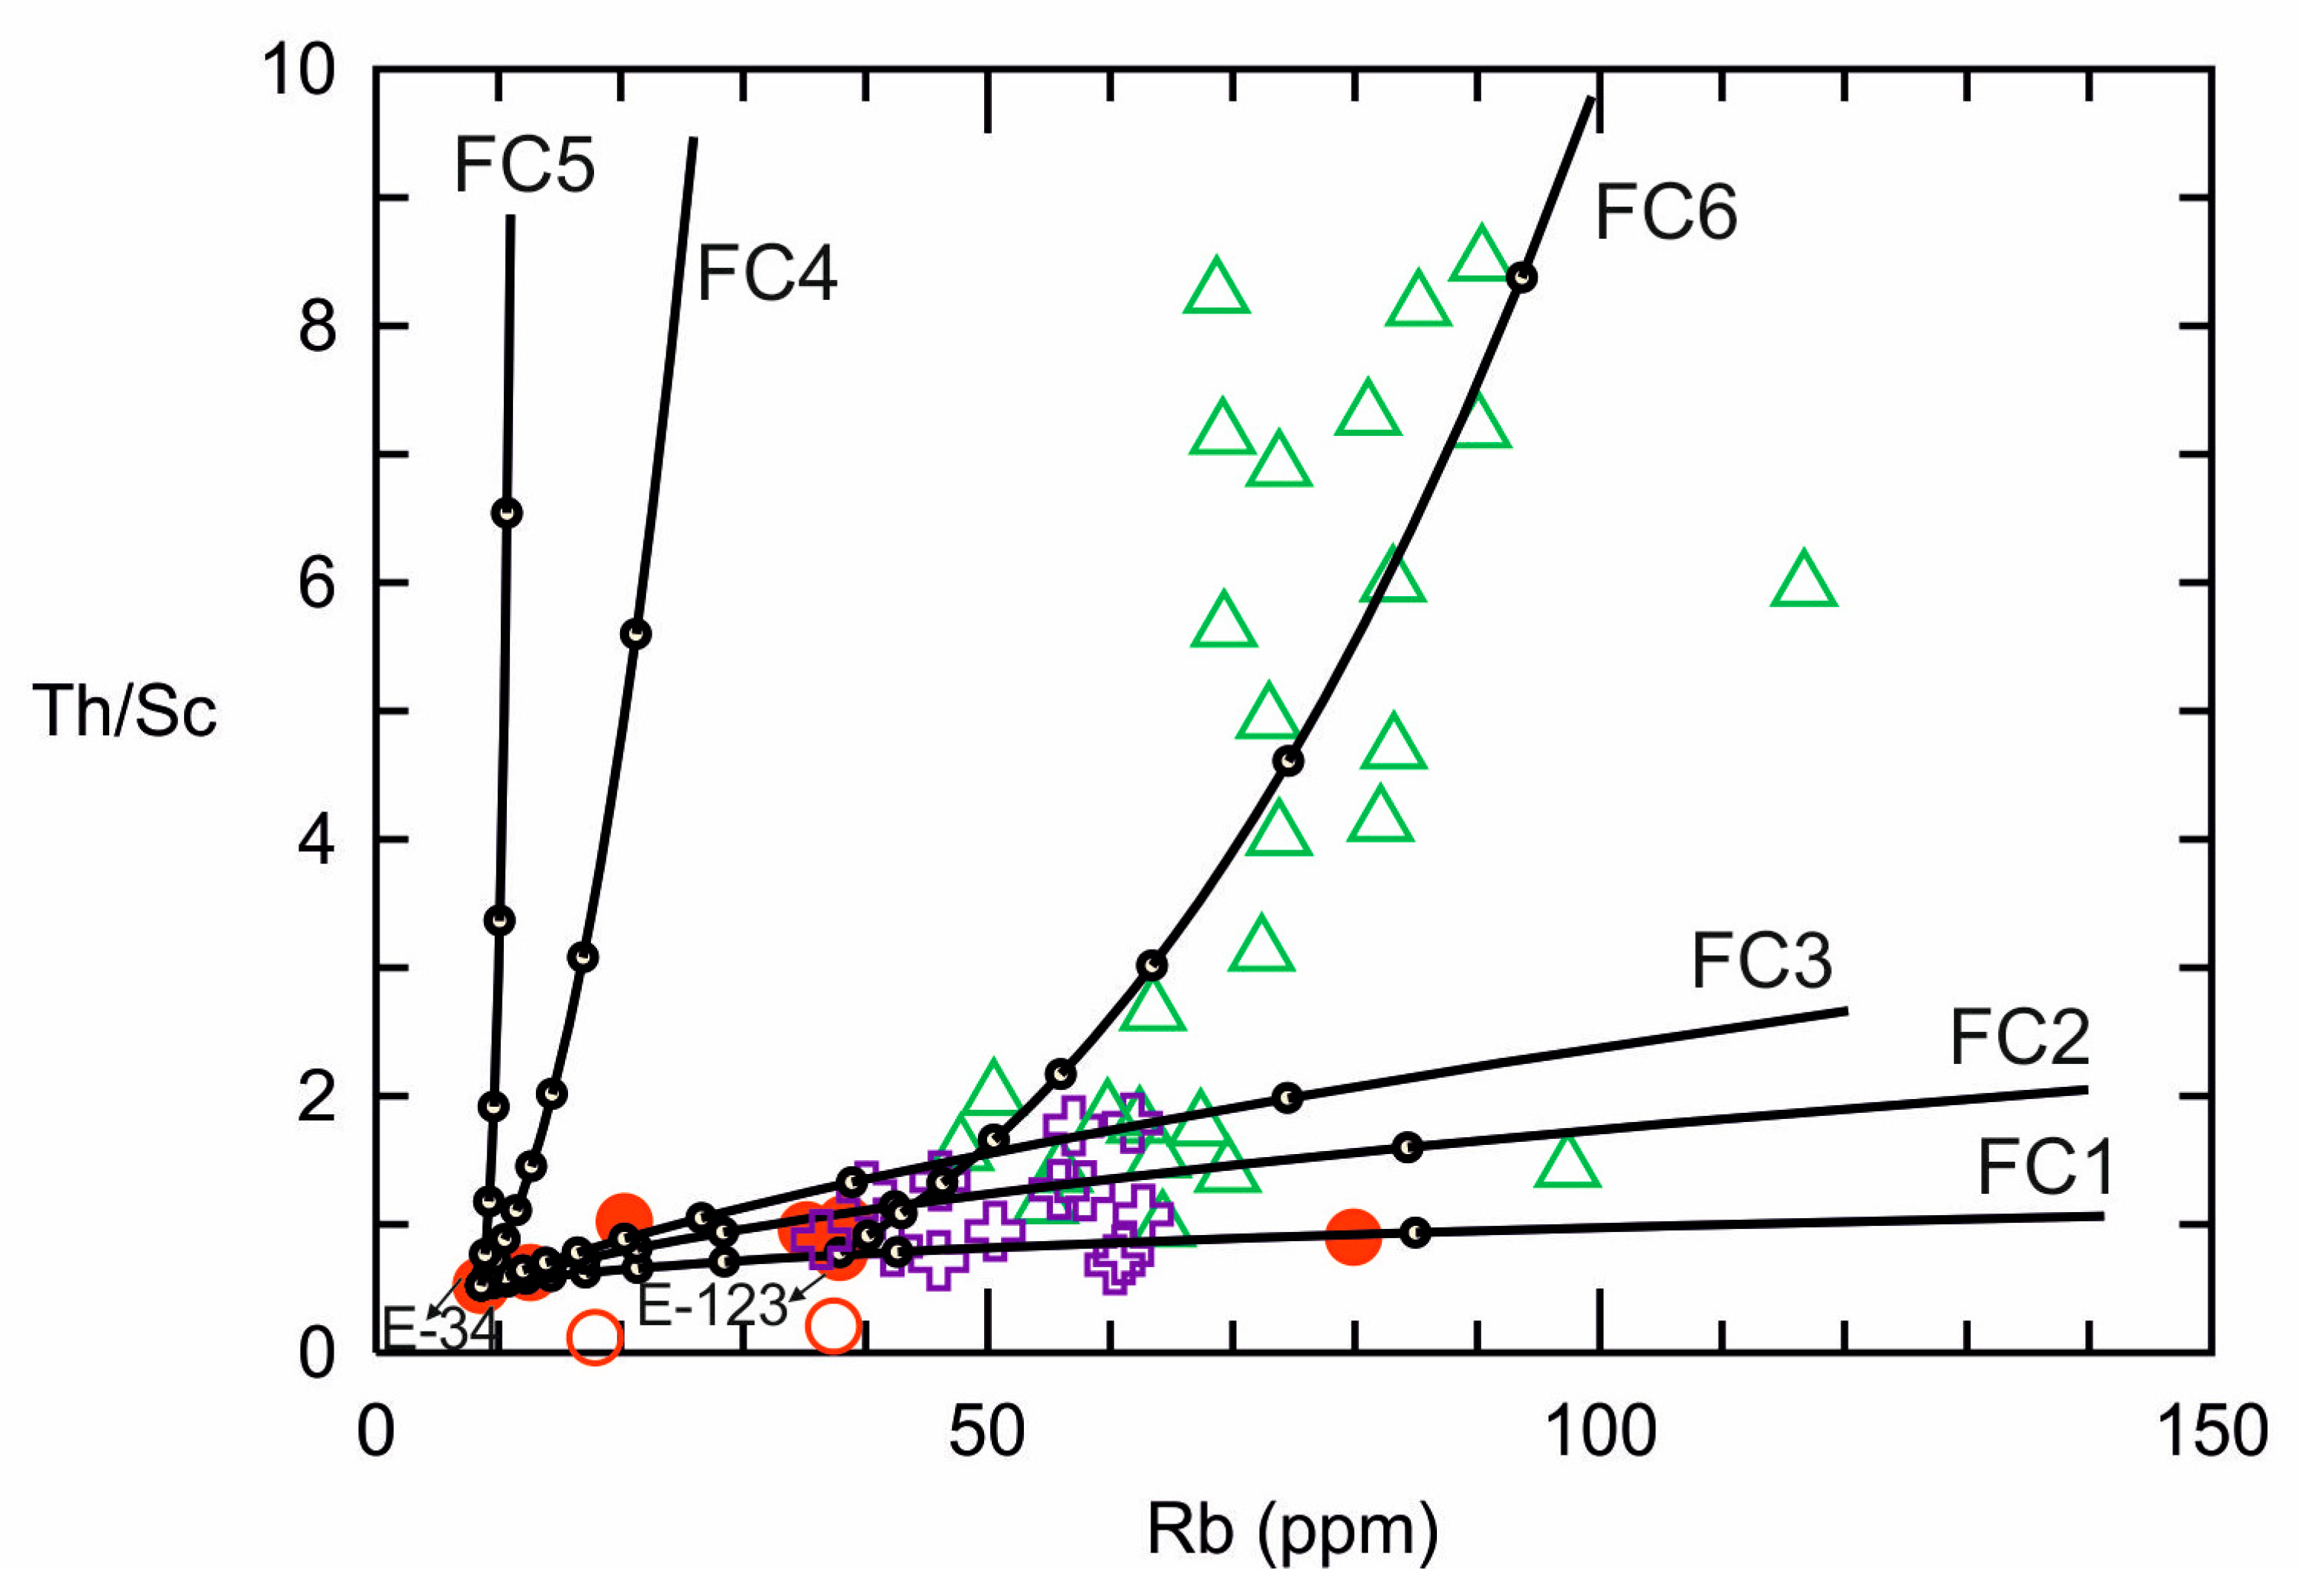
Here, I constructed a Rb vs. Th/Sc diagram to show the role of fractional crystallization and to make a geochemical model (Figure 11). Rb and Th were the most incompatible trace elements during the differentiation of basaltic magmas. On the other hand, except for olivine, Sc was a compatible trace element for ferromagnesian minerals (e.g., amphibole, orthopyroxene, clinopyroxene, biotite) and magnetite to some extent. In a Rb vs. Th/Sc plot, the closed-system FC trend was characterized by a large variation in Rb accompanied with the moderate Th/Sc variations, but substantial Th/Sc variations over a relatively narrow range in Rb can be explained by open-system processes (e.g., magma mixing or assimilation).
For the FC models, I hypothesized that B2 basalts represent potential parental magmas to the differentiated rocks, rather than B1 basalts, which have distinctly lower Th/Sc ratios. I used “PetroGram” [58] to plot FC curves based on the Rayleigh equation (Cl = CoFD−1) with F (e.g., fraction of melt remaining) values corresponding to 10% interval and tested them with “Igpet” and “FC-Modeler” [59]. In FC modeling, basaltic samples (E-34 and E-123) were chosen as a starting composition (Co). One of the most primitive basaltic samples, E-34, was used as Co to model a subset of samples from the basaltic to intermediate rocks, while E-123, which is the most evolved basaltic rock, was used as starting composition to model felsic rocks. Bulk partition coefficients (D) were calculated for the observed phenocryst mineralogy using partition coefficient (Kd) values from the GERM database (http://earthref.org). I calculated several FC vectors for different phenocryst assemblages, including hydrous (e.g., amphibole and biotite) and anhydrous (e.g., olivine and clinopyroxene) mafic phases plus plagioclase and Fe-Ti oxides regarding the observed phenocrysts in the EVC rocks. Thus, the FC1 and FC2 trends, including anhydrous phases, were characterized by a relatively flat trend, suggesting that samples (e.g., basaltic to some intermediate with rare felsic rocks) following these trends were evolved by fractional crystallization of mainly olivine and subordinate clinopyroxene. On the other hand, the FC3 trend with hydrous phases was represented by a steeper trend compatible with plagioclase and amphibole dominated fractionation history for the subset of samples. Thus, the FC modeling shows that all intermediate rocks and a small subset of felsic rocks can be produced by two different crystallization assemblages (e.g., olivine + clinopyroxene and plagioclase + amphibole + clinopyroxene + magnetite) from the same parental magma (E-34). However, most of the felsic rocks could not be directly produced from the E-34 parental magma using the observed phenocryst phases because these samples did not follow any FC model trend (e.g., FC4 and FC5). If I chose a more evolved basalt sample (e.g., 123), it would have been possible to produce the data defined by the felsic rocks with high Th/Sc ratios using a mineral assemblage of plagioclase + amphibole + biotite + magnetite (e.g., FC6). Taken as a whole, FC models showed that it was possible to reproduce the observed abundances for the selected trace elements by using the observed phenocryst phases in the EVC rocks.
5.2.4. Crustal Assimilation
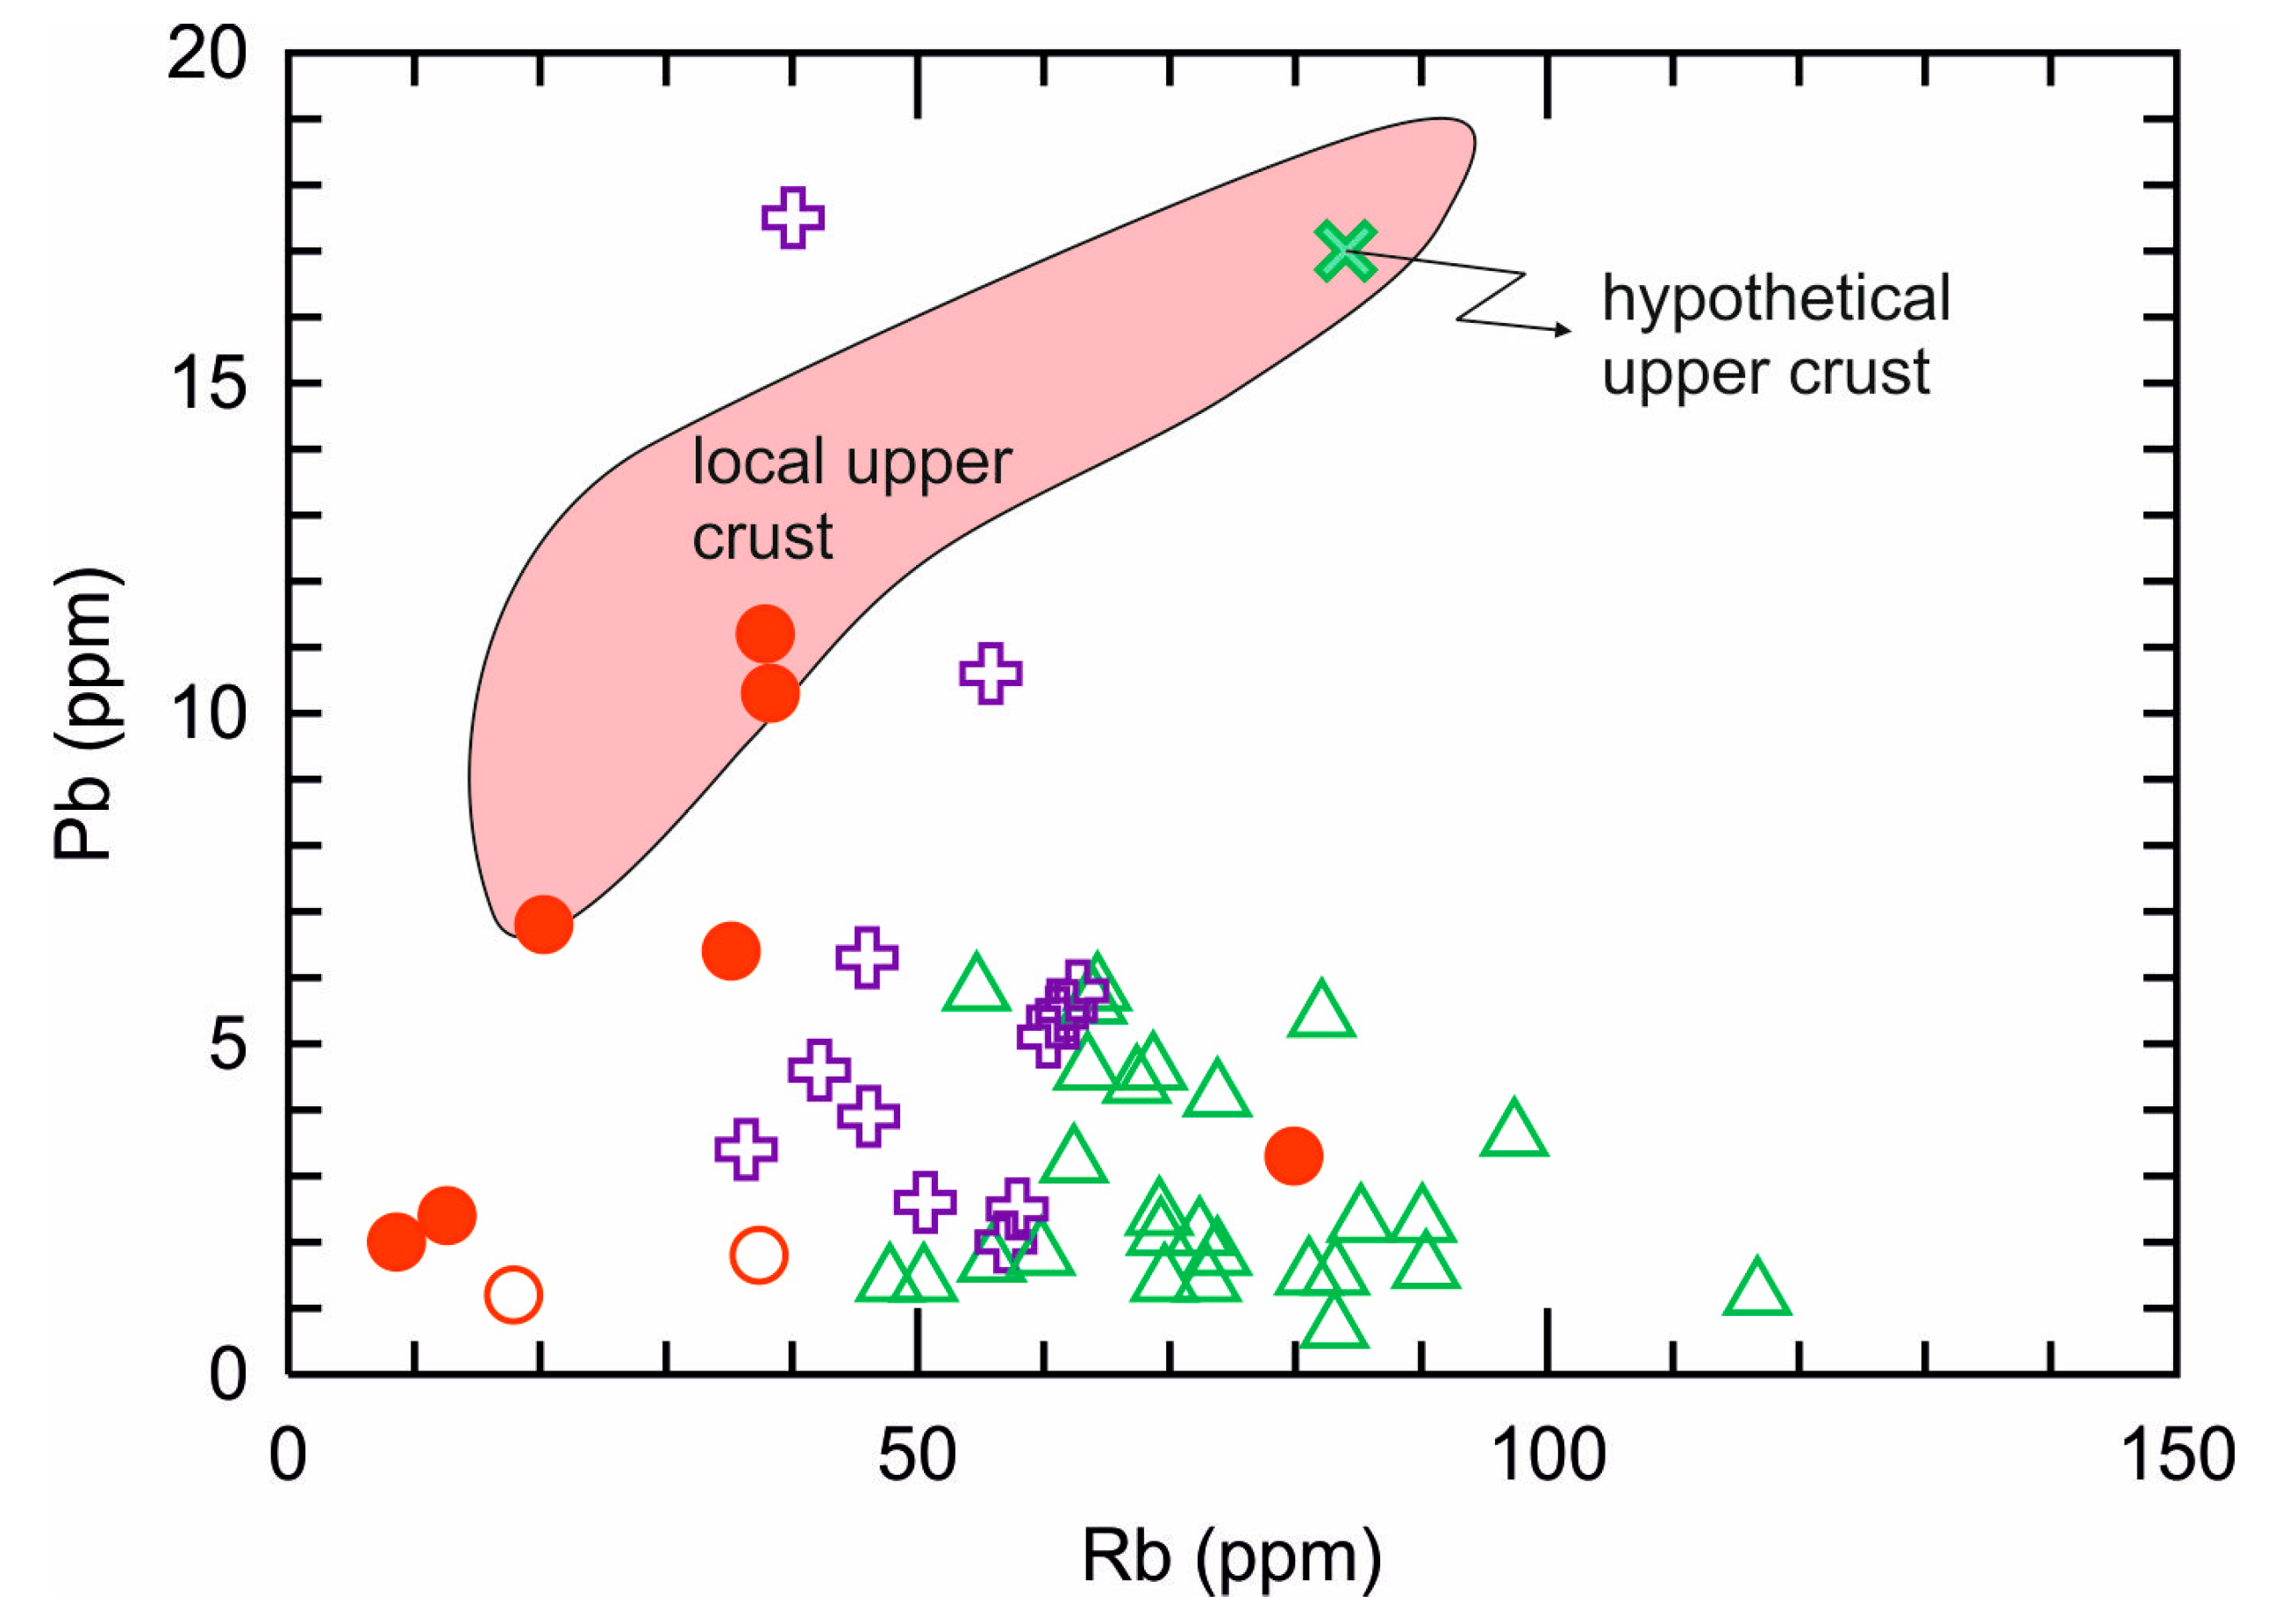
Pb is one of the most sensitive indicators of contamination of the mantle-derived magmas because of relatively high Pb contents of upper crustal rocks [60]. Thus, I formed a plot of Rb (e.g., differentiation index) vs. Pb (e.g., assimilation index), and also added the composition of the local crustal basement rocks represented by metaclastics of the Triassic Eymir unit and hypothetic upper continental crust for possible interaction with the EVC magmas into this diagram (Figure 12). In this diagram, B1 basalts did not form an array that intersected the field of local crustal rocks represented by the Eymir metaclastics and the hypothetical upper crust, which is not suggestive of interaction with the upper crustal rocks. B1 basalts were not radiometrically dated, but they were located at the base of volcanic sequence (see western columnar section in Figure 2), which is stratigraphically attributable to the older ages relative to the B2 basalts dated as 15.8 ± 0.9 Ma. B1 basalts also had the lowest Sr and highest Nd isotope ratios in the EVC rocks, meaning that interaction of the B1 basalts with the local crust was limited and possibly short in time. This is also supported by their very fine-grained groundmass texture, which could be related to the fast ascent of magmas within the crustal conduit system. On the other hand, Rb vs. Pb variations of the B2 basalts suggest that these basalts interacted with the local upper crust because there was a compositional intersection between the B2 basalts and this component. However, the felsic rocks did not plot in the compositional field defined by the local crustal rocks in this diagram (Figure 12). The B2 basalts correspondingly had higher Sr and lower Nd isotope ratios than those of the felsic rocks, suggesting crustal assimilation, which cannot be related to the AFC (assimilation- fractional crystallization) style. The B2 basalts were the youngest rocks in the EVC and were present at the top of volcanic sequence (see eastern columnar section in Figure 2), suggesting that they erupted last. Thus, I think that B2 basalts may have spent more time in contact within the upper crust, and thus they resulted more affected by contamination than evolved rocks. The medium-grained intergranular groundmass of the B2 basalts is another evidence of longer residence time within the crust.
Similar isotopic variations (e.g., Figure 9; 87Sr/86Sr decreased and 143Nd/144Nd increased with increasing SiO2 and decreasing MgO) between the B2 basalts and intermediate to felsic rocks have been reported from other volcanic suites, such as the Deccan Basalts-India [61,62], the Mull lavas-Scotland [63], and the Alicudi volcano (Aeolian arc)-Italy [64]. Of these, the Alicudi volcanic rocks support a model of fractional crystallization, followed by various degrees of wall-rock assimilation by magmas en route to the surface, generating correlations as explained above. In this model, basaltic magmas, which intruded into a deep reservoir, underwent fractional crystallization, followed by crustal assimilation in the shallow crust. Assimilation of the upper crust occurred shortly before eruption in volcanic conduits during magma ascent to the surface, and affected basalts more extensively than andesitic magma because of the higher temperature and lower viscosity of mafic melts [64]. Petrography, major and trace element variations, REE systematics, and FC modeling of the B2 basalts suggest that they must have underwent fractional crystallization in deep magma chambers because a plagioclase-free crystallization assemblage requires high pressure crystallization conditions in the deep crust. On the other hand, the strongly plagioclase-phyric character and major and trace element variations of the intermediate to felsic rocks require low-pressure crystallization conditions for their evolution in the upper crust. Thus, I think that assimilation style of the EVC magmas may be similar to those of the Alicudi volcano.
5.2.5. Magma Mixing
The EVC intermediate rocks were mainly characterized by disequilibrium textures (Figure 3), and they were found along linear arrays between the basaltic and felsic rocks in the most major and trace element variation diagrams (Figure 5 and Figure 6), which serve as a reminder of magma mixing [36,38,39,40,65,66]. So, assuming the EVC intermediate samples were produced by mixing a basaltic parent with the most siliceous lava, mixing models using least squares regression of the major and trace elements were performed for a subset of andesite/trachyandesite samples (e.g., E19, E29, and E9). To start modeling, I first chose an E-34 sample as a primitive basaltic end member and an E-47 sample, which is the most silicic sample in the EVC as a felsic end member. After choosing basaltic and silicic end members, a simple least squares binary mixing model was applied to test whether magma mixing was a possible mechanism in the generation of the intermediate units. In such calculations, ∑r2 (e.g., sum of squares of residuals), which is a measure of the differences between calculated and observed major and trace element abundances, was expected to be low, approximating zero for acceptable models. The calculated results (see Table S4) showed that the ∑r2 for the intermediate samples modeled were high. I also tried a lot of alternative for possible basaltic and felsic end members, but calculations always produced high ∑r2. This suggests that magma mixing is not a feasible magmatic process to explain the chemistry of these intermediate units.
5.3. Geodynamic Implications
I here mostly focused on the basaltic rocks from the EVC, as well as the GVP and PV, for comparison, since their composition gave the maximum information on the geodynamic setting in which they occurred. The EVC, GVP, and PV are products of the post-collisional phase of the Miocene volcanism in the NW Central Anatolia. The Published radiometric ages are 20–16 Ma for the EVC [19], 20–14 Ma for the PV [11], and >20–14 Ma to ~10 Ma for the GVP [12,13], clustering at two time intervals, the Early Miocene and Late Miocene. The formation of these volcanites is closely related to closing of the Northern branch of the Neotethys Ocean, which started to close by northward subduction during Late Cretaceous. Following this subduction, collision occurred between the Anatolide-Tauride Block and the Pontides along the İzmir-Ankara-Erzincan Suture Zone (İAESZ) (Figure 1). The EVC and GVP included both orogenic basalts and OIB-type anorogenic basalts, but the PV was characterized by only OIB-type anorogenic basalts. The orogenic signature in basalts from the EVC and GVP seems to be inherited from lithospheric mantle source modified by the earlier subduction process. However, OIB-type basalts from the EVC, GVP, and PV did not show subduction-related characteristics, and they are thought to be derived from the asthenospheric mantle source. Temel, Yürür, Alıcı, Varol, Gourgaud, Bellon, and Demirbağ [11] argued that the mantle source difference between the GVP and PV is mainly related to their location relative to the İAESZ. Therefore, they suggested that the magmatism of GVP located on the İASZ is the result of reactivation of the plate boundary in the post-collisional period, but mantle source of the PV located 100 km from this suture zone was not affected by subductional processes due to its distance to the suture zone. There is no consensus on the relationship between tectonic regime and magma formation in the region. Wilson, Tankut, and Guleç [13] argued that all Miocene volcanism generated in a transtensional tectonic regime is associated with movement along the North Anatolian Fault (NAF) zone (see Figure 1), but the others suggested that the Early Miocene volcanism is related to the extensional tectonic regime, and it switched to the transtensional tectonics in the Late Miocene [10,11,12]. Based on the published age and geochemical data, the GVP includes geochemically and geochronologically two distinct basalts: Early Miocene, subduction-related (e.g., orogenic) basalts and Late Miocene OIB-like anorogenic basalts, while the PV is characterized by the Early Miocene OIB-like basalts. Comparison of the EVC basalts with the GVP and PV showed that geochemistry of B1 basalts from the EVC was similar to those of the PV basalts, but geochemistry of B2 basalts resembled those of Early Miocene basalts of the GVP. The orogenic-type B2 basalts of the EVC were dated at ~16 Ma, which was the youngest age in the EVC. Although radiometric age of the OIB-like anorogenic B1 basalts of the EVC is not exactly known, they were observed at the base of the volcanic sequence, suggesting a relative age of Early Miocene. If so, coexistence of the orogenic volcanism with the OIB-like anorogenic one in the EVC implies that the switching in regime from extensional to transtensional tectonics may have been occurred in the Early Miocene, as suggested by Wilson, Tankut, and Guleç [13].
6. Conclusions
The most important results of this study based on the whole-rock elemental and Sr-Nd isotope geochemistry data from the Miocene Elmadağ Volcanic Complex (EVC) represented by mildly alkaline basaltic, and medium- to high-K calc-alkaline intermediate to felsic rock units can be summarized as follows:
- (a)
- Two distinct basaltic rocks (e.g., B1 and B2) derived from different mantle sources have been identified on the chemical and isotopic grounds in the EVC. Geochemistry of the B1 basaltic rocks was similar to those of oceanic island basalts (OIB), and they were derived from asthenospheric mantle source. However, B2 basalts had geochemical characteristics typical for orogenic basalts derived from subduction-modified lithospheric mantle source. B2 basalts represented parental magma to the intermediate to felsic rocks.
- (b)
- Major-trace element variations, REE systematics, and geochemical modeling showed that fractional crystallization of the observed mineral phase in the EVC rocks played an important role in the evolution of basaltic to felsic rocks. Likewise, Sr-Nd isotopic systematics suggests that crustal assimilation was also evident to some extent in the differentiation of B2 basalts. However, crustal assimilation style of the EVC magmas was different from the combined assimilation and fractional crystallization (AFC), and can be explained by fractional crystallization in deep magma chambers, followed by various degrees of wall-rock assimilation in the shallow crust.
- (c)
- The dominantly orogenic nature of the EVC rocks suggests that magma generation was mainly associated with the post-collisional extensional tectonic regime in the Central Anatolia, but the coexistence of OIB-like anorogenic rocks suggests variations in the extension dynamics during Miocene.
Supplementary Materials
The following are available online at https://www.mdpi.com/2076-3263/10/9/348/s1, Table S1: Whole-rock major and trace element analysis of the EVC rocks. Table S2: Sr-Nd isotope analysis of the EVC rocks. Table S3: Kd values used in FC modeling. Table S4: Magma mixing models for the selected intermediate rocks.
Funding
This research was funded by “Selçuk University, Scientific Research Projects Coordination Unit”, grant number “09401062”.
Acknowledgments
The author thanks to Lang Shi and Don Francis (McGill University, Canada) for microprobe analysis, Anton Eisenhauer (GEOMAR, Germany) for Sr-Nd isotope analysis, and Mesut Gündüz (Muğla Sıtkı Koçman University, Turkey) for his help during preparation of the GIS-based maps.
Conflicts of Interest
The author declares no conflict of interest.
References
- Şengör, A.M.C.; Yılmaz, Y. Tethyan evolution of Turkey: A plate tectonic approach. Tectonophysics 1981, 75, 181–241. [Google Scholar] [CrossRef]
- Şengör, A.M.C.; Yılmaz, Y.; Ketin, İ. Remnants of a pre-late Jurassic ocean in northern Turkey: Fragments of Permo-Triassic PaleoTethys? Discussion and Reply. Geol. Soc. Am. Bull. 1982, 93, 932–936. [Google Scholar] [CrossRef]
- Şengör, A.M.C.; Lom, N.; Sunal, G.; Zabcı, C.; Sancar, T. The phanerozoic palaeotectonics of Turkey. Part I: An inventory. Mediterr. Geosci. Rev. 2019, 1, 91–161. [Google Scholar] [CrossRef] [Green Version]
- Okay, A.I. Tectonic units and sutures in the Pontides, northern Turkey. In Tectonic Evolution of the Tethyan Region; Şengör, A.M.C., Ed.; Kluwer Academic Publications: Dordrecht, The Netherlands, 1989; pp. 109–115. [Google Scholar]
- Okay, A.I. Geology of Turkey: A Synopsis. Anschnitt 2008, 21, 19–42. [Google Scholar]
- Okay, A.I.; Tüysüz, O. Tethyan sutures of northern Turkey. In The Mediterranean Basins: Tertiary Extension within the Alpine Orogen; Durand, B., Jolivet, L., Hovarth, F., Séranne, M., Eds.; Special Publications, 156; Geological Society: London, UK, 1999; Volume 156, pp. 475–515. [Google Scholar]
- Okay, A.I.; Şengör, A.M.C.; Görür, N. Kinematic history of the opening of the Black Sea and its effect on the surrounding regions. Geology 1994, 22, 267–270. [Google Scholar] [CrossRef]
- Asan, K.; Kurt, H. Petrology and Geochemistry of Post-Collisional Early Miocene Volcanism in the Karacadag Area (Central Anatolia, Turkey). Acta Geol. Sin. 2011, 85, 1100–1117. [Google Scholar] [CrossRef]
- Kurt, H.; Asan, K.; Ruffet, G. The relationship between collision-related calcalkaline, and within-plate alkaline volcanism in the Karacadağ Area (Konya-Türkiye, Central Anatolia). Chem. Erde-Geochem. 2008, 68, 155–176. [Google Scholar] [CrossRef]
- Tankut, A.; Wilson, M.; Yihunie, T. Geochemistry and tectonic setting of Tertiary volcanism in the Güvem area, Anatolia, Turkey. J. Volcanol. Geotherm. Res. 1998, 85, 285–301. [Google Scholar] [CrossRef]
- Temel, A.; Yürür, T.; Alıcı, P.; Varol, E.; Gourgaud, A.; Bellon, H.; Demirbağ, H. Alkaline series related to Early-Middle Miocene intra-continental rifting in a collision zone: An example from Polatlı, Central Anatolia, Turkey. J. Asian Earth Sci. 2010, 38, 289–306. [Google Scholar] [CrossRef]
- Varol, E.; Temel, A.; Yürür, T.; Gourgaud, A.; Bellon, H. Petrogenesis of the Neogene bimodal magmatism of the Galatean Volcanic Province, Central Anatolia, Turkey. J. Volcanol. Geotherm. Res. 2014, 280, 14–29. [Google Scholar] [CrossRef]
- Wilson, M.; Tankut, A.; Guleç, N. Tertiary volcanism of the Galatia province, north-west Central Anatolia, Turkey. Lithos 1997, 42, 105–121. [Google Scholar] [CrossRef]
- MTA. Magmatic Rocks Map of Turkey; General Directorate of Mineral Research and Explorations: Ankara, Turkey, 2013.
- Bonin, B. Do coeval mafic and felsic magmas in post-collisional to within-plate regimes necessarily imply two contrasting, mantle and crustal, sources? A review. Lithos 2004, 78, 1–24. [Google Scholar] [CrossRef]
- Lustrino, M.; Morra, V.; Fedele, L.; Serracino, M. The transition between ‘orogenic’ and ‘anorogenic’ magmatism in the western Mediterranean area: The Middle Miocene volcanic rocks of Isola del Toro (SW Sardinia, Italy). Terra Nova 2007, 19, 148–159. [Google Scholar] [CrossRef]
- Lustrino, M.; Wilson, M. The circum-Mediterranean anorogenic Cenozoic igneous province. Earth-Sci. Rev. 2007, 81, 1–65. [Google Scholar] [CrossRef]
- Wilson, M.; Bianchini, G. Tertiary-Quaternary Magmatism within the Mediterranean and Surrounding Regions. Geol. Soc. Lond. Spec. Publ. 1999, 156, 141–168. [Google Scholar] [CrossRef]
- Dönmez, M.; Akçay, A.E.; Türkecan, A.; Satır, M.; Evcimen, Ö.; Atakay, E.; Görmüş, T. The Stratigraphy of Late Cretaceous-Tertiary Volcanic Rocks in Ankara and Surroundings and New Age Findings. In Proceedings of the 62nd Geological Kurultai of Turkey, Ankara, Turkey, 13−17 April 2009; p. 633. [Google Scholar]
- Görmüş, T. Ankara (Gölbaşı güneydoğusu-Sincan) Volkanitlerinin Petrolojisi ve Jeokimyası. Ph.D. Thesis, Hacettepe Üniversitesi, Ankara, Turkey, 2009. [Google Scholar]
- Sayıt, K.; Göncüoglu, M.C. Geodynamic evolution of the Karakaya Mélange Complex, Turkey: A review of geological and petrological constraints. J. Geodyn. 2013, 65, 56–65. [Google Scholar] [CrossRef]
- Sayıt, K.; Göncüoglu, M.C. Geochemistry of mafic rocks of the Karakaya complex, Turkey: Evidence for plume-involvement in the Palaeotethyan extensional regime during the Middle and Late Triassic. Int. J. Earth Sci. 2009, 98, 367–385. [Google Scholar] [CrossRef]
- Sayit, K.; Tekin, U.K.; Göncüoglu, M.C. Early-middle Carnian radiolarian cherts within the Eymir Unit, Central Turkey: Constraints for the age of the Palaeotethyan Karakaya Complex. J. Asian Earth Sci. 2011, 42, 398–407. [Google Scholar] [CrossRef]
- Sayıt, K. Geochemistry and Petrogenesis of the Oceanic Island and SubductionRelated Assemblages from the Palaeotetyhan Karakaya Subduction/Accretion Complex, Central and NW Turkey. Ph.D. Thesis, Middle East Technical University, Ankara, Turkey, 2010. [Google Scholar]
- Koçyiğit, A. An example of an accretionary forearc basin from northern Central Anatolia and its implications for the history of subduction of Neo-Tethys in Turkey. Geol. Soc. Am. Bull. 1991, 103, 22–36. [Google Scholar] [CrossRef]
- Görür, N.; Oktay, F.Y.; Seymen, İ.; Şengör, A.M.C. Palaeotectonic evolution of the Tuzgölü basin complex, Central Turkey: Sedimentary record of a Neo-Tethyan closure. Geol. Soc. Lond. Spec. Publ. 1984, 17, 467–482. [Google Scholar] [CrossRef]
- Çemen, I.; Göncüoglu, M.C.; Dirik, K. Structural Evolution of the Tuzgölü Basin in Central Anatolia, Turkey. J. Geol. 1999, 107, 693–706. [Google Scholar] [CrossRef] [PubMed]
- Akyürek, B.; Duru, M.; Sütçü, Y.F.; Papak, İ.; Şaroğlu, F.; Pehlivan, N.; Gönenç, O.; Granit, S.; Yaşar, T. Geological Map of Turkey with 1:100.000 Scale; General Directorate of Mineral Research and Explorations (MTA): Ankara, Turkey, 1997.
- Dönmez, M.; Akçay, A.E.; Kara, H.; Yergök, A.F.; Esentürk, K. Geological Map of Turkey with 1:100.000 Scale; General Directorate of Mineral Research and Explorations (MTA): Ankara, Turkey, 2008. [Google Scholar]
- Hoernle, K.; Tilton, G.R. Sr-Nd-Pb isotope data for Fuerteventura (Canary Islands) basal complex and subaerial volcanics: Applications to magma genesis and evolution. Schweiz. Mineral. Petrogr. Mitteilungen 1991, 71, 3–18. [Google Scholar]
- Geldmacher, J.; Hoernle, K.; Klügel, A.; Bogaard, P.V.D.; Wombacher, F.; Berning, B. Origin and geochemical evolution of the Madeira-Tore Rise (eastern North Atlantic). J. Geophys. Res. Solid Earth 2006, 111, B09206. [Google Scholar] [CrossRef] [Green Version]
- Hoernle, K.; Abt, D.L.; Fischer, K.M.; Nichols, H.; Hauff, F.; Abers, G.A.; van den Bogaard, P.; Heydolph, K.; Alvarado, G.; Protti, M.; et al. Arc-parallel flow in the mantle wedge beneath Costa Rica and Nicaragua. Nature 2008, 451, 1094–1097. [Google Scholar] [CrossRef] [PubMed]
- Tanaka, T.; Togashi, S.; Kamioka, H.; Amakawa, H.; Kagami, H.; Hamamoto, T.; Yuhara, M.; Orihashi, Y.; Yoneda, S.; Shimizu, H.; et al. JNdi-1: A neodymium isotopic reference in consistency with LaJolla neodymium. Chem. Geol. 2000, 168, 279–281. [Google Scholar] [CrossRef]
- McArthur, J.M.; Howarth, R.J.; Bailey, T.R. Strontium Isotope Stratigraphy: LOWESS Version 3: Best Fit to the Marine Sr-Isotope Curve for 0–509 Ma and Accompanying Look-up Table for Deriving Numerical Age. J. Geol. 2001, 109, 155–170. [Google Scholar] [CrossRef] [Green Version]
- Ginibre, C.; Wörner, G.; Kronz, A. Crystal zoning as an archive for magma evolution. Elements 2007, 3, 261–266. [Google Scholar] [CrossRef]
- Streck, M.J. Mineral Textures and Zoning as Evidence for Open System Processes. Rev. Mineral. Geochem. 2008, 69, 595–622. [Google Scholar] [CrossRef]
- Nelson, S.T.; Montana, A. Sieve-textured plagioclase in volcanic rocks produced by rapid decompression. Am. Miner. 1992, 77, 1242–1249. [Google Scholar]
- Tsuchiyama, A. Dissolution kinetics of plagioclase in the melt of the system diopside-albite-anorthite, and origin of dusty plagioclase in andesites. Contr. Mineral. Petrol. 1985, 89, 1–16. [Google Scholar] [CrossRef]
- Nixon, G.T.; Pearce, T.H. Laser-interferometry of oscillatory zoning in plagioclase: The record of magma mixing and phenocryst recycling in calc-alkaline magma chambers, Iztaccihuat Volcano, Mexico. Am. Miner. 1987, 72, 1144–1162. [Google Scholar]
- Tepley, F.J., III; Davidson, J.P.; Tilling, R.I.; Arth, J.G. Magma Mixing, Recharge and Eruption Histories Recorded in Plagioclase Phenocrysts from El Chichón Volcano, Mexico. J. Petrol. 2000, 41, 1397–1411. [Google Scholar] [CrossRef] [Green Version]
- Le Bas, M.J.; Le Maitre, R.W.; Streckeisen, A.; Zanettin, B. A Chemical Classification of Volcanic Rocks Based on the Total Alkali-Silica Diagram. J. Petrol. 1986, 27, 745–750. [Google Scholar] [CrossRef]
- Peccerillo, A.; Taylor, S.R. Geochemistry of Eocene calc-alkaline volcanic rocks from the Kastamonu area, Northern Turkey. Contr. Mineral. Petrol. 1976, 58, 63–81. [Google Scholar] [CrossRef]
- Irvine, T.N.; Baragar, W.R.A. A Guide to the Chemical Classification of the Common Volcanic Rocks. Can. J. Earth Sci. 1971, 8, 523–548. [Google Scholar] [CrossRef]
- Hofmann, A.W. Chemical differentiation of the Earth: The relationship between mantle, continental crust, and oceanic crust. Earth Planet. Sci. Lett. 1988, 90, 297–314. [Google Scholar] [CrossRef] [Green Version]
- Sun, S.; McDonough, W.F. Chemical and isotopic systematic of oceanic basalts: Implications for mantle compositions and processes. In Magmatism in the Ocean Basins; Saunders, A.D., Norry, M.J., Eds.; Special Publication 42; Geological Society of London: London, UK, 1989; pp. 313–345. [Google Scholar]
- Zindler, A.; Hart, S. Chemical geodynamics. Annu. Rev. Earth Planet. Sci. 1986, 14, 493–571. [Google Scholar] [CrossRef]
- Pearce, J.A. Geochemical fingerprinting of oceanic basalts with applications to ophiolite classification and the search for Archean oceanic crust. Lithos 2008, 100, 14–48. [Google Scholar] [CrossRef]
- Pearce, J.A. Role of the sub-continental lithosphere in magma genesis at active continental margins. In Continental Basalts and Mantle Xenoliths; Hawkesworth, C.J., Norry, M.J., Eds.; Shiva Publishing Ltd.: Cambridge, UK, 1983; pp. 230–249. [Google Scholar]
- Davidson, J.; Turner, S.; Handley, H.; Macpherson, C.; Dosseto, A. Amphibole “sponge” in arc crust? Geology 2007, 35, 787–790. [Google Scholar] [CrossRef]
- Fujimaki, H. Partition coefficients of Hf, Zr, and REE between zircon, apatite, and liquid. Contr. Mineral. Petrol. 1986, 94, 42–45. [Google Scholar] [CrossRef]
- Mahood, G.; Hildreth, W. Large partition coefficients for trace elements in high-silica rhyolites. Geochim. Cosmochim. Acta 1983, 47, 11–30. [Google Scholar] [CrossRef]
- Sisson, T.W.; Grove, T.L. Experimental investigations of the role of H2O in calc-alkaline differentiation and subduction zone magmatism. Contr. Mineral. Petrol. 1993, 113, 143–166. [Google Scholar] [CrossRef]
- Baker, D.R.; Eggler, D.H. Fractionation paths of Atka (Aleutians) high-alumina basalts: Constraints from phase relations. J. Volcanol. Geotherm. Res. 1983, 18, 387–404. [Google Scholar] [CrossRef]
- Eggler, D.H. Water-saturated and undersaturated melting relations in a Paricutin andesite and an estimate of water content in the natural magma. Contr. Mineral. Petrol. 1972, 34, 261–271. [Google Scholar] [CrossRef]
- Presnall, D.C.; Dixon, S.A.; Dixon, J.R.; O’Donnell, T.H.; Brenner, N.L.; Schrock, R.L.; Dycus, D.W. Liquidus phase relations on the join diopside-forsterite-anorthite from 1 atm to 20 kbar: Their bearing on the generation and crystallization of basaltic magma. Contr. Mineral. Petrol. 1978, 66, 203–220. [Google Scholar] [CrossRef]
- McKay, G.A. Partitioning of rare earth elements between major silicate minerals and basaltic melts. Rev. Mineral. Geochem. 1989, 21, 45–77. [Google Scholar]
- Drake, M.J.; Weill, D.F. Partition of Sr, Ba, Ca, Y, Eu2+, Eu3+, and other REE between plagioclase feldspar and magmatic liquid: An experimental study. Geochim. Cosmochim. Acta 1975, 39, 689–712. [Google Scholar] [CrossRef]
- Gündüz, M.; Asan, K. PetroGram: An Excel-based petrology program for modeling of magmatic processes. Geosci. Front. 2020. [Google Scholar] [CrossRef]
- Keskin, M. FC-Modeler: A Microsoft® Excel© spreadsheet program for modeling Rayleigh fractionation vectors in closed magmatic systems. Comput. Geosci. 2002, 28, 919–928. [Google Scholar] [CrossRef]
- Rudnick, R.L.; Gao, S. 3.01-Composition of the Continental Crust A2-Turekian, Heinrich D. HollandKarl K. In Treatise on Geochemistry; Pergamon: Oxford, UK, 2003; pp. 1–64. [Google Scholar] [CrossRef]
- Devey, C.W.; Cox, K.G. Relationships between crustal contamination and crystallisation in continental flood basalt magmas with special reference to the Deccan Traps of the Western Ghats, India. Earth Planet. Sci. Lett. 1987, 84, 59–68. [Google Scholar] [CrossRef]
- Cox, K.G.; Hawkesworth, C.J. Geochemical Stratigraphy of the Deccan Traps at Mahabaleshwar, Western Ghats, India, with Implications for Open System Magmatic Processes. J. Petrol. 1985, 26, 355–377. [Google Scholar] [CrossRef]
- Kerr, A.C.; Kempton, P.D.; Thompson, R.N. Crustal assimilation during turbulent magma ascent (ATA); new isotopic evidence from the Mull Tertiary lava succession, N. W. Scotland. Contr. Mineral. Petrol. 1995, 119, 142–154. [Google Scholar] [CrossRef]
- Peccerillo, A.; Dallai, L.; Frezzotti, M.L.; Kempton, P.D. Sr-Nd-Pb-O isotopic evidence for decreasing crustal contamination with ongoing magma evolution at Alicudi volcano (Aeolian arc, Italy): Implications for style of magma-crust interaction and for mantle source compositions. Lithos 2004, 78, 217–233. [Google Scholar] [CrossRef]
- Bacon, C.R. Magmatic inclusions in silicic and intermediate volcanic rocks. J. Geophys. Res. Solid Earth 1986, 91, 6091–6112. [Google Scholar] [CrossRef]
- Fourcade, S.; Allegre, C.J. Trace elements behavior in granite genesis: A case study The calc-alkaline plutonic association from the Querigut complex (Pyrénées, France). Contr. Mineral. Petrol. 1981, 76, 177–195. [Google Scholar] [CrossRef]
Figure 1.
Simplified tectonic map of Turkey showing the major suture zones (heavy black lines with filled triangles), arc systems (heavy red lines with filled triangles) and continental blocks [6], and distribution of the main Neogene volcanic fields [14]. EAVP: Eastern Anatolian Volcanic Province, CAVP: Central Anatolian Volcanic Province, GVP: Galatia Volcanic Province, PV: Polatlı Volcanites, EVC: Elmadağ Volcanic Complex, KKV: Kulu-Karacadağ Volcanites, KAIVP: Kırka-Afyon-Isparta Volcanic Province, WAVP: Western Anatolian Volcanic Province, YVC: Yamadağ Volcanic Complex, KV: Karacadağ Volcano, İAESZ: İzmir-Ankara-Erzincan Suture Zone, ITSZ: Inner Tauride Suture Zone, BSZ: Bitlis Suture Zone, IPSZ: Intra-Pontide Suture Zone, ASZ: Antalya Suture Zone, NAF: North Anatolian Fault, EAF: East Anatolian Fault, DSF: Dead Sea Fault.

Figure 2.
Simplified geological map of the study area [28,29]. Sample numbers are displayed both on the left side of each generalized columnar section and on the map. The symbols showing sample locations on the map (circle for basalt, plus for trachyandesite and andesite, and triangle for dacite and rhyolite) represent the graphic code that will be used coherently throughout the article. Published radiometric ages given in the columnar sections are based on the K/Ar method [19].

Figure 3.
Microphotos of the main mineralogical and textural features of the EVC rocks; (a) olivine and plagioclase phenocrysts in a fine-grained groundmass from B1 basaltic rocks; (b) a clinopyroxene phenocryst showing hour-glass zoning (see arrow) in a medium-grained intergranular groundmass from B2 basaltic rocks; (c) a sieve-textured, resorbed and anhedral plagioclase phenocryst from intermediate rocks; (d) a pseudomorphed amphibole phenocryst in trachytic groundmass from intermediate rocks; (e) a sieve-textured, euhedral plagioclase phenocryst from felsic rocks; (f) a biotite phenocryst in plagioclase-rich trachytic groundmass from felsic rocks; (g) an embayed quartz phenocryst from felsic rocks; (h) zircon and apatite inclusions in a plagioclase phenocryst from felsic rocks.

Figure 4.
Geochemical classification diagrams of the EVC: (a) Total-Alkali Silica (TAS) diagram of Le Bas et al. [41]; (b) K2O (%) vs. SiO2 (%) diagram of Peccerillo and Taylor [42]. B: Basalt, BA: Basaltic Andesite, A: Andesite, D: Dacite, R: Rhyolite, TB: Trachybasalt, BTA: Basaltic trachyandesite, TA: Trachyandesite, T&TD: Trachyte & trachydacite. Alkaline-subalkaline division from Irvine and Baragar [43]. All analyses were recalculated to 100% on a water-free basis for TAS classification. Yellow and blue fields represent compositions of the Galatia Volcanic Province and Polatlı Volcanics, respectively.

Figure 5.
SiO2 vs. the selected major oxide variations of the EVC units. Arrows show possible fractionation trends by mineral phases. Symbols as in Figure 4.
Figure 5.
SiO2 vs. the selected major oxide variations of the EVC units. Arrows show possible fractionation trends by mineral phases. Symbols as in Figure 4.

Figure 6.
SiO2 vs. the selected trace element variations of the EVC units. Arrows show possible fractionation trends by mineral phases. Symbols as in Figure 4. Error bars (1σ) are shown for Zr and Th plots. Error for other trace elements is lower than symbol size.
Figure 6.
SiO2 vs. the selected trace element variations of the EVC units. Arrows show possible fractionation trends by mineral phases. Symbols as in Figure 4. Error bars (1σ) are shown for Zr and Th plots. Error for other trace elements is lower than symbol size.

Figure 7.
N-MORB [44]- and Chondrite [45]-normalized multielement and REE patterns of the basaltic (a,d) and intermediate (b,e) to felsic (c,f) samples from the EVC. B1 and B2 refer to two different primitive basaltic rocks in terms of enrichment characteristics. Solid red line represents a possible parental basaltic magma to the intermediate to felsic rocks.

Figure 8.
Sr-Nd isotope correlation diagram for the EVC. DMM (depleted MORB mantle), HIMU (high µ mantle), PREMA (Prevalent Mantle), BSE (Bulk Silicate Earth), and EMI (enriched mantle) isotopic reservoirs are from Zindler and Hart [46]. Yellow triangle represents the GVP Late Miocene Basalt. GVP: Galatia Volcanic Province [13], PV: Polatlı Volcanites [11]. Symbols are in Figure 4.

Figure 9.
SiO2 vs. 87Sr/86Sr (a) and 143Nd/144Nd (b), and MgO vs. 87Sr/86Sr (c), and 143Nd/144Nd (d) variations of the EVC rocks. Symbols as in Figure 4.
Figure 9.
SiO2 vs. 87Sr/86Sr (a) and 143Nd/144Nd (b), and MgO vs. 87Sr/86Sr (c), and 143Nd/144Nd (d) variations of the EVC rocks. Symbols as in Figure 4.

Figure 10.
(a) Th/Yb vs. Nb/Yb plot [47] and (b) incompatible trace element patterns [48] of the EVC representative basaltic rocks for comparison with the GVP and PV (see Figure 8 for abbreviations and references). N-MORB: Normal-type mid-ocean ridge basalts, E-MORB: Enriched-type mid-ocean ridge basalts, OIB: Oceanic island basalts.

Figure 11.
Rb (ppm) vs. Th/Sc plot showing Rayleigh fractional crystallization modeling for the EVC rocks. Black circles on each curve correspond to 10% F value. FC1: 0.9 Ol + 0.1 Cpx (Basic; DRb:0.053; DTh:0.039; DSc: 0.292); FC2: 0.8 Ol + 0.2 Cpx (Basic; DRb:0.086; DTh:0.038; DSc: 0.524); FC3: 0.7 Plg + 20 Amp + 0.05 Cpx + 0.05 Mag (Basic; DRb:0.0623; DTh:0.0233; DSc: 0.6027); FC4: 0.7 Plg + 0.15 Amp + 0.1 Bio + 0.05 Mag (Intermediate; DRb:0.438; DTh:0.069; DSc: 1.543); FC5: 0.7 Plg + 0.15 Amp + 0.1 Bio + 0.05 Mag (Acidic; DRb:0.6847; DTh:0.0935; DSc: 3.7405); FC6: 0.7 Plg + 0.15 Amp + 0.1 Bio + 0.05 Mag (Intermediate; DRb:0.438; DTh:0.069; DSc: 1.543). Kd’s used for calculations of D values are given in Table S3. Amp: Amphibole; Plg: Plagioclase; Ol: Olivine; Bio: Biotite; Cpx: Clinopyroxene; Mag: Magnetite.

Figure 12.
Rb (ppm) vs. Pb (ppm) plot showing compositions of the EVC, local basement rocks represented by the Eymir metaclastics (unpublished data of Kaan Sayıt) and hypothetical upper crust [60].
Figure 12.
Rb (ppm) vs. Pb (ppm) plot showing compositions of the EVC, local basement rocks represented by the Eymir metaclastics (unpublished data of Kaan Sayıt) and hypothetical upper crust [60].

© 2020 by the author. Licensee MDPI, Basel, Switzerland. This article is an open access article distributed under the terms and conditions of the Creative Commons Attribution (CC BY) license (http://creativecommons.org/licenses/by/4.0/).
Share and Cite
MDPI and ACS Style
Asan, K. Whole-Rock Elemental and Sr-Nd Isotope Geochemistry and Petrogenesis of the Miocene Elmadağ Volcanic Complex, Central Anatolia (Ankara, Turkey). Geosciences 2020, 10, 348. https://doi.org/10.3390/geosciences10090348
AMA Style
Asan K. Whole-Rock Elemental and Sr-Nd Isotope Geochemistry and Petrogenesis of the Miocene Elmadağ Volcanic Complex, Central Anatolia (Ankara, Turkey). Geosciences. 2020; 10(9):348. https://doi.org/10.3390/geosciences10090348
Chicago/Turabian StyleAsan, Kürşad. 2020. "Whole-Rock Elemental and Sr-Nd Isotope Geochemistry and Petrogenesis of the Miocene Elmadağ Volcanic Complex, Central Anatolia (Ankara, Turkey)" Geosciences 10, no. 9: 348. https://doi.org/10.3390/geosciences10090348
Note that from the first issue of 2016, this journal uses article numbers instead of page numbers. See further details here.