The Effectiveness of Dog Population Management: A Systematic Review

 ,
,
Abstract
:Simple Summary
Abstract
1. Introduction
1.1. The Dog Population
1.2. Reasons for Managing Free-Roaming Dog Populations
1.2.1. The Impact of Free-Roaming Dogs on Public Health
1.2.2. The Impact of Free-Roaming Dogs on Wild and Domestic Animals
1.2.3. Health and Welfare of Free-Roaming Dogs
1.3. Methods of Managing Dog Populations
1.3.1. Responsible Groups and Motivations for Dog Population Management
1.3.2. Culling
1.3.3. Sheltering
1.3.4. Fertility Control
1.4. Study Aims
2. Materials and Methods
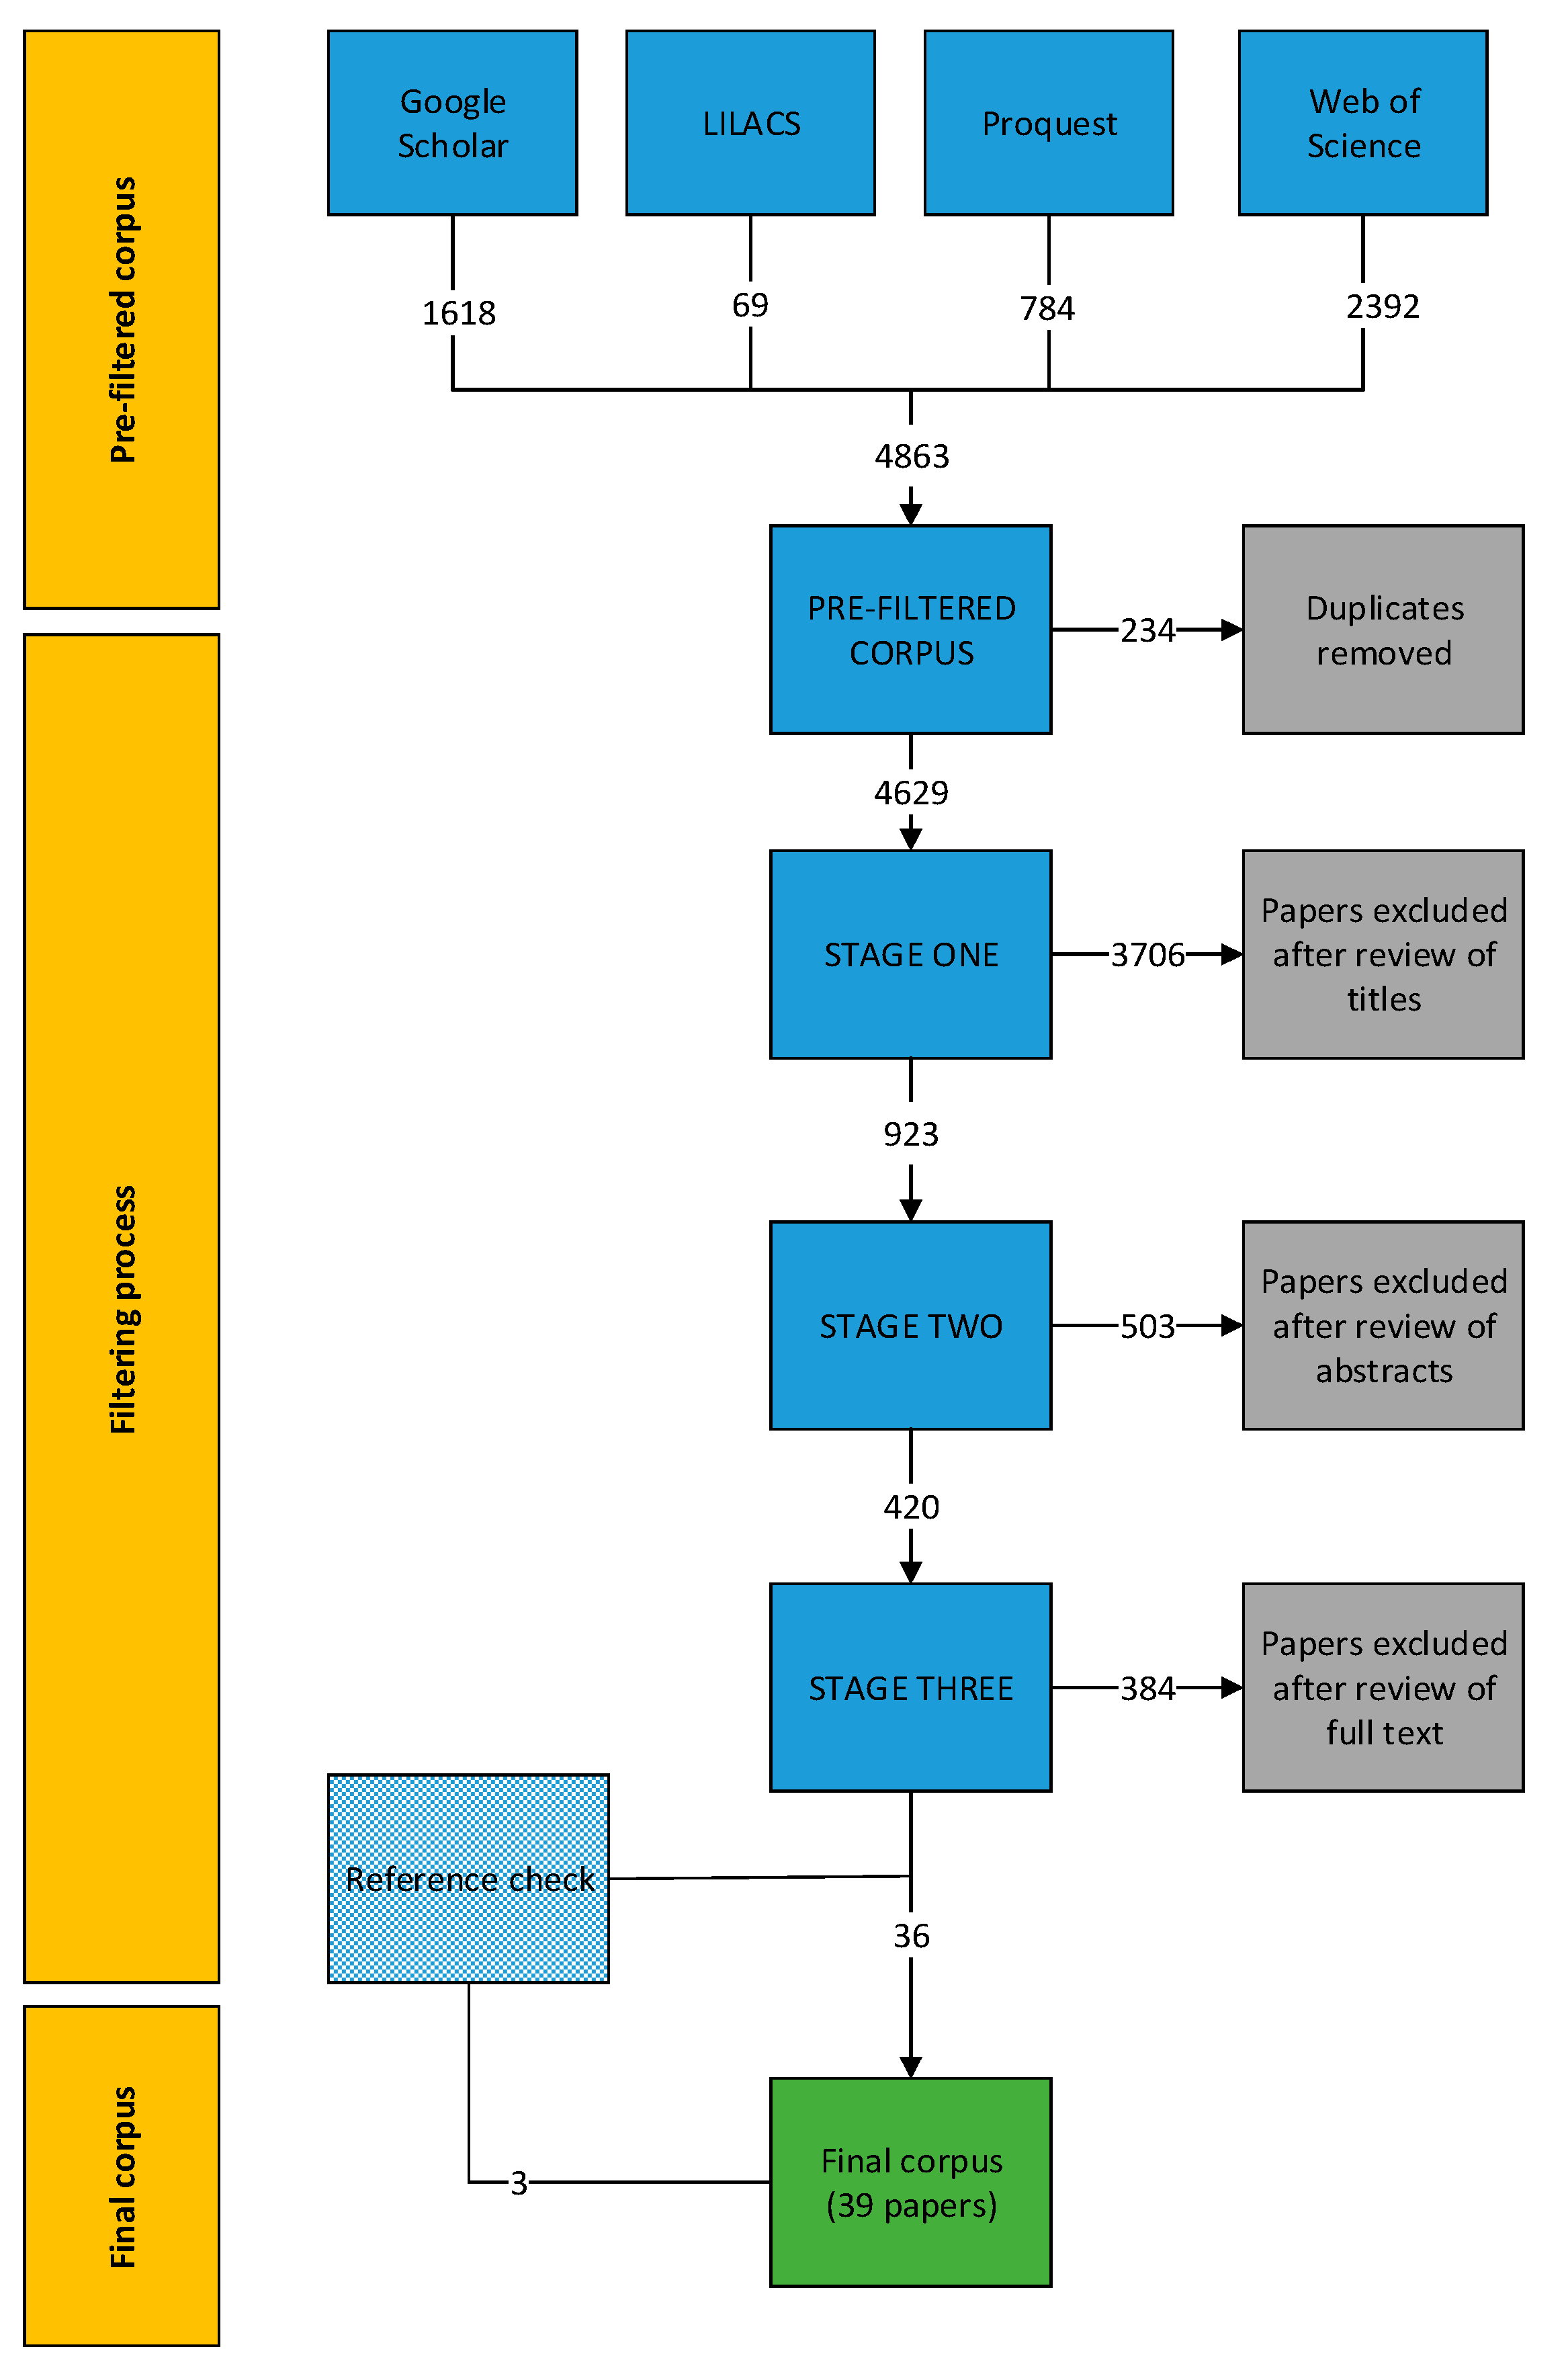
2.1. Search Strategy
2.2. Eligibility Requirements
2.3. Information Extraction
2.4. Evaluating Study Design and Reporting Quality
3. Results
3.1. Year of Publishing, Country of Study and Economic Status
3.2. Dog Population Management Methods and Impacts
3.2.1. Dog Population Management Methods
3.2.2. Impact Category and Indicators of Effect
3.3. Quality Evaluation
3.3.1. Study Design and Study Populations
3.3.2. Study Reporting Quality Indicators
3.4. Effects of Management Methods on Impact Categories—Observational and Intervention Studies
3.4.1. Dog Health and Welfare
3.4.2. Dog Population Demographics
3.4.3. Public Attitude
3.4.4. Public Health Risk
3.5. Effects of Management Methods on Impact Categories—Modelling Studies
3.5.1. Dog Population Demographics
3.5.2. Public Health Risk
3.5.3. Wildlife
4. Discussion
4.1. Limitations in Assessing Dog Population Management
- Few studies used a study design that would allow causation to be determined (such as intervention or certain observational studies), and many lacked an appropriate number of treatment and control groups (Table S5) and replication (Table 3). This therefore makes it challenging to distinguish between changes to a population that are caused by the management method, to incidental changes caused by other factors (e.g., reduction in population numbers over a few years caused by environmental or human related factors in the study area).
- Multiple indicators are used to assess the impact of dog population management (Table 1). It is therefore difficult to compare the effect of the same population management method across different studies, and even more challenging to compare different methods across studies. This makes it difficult to carry out a formal synthesis of results, such as a meta-analysis, to report the combined evidence. For example, we found that different papers reporting on the evaluation of different management methods did not use the same measurement of dog health and welfare. In this example, it does not make substantive sense to compare whether an increase in normal body condition scores of 13% (with fertility control) indicates a greater impact on dog health and welfare compared to a decrease in leukocyte counts by 4 (×109 cell/L) (when fertility control and sheltering are combined). This therefore makes it difficult to directly compare effects between methods.
- Studies often investigated combinations of population management methods, such as fertility control and sheltering, and fertility control and culling. It is difficult to assess the impact of dog population management when methods are not used in isolation. Even where studies investigated one method alone, it is unclear whether other methods of dog population management were in place, such as sheltering or taxation. Culling might also be under-represented, as the method is often not reported due to lack of public acceptance (e.g., ad-hoc poisoning and drowning).
- To effectively review the results of dog population management intervention, it is important to not only consider what method was applied, but also how the method was implemented. This means in practice that information about the intensity of management and associated costs (logistics, training, and facilities) are required in order to fully appreciate and contextualise the results. Any management method has the potential to be effective if the intensity is large enough. For example, moving 100% of the dog population into shelters every week would be much more effective than to only 15% of the population once a year. It is therefore important to consider: (i) management coverage; (ii) length of management; and (iii) cost of management when assessing the effectiveness of different methods. Many papers in the final corpus did not provided information about the coverage of management and some did not report the length of management (Table 2). Information about the cost of management was rarely provided, apart from where included as a parameter in modelling studies.
4.2. Investigated Methods and Reported Effects of Dog Population Management
4.3. Study Quality and Recommendations for Future Work
4.3.1. Increase Reporting Quality
Power and Sample Size Calculations
Defined Target Dog Population under Investigation Using Clear Common Terminology
Management Intensity and Cost
4.3.2. Improve Experimental and Statistical Modelling Approaches
Experimental Approaches
Statistical Modelling Approaches
5. Conclusions
Supplementary Materials
Author Contributions
Funding
Acknowledgments
Conflicts of Interest
References
- Hughes, J.; Macdonald, D.W. A review of the interactions between free-roaming domestic dogs and wildlife. Biol. Conserv. 2013, 157, 341–351. [Google Scholar] [CrossRef]
- Matter, H.; Daniels, T. Dog ecology and population biology. In Dogs, Zoonoses and Public Health; Macpherson, C.N.L., Meslin, F.X., Wandeler, A.I., Eds.; CABI Publishing: New York, NY, USA, 2000; pp. 17–62. [Google Scholar]
- International Companion Animal Management Coalition (ICAM). Humane Dog Population Management Guidance; ICAM: UK, 2008. [Google Scholar]
- Belsare, A.; Gompper, M. Assessing demographic and epidemiologic parameters of rural dog populations in India during mass vaccination campaigns. Prev. Vet. Med. 2013, 111, 139–146. [Google Scholar] [CrossRef] [PubMed]
- Jimenez, S.; Perez, A.; Gil, H.; Schantz, P.M.; Ramalle, E.; Juste, R.A. Progress in control of cystic echinococcosis in La Rioja, Spain: Decline in infection prevalences in human and animal hosts and economic costs and benefits. ACTA Trop. 2002, 83, 213–221. [Google Scholar] [CrossRef]
- Economides, P.; Christofi, G. Experience gained and evaluation of the Echinococcosis/Hydatidosis eradication programmes in Cyprus 1971–1999. In Proceedings of the Cestode Zoonoses: Echinococcosis and Cysticercosis: An Ermergent and Global Problem; Craig, P., Pawlowski, Z., Eds.; IOS Press: Amsterdam, The Netherlands, 2002; Volume 341, pp. 367–379. [Google Scholar]
- Morters, M.K.; McKinley, T.J.; Restif, O.; Conlan, A.J.K.; Cleaveland, S.; Hampson, K.; Whay, H.R.; Damriyasa, I.M.; Wood, J.L.N. The demography of free-roaming dog populations and applications to disease and population control. J. Appl. Ecol. 2014, 51, 1096–1106. [Google Scholar] [CrossRef] [PubMed]
- Haydon, D.T.; Laurenson, M.K.; Sillero-Zubiri, C. Integrating epidemiology into population viability analysis: Managing the risk posed by rabies and canine distemper to the Ethiopian wolf. Conserv. Biol. 2002, 16, 1372–1385. [Google Scholar] [CrossRef]
- Newsome, T.M.; Stephens, D.; Ballard, G.-A.; Dickman, C.R.; Fleming, P.J.S. Genetic profile of dingoes (Canis lupus dingo) and free-roaming domestic dogs (C. l. familiaris) in the Tanami Desert, Australia. Wildl. Res. 2013, 40, 196–206. [Google Scholar] [CrossRef]
- Doherty, T.S.; Dickman, C.R.; Glen, A.S.; Newsome, T.M.; Nimmo, D.G.; Ritchie, E.G.; Vanak, A.T.; Wirsing, A.J. The global impacts of domestic dogs on threatened vertebrates. Biol. Conserv. 2017, 210, 56–59. [Google Scholar] [CrossRef]
- Fielding, W.; Mather, J. Stray dogs in an island community: A case study from New Providence, The Bahamas. J. Appl. Anim. Welf. Sci. 2000, 3, 305–319. [Google Scholar] [CrossRef]
- Rodriguez-Vivas, R.I.; Ortega-Pacheco, A.; Rosado-Aguilar, J.A.; Bolio, G.M.E. Factors affecting the prevalence of mange-mite infestations in stray dogs of Yucatán, Mexico. Parasitology 2003, 115, 61–65. [Google Scholar] [CrossRef]
- HIS. Case Study of An Incentive Program to Encourage the Sterilization of Dogs (And Cats) and Greater Attention to Animal Welfare on Abaco Island in the Bahamas; Humane Society International: Washington, DC, USA, 2001. [Google Scholar]
- Tasker, L. Stray Animal Control Practices (Europe); WSPA and RSPCA: London, UK, 2007. [Google Scholar]
- Dalla Villa, P.; Kahn, S.; Stuardo, L.; Iannetti, L.; Di Nardo, A.; Serpell, J.A. Free-roaming dog control among OIE-member countries. Prev. Vet. Med. 2010, 97, 58–63. [Google Scholar] [CrossRef]
- Hiby, E.; Atema, K.N.; Brimley, R.; Hammond-Seaman, A.; Jones, M.; Rowan, A.; Fogelberg, E.; Kennedy, M.; Balaram, D.; Nel, L.; et al. Scoping review of indicators and methods of measurement used to evaluate the impact of dog population management interventions. BMC Vet. Res. 2017, 13, 1–20. [Google Scholar] [CrossRef] [PubMed]
- Pastoret, P.; Van Gucht, S.; Brochier, B. Eradicating rabies at source. Rev. Sci. Tech. Int. DES Epizoot. 2014, 33, 509–519. [Google Scholar]
- Zhang, W.; Zhang, Z.; Wu, W.; Shi, B.; Li, J.; Zhou, X.; Wen, H.; McManus, D.P. Epidemiology and control of echinococcosis in central Asia, with particular reference to the People’s Republic of China. ACTA Trop. 2015, 141, 235–243. [Google Scholar] [CrossRef]
- Harhay, M.; Olliaro, P.; Costa, D.; Costa, C. Urban parasitology: Visceral leishmaniasis in Brazil. Trends Parasitol. 2011, 27, 403–409. [Google Scholar] [CrossRef]
- Ponce-Macotela, M.; Peralta-Abarca, G.E.; Martinez-Gordillo, M.N. Giardia intestinalis and other zoonotic parasites: Prevalence in adult dogs from the southern part of Mexico City. Vet. Parasitol. 2005, 131, 1–4. [Google Scholar] [CrossRef]
- Macpherson, C. The epidemiology and public health importance of toxocariasis: A zoonosis of global importance. Int. J. Parasitol. 2013, 43, 999–1008. [Google Scholar] [CrossRef]
- Clarke, N.M.; Fraser, D. Animal control measures and their relationship to the reported incidence of dog bites in urban Canadian municipalities. Can. Vet. J. 2013, 54, 145–149. [Google Scholar]
- Morales, C.; Férnandez, C.; Hernández, H.; Falcón, N. Dog bite accidents in a children hospital at Lima, Peru. Retrospective study from 1995–2009. Rev. Peru. Med. Exp. Salud Publica 2011, 28, 639–642. [Google Scholar] [CrossRef]
- Akpinar, O.; Kapci, M.; Duman, A.; Turkdogan, K.A. Evaluation of suspected rabies animal bites and comparison of vaccination protocols. Acta Med. Mediterr. 2015, 31, 919–924. [Google Scholar]
- Jackman, J.; Rowan, A. Free-Roaming Dogs in Developing Countries: The Benefits of Capture, Neuter, and Return Programs; Salem, D.J., Rowan, A.N., Eds.; Humane Society Press: Washington, DC, USA, 2007. [Google Scholar]
- Garde, E.; Acosta-Jamett, G. BM Bronsvoort Review of the risks of some canine zoonoses from free-roaming dogs in the post-disaster setting of Latin America. Animals 2013, 3, 855–865. [Google Scholar] [CrossRef]
- Gompper, M.E. The Dog-Human-Wildlife Interface: Assessing the Scope of the Problem, Oxford University Press: Oxford, UK, 2014.
- Knobel, D.D.L.; Cleaveland, S.; Coleman, P.G.P.; Fèvre, E.M.; Meltzer, M.I.; Miranda, M.E.G.; Shaw, A.; Zinsstag, J.; Meslin, F.-X. Re-evaluating the burden of rabies in Africa and Asia. Bull. World Health Organ. 2005, 83, 360–368. [Google Scholar] [PubMed]
- Hampson, K.; Coudeville, L.; Lembo, T.; Sambo, M.; Kieffer, A.; Attlan, M.; Barrat, J.; Blanton, J.D.; Briggs, D.J.; Cleaveland, S. Estimating the global burden of endemic canine rabies. PLoS Negl. Trop. Dis. 2015, 9, 1–20. [Google Scholar]
- Quinnell, R.; Parasitology, O.C. Transmission, reservoir hosts and control of zoonotic visceral leishmaniasis. Parasitology 2009, 135, 1915–1934. [Google Scholar] [CrossRef] [PubMed]
- Yang, Y.R.Y.; McManus, D.D.P.; Huang, Y.; Heath, D.D. Echinococcus granulosus Infection and Options for Control of Cystic Echinococcosis in Tibetan Communities of Western Sichuan Province, China. PLoS Negl. Trop. Dis. 2009, 3, 1–7. [Google Scholar] [CrossRef]
- Overgaauw, P.; Nederland, V. Aspects of Toxocara epidemiology: Toxocarosis in dogs and cats. Crit. Rev. Microbiol. 1997, 23, 233–251. [Google Scholar] [CrossRef]
- Vial, F.; Cleaveland, S.; Rasmussen, G.; Haydon, D.T. Development of vaccination strategies for the management of rabies in African wild dogs. Biol. Conserv. 2006, 131, 180–192. [Google Scholar] [CrossRef]
- Cleaveland, S.; Appel, M.G.; Chalmers, W.S.; Chillingworth, C.; Kaare, M.; Dye, C. Serological and demographic evidence for domestic dogs as a source of canine distemper virus infection for Serengeti wildlife. Vet. Microbiol. 2000, 72, 217–227. [Google Scholar] [CrossRef]
- Ritchie, E.; Dickman, C.; Letnic, M.; Vanak, A.T. Dogs as predators and trophic regulators. In Free-Ranging Dogs and Wildlife Conservation; Gompper, M.E., Ed.; Oxford University Press: Oxford, UK, 2014; pp. 55–68. [Google Scholar]
- Vanak, A.; Dickman, C.; Silva-Rodriguez, E.A.; Butler, J.; Ritchie, E. Top-dogs and under-dogs: Competition between dogs and sympatric carnivores. In Free-Ranging Dogs and Wildlife Conservation; Gompper, M., Ed.; Oxford University Press: Oxford, UK, 2013; pp. 69–93. [Google Scholar]
- Vilà, C.; Wayne, R. Hybridization between wolves and dogs. Conserv. Biol. 1999, 13, 195–198. [Google Scholar] [CrossRef]
- Sundqvist, A.-K.; Ellegren, H.; Vila, C. Wolf or dog? Genetic identification of predators from saliva collected around bite wounds’ on prey. Conserv. Genet. 2008, 9, 1275–1279. [Google Scholar] [CrossRef]
- Sundqvist, A.; Llaneza, L.; Echegaray, J.; Beltrán, J. Hybridization between Wolves and Dogs: Impact on a Wolf Population. Ph.D. Thesis, Uppsala University, Uppsala, Sweden, 2008. [Google Scholar]
- Vanak, A.; Gompper, M. Dogs Canis familiaris as carnivores: Their role and function in intraguild competition. Mamm. Rev. 2009, 39, 265–283. [Google Scholar] [CrossRef]
- Young, J.; Olson, K.; Reading, R.; Amgalanbaatar, S.; Berger, J. Is wildlife going to the dogs? Impacts of feral and free-roaming dogs on wildlife populations. Bioscience 2011, 61, 125–132. [Google Scholar] [CrossRef]
- Manor, R.; Saltz, D. The impact of free-roaming dogs on gazelle kid/female ratio in a fragmented area. Biol. Conserv. 2004, 119, 231–236. [Google Scholar] [CrossRef]
- Silva-Rodriguez, E.A.; Verdugo, C.; Alejandro Aleuy, O.; Sanderson, J.G.; Ortega-Solis, G.R.; Osorio-Zuniga, F.; Gonzalez-Acuna, D. Evaluating mortality sources for the Vulnerable pudu Pudu puda in Chile: Implications for the conservation of a threatened deer. ORYX 2010, 44, 97–103. [Google Scholar] [CrossRef]
- Taborsky, M. Kiwis and dog predation: Observations in Waitangi State Forest. Notornis 1988, 35, 197–202. [Google Scholar]
- Home, C.; Pal, R.; Sharma, R.; Suryawanshi, K.; Bhatnagar, Y.; Vanak, A. Commensal in conflict: Livestock depredation patterns by free-ranging domestic dogs in the Upper Spiti Landscape, Himachal Pradesh, India. R. Swedish Acad. Sci. 2017, 46, 655–666. [Google Scholar] [CrossRef]
- Ciucci, P.; Boitani, L. Wolf and dog depredation on livestock in central Italy. Wildl. Soc. Bull. 1998, 26, 504–514. [Google Scholar]
- Blair, B.; Townsend, T. Dog Predation of Domestic Sheep in Ohio. J. Range Manag. 1983, 36, 527–528. [Google Scholar] [CrossRef]
- Bergman, D.L.; Breck, S.W.; Bender, S.C. Dogs gone wild: Feral dog damage in the United States. In Proceedings of the Thirteenth Wildlife Damage Management Conference, Saratoga Springs, NY, USA, 5 April 2009; pp. 177–183. [Google Scholar]
- Wierzbowska, I.A.; Hedrzak, M.; Popczyk, B.; Okarma, H.; Crooks, K.R. Predation of wildlife by free-ranging domestic dogs in Polish hunting grounds and potential competition with the grey wolf. Biol. Conserv. 2016, 201, 1–9. [Google Scholar] [CrossRef]
- Totton, S.C.; Wandeler, A.I.; Ribble, C.S.; Rosatte, R.C.; McEwen, S.A. Stray dog population health in Jodhpur, India in the wake of an animal birth control (ABC) program. Prev. Vet. Med. 2011, 98, 215–220. [Google Scholar] [CrossRef]
- Butler, J.; Brown, W.; du Toit, J. Anthropogenic Food Subsidy to a Commensal Carnivore: The Value and Supply of Human Faeces in the Diet of Free-Ranging Dogs. Animals 2018, 8, 67. [Google Scholar] [CrossRef] [Green Version]
- Rautenbach, G.H.; Boomker, J.; De Villiers, I.L. A descriptive study of the canine population in a rural town in southern africa. J. S. Afr. Vet. Assoc. 1991, 62, 158–162. [Google Scholar] [PubMed]
- Fielding, W.; Mather, J.; Isaacs, M. Potcakes: Dog ownership in New Providence, The Bahamas; Purdue University Press: West Lafayette, IN, USA, 2005. [Google Scholar]
- Strakova, M.; Strakova, A.; Murchison, E.P. The changing global distribution and prevalence of canine transmissible venereal tumour. BMC Vet. Res. 2014, 10, 1–10. [Google Scholar] [CrossRef] [PubMed] [Green Version]
- Ortega-Pacheco, A.; Segura-Correa, J.C.; Jimenez-Coello, M.; Linde Forsberg, C. Reproductive patterns and reproductive pathologies of stray bitches in the tropics. Theriogenology 2007, 67, 382–390. [Google Scholar] [CrossRef] [PubMed]
- Reese, J. Dogs and dog control in developing countries. In The State of the Animals; Salem, D., Rowan, A., Eds.; Humane Society Press: Washington, DC, USA, 2005; pp. 55–64. [Google Scholar]
- Meslin, F.; Miles, M.; Vexenat, A.; Gemmell, M. Zoonoses control in dogs. In Dogs, Zoonoses and Public Health; Macpherson, C.N.L., Meslin, F.X., Wandeler, A.I., Eds.; CABI Publishing: New York, NY, USA, 2000; pp. 333–372. [Google Scholar]
- Bögel, K.; Frucht, K.; Drysdale, G.; Remfry, J. World Health Organisation Guidelines for Dog Population Management; WHO: Geneva, Switzerland, 1990. [Google Scholar]
- Animal Protection Act (SG No. 13/2008); Bulgarian Government: Bulgaria, 2008; pp. 1–25.
- Italia. Legge quadro 4 agosto 1991, n. 281. Legge quadro in materia di animali d’affezione e prevenzione del randagismo. Gazzetta Ufficiale n. 203, 30 agosto 1991; Italian Government, 1991.
- Law on Animal Welfare; Provisional Institutions of Self Government: Kosovo, 2001; pp. 1–9.
- Peng, S.J.-L.; Lee, L.Y.-T.; Fei, A.C.-Y. Shelter Animal Management and Trends in Taiwan. J. Appl. Anim. Welf. Sci. 2012, 15, 346–357. [Google Scholar] [CrossRef]
- Morris, K.; Wolf, J.; Gies, D. Trends in intake and outcome data for animal shelters in Colorado, 2000 to 2007. J. Am. Vet. 2011, 238, 329–336. [Google Scholar] [CrossRef]
- Marston, L.; Bennett, P.; Coleman, G. What happens to shelter dogs? Part 2. Comparing three Melbourne welfare shelters for nonhuman animals. J. Appl. Anim. 2005, 8, 25–45. [Google Scholar] [CrossRef]
- Barnard, S.; Pedernera, C.; Candeloro, L.; Ferri, N.; Velarde, A.; Dalla Villa, P. Development of a new welfare assessment protocol for practical application in long-term dog shelters. Vet. Rec. 2015, 178, 2–8. [Google Scholar] [CrossRef]
- Massei, G. Fertility control in dogs. In Zoonoses and Public Health; Macpherson, C.N.L., Meslin, F.X., Wandeler, A.I., Eds.; CABI Publishing: New York, NY, USA, 2013; pp. 259–270. [Google Scholar]
- Barnard, S.; Chincarini, M.; Di Tommaso, L.; Di Giulio, F.; Messori, S.; Ferri, N. Free-roaming dogs control activities in one italian province (2000–2013): Is the implemented approach effective? Maced. Vet. Rev. 2015, 38, 149–158. [Google Scholar] [CrossRef] [Green Version]
- Reece, J.F.; Chawla, S.K. Control of rabies in Jaipur, India, by the sterilisation and vaccination of neighbourhood dogs. Vet. Rec. 2006, 159, 379–383. [Google Scholar] [CrossRef] [Green Version]
- Totton, S.C.; Wandeler, A.I.; Zinsstag, J.; Bauch, C.T.; Ribble, C.S.; Rosatte, R.C.; McEwen, S.A. Stray dog population demographics in Jodhpur, India following a population control/rabies vaccination program. Prev. Vet. Med. 2010, 97, 51–57. [Google Scholar] [CrossRef]
- Yoak, A.J.; Reece, J.F.; Gehrt, S.D.; Hamilton, I.M. Disease control through fertility control: Secondary benefits of animal birth control in Indian street dogs. Prev. Vet. Med. 2014, 113, 152–156. [Google Scholar] [CrossRef] [PubMed] [Green Version]
- Tenzin, T.; Ahmed, R.; Debnath, N.C.; Ahmed, G.; Yamage, M. Free-Roaming Dog Population Estimation and Status of the Dog Population Management and Rabies Control Program in Dhaka City, Bangladesh. PLoS Negl. Trop. Dis. 2015, 9, 1–14. [Google Scholar] [CrossRef] [PubMed] [Green Version]
- Kumarapeli, V.; Awerbuch-Friedlander, T. Human rabies focusing on dog ecology-A challenge to public health in Sri Lanka. ACTA Trop. 2009, 112, 33–37. [Google Scholar] [CrossRef] [PubMed]
- Belo, V.S.; Struchiner, C.J.; Werneck, G.L.; Teixeira Neto, R.G.; Tonelli, G.B.; de Carvalho Junior, C.G.; Nascimento Ribeiro, R.A.; da Silva, E.S. Abundance, survival, recruitment and effectiveness of sterilization of free-roaming dogs: A capture and recapture study in Brazil. PLoS ONE 2017, 12, 1–19. [Google Scholar] [CrossRef] [PubMed] [Green Version]
- VIER PFOTEN International; Vienna, Austria. Personal communication, 31 April 2017.
- Fielding, W. Knowledge of the welfare of nonhuman animals and prevalence of dog care practices in New Providence, The Bahamas. J. Appl. Anim. Welf. Sci. 2007, 10, 153–168. [Google Scholar] [CrossRef] [PubMed]
- Slater, M.R.; Di Nardo, A.; Pediconi, O.; Villa, P.D.; Candeloro, L.; Alessandrini, B.; Del Papa, S. Free-roaming dogs and cats in central Italy: Public perceptions of the problem. Prev. Vet. Med. 2008, 84, 27–47. [Google Scholar] [CrossRef]
- The World Bank—Countries and Economies. Available online: https://data.worldbank.org/country (accessed on 5 August 2019).
- Moher, D.; Liberati, A.; Tetzlaff, J.; Altman, D.G. Preferred Reporting Items for Systematic Reviews and Meta-Analyses: The PRISMA Statement. PLoS Med. 2009, 151, 264–269. [Google Scholar]
- Kilkenny, C.; Browne, W.J.; Cuthill, I.C.; Emerson, M.; Altman, D.G. Improving Bioscience Research Reporting: The ARRIVE Guidelines for Reporting Animal Research. PLoS Biol. 2010, 8, 1–5. [Google Scholar] [CrossRef]
- Demirbas, Y.S.; Emre, B.; Kockaya, M. Integration ability of urban free-ranging dogs into adoptive families’ environment. J. Vet. Behav. Appl. Res. 2014, 9, 222–227. [Google Scholar] [CrossRef]
- Radisavljevic, K.; Vucinic, M.; Becskei, Z.; Stanojkovic, A.; Ostovic, M. Comparison of stress level indicators in blood of free-roaming dogs after transportation and housing in the new environment. J. Appl. Anim. Res. 2017, 45, 52–55. [Google Scholar] [CrossRef] [Green Version]
- Airikkala-Otter, I.; Gamble, L.; Mazeri, S.; Handel, I.G.; de Bronsvoort, B.M.C.; Mellanby, R.J.; Meunier, N.V. Investigation of short-term surgical complications in a low-resource, high-volume dog sterilisation clinic in India. BMC Vet. Res. 2018, 14, 1–8. [Google Scholar] [CrossRef] [PubMed]
- Hiby, L.R.; Reece, J.F.; Wright, R.; Jaisinghani, R.; Singh, B.; Hiby, E.F. A mark-resight survey method to estimate the roaming dog population in three cities in Rajasthan, India. BMC Vet. Res. 2011, 7, 1–9. [Google Scholar] [CrossRef] [PubMed] [Green Version]
- Garcia, R.C.M.; Amaku, M.; Biondo, A.W.; Ferreira, F. Dog and cat population dynamics in an urban area: Evaluation of a birth control strategy. Pesqui. Vet. Bras. 2018, 38, 511–518. [Google Scholar] [CrossRef]
- Yoak, A.J.; Reece, J.F.; Gehrt, S.D.; Hamilton, I.M. Optimizing free-roaming dog control programs using agent-based models. Ecol. Modell. 2016, 341, 53–61. [Google Scholar] [CrossRef]
- Santos Baquero, O.; Marconcin, S.; Rocha, A.; de Maria Garcia, R.C. Companion animal demography and population management in Pinhais, Brazil. Prev. Vet. Med. 2018, 158, 169–177. [Google Scholar] [CrossRef]
- Frank, J. An interactive model of human and companion animal dynamics: The ecology and economics of dog overpopulation and the human costs of addressing the problem. Hum. Ecol. 2004, 32, 107–130. [Google Scholar] [CrossRef]
- Amaku, M.; Dias, R.A.; Ferreira, F. Dynamics and Control of Stray Dog Populations. Math. Popul. Stud. 2010, 17, 69–78. [Google Scholar] [CrossRef]
- Kisiel, L. Using a dog demography field study to inform the development of an agent based computer simulation. Evaluating owned dog population control interventions in a small, semi-urban community in Mexico. Master’s Thesis, The University of Guelph, Guelph, ON, Canada, 2017. [Google Scholar]
- Hogasen, H.R.; Er, C.; Di Nardo, A.; Dalla Villa, P.; Høgåsen, H.; Er, C.; Di Nardo, A.; Villa, P.D. Free-roaming dog populations: A cost-benefit model for different management options, applied to Abruzzo, Italy. Prev. Vet. Med. 2013, 112, 401–413. [Google Scholar] [CrossRef]
- Leung, T.; Davis, S.A. Rabies Vaccination Targets for Stray Dog Populations. Front. Vet. Sci. 2017, 4, 1–10. [Google Scholar] [CrossRef] [Green Version]
- Liu, S.; Chen, H. Solving Stray-Animal Problems by Economic Policies. Taipei Econ. Inq. 2016, 1–27. [Google Scholar]
- Schurer, J.M.; Phipps, K.; Okemow, C.; Beatch, H.; Jenkins, E. Stabilizing Dog Populations and Improving Animal and Public Health Through a Participatory Approach in Indigenous Communities. Zoonoses Public Health 2015, 62, 445–455. [Google Scholar] [CrossRef]
- Boey, J. Working with communities to improve the quality of life of British Columbia’s free-roaming dogs and their people. Master’s Thesis, University of Victoria, Victoria, BC, Canada, 2017. [Google Scholar]
- Panichabhongse, P. The epidemiology of rabies in Thailand. Master’s Thesis, Massey University, Palmerston North, New Zealand, 2001. [Google Scholar]
- Santos Baquero, O.; Akamine, L.A.; Amaku, M.; Ferreira, F. Defining priorities for dog population management through mathematical modeling. Prev. Vet. Med. 2016, 123, 121–127. [Google Scholar] [CrossRef] [Green Version]
- Costa, E.D.; Martins, C.M.; Cunha, G.R.; Catapan, D.C.; Ferreira, F.; Oliveira, S.T.; de Maria Garcia, R.C.; Biondo, A.W. Impact of a 3-year pet management program on pet population and owner’s perception. Prev. Vet. Med. 2017, 139, 33–41. [Google Scholar] [CrossRef]
- Fitzpatrick, M.C.; Shah, H.A.; Pandey, A.; Bilinski, A.M.; Kakkar, M.; Clark, A.D.; Townsend, J.P.; Abbas, S.S.; Galvani, A.P. One Health approach to cost-effective rabies control in India. Proc. Natl. Acad. Sci. USA 2016, 113, 14574–14581. [Google Scholar] [CrossRef] [PubMed] [Green Version]
- Reece, J.F.; Chawla, S.K.; Hiby, A.R. Decline in human dog-bite cases during a street dog sterilisation programme in Jaipur, India. Vet. Rec. 2013, 172, 473–477. [Google Scholar] [CrossRef] [PubMed]
- Carroll, M.J.; Singer, A.; Smith, G.C.; Cowan, D.P.; Massei, G. The use of immunocontraception to improve rabies eradication in urban dog populations. Wildl. Res. 2010, 37, 676–687. [Google Scholar] [CrossRef]
- Bhunu, C.P. Impact of culling stray dogs and vaccination on the control of human rabies: A mathematical modeling approach. Int. J. Biomath. 2011, 4, 379–397. [Google Scholar] [CrossRef]
- Zinsstag, J.; Durr, S.; Penny, M.; Mindekem, R.; Roth, F.; Gonzalez, S.; Naissengar, S.; Hattendorf, J. Transmission dynamics and economics of rabies control in dogs and humans in an African city. Proc. Natl. Acad. Sci. USA 2009, 106, 14996–15001. [Google Scholar] [CrossRef] [Green Version]
- Economides, P.; Christofi, G. Evaluation of control programmes for echinococcosis/hydatidosis in Cyprus. Rev. Sci. Tech. L Off. Int. DES Epizoot. 2000, 19, 784–792. [Google Scholar] [CrossRef]
- Polydorou, K. The anti-echinococcosis campaign in Cyprus. Trop. Anim. Health Prod. 1977, 9, 141–146. [Google Scholar] [CrossRef]
- Melo, S.N.; Teixeira-Neto, R.G.; Werneck, G.L.; Struchiner, C.J.; Ribeiro, R.A.N.; Sousa, L.R.; de Melo, M.O.G.; Carvalho Junior, C.G.; Penaforte, K.M.; Manhani, M.N.; et al. Prevalence of visceral leishmaniasis in A population of free-roaming dogs as determined by multiple sampling efforts: A longitudinal study analyzing the effectiveness of euthanasia. Prev. Vet. Med. 2018, 161, 19–24. [Google Scholar] [CrossRef] [PubMed]
- Ashford, D.; David, J.; Freire, M.; David, R.; Sherlock, I.; Da Conceicao, M.; Sampaio, D.; Badaro, R. Studies on control of visceral leishmaniasis: Impact of dog control on canine and human visceral leishmaniasis in Jacobina, Bahia, Brazil. Am. J. Trop. Med. Hyg. 1998, 59, 53–57. [Google Scholar] [CrossRef] [PubMed] [Green Version]
- Hou, Q.; Jin, Z.; Ruan, S. Dynamics of rabies epidemics and the impact of control efforts in Guangdong Province, China. J. Theor. Biol. 2012, 300, 39–47. [Google Scholar] [CrossRef] [PubMed]
- Zhang, J.; Jin, Z.; Sun, G.Q.; Zhou, T.; Ruan, S. Analysis of rabies in China: Transmission dynamics and control. PLoS ONE 2011, 6, 1–9. [Google Scholar] [CrossRef]
- Belsare, A.V.; Gompper, M.E. A model-based approach for investigation and mitigation of disease spillover risks to wildlife: Dogs, foxes and canine distemper in central India. Ecol. Modell. 2015, 296, 102–112. [Google Scholar] [CrossRef]
- Massei, G.; Cowan, D. Fertility control to mitigate human—Wildlife conflicts: A review. Wildl. Res. 2014, 41, 1–21. [Google Scholar] [CrossRef] [Green Version]
- Zoran, D. Obesity in dogs and cats: A metabolic and endocrine disorder. Vet. Clin. North Am. small Anim. 2010, 40, 221–239. [Google Scholar] [CrossRef]
- O’farrell, V.; Peachey, E. Behavioural effects of ovariohysterectomy on bitches. J. Small Anim. Pract. 1990, 31, 595–598. [Google Scholar] [CrossRef]
- Leney, J.; Remfry, J. (Eds.) Dog population management. In Dogs, Zoonoses and Public Health; CABI Publishing: New York, NY, USA, 2000; pp. 299–332. [Google Scholar]
- Bögel, K.; Meslin, F. Economics of human and canine rabies elimination: Guidelines for programme orientation. Bull. World Health Organ. 1990, 68, 281–291. [Google Scholar]
- Cleaveland, S.; Kaare, M.; Knobel, D.; Laurenson, M.K. Canine vaccination—Providing broader benefits for disease control. Vet. Microbiol. 2006, 117, 43–50. [Google Scholar] [CrossRef]
- Hampson, K.; Dushoff, J.; Cleaveland, S.; Haydon, D.T.; Kaare, M.; Packer, C.; Dobson, A. Transmission dynamics and prospects for the elimination of canine rabies. PLoS Biol. 2009, 7, 462–471. [Google Scholar] [CrossRef] [PubMed]
- Fitzpatrick, M.C.; Hampson, K.; Cleaveland, S.; Mzimbiri, I.; Lankester, F.; Lembo, T.; Meyers, L.A.; Paltiel, A.D.; Galvani, A.P. Cost-effectiveness of canine vaccination to prevent human rabies in rural Tanzania. Ann. Intern. Med. 2014, 160, 91–100. [Google Scholar] [CrossRef] [PubMed] [Green Version]
- Goericke-Pesch, S.; Wilhelm, E.; Ludwig, C.; Desmoulins, P.; Driancourt, M.; Hoffmann, B. Evaluation of the clinical efficacy of Gonazon implants in the treatment of reproductive pathologies, behavioral problems, and suppression of reproductive function in the male dog. Theriogenology 2010, 73, 920–926. [Google Scholar] [CrossRef] [PubMed]
- McKenzie, B. Evaluating the benefits and risks of neutering dogs and cats. CAB Rev. Perspect. Agric. Vet. Sci. Nutr. Nat. Resour. 2010, 5, 1–18. [Google Scholar] [CrossRef] [Green Version]
- Garde, E.; Perez, G.E.; Vanderstichel, R.; Dalla Villa, P.F.; Serpell, J.A. Effects of surgical and chemical sterilization on the behavior of free-roaming male dogs in Puerto Natales, Chile. Prev. Vet. Med. 2016, 123, 106–120. [Google Scholar] [CrossRef]
- Simera, I.; Moher, D.; Hoey, J.; Schulz, K.F.; Altman, D.G. A catalogue of reporting guidelines for health research. Eur. J. Clin. Investig. 2010, 40, 35–53. [Google Scholar] [CrossRef]
- Stone, S.; Cooper, B.; Kibbler, C.; Cookson, B.; Roberts, J.; Medley, G.; Duckworth, G.; Lai, R.; Ebrahim, S.; Brown, E.; et al. The ORION statement: Guidelines for transparent reporting of outbreak reports and intervention studies of nosocomial infection. J. Antimicrob. Chemother. 2007, 59, 833–840. [Google Scholar] [CrossRef]
- Hooijmans, C.; Leenaars, M.; Ritskes-Hoitinga, M. A gold standard publication checklist to improve the quality of animal studies, to fully integrate the three Rs, and to make systematic reviews more feasible. ALTA 2010, 38, 167–182. [Google Scholar] [CrossRef] [Green Version]
- Belo, V.S.; Werneck, G.L.; da Silva, E.S.; Barbosa, D.S.; Struchiner, C.J. Population Estimation Methods for Free-Ranging Dogs: A Systematic Review. PLoS ONE 2015, 10. [Google Scholar] [CrossRef]
- PEARL, J. Causal diagrams for empirical research. Biometrika 1995, 82, 669–688. [Google Scholar] [CrossRef]
- Pearl, J.; Glymour, M.; Jewell, N.P. Causal Inference in Statistics: A Primer; John Wiley & Sons: Chichester, UK, 2016; ISBN 9781119186847. [Google Scholar]
- Rohrer, J.M. Thinking Clearly About Correlations and Causation: Graphical Causal Models for Observational Data. Adv. Methods Pract. Psychol. Sci. 2018, 1, 27–42. [Google Scholar] [CrossRef] [Green Version]
- Gimenez, O.; Buckland, S.T.; Morgan, B.J.T.; Bez, N.; Bertrand, S.; Choquet, R.; Dray, S.; Etienne, M.-P.; Fewster, R.; Gosselin, F.; et al. Statistical ecology comes of age. Biol. Lett. 2014, 10, 1–4. [Google Scholar] [CrossRef]
- Newman, K.; Buckland, S.; Lindley, S.; Thoma, L.; Fernandez, C. Hidden process models for animal population dynamics. Ecol. Appl. 2006, 16, 75–86. [Google Scholar] [CrossRef] [Green Version]
- Gimenez, O.; Lebreton, J.-D.; Gaillard, J.-M.; Choquet, R.; Pradel, R. Estimating demographic parameters using hidden process dynamic models. Theor. Popul. Biol. 2012, 82, 307–316. [Google Scholar] [CrossRef]
- Pagel, J.; Anderson, B.; O’Hara, R.; Cramer, W.; Fox, R.; Jeltsch, F.; Roy, D.; Thomas, C.; Schurr, F. Quantifying range-wide variation in population trends from local abundance surveys and widespread opportunistic occurence records. Methods Ecol. Evol. 2014, 5, 751–760. [Google Scholar] [CrossRef] [Green Version]


| Impact | Indicators | Fertility Control | Culling | Sheltering | Taxation | Fertility Control and Sheltering | Fertility Control and Culling | Fertility Control and Movement Restriction |
|---|---|---|---|---|---|---|---|---|
| Dog health and welfare | Body condition score | O/I = 3 [50,70,71] | ||||||
| Measure of dog behaviour | O/I = 1 [80] | |||||||
| Physiological stress measures | O/I = 1 [81] | |||||||
| Presence of injury | O/I = 1 [70] | |||||||
| Visible skin condition | O/I = 2 [50,71] | |||||||
| Dog disease prevalence (ectoparasites, viruses or bacterial infection) | O/I = 1 [70] | |||||||
| Fertility control related complications | O/I = 1 [82] | |||||||
| Dog population demographics | Dog population size | O/I = 4 [68,69,83,84] M = 7 [69,85,86,87,88,89,90] | M = 3 [85,88,91] | M = 2 [87,90] | M = 1 [92] | O/I = 5 [67,73,93,94,95] | M = 3 [87,89,96] | |
| Public attitude | Public attitude towards free-roaming dogs | O/I = 1 [97] | O/I = 1 [94] | |||||
| Public health risk | Number of human rabies cases | O/I = 2 [68,72] M = 1 [98] | O/I = 1 [95] | |||||
| Human bite cases | O/I = 1 [99] | |||||||
| Dog rabies prevalence | M= 1 [100] | M = 3 [100,101,102] | ||||||
| Echinococcus granulosus prevalence in humans | O/I = 1 [5] | O/I = 1 [103] | ||||||
| Echinococcus granulosus prevalence in livestock | O/I = 1 [5] | O/I = 2 [103,104] | ||||||
| Echinococcus granulosus prevalence in dogs | O/I = 1 [5] | O/I = 2 [103,104] | ||||||
| Dog disease prevalence (visible skin conditions, ectoparasites, viruses or bacterial infection) | O/I = 1 [93] | |||||||
| Prevalence of visceral leishmaniasis in dogs | O/I = 2 [105,106] | |||||||
| Prevalence of visceral leishmaniasis in children | O/I = 1 [106] | |||||||
| Rabies R0 | M = 3 [91,107,108] | |||||||
| Risk to wildlife populations | Canine distemper prevalence in wildlife populations | M = 1 [109] |
| Paper | Dog Population Management Method | Management Intensity: Coverage (C) and Length (L) of Management/Study | Dog Population Type | Study Design | No. Replicates | No. Groups | Reporting Quality Indicator Score |
|---|---|---|---|---|---|---|---|
| [91] | Culling | Up to 33% | Free-roaming stray, Free-roaming owned, Restricted owned | Modelling | NA | NA | NA |
| [101] | Culling | Various | Free-roaming stray, Free-roaming owned, Restricted owned | Modelling | NA | NA | NA |
| [102] | Culling | 5% and 10% | Undefined | Modelling | NA | NA | NA |
| [107] | Culling | Various | Free-roaming stray, Free-roaming owned, Restricted owned | Modelling | NA | NA | NA |
| [108] | Culling | Various | Undefined | Modelling | NA | NA | NA |
| [106] | Culling | C: Not reported L: first 2 years mgmt | Free-roaming stray, Free-roaming owned | Intervention | 1 | 2 (management and control) | 50% (2/4) |
| [105] | Culling | C: 8% L: 14 months study | Free-roaming stray, Free-roaming owned | Observational-cross-sectional-longitudinal | 1 | 1 | 20% (1/4) |
| [86] | Fertility control | Various (65% and above) | Free-roaming stray, Free-roaming owned, Restricted owned | Modelling and Observational-cross-sectional-single time point | NA | NA | NA |
| [98] | Fertility control | 25 to 50% | Free-roaming stray, Free-roaming owned, Restricted owned | Modelling | NA | NA | NA |
| [109] | Fertility control | Simulate a 50%, 75% and 90% reduction, but do not specify what neutering rate would achieve this | Free-roaming stray, Free-roaming owned | Modelling | NA | NA | NA |
| [97] | Fertility control | C: NR L: 3 years study | Free-roaming stray, Free-roaming owned, Restricted owned | Observational-cross-sectional-longitudinal | 1 | 1 | 80% (4/5) |
| [84] | Fertility control | C: 15% of males and 31% of females L: 1.5 years mgmt | Owned (free-roaming), Owned (restricted) | Observational-cross-sectional-single time point | 1 | 1 | 50% (1/2) |
| [82] | Fertility control | C/L: NA | Free-roaming stray, Free-roaming owned | Observational-cohort-prospective and Observational-cohort-retrospective | 1 | 1 | 40% (2/5) |
| [99] | Fertility control | C: 65% of females L: Not reported | Free-roaming stray, Free-roaming owned | Observational-cohort-retrospective | 1 | 1 | 40% (2/5) |
| [70] | Fertility control | C: ~80% of females L: Various—17, 7, and 0 years mgmt | Free-roaming stray, Free-roaming owned | Observational-cross-sectional-single time point | 1 | 3 (2 CNR intensities and a control) | 25% (1/4) |
| [69] | Fertility control | C: 62 to 87% L: 2 years mg | Free-roaming stray, Free-roaming owned | Observational-cross-sectional-longitudinal and Modelling | 6 | 1 | 20% (1/5) |
| [50] | Fertility control | C: Not reported L: 2 years mgmt | Free-roaming stray, Free-roaming owned | Observational-cross-sectional-single time point | 1 | 2 (CNR and control) | 100% (3/3) |
| [83] | Fertility control | C: Not reported L: 12 years study | Free-roaming stray, Free-roaming owned | Observational-cross-sectional-longitudinal | 1 | 1 | 0% (0/3) |
| [68] | Fertility control | C: 65% of females L: 8 years mgmt | Free-roaming stray, Free-roaming owned | Observational-cross-sectional-longitudinal and Observational-cohort-retrospective | 1 | 1 | 0% (0/4) |
| [71] | Fertility control | C: 61% L: 2 years mgmt | Free-roaming stray, Free-roaming owned | Observational-cross-sectional-single time point | 1 | 2 (CNR and control) | 0% (0/1) |
| [85] | Fertility control and culling | Various | Free-roaming stray, Free-roaming owned | Modelling | NA | NA | NA |
| [88] | Fertility control and culling | Various | Free-roaming stray | Modelling | NA | NA | NA |
| [100] | Fertility control and culling | Various | Free-roaming stray, Free-roaming owned | Modelling | NA | NA | NA |
| [72] | Fertility control and culling | C: Fertility control 3% (max). Culling 10% L: 30 years study | Free-roaming stray, Free-roaming owned | Observational-cohort-retrospective | 1 | 1 | 25% (1/4) |
| [103] | Fertility control and culling | C: Not reported L: 8 years mgmt | Free-roaming stray | Observational-cohort-retrospective | 1 | 1 | 20% (1/4) |
| [104] | Fertility control and culling | C: Fertility control: 8%. Culling: 67% L: 4 years mgmt | Free-roaming stray | Observational-cross-sectional-longitudinal | 1 | 1 | 20% (1/4) |
| [89] | Fertility control and movement restriction | Various | Free-roaming owned | Modelling and Observational-cross-sectional-single time point | NA | NA | NA |
| [87] | Fertility control and sheltering | Various | Free-roaming stray, Free-roaming owned, Restricted owned, Shelter dogs | Modelling | NA | NA | NA |
| [90] | Fertility control and sheltering | CNR: 20–40% more captures. Sheltering: 10% increase. | Free-roaming stray, Free-roaming owned, Restricted owned, Shelter dogs | Modelling | NA | NA | NA |
| [96] | Fertility control and sheltering | Various (from 0 up to 0.2 per year) | Free-roaming stray, Free-roaming owned | Modelling | NA | NA | NA |
| [73] | Fertility control and sheltering | C: 88% L: 14 months study | Free-roaming stray, Free-roaming owned | Observational-cross-sectional-longitudinal | 1 | 2 (management and control) | 67% (2/3) |
| [94] | Fertility control and sheltering | C/L: Not reported | Free-roaming stray, Free-roaming owned | Observational-cross-sectional-single time point | 1 | 1 | 20% (1/4) |
| [93] | Fertility control and sheltering | C: Fertility control: 43%. Sheltered: 33% L: 9 months mgmt | Free-roaming stray, Free-roaming owned, Restricted owned | Observational-cohort-prospective and Observational-cohort-retrospective | 1 | 1 | 20% (1/4) |
| [67] | Fertility control and sheltering | C: Not reported L: 13 years mgmt | Free-roaming stray, Free-roaming owned | Observational-cohort-retrospective | 1 | 1 | 0% (0/3) |
| [95] | Fertility control and sheltering | C: Fertility control: between 0.03 to 12%. Sheltering: NR L: 5 years study | Free-roaming stray, Free-roaming owned | Observational-cohort-retrospective | 1 | 1 | 0% (0/2) |
| [81] | Fertility control and sheltering | C/L: NA | Free-roaming stray | Observational-cross-sectional-single time point | 1 | 1 | 0% (0/3) |
| [80] | Sheltering | C/L: NA | Free-roaming stray | Observational-cross-sectional-single time point and Observational-cohort-retrospective | 1 | 2 (previously unowned free-roaming; previously owned) | 0% (0/3) |
| [5] | Sheltering | C: Not reported L: 11 years mgmt | Free-roaming stray, Shelter dogs | Observational-cohort-retrospective | 1 | 1 | 0% (0/4) |
| [92] | Taxation | NA | Free-roaming stray, Free-roaming owned, Restricted owned, Shelter dogs | Modelling | NA | NA | NA |
| Impact Category | Dog Population Management Method | Indicator | Effect | Country of Study | Management Intensity: Coverage (C) and Length (L) of Management | Size of Effect and Confidence Interval (CI)/Error Estimate (EE) Where Reported | Sample Size |
|---|---|---|---|---|---|---|---|
| Dog health and welfare | Fertility control | Body condition score (1–5 scale) | ↑ | India | C: Not reported L: 2 years mgmt | [50] (M&F) Normal body condition 1.7 (CI 1.1–2.5) times more likely in sterilised dogs (does not overlap null value, no p-value given). Analytical method: logistic regression models and likelihood ratio test. | 888 total (439 CNR; 448 control) |
| C: ~80% of females L: Various—17, 7, and 0 years mgmt | c [70] (M&F) Normal body condition 13% (No CI) increase in prevalence in high management areas. (Reported significant, values not given). Analytical method: pairwise comparisons. | 240 total (106 high intensity; 82 medium intensity; 101 no previous CNR) | |||||
| ↓ | Bangladesh | C: 61% L: 2 years mgmt | a [71] (M&F) Normal body condition 3% decrease in prevalence (NR). | 6341 | |||
| Fertility control related complications | n.e. | India | C/L: NA | [82] (M&F) Incidence at: 24 h monitoring major complications 3% (2.1–3.6%); minor complications 3% (1.9–3.4%); 4-day monitoring major complications 7% (3.9–11.5%); minor complications 6% (2.8–9.6%) (NR). | 2398 (2198 24 h monitoring, 200 4 day monitoring) | ||
| Presence of injury | ↓ | India | C: ~80% of females L: Various—17, 7, and 0 years mgmt | c [70] (M&F) Decrease of 22% (No CI) in high management areas. (Reported significant, values not given). | 240 total (106 high intensity; 82 medium intensity; 101 no previous CNR) | ||
| Prevalence of pathogens (ectoparasites, virus and bacterial infection) | ↑↓ | India | C: ~80% of females L: Various—17, 7, and 0 years mgmt | c [70] (M&F) Canine parvovirus ↓ 6%, Canine distemper virus ↓ 9%, fleas ↓ 21%, Ehrlichia canis ↓32%, Leptospira serovars ↓28%, Infectious canine hepatitis ↓ 23%, Brucella canis ↑ 7% in high management areas. (Reported significant, values not given). c ↑ ticks > 28% (high and low fertility control p = 0.0001, high and intermediate fertility control p = 0.131) (No CIs). Analytical method: Pairwise comparisons. | |||
| Prevalence of visible skin conditions | ↑ | India | C: Not reported L: 2 years mgmt | [50] (M&F) ↑ 1.7 (CI 1.3–2.2) times more likely in sterilised dogs (p < 0.001). Analytical method: Logistic regression models and likelihood ratio test. | 888 total (439 CNR; 448 control) | ||
| ↓ | Bangladesh | C: 61% L: 2 years mgmt | [71] (M&F) ↓5% (NR). | 6341 | |||
| Fertility control and sheltering | Physiological stress measures | ↓ n.e. | Serbia | C/L: NA | [81] (F) I = immediately after transport; 24 h = 24 h after housing): n.e. Cortisol, Cholesterol, Triglycerides, and lymphocyte. ↓ Glucose < 0.9(mmol/l) (p < 0.001) I = 4.5(+/−1.0) to 24 h = 3.6(+/−1.0), ↓ Leukocyte 4(×109 cells/L) (p < 0.01) = 15.1(+/−5.9) to 24 h = 11.1(+/−4.8), ↓ Neutrophil 4.2(×109 cells/L) (p < 0.001) I = 11.8(+/−4.8) to 24 h = 7.6(+/−3.2) ↓ Leukocyte/neutrophil ratio (p < 0.01) I = 7.4(+/−4.2) to 24 h = 4.9(+/−2.5). Analytical method: Non-parametric Mann-Whitney U test. | 40 | |
| Sheltering | Prevalence of behavioural problems | n.e. | Turkey | C/L: NA | [80] n.e. Destructive behaviour, hyper-attachment to owner, barking, aggressiveness, fearfulness, and escaping (No CI) (NS). Analytical method: Chi-squared. | 75 total (40 previously unowned free-roaming; 35 previously owned) | |
| Dog population demograph-ics | Fertility control | Dog population size | ↓ | India | C: Not reported L: 12 years study | [83] (M&F) ↓ ~40% b (NR). | NA |
| C: 65% of females L: 8 years mgmt | [68] (M&F) ↓ 28% (NR). | NA | |||||
| Brazil | C: 15% of males and 31% of females L: 1.5 years mgmt | [84] (M&F) ↓12% (NR). | NA | ||||
| ↓ n.e. | India | C: 62 to 87% L: 2 years mgmt | [69] (M&F) Both ↓ n.e. Decrease between 3% (p > 0.05) and 51% (p < 0.05). Analytical method: Not reported. | NA | |||
| Fertility control and sheltering | Dog population size | n.e. | Italy | C: Not reported L: 13 years mgmt | [67] (M&F) No effect (NR). | NA | |
| Brazil | C: 88% L: 14 months study | [73] (M&F) No effect (NR). Control (area A): from 81 (66–97) to 94 (75–113). Intervention (area B): from 70 (57–84) to 81 (65–96). Analytical method: Jolly-Seber mark-recapture model. | NA | ||||
| ↓ | Canada | C: Fertility control: 43%. Sheltered: 32% L: 9 months mgmt | [93] (M&F) ↓ 34% (p < 0.001). Analytical method: Not reported. | NA | |||
| C/L: Not reported | [94] (M&F) no quantitative data. | 18 | |||||
| Thailand | C: Fertility control: between 0.03 to 12%. Sheltering: NR L: 5 years study | [95] (M&F) ↓ 23% (NR). | NA | ||||
| Public attitude | Fertility control | Public attitude towards perception of dog management method | n.e. | Brazil | C: NR L: 3 years study | [97] (M&F) n.e. (p = 0.774) (No CI). Analytical method: Chi-squared. | 354 Pre-management; 70 post-management |
| Fertility control and sheltering | Public attitude towards free-roaming dogs | ↓ | Canada | C/L: Not reported | [94] (M&F) No quantitative data. | 18 | |
| Public health risk | Culling | Prevalence of visceral leishmaniasis in dogs | ↓ | Brazil | C: 8% L: 14 months study | [105] ↓ Between 66% and 69% (NR). | 328 |
| C: Not reported L: first 2 years mgmt | [106] Short term: Initial decrease of ↓ 26% (p < 0.001). Analytical method: Chi-squared (temporal changes within areas (intervention and control), and Poisson regression for between intervention and control. | Intervention area: 1989–1990 = 235; 1990–1991 = 248; 1991–1992 = 70; 1992–1993 = 131; and 1993 = 164. Control area = not reported. | |||||
| n.e. | Brazil | C: Not reported L: 4 years mgmt | [106] Long term: incidence not significantly different between intervention and control (p = 0.07). Analytical method: As above. | ||||
| Prevalence of visceral leishmaniasis in children | ↓ | Brazil | C: Not reported. L: 4 years mgmt | [106] ↓ incidence from 12 cases/1000 inhabitants/year to 2 cases/1000 inhabitants/year (p < 0.01). Analytical method: As above. | NA | ||
| Fertility control | Human bite cases | ↓ | India | C: 65% of females L: Not reported | b [99] (F) ↓ 5 bites per month (p < 0.001) b. Analytical method: Linear least squares regression. | NA | |
| Number of human rabies cases | ↓ | India | C: 65% of females. L: 10 years mgmt | [68] (M&F) ↓ 100% (NR). | NA | ||
| Fertility control and culling | Number of human rabies cases | ↓ | Sri Lanka | C: Fertility control 3% (max). Culling 10% L: 30 years study | [72] (M&F) ↓ 82% (NR). | NA | |
| Echinococcus granulosus prevalence in humans | n.e. | Cyprus | C: Not reported L: 8 years mgmt | [103] (F) n.e. on the number of people operated on for Echinococcus granulosus cysts (NR). | NA | ||
| Echinococcus granulosus prevalence in livestock | ↓ | Cyprus | C: Not reported L: 5 years mgmt | [103] (F) ↓ overall infection rate (cattle from 0.09% to 0.01%, sheep from 0.03% to 0.02%, and goats from 0.01% to 0.003%) (NR). | 1,899,040 total (104,134 cattle; 885,618 sheep; and 909,288 goats) | ||
| C: Fertility control: 8%. Culling: 67% L: 4 years mgmt | [104] (F) ↓ prevalence between 47% to 2% (depending on species and age) (NR). | Not reported | |||||
| Echinococcus granulosus prevalence in dogs | ↓ | Cyprus | C: Not reported L: 6 years mgmt | [103] (F) ↓ 100% in dogs (NR). | 2391 | ||
| C: Fertility control: 8%. Culling: 67% L: 4 years mgmt | [104] (F) ↓ 80% in dogs (NR). | 12,213 in 1972; 3947 in 1976 | |||||
| Fertility control and sheltering | Dog disease prevalence (helminths, Isospora, Sarcocystis, Giardia, Cryptosporidium, Taenia, Echinococcus spp, Dirofilaria immitis, Ehrlichia canis, Borrelia burgdorferi and Anaplasma phagocytophilum, and Toxoplasma gondii) | n.e. | Canada | C: Fertility control: 43%. Sheltered: 33%. L: 9 month mgmt | [93] (M&F) Overall ↓ 43% (p < 0.001). Analytical method: Chi-squared. | 145 Pre-clinic; 95 post-clinic | |
| Number of human rabies cases | ↓ | Thailand | C: Fertility control: between 0.03 to 12%. Sheltering: NR. L: 6 years study | [95] ↓ 15% (NR). | NA | ||
| Sheltering | Echinococcus granulosus prevalence in humans | ↓ | Spain | C: Not reported L: 11 years mgmt | [5] ↓ 97% (NR). | NA | |
| Echinococcus granulosus prevalence in livestock | ↓ | Spain | C: Not reported L: 11 years mgmt | [5] ↓ 75% (NR). | 376 in 1992; 1172 in 1999 | ||
| Echinococcus granulosus prevalence in dogs | ↓ | Spain | C: Not reported L: 11 years mgmt | [5] ↓ 79% (NR). | 553 in 1989; 1040 in 1998 |
| Impact Category | Dog Population Management Method | Indicator | Effect | Country of Study | Management Coverage | Size of Effect |
|---|---|---|---|---|---|---|
| Dog population demographics | Culling | Dog population size | ↓ | No specific country | Up to 33% | [91] Decreasing trend. |
| North America | Various | [88] Decreasing trend. | ||||
| India | Various | [85] * ↓ 13% over 20 years. | ||||
| Fertility control | Dog population size | ↓ | India | 62 to 87% | [69] ↓ 69% (80% neutering coverage) over 20 years. | |
| Various | [85] * ↓ Between 55% and 75% over 20 years. | |||||
| Brazil | Various (65% and above) | [86] Decreasing trend. | ||||
| North America | Various | [87,88] Decreasing trend. | ||||
| Mexico | Various | [89] ↓ Between 14% and 78% (depending on neutering effort and targeting young vs. mixed age dogs) over 20 years. | ||||
| Italy | 20–40% more captures. | [90] ↓ 34% over 10 years. | ||||
| n.e. | India | 62 to 87% | [69] n.e. (31% neutering coverage) over 20 years. | |||
| Sheltering | Dog population size | n.e. | North America | Various | [87] n.e. over 30+ years | |
| ↓ n.e. | Italy | 10% increase | [90] ↓ 3% and n.e. over 10 years. | |||
| Taxation | Dog population size | ↓ | No specific country | NA | [92] Decreasing trend. | |
| Fertility control and movement restriction | Dog population size | ↓ | Mexico | Various | [89] Between <18% and 73% (depending on neutering effort and confinement level) over 20 years. | |
| Brazil | Various (from 0 up to 0.2 per year) | [96]: ↓ 5% in 30 years. | ||||
| North America | Various | [87]: Decreasing trend. | ||||
| Public health risk | Culling | Dog rabies prevalence | ↓ | Parameters from multiple countries | Various | [100,101] Decreasing trend. |
| Chad | 5% and 10% | [102] Decreasing trend | ||||
| Rabies basic reproductive number (R0) | ↓ | China | Various | [107,108] Decreasing trend. | ||
| No specific country | Up to 33% | [91] Decreasing trend | ||||
| Fertility control | Number of human rabies cases | ↓ | India | 25 to 50% | [98] ↓ 92% in 5 years. | |
| Dog rabies prevalence | ↓ | Multiple countries | Various | [100] Decreasing trend. | ||
| Wildlife | Fertility control | Prevalence of canine distemper in Indian foxes (Vulpes bengalensis) | ↓ | India | Simulate a 50%, 75% and 90% reduction, but do not specify what neutering rate would achieve this | [109] ↓ Between 3 fewer canine distemper spill over events per 10 years (at 50% population reduction) to 6 fewer canine distemper spill over events per 10 years (at 90% population reduction) |
| Methods Being Compared | Indicator | Effect | Evidence | Most Effective Method | |
|---|---|---|---|---|---|
| Fertility control and culling | Fertility control | Culling | |||
| Dog population size | ↓ | ↓ | North America | [88] Over a shorter period (5 years), culling was a more effective strategy. Over a longer period (20 years), both methods had similar effectiveness. | |
| India | [85] Fertility control was more effective than culling, fertility control reduced population size by over 75%, compared to ~13% with culling over 20 years. | ||||
| Dog rabies prevalence | ↓ | ↓ | Multiple countries | [100] Culling was as effective as fertility control combined with rabies vaccination. | |
| Fertility control and sheltering | Fertility control | Sheltering | |||
| Dog population size | ↓ | ↓ | Multiple countries | [96] Fertility control and adoption, through sheltering, had synergistic effects. Adoption, through sheltering, was the most effective method when comparing the two. | |
| North America | [87] Fertility control was the most effective, although adoption, through sheltering, worked well in combination with fertility control. | ||||
| ↓ | ↓ | Italy | [90] Fertility control was the most effective, reducing dog population size by 34%, compared to only 3% in sheltering. | ||
| Fertility control and movement restriction | Fertility control | Movement restriction | |||
| Dog population size | ↓ | ↓ | Mexico | [89] Varying size of effect relating to neutering coverage, age of dog neutering and confinement level. Fertility control of owned dogs and dog movement restriction were most effective when used together. | |
| Different taxation methods | Taxation of dog purchases | Subsidy of dog adoption | |||
| Dog population size | ↓ | ↓ | No specific country | [92] Taxation of dog buyers is the most effective option at reducing the number of free-roaming dogs. | |
© 2019 by the authors. Licensee MDPI, Basel, Switzerland. This article is an open access article distributed under the terms and conditions of the Creative Commons Attribution (CC BY) license (http://creativecommons.org/licenses/by/4.0/).
Share and Cite
Smith, L.M.; Hartmann, S.; Munteanu, A.M.; Dalla Villa, P.; Quinnell, R.J.; Collins, L.M. The Effectiveness of Dog Population Management: A Systematic Review. Animals 2019, 9, 1020. https://doi.org/10.3390/ani9121020
Smith LM, Hartmann S, Munteanu AM, Dalla Villa P, Quinnell RJ, Collins LM. The Effectiveness of Dog Population Management: A Systematic Review. Animals. 2019; 9(12):1020. https://doi.org/10.3390/ani9121020
Chicago/Turabian StyleSmith, Lauren M., Sabine Hartmann, Alexandru M. Munteanu, Paolo Dalla Villa, Rupert J. Quinnell, and Lisa M. Collins. 2019. "The Effectiveness of Dog Population Management: A Systematic Review" Animals 9, no. 12: 1020. https://doi.org/10.3390/ani9121020