Article

Effects of Methionine Supplementation Levels in Normal or Reduced Protein Diets on the Body Composition and Femur Bone Characteristics of Broilers Challenged with Coccidia

Department of Poultry Science, University of Georgia, Athens, GA 30602, USA
*
Author to whom correspondence should be addressed.
Animals 2024, 14(6), 917; https://doi.org/10.3390/ani14060917
Submission received: 6 February 2024 / Revised: 13 March 2024 / Accepted: 14 March 2024 / Published: 16 March 2024
(This article belongs to the Special Issue Sustainable Poultry Production: Physiology and Nutrition)

Abstract

:

Simple Summary

Coccidiosis has been documented to adversely affect the bone quality of broilers. While the influence of minerals and vitamins on bone development has been studied, the impact of methionine supplementation on the bone health of broilers facing coccidia challenge remains inadequately explored. This study aimed to provide insights into the effects of varying dietary methionine levels in normal or reduced protein diets on the bone quality of broilers challenged with coccidia, utilizing X-ray scanning techniques. Interestingly, our results showed that increased methionine levels were associated with decreased whole body bone mineral content and density. In the femur bone, higher methionine levels were associated with decreased cortical bone quality, while they improved trabecular bone quality in birds fed reduced protein diets. Overall, this study sheds light on the complex interplay between dietary methionine levels, protein content, and coccidiosis challenge on broiler bone health, providing information to improve the bone health and welfare of birds under coccidia challenge through nutritional interventions.

Abstract

This study investigated the effects of dietary methionine (Met) levels on the bone quality of broilers challenged with coccidia. A total of 600 fourteen-day-old male Cobb500 broilers were gavaged with mixed Eimeria spp. and randomly allocated into 10 treatment groups by a 2 × 5 factorial arrangement. Birds received normal protein diets (NCP) or reduced-protein diets (LCP), containing 2.8, 4.4, 6.0, 7.6, and 9.2 g/kg of Met. Data were analyzed via two-way ANOVA and orthogonal polynomial contrast. At 9 days post-inoculation (DPI), whole body bone mineral density (BMD) and bone mineral content (BMC) linearly decreased as Met levels increased (p < 0.05). For the femoral metaphysis bone quality at 9 DPI, BMD linearly decreased, and porosity linearly increased as Met levels increased (p < 0.05) in the cortical bone. The increased Met levels linearly improved trabecular bone quality in LCP groups (p < 0.05) while not in NCP groups. For the femoral diaphysis cortical bone at 6 DPI, LCP groups had higher BMD and BMC than NCP groups (p < 0.05). Bone volume linearly increased as Met levels increased in LCP groups (p < 0.05) while not in NCP groups. In summary, the results suggested that increased Met levels decreased the cortical bone quality. However, in the context of reduced-protein diets, the increased Met levels improved trabecular bone quality.

1. Introduction

Coccidiosis, caused by the protozoan parasite of the genus Eimeria, remains a significant threat to poultry health worldwide, leading to substantial economic losses [1]. The infection of coccidia presents multifaceted challenges to broiler health and productivity. Numerous studies have highlighted its detrimental effects on nutrient utilization, intestinal integrity, and the growth performance of birds [2,3,4,5]. On the other hand, previous research has also documented a range of adverse outcomes on bone health by coccidia infection, including reduced bone mineralization leading to greater porosity in cortical bone, diminished bone mineral density, weakened bone strength, and increased trabecular bone resorption [6,7]. These findings underscore the systemic impact of coccidiosis, extending beyond the gastrointestinal tract to affect skeletal development and integrity.
Due to the concerns about antimicrobial resistance and food safety, as well as evolving regulatory restrictions, the broiler production of “no antibiotics ever” (NAE) or “raised without antibiotics” (RWA) has become more and more prevalent during the past few years [8,9]. This transition underscores the imperative to explore alternative strategies to mitigate the impact of coccidiosis. In addition to investigating the effects of feed additives, such as probiotics, prebiotics, and phytogenic compound supplementations [10], exploring the optimal nutrient requirements for birds under challenged conditions is also vital to improve the health and performance of these animals [11,12,13,14].
Methionine (Met), as the first limiting amino acid in poultry diets, serves not only as the vital building block of proteins but also possesses many functional roles [15,16,17,18]. As previous studies showed, the detrimental effects caused by coccidiosis on bone development were attributed to the elevated oxidative stress and imbalance between osteoclast and osteoblast activities [19,20]. Extra dietary levels of Met could potentially alleviate the impacts of coccidia challenge on bone health due to its potent antioxidant capacity and immune modulatory effects [21,22,23,24]. The reduction in dietary crude protein (CP) content has been advocated for its numerous advantages, including cost reduction, decreased nitrogen excretion, and improved litter quality [2,25,26,27,28,29].
Despite the recognized benefits of adjusting dietary CP levels and increasing Met supplementation, limited research has investigated the specific effects of varying Met levels on bone health in broilers subjected to coccidia challenge. Thus, the present study aimed to address this gap by examining the influence of different Met supplementation levels, within normal or reduced-protein diets, on the bone characteristics of broilers under coccidia challenge.

2. Materials and Methods

All animal experiment procedures used in this study were approved by the Institutional Animal Care and Use Committee of the University of Georgia (A2021 12-012).

2.1. Experimental Design and Bird Husbandry

The same starter diet that met the breeder’s nutrient recommendations [30] was fed to 600 male Cobb broilers from days 0 to 14. On day 14, all birds were orally gavaged with 25,000 oocysts of E. maxima, 25,000 oocysts of E. tenella, and 125,000 oocysts of E. acervulina to induce coccidiosis infection. On day 14, the birds were randomly allocated into 10 treatment groups with 5 replicates per treatment and 12 birds per replicate. The treatment groups followed a 2 × 5 factorial arrangement. In the normal protein groups (NCP), the diets contained 20% crude protein (CP). As for the low-protein groups (LCP), the diets contained 17% CP, with a 15% reduction from the recommended protein level. The amino acid levels, excluding Met, in the NCP group were formulated to meet the breeder’s recommendation, whereas in the LCP group, they were also reduced by 15%. In both groups, DL-Met was supplemented to achieve Met levels of 2.8, 4.4, 6.0, 7.6, and 9.2 g/kg of the diets, designated as Met 2.8, Met 4.4, Met 6.0, Met 7.6, and Met 9.2, respectively. The feedstuffs and chemical composition of the diets are shown in Table 1. Twelve birds were reared in each battery cage throughout the experimental period from day 0 to d 23. The metallic wire mesh cage was equipped with trough drinker and feeder to provide the birds with ad libitum feed and water. The dimensions of battery cage were 70 cm in length, 60 cm in width, and 30 cm in height. The temperature was set at 33 °C on day 0 and then decreased by 3 °C each week according to the Cobb 500 Broiler Management Guide [31]. The lighting regime was maintained at 22 h of light and 2 h of darkness throughout the experiment period.

2.2. Dual-Energy X-ray Absorptiometry for Body Composition Analysis

The body composition analysis was performed by a GE whole body dual-energy X-ray absorptiometry (DEXA) scanner (GE Healthcare, Chicago, IL, USA) according to the previously described method [32]. At 9 days post-inoculation (DPI), before initiating the scanning analysis, a quality assurance program was executed, utilizing a phantom standard to ensure the accurate calibration of the equipment. Subsequently, one bird per cage was euthanized and carefully positioned chest up on the scanner, ensuring no overlap of body parts among the birds. The scanning mode was adjusted for small animals. After the scanning process, the region of interest was determined for each individual bird to measure whole body bone density, mineral content, fat percentage, and lean tissue weight.

2.3. Microtomography Scanning for Microstructural Analysis of the Femur Bone

At 6 and 9 days post-inoculation, another bird from each cage was euthanized for femur bone collection. After removal of muscles and soft tissues, the bones were wrapped in wet cheesecloth and held in a low-density 50 mL tube to prevent any random movement during the scanning. Prior to the scanning, the alignment test and flat-field correction were performed for calibration. The samples were scanned by the Skyscan Micro-CT scanner (Skyscan 1275; Bruker MicroCT, Billerica, MA, USA) for 3D image acquisition. The X-ray source was configured to operate at 75 kV and 133 μA, with a 0.5 mm aluminum filter employed to reduce beam-hardening effects. The pixel size remained constant at 25 μm. Scanning was conducted over a 180° rotation with a rotation angle of 0.4°, and 4 images were captured per rotation. The captured 2D images were then reconstructed by the N-Recon program (Bruker MicroCT, Billerica, MA, USA) to generate a 3D model. The resultant model was realigned to a vertical position using the Data Viewer program (Bruker MicroCT, Billerica, MA, USA) to ensure the consistency of the regions of interest (ROIs) selection. The ROI was selected in the CTAn program (Bruker MicroCT, Billerica, MA, USA). The distal metaphysis of 300 slides (7.5 mm in height) and the diaphysis of 300 slides (7.5 mm in height) were selected for analysis (Figure 1). The selected ROI was then processed for cortical and trabecular bone separation according to previously described procedures [33], and the parameters listed and described [34] in Table 2 were measured. To measure bone mineral density (BMD), two phantoms composed of calcium hydroxyapatite with known densities (0.25 and 0.75 g/cm3) were scanned using identical settings as those used for bone scanning to generate the standards [35].

2.4. Statistical Analysis

The PROC GLM program in SAS software (version 9.4; SAS Institute Inc., Cary, NC, USA) was used for the statistical analysis of the obtained data. The data were analyzed by two-way ANOVA. Post hoc analysis was conducted using the Tukey’s honestly significant difference test when significant differences were detected. Orthogonal polynomial contrasts were utilized to evaluate linear and quadratic trends between the various Met levels and measured parameters. Statistical significance was set at p ≤ 0.05.

3. Results

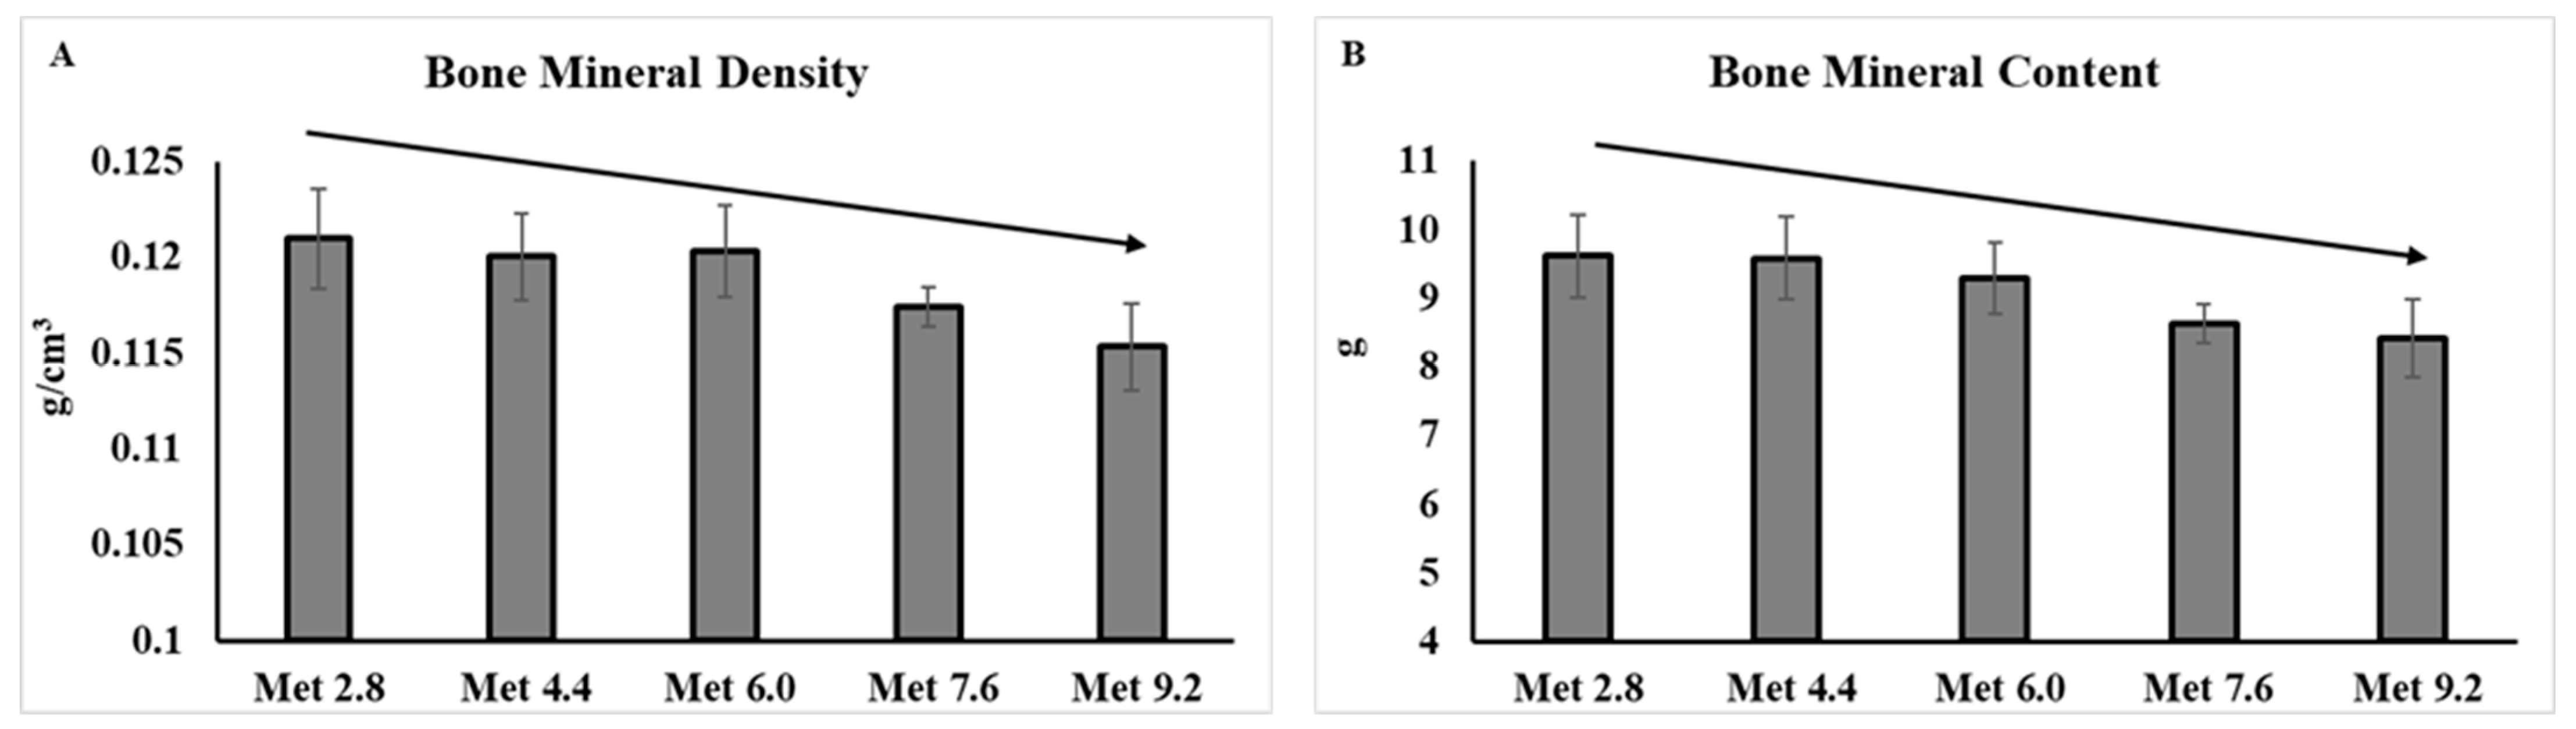
3.1. Body Composition Analyzed by Dual-Energy X-ray Absorptiometry

No significant treatment effects were found for the body composition results. However, as the dietary Met levels increased, the whole body BMD, F(1,40) = 4.12, p = 0.049, and bone mineral content (BMC), F(1,40) = 4.27, p = 0.045, linearly decreased (Figure 2).

3.2. Femur Bone Microstructure Analyzed by Microtomography

3.2.1. Metaphysis Cortical Bone

No significant treatment effects were found for the parameters measured for the femoral metaphysis cortical bone on 6 DPI. At 9 DPI, the BMD linearly decreased as Met levels increased, F(1,40) = 5.95, p = 0.020, and the number of pores (NP), F(1,40) = 5.14, p = 0.029, volume of pores (VP), F(1,40) = 4.70, p = 0.037, and pore percentage (PP), F(1,40) = 5.66, p = 0.023, linearly increased as Met levels increased (Figure 3).

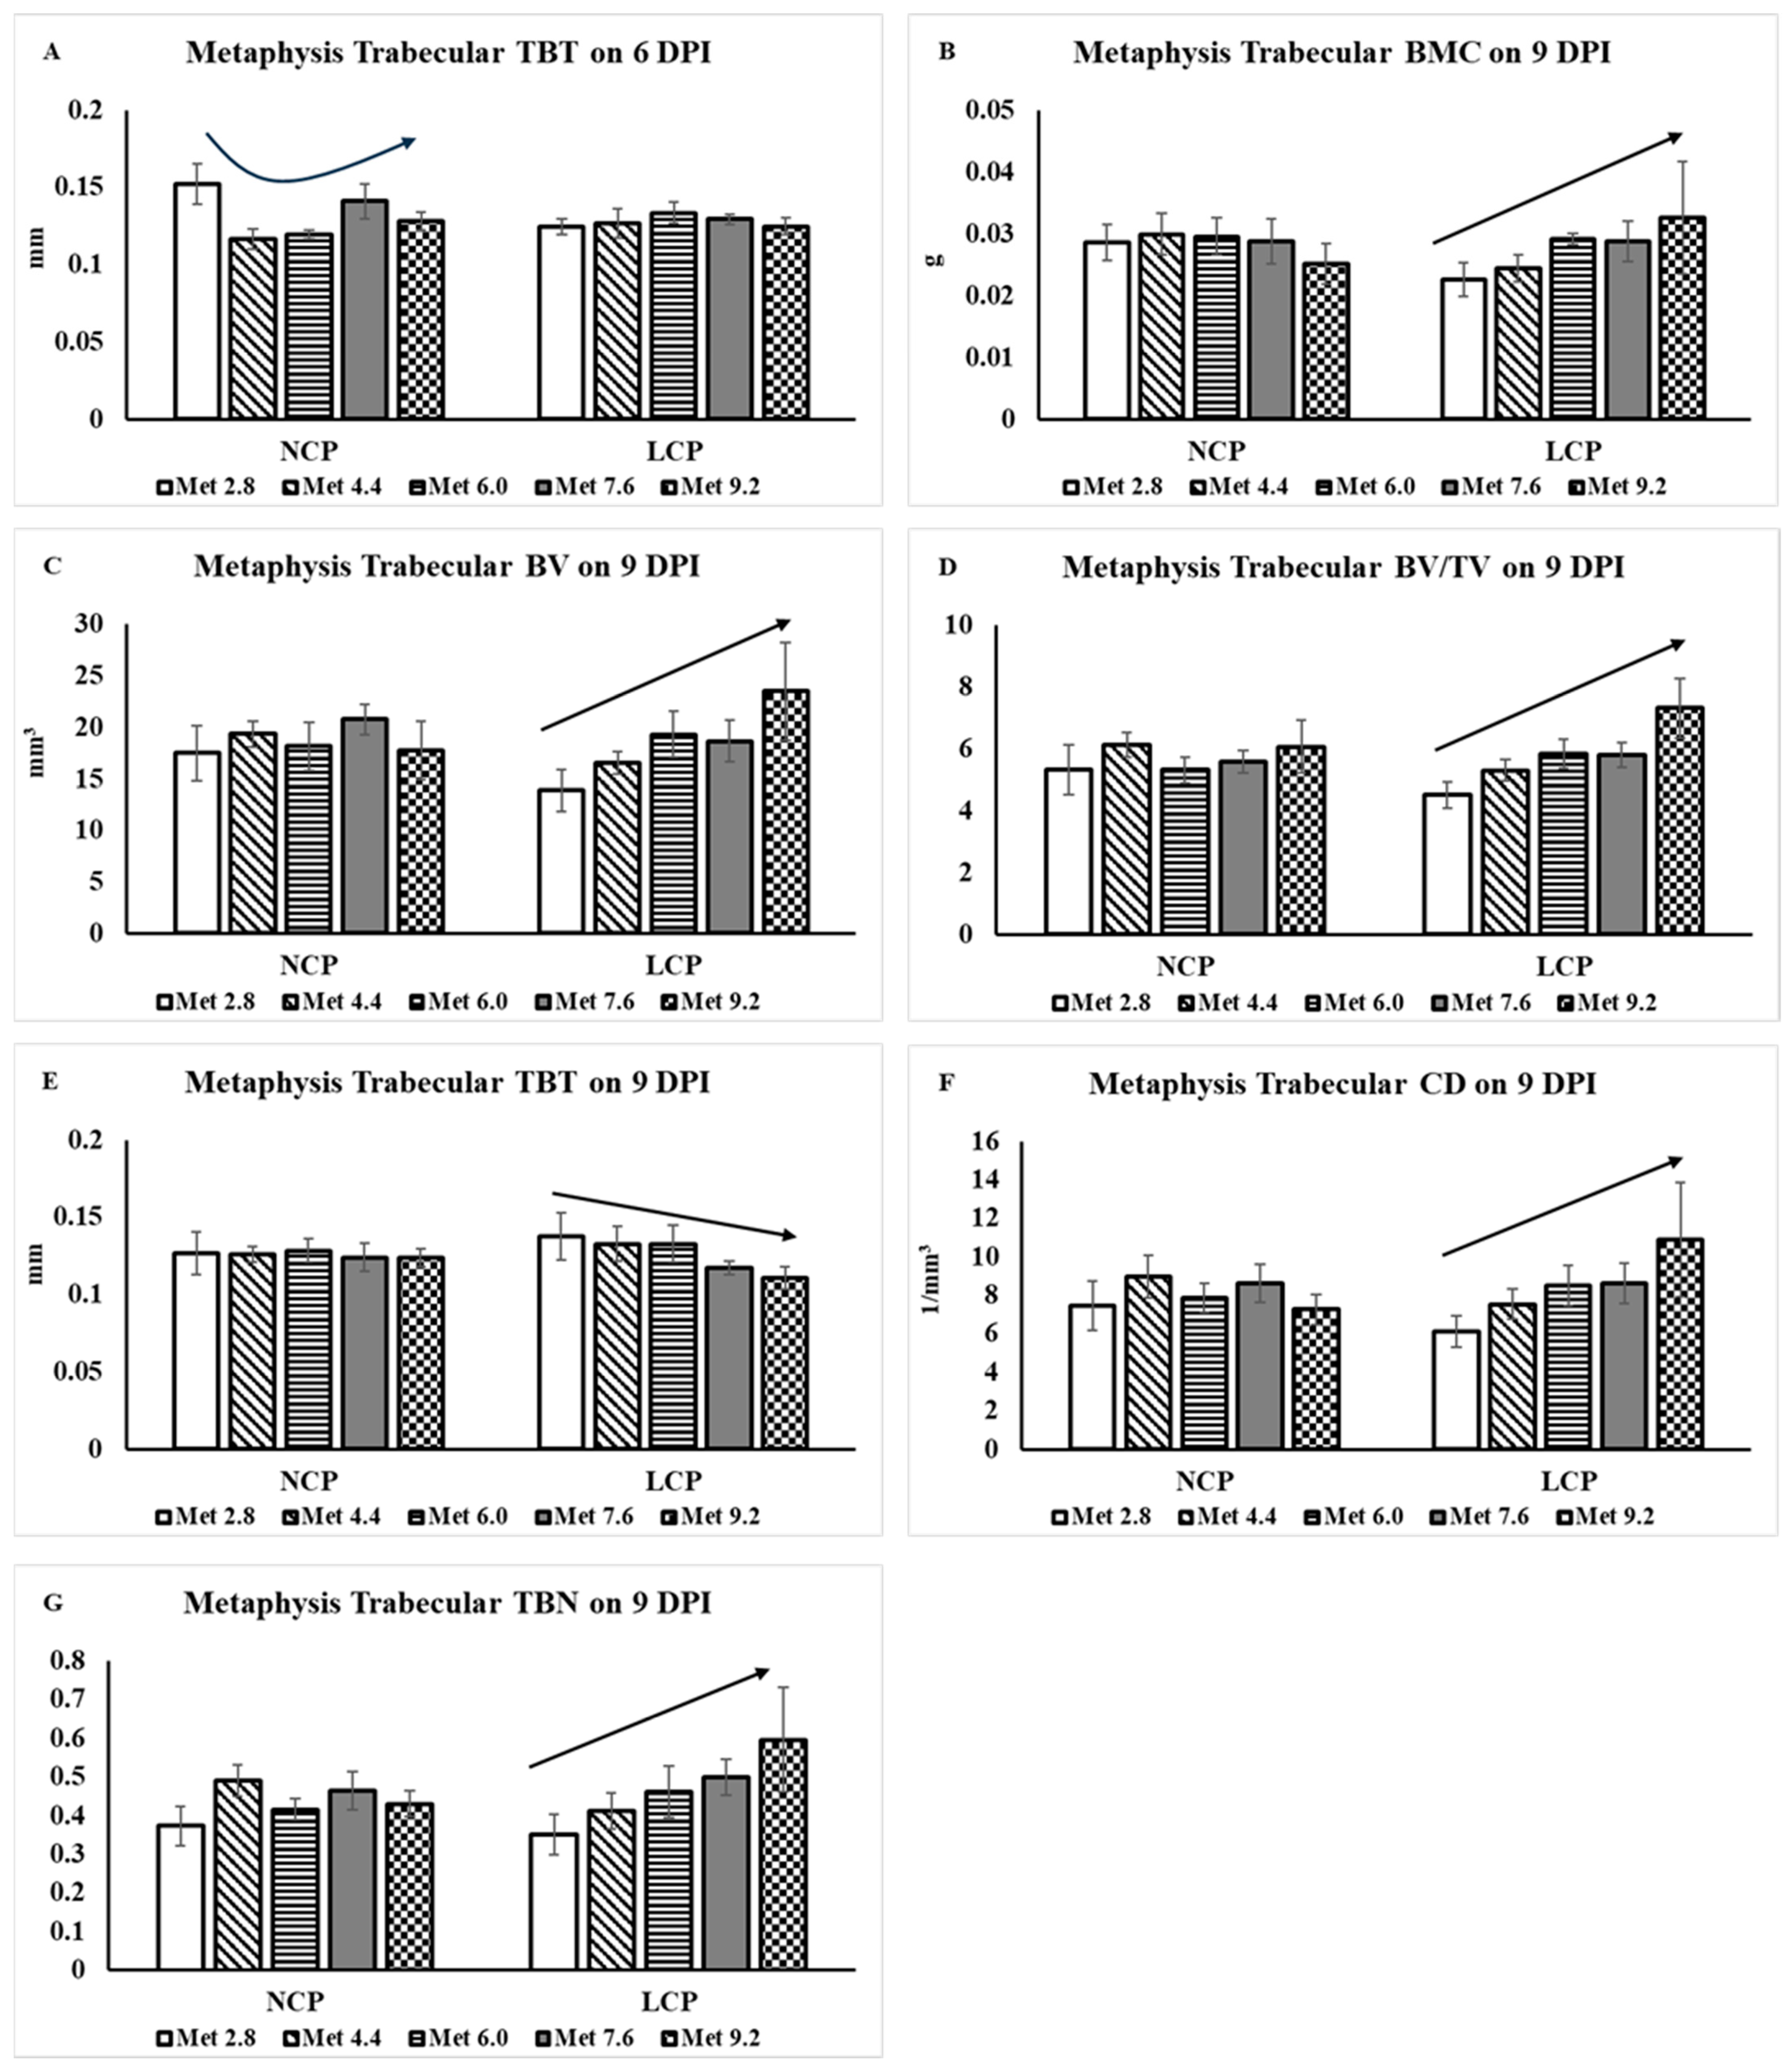
3.2.2. Metaphysis Trabecular Bone

At 6 DPI, the trabecular thickness (TBT) decreased initially and then increased following a quadratic trend as Met levels increased in the NCP groups, F(1,40) = 5.03, p = 0.030, while not in the LCP groups (Figure 4). However, the treatment effects were not significant for other measured parameters. At 9 DPI, no treatment effects were observed for the tissue volume (TV) and trabecular separation (TBS). The BMC, F(1,40) =4.10, p = 0.050, bone volume (BV), F(1,40) = 7.51, p = 0.009, BV/TV ratio, F(1,40) = 10.3, p = 0.028, trabecular number (TBN), F(1,40) = 9.28, p = 0.004, and connectivity density (CD), F(1,40) = 7.19, p = 0.011, linearly increased as Met levels increased in the LCP groups while not in the NCP groups. The TBT linearly decreased as Met levels increased in the LCP groups, F(1,40) = 4.48, p = 0.041, while not in the NCP groups.

3.2.3. Diaphysis Cortical Bone

At 6 DPI, the BMD, F(1,40) = 4.18, p = 0.048, and BMC, F(1,40) = 5.32, p = 0.026, were both significantly higher in the LCP groups compared to the NCP groups (Figure 5). The TV, F(1,40) = 4.86, p = 0.033, and BV, F(1,40) = 5.55, p = 0.023, linearly increased as Met levels increased in the LCP groups while not in the NCP groups. No significant treatment effects were observed for other parameters. At 9 DPI, the BMD linearly decreased as Met levels increased in the NCP groups, F(1,40) = 4.57, p = 0.039, while not in the LCP groups.

4. Discussion

This study employed DEXA and Micro-CT scanning techniques to evaluate various parameters related to broiler bone health, shedding light on this critical aspect regarding both the nutrient requirements of broilers under coccidia challenge and their welfare. Overall, while no significant treatment effects were observed for body composition, notable alterations were detected in the whole body BMD, BMC, and bone microstructure parameters in the femur bone.
It is interesting to find that increasing Met levels in the diet decreased the whole body BMD and BMC, regardless of the type of diet. This implies that a high Met intake may have a negative impact on the overall bone quality and mass. This was further evidenced as we analyzed the femur bone microstructure and found that increasing Met levels in the diet decreased the BMD of the femoral metaphysis cortical bone and increased the porosity of the cortical bone, especially at 9 DPI. Elevated porosity is commonly associated with diminished bone strength and stiffness, increasing susceptibility to fractures under stress or impact [35,36,37]. Moreover, increased porosity can compromise the bone’s role as a reservoir of essential minerals, such as calcium and phosphorus, which are vital for numerous metabolic processes in the body [38], as evidenced by the observed decrease in BMD. This reduction in bone quality in the metaphysis cortical bone could be due to the increased accumulation of homocysteine (Hcy) caused by increased dietary Met levels, as multiple studies have demonstrated [39,40,41]. Hcy has been recognized as a risk factor for bone disease development [42,43,44]. As previous studies have reported, increased Hcy levels were associated with elevated levels of matrix metalloproteinases that contribute to bone matrix degradation [45] and increased bone-resorbing osteoclast activity [44,46]. This hypothesis needs to be investigated in future studies to fully understand the mechanisms before this decreased cortical bone quality.
More interestingly, the effects of increased Met levels exerted different effects on the metaphysis trabecular microstructures. While the trabecular bone quality was not affected by the treatments in the NCP groups, it was improved in the LCP groups as Met levels increased. As previously mentioned, trabecular bone is more responsive to immune responses [47,48,49], and one previous study showed that the bone mineral loss during coccidiosis occurred more in the trabecular bone [7], so it is plausible to hypnotize that instead of being accumulated as Hcy, the extra Met supplementation exerted its functional roles, such as antioxidant capacity, immunomodulatory effects, and collagen synthesis [15,50], especially in the LCP groups where the supply of other essential and non-essential amino acids was also reduced. Consequently, trabecular bone quality may have improved, as evidenced by the increased trabecular number and connectivity density.
It is also intriguing to observe that the reduced-protein diet improved BMD and BMD in the femoral diaphysis. Some prior studies have suggested that high-protein diets could be detrimental to bone health due to increased urinary calcium excretion resulting from the metabolic acidity of protein catabolism [51,52,53]. In acidic conditions, the activities of osteoclasts are increased while the activities of bone-forming osteoblasts are suppressed [54,55]. However, this point of view remains debatable, with evidence also suggesting that increased protein intake can be beneficial for bone health [56,57]. It is essential to recognize that these studies have predominantly focused on human subjects, with limited evidence available in poultry, especially for broilers under conditions of coccidiosis challenge. Further studies are needed to further investigate this question in poultry.

5. Conclusions

In conclusion, the findings of the current study suggest that in broilers under coccidia challenge, increased dietary Met levels were associated with a decrease in cortical bone quality parameters. However, in the context of reduced-protein diets, such an increase in Met levels conversely improved trabecular bone quality. The findings of this study underscored the complex interplay between dietary components, particularly Met, and bone health in broilers under coccidiosis challenge, highlighting the importance of considering dietary interventions for optimizing skeletal integrity and overall welfare in poultry production.

Author Contributions

Conceptualization: G.L. and W.K.K. Experimental conduction: G.L. and V.S.R.C. Laboratory analysis: G.L., M.K.S., H.K. and J.C. Experimental supervision: W.K.K. Data analysis and interpretation: G.L. and W.K.K. Original draft writing: G.L. Draft revision: G.L., V.S.R.C., M.K.S., H.K., J.C. and W.K.K. All authors have read and agreed to the published version of the manuscript.

Funding

This study was financially supported in part by a cooperative agreement 6040-32000-080-000D from the United States Department of Agriculture-Agricultural Research Service.

Institutional Review Board Statement

All the animal experiment procedures used in this study were approved by the Institutional Animal Care and Use Committee of the University of Georgia (A2021 12-012: 12 April 2022).

Informed Consent Statement

The broiler chicks in the current study were obtained directly from a commercial hatchery (Cobb-Vantress Hatchery, Cleveland, GA, USA) and did not have individual owners.

Data Availability Statement

Data generated or analyzed during this study are included in the published article and available from the corresponding author upon reasonable request.

Acknowledgments

The authors express their gratitude to Lorraine Fuller for providing the Eimeria spp. and extend their appreciation to all members of Woo Kim’s research team for their assistance with animal care and sample collection. The authors also acknowledge the support of the farm staff at the Poultry Science Research Complex at the University of Georgia, Athens.

Conflicts of Interest

The authors declare no conflicts of interest.

References

  1. Blake, D.P.; Knox, J.; Dehaeck, B.; Huntington, B.; Rathinam, T.; Ravipati, V.; Ayoade, S.; Gilbert, W.; Adebambo, A.O.; Jatau, I.D.; et al. Re-calculating the cost of coccidiosis in chickens. Vet. Res. 2020, 51, 115. [Google Scholar] [CrossRef]
  2. Liu, G.; Ajao, A.M.; Shanmugasundaram, R.; Taylor, J.; Ball, E.; Applegate, T.J.; Selvaraj, R.; Kyriazakis, I.; Olukosi, O.A.; Kim, W.K. The effects of arginine and branched-chain amino acid supplementation to reduced-protein diet on intestinal health, cecal short-chain fatty acid profiles, and immune response in broiler chickens challenged with Eimeria spp. Poult. Sci. 2023, 102, 102773. [Google Scholar] [CrossRef]
  3. Teng, P.-Y.; Liu, G.; Choi, J.; Yadav, S.; Wei, F.; Kim, W.K. Effects of levels of methionine supplementations in forms of L- or DL-methionine on the performance, intestinal development, immune response, and antioxidant system in broilers challenged with Eimeria spp. Poult. Sci. 2023, 102, 102586. [Google Scholar] [CrossRef]
  4. Sharma, M.K.; Liu, G.; White, D.L.; Kim, W.K. Graded levels of Eimeria infection linearly reduced the growth performance, altered the intestinal health, and delayed the onset of egg production of Hy-Line W-36 laying hens when infected at the prelay stage. Poult. Sci. 2024, 103, 103174. [Google Scholar] [CrossRef]
  5. Taylor, J.; Sakkas, P.; Kyriazakis, I. Starving for nutrients: Anorexia during infection with parasites in broilers is affected by diet composition. Poult. Sci. 2022, 101, 101535. [Google Scholar] [CrossRef] [PubMed]
  6. Sakkas, P.; Oikeh, I.; Blake, D.P.; Smith, S.; Kyriazakis, I. Dietary vitamin D improves performance and bone mineralisation, but increases parasite replication and compromises gut health in Eimeria-infected broilers. Br. J. Nutr. 2019, 122, 676–688. [Google Scholar] [CrossRef]
  7. Tompkins, Y.H.; Choi, J.; Teng, P.-Y.; Yamada, M.; Sugiyama, T.; Kim, W.K. Reduced bone formation and increased bone resorption drive bone loss in Eimeria infected broilers. Sci. Rep. 2023, 13, 616. [Google Scholar] [CrossRef] [PubMed]
  8. Cervantes, H.M. Antibiotic-free poultry production: Is it sustainable? J. Appl. Poult. Res. 2015, 24, 91–97. [Google Scholar] [CrossRef]
  9. Cervantes, H.; McDougald, L. Raising broiler chickens without ionophore anticoccidials. J. Appl. Poult. Res. 2023, 32, 100347. [Google Scholar] [CrossRef]
  10. Abbas, R.Z.; Iqbal, Z.; Khan, A.; Sindhu, Z.-U.-D.; Khan, J.A.; Khan, M.N.; Raza, A. Options for integrated strategies for the control of avian coccidiosis. Int. J. Agric. Biol. 2012, 14, 1014–1020. [Google Scholar]
  11. Dozier, W.; Kidd, M.T.; Corzo, A. Dietary Amino Acid Responses of Broiler Chickens1. J. Appl. Poult. Res. 2008, 17, 157–167. [Google Scholar] [CrossRef]
  12. Liu, G.; Sharma, M.K.; Tompkins, Y.H.; Teng, P.-Y.; Kim, W.K. Impacts of varying methionine to cysteine supplementation ratios on growth performance, oxidative status, intestinal health, and gene expression of immune response and methionine metabolism in broilers under Eimeria spp. challenge. Poult. Sci. 2024, 103, 103300. [Google Scholar] [CrossRef]
  13. Castro, F.L.S.; Teng, P.Y.; Yadav, S.; Gould, R.L.; Craig, S.; Pazdro, R.; Kim, W.K. The effects of L-Arginine supplementation on growth performance and intestinal health of broiler chickens challenged with Eimeria spp. Poult. Sci. 2020, 99, 5844–5857. [Google Scholar] [CrossRef] [PubMed]
  14. Khatlab, A.d.S.; Del Vesco, A.P.; de Oliveira Neto, A.R.; Fernandes, R.P.M.; Gasparino, E. Dietary supplementation with free methionine or methionine dipeptide mitigates intestinal oxidative stress induced by Eimeria spp. challenge in broiler chickens. J. Anim. Sci. Biotechnol. 2019, 10, 58. [Google Scholar] [CrossRef] [PubMed]
  15. Liu, G.; Kim, W.K. The Functional Roles of Methionine and Arginine in Intestinal and Bone Health of Poultry: Review. Animals 2023, 13, 2949. [Google Scholar] [CrossRef]
  16. Lee, J.T.; Rochell, S.J.; Kriseldi, R.; Kim, W.K.; Mitchell, R.D. Functional properties of amino acids: Improve health status and sustainability. Poult. Sci. 2023, 102, 102288. [Google Scholar] [CrossRef] [PubMed]
  17. Teng, P.-Y.; Choi, J.; Yadav, S.; Tompkins, Y.H.; Kim, W.K. Effects of low-crude protein diets supplemented with arginine, glutamine, threonine, and methionine on regulating nutrient absorption, intestinal health, and growth performance of Eimeria-infected chickens. Poult. Sci. 2021, 100, 101427. [Google Scholar] [CrossRef] [PubMed]
  18. Lugata, J.K.; Ortega, A.D.S.V.; Szabó, C. The Role of Methionine Supplementation on Oxidative Stress and Antioxidant Status of Poultry-A Review. Agriculture 2022, 12, 1701. [Google Scholar] [CrossRef]
  19. Tompkins, Y.H.; Liu, G.; Kim, W.K. Impact of exogenous hydrogen peroxide on osteogenic differentiation of broiler chicken compact bones derived mesenchymal stem cells. Front. Physiol. 2023, 14, 1124355. [Google Scholar] [CrossRef] [PubMed]
  20. Tompkins, Y.; Teng, P.; Pazdro, R.; Kim, W. Long bone mineral loss, bone microstructural changes and oxidative stress after Eimeria challenge in broilers. Front. Physiol. 2022, 13, 945740. [Google Scholar] [CrossRef]
  21. Sinclair, L.V.; Howden, A.J.M.; Brenes, A.; Spinelli, L.; Hukelmann, J.L.; Macintyre, A.N.; Liu, X.; Thomson, S.; Taylor, P.M.; Rathmell, J.C.; et al. Antigen receptor control of methionine metabolism in T cells. eLife 2019, 8, e44210. [Google Scholar] [CrossRef]
  22. Elias, R.J.; McClements, D.J.; Decker, E.A. Antioxidant Activity of Cysteine, Tryptophan, and Methionine Residues in Continuous Phase β-Lactoglobulin in Oil-in-Water Emulsions. J. Agric. Food Chem. 2005, 53, 10248–10253. [Google Scholar] [CrossRef]
  23. Atmaca, G. Antioxidant effects of sulfur-containing amino acids. Yonsei Med. J. 2004, 45, 776–788. [Google Scholar] [CrossRef] [PubMed]
  24. Castro, F.L.S.; Kim, Y.; Xu, H.; Kim, W.K. The effect of total sulfur amino acid levels on growth performance and bone metabolism in pullets under heat stress. Poult. Sci. 2020, 99, 5783–5791. [Google Scholar] [CrossRef] [PubMed]
  25. Liu, S.Y.; Macelline, S.P.; Chrystal, P.V.; Selle, P.H. Progress towards reduced-crude protein diets for broiler chickens and sustainable chicken-meat production. J. Anim. Sci. Biotechnol. 2021, 12, 20. [Google Scholar] [CrossRef] [PubMed]
  26. Barekatain, R.; Chalvon-Demersay, T.; McLaughlan, C.; Lambert, W. Intestinal Barrier Function and Performance of Broiler Chickens Fed Additional Arginine, Combination of Arginine and Glutamine or an Amino Acid-Based Solution. Animals 2021, 11, 2416. [Google Scholar] [CrossRef]
  27. Attia, Y.A.; Al-Harthi, M.A.; Shafi, M.E.; Abdulsalam, N.M.; Nagadi, S.A.; Wang, J.; Kim, W.K. Amino Acids Supplementation Affects Sustainability of Productive and Meat Quality, Survivability and Nitrogen Pollution of Broiler Chickens during the Early Life. Life 2022, 12, 2100. [Google Scholar] [CrossRef]
  28. Attia, Y.A.; Bovera, F.; Wang, J.; Al-Harthi, M.A.; Kim, W.K. Multiple Amino Acid Supplementations to Low-Protein Diets: Effect on Performance, Carcass Yield, Meat Quality and Nitrogen Excretion of Finishing Broilers under Hot Climate Conditions. Animals 2020, 10, 973. [Google Scholar] [CrossRef]
  29. Lambert, W.; Berrocoso, J.D.; Swart, B.; van Tol, M.; Bruininx, E.; Willems, E. Reducing dietary crude protein in broiler diets positively affects litter quality without compromising growth performance whereas a reduction in dietary electrolyte balance further improves litter quality but worsens feed efficiency. Anim. Feed. Sci. Technol. 2023, 297, 115571. [Google Scholar] [CrossRef]
  30. Cobb-Vantress. Cobb500 Broiler Performance & Nutrition Supplement. 2018. Available online: https://www.cobb-vantress.com/assets/5a88f2e793/Broiler-Performance-Nutrition-Supplement.pdf (accessed on 23 February 2023).
  31. Cobb-Vantress. Cobb Broiler Management Guide. 2018. Available online: https://www.cobb-vantress.com/assets/Cobb-Files/045bdc8f45/Broiler-Guide-2021-min.pdf (accessed on 23 February 2023).
  32. Wang, J.; Patterson, R.; Kim, W. Effects of phytase and multicarbohydrase on growth performance, bone mineralization, and nutrient digestibility in broilers fed a nutritionally reduced diet. J. Appl. Poult. Res. 2021, 30, 100146. [Google Scholar] [CrossRef]
  33. Chen, C.; Kim, W. The application of micro-CT in egg-laying hen bone analysis: Introducing an automated bone separation algorithm. Poult. Sci. 2020, 99, 5175–5183. [Google Scholar] [CrossRef]
  34. Sharma, M.K.; Liu, G.; White, D.L.; Tompkins, Y.H.; Kim, W.K. Graded levels of Eimeria challenge altered the microstructural architecture and reduced the cortical bone growth of femur of Hy-Line W-36 pullets at early stage of growth (0–6 wk of age). Poult. Sci. 2023, 102, 102888. [Google Scholar] [CrossRef]
  35. Cooper, D.M.L.; Kawalilak, C.E.; Harrison, K.; Johnston, B.D.; Johnston, J.D. Cortical Bone Porosity: What Is It, Why Is It Important, and How Can We Detect It? Curr. Osteoporos. Rep. 2016, 14, 187–198. [Google Scholar] [CrossRef]
  36. Xiong, Y.; He, T.; Wang, Y.; Liu, W.V.; Hu, S.; Zhang, Y.; Wen, D.; Hou, B.; Li, Y.; Zhang, P.; et al. CKD Stages, Bone Metabolism Markers, and Cortical Porosity Index: Associations and Mediation Effects Analysis. Front. Endocrinol. 2021, 12, 775066. [Google Scholar] [CrossRef]
  37. Sanchez-Rodriguez, E.; Benavides-Reyes, C.; Torres, C.; Dominguez-Gasca, N.; Garcia-Ruiz, A.I.; Gonzalez-Lopez, S.; Rodriguez-Navarro, A.B. Changes with age (from 0 to 37 D) in tibiae bone mineralization, chemical composition and structural organization in broiler chickens. Poult. Sci. 2019, 98, 5215–5225. [Google Scholar] [CrossRef]
  38. Norman, T.L.; Little, T.M.; Yeni, Y.N. Age-related changes in porosity and mineralization and in-service damage accumulation. J. Biomech. 2008, 41, 2868–2873. [Google Scholar] [CrossRef]
  39. Ditscheid, B.; Fünfstück, R.; Busch, M.; Schubert, R.; Gerth, J.; Jahreis, G. Effect of L-methionine supplementation on plasma homocysteine and other free amino acids: A placebo-controlled double-blind cross-over study. Eur. J. Clin. Nutr. 2005, 59, 768–775. [Google Scholar] [CrossRef]
  40. Xie, M.; Hou, S.S.; Huang, W.; Fan, H.P. Effect of Excess Methionine and Methionine Hydroxy Analogue on Growth Performance and Plasma Homocysteine of Growing Pekin Ducks. Poult. Sci. 2007, 86, 1995–1999. [Google Scholar] [CrossRef]
  41. Yang, Z.; Yang, Y.; Yang, J.; Wan, X.; Yang, H.; Wang, Z. Hyperhomocysteinemia Induced by Methionine Excess Is Effectively Suppressed by Betaine in Geese. Animals 2020, 10, 1642. [Google Scholar] [CrossRef]
  42. Herrmann, M.; Wildemann, B.; Claes, L.; Klohs, S.; Ohnmacht, M.; Taban-Shomal, O.; Hübner, U.; Pexa, A.; Umanskaya, N.; Herrmann, W. Experimental Hyperhomocysteinemia Reduces Bone Quality in Rats. Clin. Chem. 2007, 53, 1455–1461. [Google Scholar] [CrossRef]
  43. Herrmann, M.; Widmann, T.; Herrmann, W. Homocysteine—A newly recognised risk factor for osteoporosis. Clin. Chem. Lab. Med. (CCLM) 2005, 43, 1111–1117. [Google Scholar] [CrossRef]
  44. Behera, J.; Bala, J.; Nuru, M.; Tyagi, S.C.; Tyagi, N. Homocysteine as a Pathological Biomarker for Bone Disease. J. Cell Physiol. 2017, 232, 2704–2709. [Google Scholar] [CrossRef]
  45. Fratoni, V.; Brandi, M.L. B vitamins, homocysteine and bone health. Nutrients 2015, 7, 2176–2192. [Google Scholar] [CrossRef]
  46. Devignes, C.-S.; Carmeliet, G.; Stegen, S. Amino acid metabolism in skeletal cells. Bone Rep. 2022, 17, 101620. [Google Scholar] [CrossRef]
  47. Lorenzo, J.; Horowitz, M.; Choi, Y. Osteoimmunology: Interactions of the bone and immune system. Endocr. Rev. 2008, 29, 403–440. [Google Scholar] [CrossRef]
  48. Prisby, R.D. Mechanical, hormonal and metabolic influences on blood vessels, blood flow and bone. J. Endocrinol. 2017, 235, R77–R100. [Google Scholar] [CrossRef]
  49. Mori, G.; D’Amelio, P.; Faccio, R.; Brunetti, G. The Interplay between the bone and the immune system. Clin. Dev. Immunol. 2013, 2013, 720504. [Google Scholar] [CrossRef]
  50. Fang, C.C.; Feng, L.; Jiang, W.D.; Wu, P.; Liu, Y.; Kuang, S.Y.; Tang, L.; Liu, X.A.; Zhou, X.Q. Effects of dietary methionine on growth performance, muscle nutritive deposition, muscle fibre growth and type I collagen synthesis of on-growing grass carp (Ctenopharyngodon idella). Br. J. Nutr. 2021, 126, 321–336. [Google Scholar] [CrossRef]
  51. Barzel, U.S.; Massey, L.K. Excess dietary protein can adversely affect bone. J. Nutr. 1998, 128, 1051–1053. [Google Scholar] [CrossRef]
  52. Heaney, R.P.; Layman, D.K. Amount and type of protein influences bone health. Am. J. Clin. Nutr. 2008, 87, 1567S–1570S. [Google Scholar] [CrossRef]
  53. Cao, J.J. High Dietary Protein Intake and Protein-Related Acid Load on Bone Health. Curr. Osteoporos. Rep. 2017, 15, 571–576. [Google Scholar] [CrossRef]
  54. Maurer, M.; Riesen, W.; Muser, J.; Hulter, H.N.; Krapf, R. Neutralization of Western diet inhibits bone resorption independently of K intake and reduces cortisol secretion in humans. Am. J. Physiol. -Renal. Physiol. 2003, 284, F32–F40. [Google Scholar] [CrossRef]
  55. Krieger, N.S.; Frick, K.K.; Bushinsky, D.A. Mechanism of acid-induced bone resorption. Curr. Opin. Nephrol. Hypertens. 2004, 13, 423–436. [Google Scholar] [CrossRef]
  56. Sukumar, D.; Ambia-Sobhan, H.; Zurfluh, R.; Schlussel, Y.; Stahl, T.J.; Gordon, C.L.; Shapses, S.A. Areal and volumetric bone mineral density and geometry at two levels of protein intake during caloric restriction: A randomized, controlled trial. J. Bone Miner. Res. 2011, 26, 1339–1348. [Google Scholar] [CrossRef]
  57. Cao, J.J.; Pasiakos, S.M.; Margolis, L.M.; Sauter, E.R.; Whigham, L.D.; McClung, J.P.; Young, A.J.; Combs, G.F., Jr. Calcium homeostasis and bone metabolic responses to high-protein diets during energy deficit in healthy young adults: A randomized controlled trial. Am. J. Clin. Nutr. 2014, 99, 400–407. [Google Scholar] [CrossRef]
Figure 1. The region of interest selection for the analysis. The same ROI was selected for all the samples. For the metaphysis, 300 slides (7.5 mm) were selected and for the diaphysis, 300 slides (7.5 mm) were selected.
Animals 14 00917 g001
Figure 2. Body composition analyzed by dual-energy X-ray absorptiometry. The error bars represent the SEM values. The black lines with arrowhead represented significant linear or quadratic relationship between parameters and dietary methionine levels. Statistical significance was set at p ≤ 0.05. Met, methionine; Met 2.8, dietary Met level = 2.8 g/kg; Met 4.4, dietary Met level = 4.4 g/kg; Met 6.0, dietary Met level = 6.0 g/kg; Met 7.6, dietary Met level = 7.6 g/kg; Met 9.0, dietary Met level = 9.0 g/kg. (A), p-value: p-linear = 0.049. (B), p-value: p-linear = 0.045.
Animals 14 00917 g002
Figure 3. Femoral metaphysis cortical bone characteristics analyzed by microtomography. The error bars represent the SEM values. The black lines with arrowhead represented significant linear or quadratic relationship between parameters and dietary methionine levels. Statistical significance was set at p ≤ 0.05. DPI, day post inoculation; BMD, bone mineral density; NP, number of closed pores; VP, volume of closed pores; PP, closed pore percentage; Met, methionine; Met 2.8, dietary Met level = 2.8 g/kg; Met 4.4, dietary Met level = 4.4 g/kg; Met 6.0, dietary Met level = 6.0 g/kg; Met 7.6, dietary Met level = 7.6 g/kg; Met 9.0, dietary Met level = 9.0 g/kg. (A), p-value: p-linear = 0.020. (B), p-value: p-linear = 0.029. (C), p-value: p-linear = 0.037. (D), p-value: p-linear = 0.023.
Animals 14 00917 g003
Figure 4. Femoral metaphysis trabecular bone characteristics analyzed by microtomography. The error bars represent the SEM values. Bars without a common letter differ significantly. The black lines with arrowhead represented significant linear or quadratic relationship between parameters and dietary methionine levels. Statistical significance was set at p ≤ 0.05. DPI, days post-inoculation; TBT, trabecular thickness; BMC, bone mineral content; BV, bone volume; TV, tissue volume; CD, connectivity density; TBN, trabecular number. Met, methionine; NCP, normal protein diet; LCP, reduced-protein diet; Met 2.8, dietary Met level = 2.8 g/kg; Met 4.4, dietary Met level = 4.4 g/kg; Met 6.0, dietary Met level = 6.0 g/kg; Met 7.6, dietary Met level = 7.6 g/kg; Met 9.0, dietary Met level = 9.0 g/kg. (A) p-value: p-quadratic at NCP = 0.030, p-quadratic at LCP = 0.399. (B) p-value: p-linear at NCP = 0.493, p-linear at LCP = 0.050. (C) p-value: p-linear at NCP = 0.800, p-linear at LCP = 0.009. (D) p-value: p-linear at NCP = 0.670, p-linear at LCP = 0.003. (E) p-value: p-linear at NCP = 0.805, p-linear at LCP = 0.041. (F) p-value: p-linear at NCP = 0.651, p-linear at LCP = 0.004. (G) p-value: p-linear at NCP = 0.852, p-linear at LCP = 0.011.
Animals 14 00917 g004
Figure 5. Femoral diaphysis cortical bone characteristics analyzed by microtomography. The error bars represent the SEM values. The black lines with arrowhead represented significant linear or quadratic relationship between parameters and dietary methionine levels. Statistical significance was set at p ≤ 0.05. DPI, day post inoculation; BMD, bone mineral density; BMC, bone mineral content; TV, tissue volume; BV, bone volume; Met, methionine; NCP, normal protein diet; LCP, reduced protein diet; Met 2.8, dietary Met level = 2.8 g/kg; Met 4.4, dietary Met level = 4.4 g/kg; Met 6.0, dietary Met level = 6.0 g/kg; Met 7.6, dietary Met level = 7.6 g/kg; Met 9.0, dietary Met level = 9.0 g/kg. (A) p-value: p-protein = 0.048. (B) p-value: p-protein = 0.026. (C) p-value: p-linear at NCP = 0.801, p-linear at LCP = 0.033. (D) p-value: p-linear at NCP = 0.856, p-linear at LCP = 0.023. (E) p-value: p-linear at NCP = 0.039, p-linear at LCP = 0.906.
Animals 14 00917 g005
Table 1. Ingredient formulation and nutrient and energy composition (g/kg) of experimental diets.
NCP 1LCP
IngredientMet 2.8Met 4.4Met 6.0Met 7.6Met 9.2Met 2.8Met 4.4Met 6.0Met 7.6Met 9.2
Corn692692692692692730730730730730
Soybean Meal 248248248248248221221221221221
Soybean Oil3.003.003.003.003.001.101.101.101.101.10
Common Salt3.503.503.503.503.503.503.503.503.503.50
Limestone11.811.811.811.811.811.911.911.911.911.9
Dicalcium Phosphate7.907.907.907.907.908.008.008.008.008.00
Vitamin Premix 21.001.001.001.001.001.001.001.001.001.00
Mineral Premix 30.800.800.800.800.800.800.800.800.800.80
DL-Methionine0.001.603.204.806.400.101.703.304.906.50
L-Lysine HCl4.104.104.104.104.102.702.702.702.702.70
L-Glutamate8.008.008.008.008.00
Threonine1.301.301.301.301.300.600.600.600.600.60
Arginine1.101.101.101.101.100.100.100.100.100.10
L-Cystine 0.100.100.100.100.10
Isoleucine0.200.200.200.200.20
Glycine10.09.208.407.606.805.004.303.502.601.80
Sand7.606.806.005.204.6014.513.612.8012.1011.30
Total1000100010001000100010001000100010001000
Calculated Nutrients (g/kg) and Energy
Protein200200200200200170170170170170
ME, kcal/kg3030303030303030303030303030303030303030
Ca7.007.007.007.007.007.007.007.007.007.00
Available P2.902.902.902.902.902.902.902.902.902.90
Lysine11.211.211.211.211.29.509.509.509.509.50
Methionine2.804.406.007.609.202.804.406.007.609.20
TSAA5.306.908.5010.111.75.306.908.5010.111.7
Threonine7.307.307.307.307.306.206.206.206.206.20
Arginine11.811.811.811.811.810.010.010.010.010.0
Analyzed Amino Acids, g/kg
Protein195199211211204177182176181176
Lysine13.112.512.713.013.210.511.411.411.611.3
Methionine2.904.505.907.808.902.904.506.307.208.80
TSAA5.907.409.1010.911.55.807.609.2010.311.8
Threonine7.607.607.707.607.706.507.107.007.107.00
Arginine12.111.711.612.412.510.111.311.011.510.6
Glutamate39.237.337.339.339.230.232.732.233.331.5
Amino Acids to Lysine Ratios
Lysine100100100100100100100100100100
Methionine22.234.146.559.867.427.139.554.862.177.9
TSAA45.256.371.783.890.554.866.780.788.8104
Threonine57.960.460.658.358.061.462.360.961.261.5
Arginine92.789.391.395.794.796.299.196.598.793.8
Glutamate300286294303297288287282287278
1 NCP, normal protein diet with 20% crude protein content; LCP, reduced-protein diet with 17% crude protein content; Met 2.80, diet containing 2.80 g/kg of methionine; Met 4.40, diet containing 4.40 g/kg of methionine; Met 6.00, diet containing 6.00 g/kg of methionine; Met 7.60, diet containing 7.60 g/kg of methionine; Met 9.20, diet containing 9.20 g/kg of methionine. 2 Vitamin premix: Supplemented per kg of diet: thiamin mononitrate, 2.4 mg; nicotinic acid, 44 mg; riboflavin, 4.4 mg; D-Ca pantothenate, 12 mg; vitamin B12 (cobalamin), 12.0 g; pyridoxine HCl, 4.7 mg; D-biotin, 0.11 mg; folic acid, 5.5 mg; menadione sodium bisulfite complex, 3.34 mg; choline chloride, 220 mg; cholecalciferol, 27.5 g; transretinyl acetate, 1892 g; α tocopheryl acetate, 11 mg; ethoxyquin, 125 mg. 3 Mineral premix: Supplemented as per kg of diet: manganese (MnSO4·H2O), 60 mg; iron (FeSO4·7H2O), 30 mg; zinc (ZnO), 50 mg; copper (CuSO4·5H2O), 5 mg; iodine (ethylene diaminedihydroiodide), 0.15 mg; selenium (NaSeO3), 0.3 mg.
Table 2. Definition and description of microtomography measured parameters.
Parameters (Abbreviation)DescriptionStandard Unit
Bone mineral density (BMD)Measure the bone mineral content per unit of volumeg/cm3
Bone mineral content (BMC)Measure the bone mineral content of the tissue. The value is calculated by BMD × TVg
Tissue volume (TV)The volume of the entire region of interest, including pores and cavity inside the bonemm3
Bone volume (BV)Volume of the bone segmentsmm3
Bone volume fraction (BV/TV)Ratio of the bone volume to the tissue volume%
Number of closed pores (NP)Number of closed pores within the bone segments
Volume of closed pores (VP)Total volume of the closed poresmm3
Closed pore percentage (PP)The volume of closed pores as a percentage of the bone volume%
Trabecular number (TBN)The average number of trabeculae per unit length1/mm
Trabecular thickness (TBT)Mean thickness of trabeculae, measured using 3D methodsmm
Trabecular separation (TBS)Mean distance between trabeculae, measured using 3D methodsmm
Connectivity density (CD)A measure of the degree of connectivity of trabeculae normalized by tissue volume1/mm3
Disclaimer/Publisher’s Note: The statements, opinions and data contained in all publications are solely those of the individual author(s) and contributor(s) and not of MDPI and/or the editor(s). MDPI and/or the editor(s) disclaim responsibility for any injury to people or property resulting from any ideas, methods, instructions or products referred to in the content.

