Article

Expression and Variations in EPO Associated with Oxygen Metabolism in Tibetan Sheep

1
Institute of Livestock Research, Tibet Academy of Agricultural and Animal Husbandry Sciences, Lhasa 850000, China
2
Key Laboratory of Animal Genetics and Breeding on Tibetan Plateau, Ministry of Agriculture and Rural Affairs, Lhasa 850000, China
3
College of Animal Science and Technology, Gansu Agricultural University, Lanzhou 730070, China
*
Authors to whom correspondence should be addressed.
Animals 2024, 14(4), 535; https://doi.org/10.3390/ani14040535
Submission received: 20 December 2023 / Revised: 2 February 2024 / Accepted: 2 February 2024 / Published: 6 February 2024

Abstract

:

Simple Summary

The hypoxa-related gene EPO is a key factor in erythropoiesis. In high-altitude indigenous species, the expression of and variations in the EPO gene are closely related to changes of altitude (oxygen concentration). In this study, the mRNA expression levels of gene EPO in different tissues and organs of Hu sheep (100 m) and Tibetan sheep at different altitudes (2500 m, 3500 m, 4500 m) were detected by RT-qPCR, and Kompetitive Allele-Specific PCR (KASP) was used to study the effects of EPO variation on plateau hypoxia adaptation in Tibetan sheep. The results suggest that variations in the EPO gene were correlated with some blood gas indexes of Tibetan sheep, and the expression of the EPO gene was related to changes in altitude.

Abstract

After a long period of adaptive evolution, Tibetan sheep have adapted to the plateau environment in terms of genetics, physiology and biochemistry, but the mechanism of hypoxia adaptation has not been fully elucidated, and the functional genes and molecular mechanisms regulating the hypoxia adaptation of Tibetan sheep need to be further studied. In this study, Tibetan sheep were selected as the research object, and the mRNA expression levels of the hypoxa-related gene EPO in heart, lung, kidney, liver, spleen and longissimus dorsi muscle of Hu sheep (100 m) and Tibetan sheep at different altitudes (2500 m, 3500 m, 4500 m) were assessed by RT-qPCR. The SNPs loci were detected by sequencing and Kompetitive Allele-Specific PCR (KASP) technology, then the correlation between genetic polymorphism and blood gas was analyzed. The results show that the expression of the EPO gene was the highest in the kidney, indicating that the expression of EPO gene had tissue differences. The expression levels of the EPO gene in the heart, lung and liver of Tibetan sheep at a 4500 m altitude were significantly higher than those in Hu sheep (p < 0.05), and the levels in the hearts of Tibetan sheep increased with the increase in altitude. Three mutations were identified in the EPO gene, the SNPs (g.855 A > C) in exon 1 and the SNPs (g.1985 T > G and g.2115 G > C) in exon 4, which were named EPO-SNP1, EPO-SNP2 and EPO-SNP3, respectively, and all three SNPs showed three genotypes. Correlation analysis showed that g.2115 G > C sites were significantly correlated with pO2 (p < 0.05), and haplotype combinations were significantly correlated with pO2 (p < 0.05). Thesee results suggest that the expression of the EPO gene is altitude-differentiated and organ-differentiated, and the EPO gene variants have significant effects on pO2, which may be beneficial to the adaptation of Tibetan sheep to hypoxia stress.

1. Introduction

Oxygen molecules are the material basis of life activity. Therefore, the perception of oxygen concentration by the organism is one of the basic functions of life activity. Hypoxia, a condition characterized by low oxygen levels, poses significant challenges to living organisms. To survive in such conditions, organisms have evolved various adaptive mechanisms. One critical protein involved in the adaptation to hypoxia is erythropoietin (EPO). The EPO gene is a key factor in erythropoiesis, also known as erythropoietic stimulating factor, located on chromosome 7, and it encodes the glycoprotein hormone erythropoietin [1]. EPO has pleiotropic actions. In addition to its role in erythropoiesis, EPO also exerts anti-apoptotic effects on mature RBCs and protects them from hypoxic death [2,3,4]. EPO acts as a key regulator in response to hypoxia-inducible factor-1 (HIF-1), a transcription factor that becomes activated under low oxygen conditions [5]. HIF-1 binds to specific hypoxia-responsive elements within the EPO gene promoter, leading to the increased production of EPO. Upon secretion into circulation, EPO binds to its receptor (EPOR) on hematopoietic progenitor cells, promoting their differentiation into erythrocytes (red blood cells) [6,7].
Tibetan sheep are an important livestock species adapted to living at high altitudes, and thus require efficient hypoxia adaptation mechanisms. Studies have shown that animals adapted to living at high altitudes, such as Tibetan sheep [8] and yak [9], exhibit alterations in EPO expression and signaling as part of their low-oxygen-adaptation strategies. The EPO gene is expressed in the kidneys and liver of mammals, with the primary site of expression being the kidneys [10]. EPO expression is induced under hypoxic conditions through the activation of HIF transcription factors. In teleosts, the expression of EPO promotes hypoxic adaptation [11]. Studies in animal models of hypoxia adaptation have identified genetic variants of the EPO gene that are associated with alterations in erythropoietic response and low oxygen tolerance. These include single-nucleotide polymorphisms (SNPs) in the promoter region of the EPO gene that regulate its expression under hypoxic conditions [12,13]. Adjusting blood gas is also an important aspect of mammalian adaptation to the hypoxic environment of the plateau, including the partial pressure of carbon dioxide (pCO2), partial pressure of oxygen (pO2) and oxygen saturation (sO2) [14]. Therefore, the aim of this research is to investigate the role of EPO gene expression and variations in Tibetan sheep hypoxia adaptation.

2. Materials and Methods

The animals involved in the tests were approved by the Animal Protection Committee of Gansu Agricultural University (Date of approval: 17 June 2020; Approval No. GAU-LC-2020-056). The test animals were used in accordance with the Guidelines for the Protection and use of Animals developed by the Ministry of Science and Technology of the People’s Republic of China (Date of issue: 22 April 2006; Approval No. 2006-398.).

2.1. Study Objects and Sample Collection

In total, 351 Tibetan sheep were subjected to genotyping in exon1 and exon 4 of EPO, of which 176 (134 females and 42 males) were used for blood gas analysis. All Tibetan sheep were in good health and around 3.5 years old. These Tibetan sheep live in a herder’s flock at an altitude of more than 2800 m in Maqu County, Gansu Province, China. A 5 mL sodium heparin collection tube was used to collect blood from the jugular vein of each sheep; a small amount of each blood sample was taken for some of the blood gas index analyses, and the rest of the blood samples were collected and preserved with TFN paper (Munktell Filter AB, Falun, Sweden) for the two-step process of extracting DNA [15].
For EPO gene expression analysis, nine Tibetan sheep were randomly selected, among which three were distributed in Zhuoni County, Gansu Province, China (2500 m), three were distributed in Haiyan County, Qinghai Province, China (3500 m), three were distributed in Zhiduo County, Qinghai Province, China (4500 m), and three Hu sheep were obtained from Kangrui Breeding Sheep Co., Ltd. in Baiyin City, Gansu Province, China (1800 m). All sheep were in good health and around 3.5 years old (ewes). Because rams of the same age in the experimental sample were breeding rams, only ewes were selected for slaughter. Sodium pentobarbital (350 mg) was injected intravenously into each experimental sheep, and dissection was performed after the heart stopped beating and continuous involuntary respiration had ceased for about 3 min. Then, the heart, liver, spleen, lungs, kidneys and longissimus dorsi muscle were collected for RT-qPCR. The collected tissue samples were immediately placed in liquid nitrogen and transferred to the laboratory, and then stored at −80 °C to extract the total RNA.

2.2. Blood Gas Indicator Measurement

Blood gas physiological indices such as partial pressure of oxygen (pO2), partial pressure of carbon dioxide (pCO2), pH, and oxygen saturation (sO2) were directly measured using an i-STAT blood gas analyzer (Abbott, Chicago, IL, USA). In addition, the partial pressure of oxygen at which hemoglobin is 50% saturated with oxygen (p50) was calculated using pO2, sO2, and pH [16]. The following equations were used.
p 50   std = a n t i   log log 1 k n ;   w h e r e   1 k = a n t i log ( n log p O 2 7.4 ) · 100 sO 2 sO 2
A Hill constant “n” for hemoglobin A of 2.7 was used. The (pO2 in venous blood at 37 °C was converted to pO2 at pH = 7.4 using the following equation:
log p O 2 7.4 = log p O 2 0.5   7.40 pH
To ensure the validity of parametric tests, the normality assumptions of these data were examined using Kolmogorov–Smirnov tests by SPSS.

2.3. Primers for PCR and RT-qPCR

According to the gene sequence of sheep EPO (entry number: NM_001024737.1) published by GenBank, primers were designed for exon 1 and exon 4 of the EPO gene. The primers were designed using the Premier 5.0 software (Table 1). All primers were synthesized by Wuhan Okodingsheng Biotechnology Co., Ltd. (Wuhan, China). β-actin (accession number: NM_001009784) was used as the reference gene.
RT-qPCR was performed by the relative quantitative SYBR Green 1 dye method. The reaction system was 20 μL in total: 7.2 μL RNase-Free water, 10 μL 2 × Premix, 0.8 μL (10 ng/μL) upstream and downstream primers, and 2 μL cDNA (100 ng/μL). Reaction conditions: predenaturation at 95 °C for 5 min, denaturation at 94 °C for 15 s, annealing for 30 s (refer to Table 1 for annealing temperature), 40 cycles, and then dissolution curve analysis. 2−ΔΔCt [17] was used to analyze the relative expression levels of the EPO gene. Three biological replicates and four technical replicates were performed to ensure that the findings were genuine and trustworthy.

2.4. Genotyping

Firstly, the blood DNA from 20 Tibetan sheep was used and sequenced after the amplification of exon 1 and 4 fragments. Primer synthesis, fragment amplification and sequencing were performed at Shanghai Sangon Biotech Co., Ltd. (Shanghai, China). After the discovery of SNPs by sequencing, each SNP was genotyped by KASP technology applied to the 351 Tibetan sheep samples, and then the genotyping map was generated using LGC-OMEGA 5.0 software, which was done at Wuhan Gentides Biotech Co., Ltd. (Wuhan, China).

2.5. Statistical Analyses

The original experimental data in this study were sorted and statistically analyzed using Excel 2010 software, and significance analysis was performed using SPSS 26.0 software. All bar charts were produced using the Prism 9.0 software. One-way analysis of variance (ANOVA) was used to compare the mean values among different genotypes. The least significant difference (LSD) post hoc test was performed for multiple comparison. The data were expressed as mean ± standard error, and p < 0.05 was considered statistically significant.
After successful EPO genotyping using the KASP assay, allele frequency, genotype frequency, genetic homozygosity (Ho), genetic heterozygosity (He), effective allele number (Ne) and polymorphism information content (PIC) were calculated using the formulas described by Botstein et al. [18]. A Chi-square test was performed to detect the Hardy–Weinberg equilibrium; p > 0.05 indicated that the population met the Hardy–Weinberg equilibrium, otherwise it did not meet the Hardy–Weinberg equilibrium. The SNPs linkage disequilibrium and haplotype of EPO gene were analyzed using Haploview4.1 and PHASE 2.0 software.

3. Results

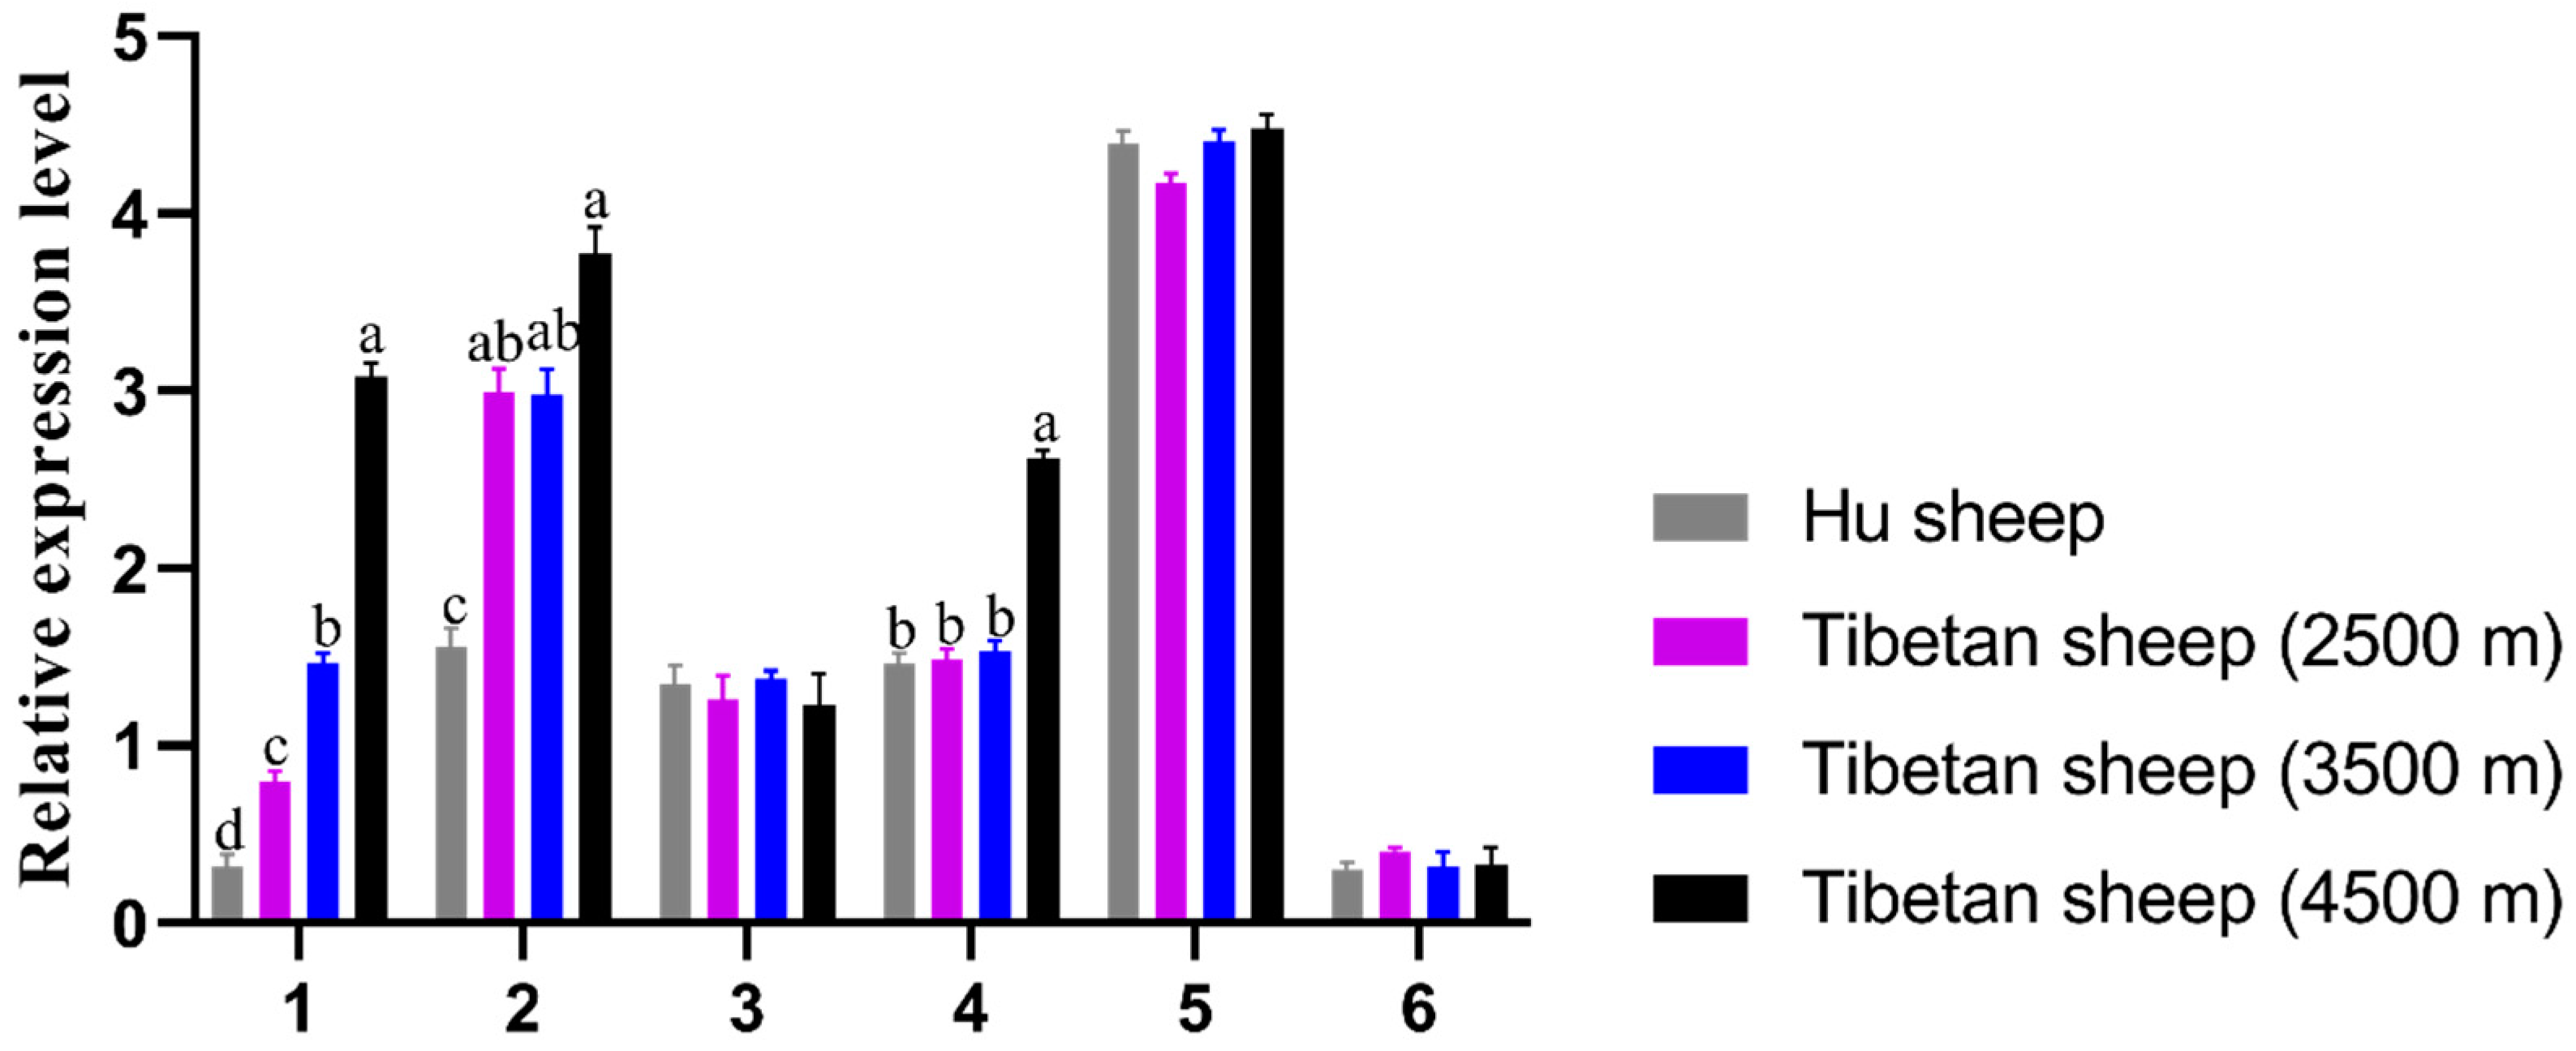
3.1. Tissue Expression Characteristics of EPO Gene

The mRNA expressions of the EPO gene in different tissues of Tibetan sheep and Hu sheep are shown (Figure 1). The EPO gene was expressed in six tissues of Hu sheep and Tibetan sheep at different altitudes to varying degrees, and the expression of the EPO gene was the highest in the kidneys of the two breeds of sheep, while the expression was the lowest in the muscle of the two breeds of sheep, indicating that the expression of this gene had tissue differences. In the heart and lung, the expression of this gene in Tibetan sheep at 4500 m altitude was significantly higher than that in Tibetan sheep at other altitudes and Hu sheep (p < 0.05), and the expression of this gene tended to increase with the decrease in oxygen concentration caused by the increase in altitude. In the liver, the expression of this gene was significantly higher in Tibetan sheep at all three altitudes than in Hu sheep (p < 0.05).

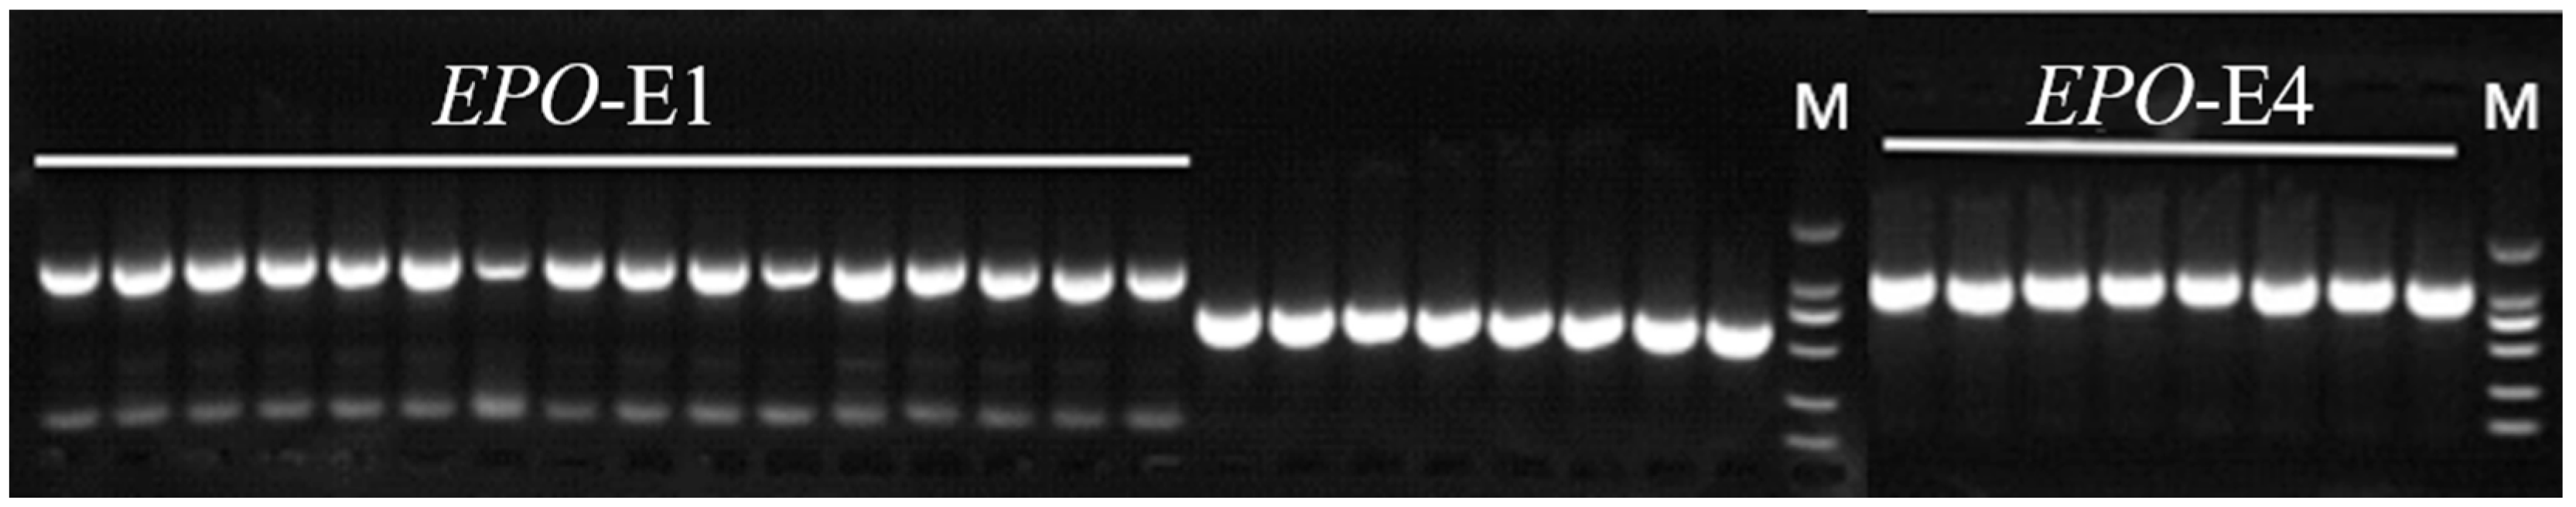
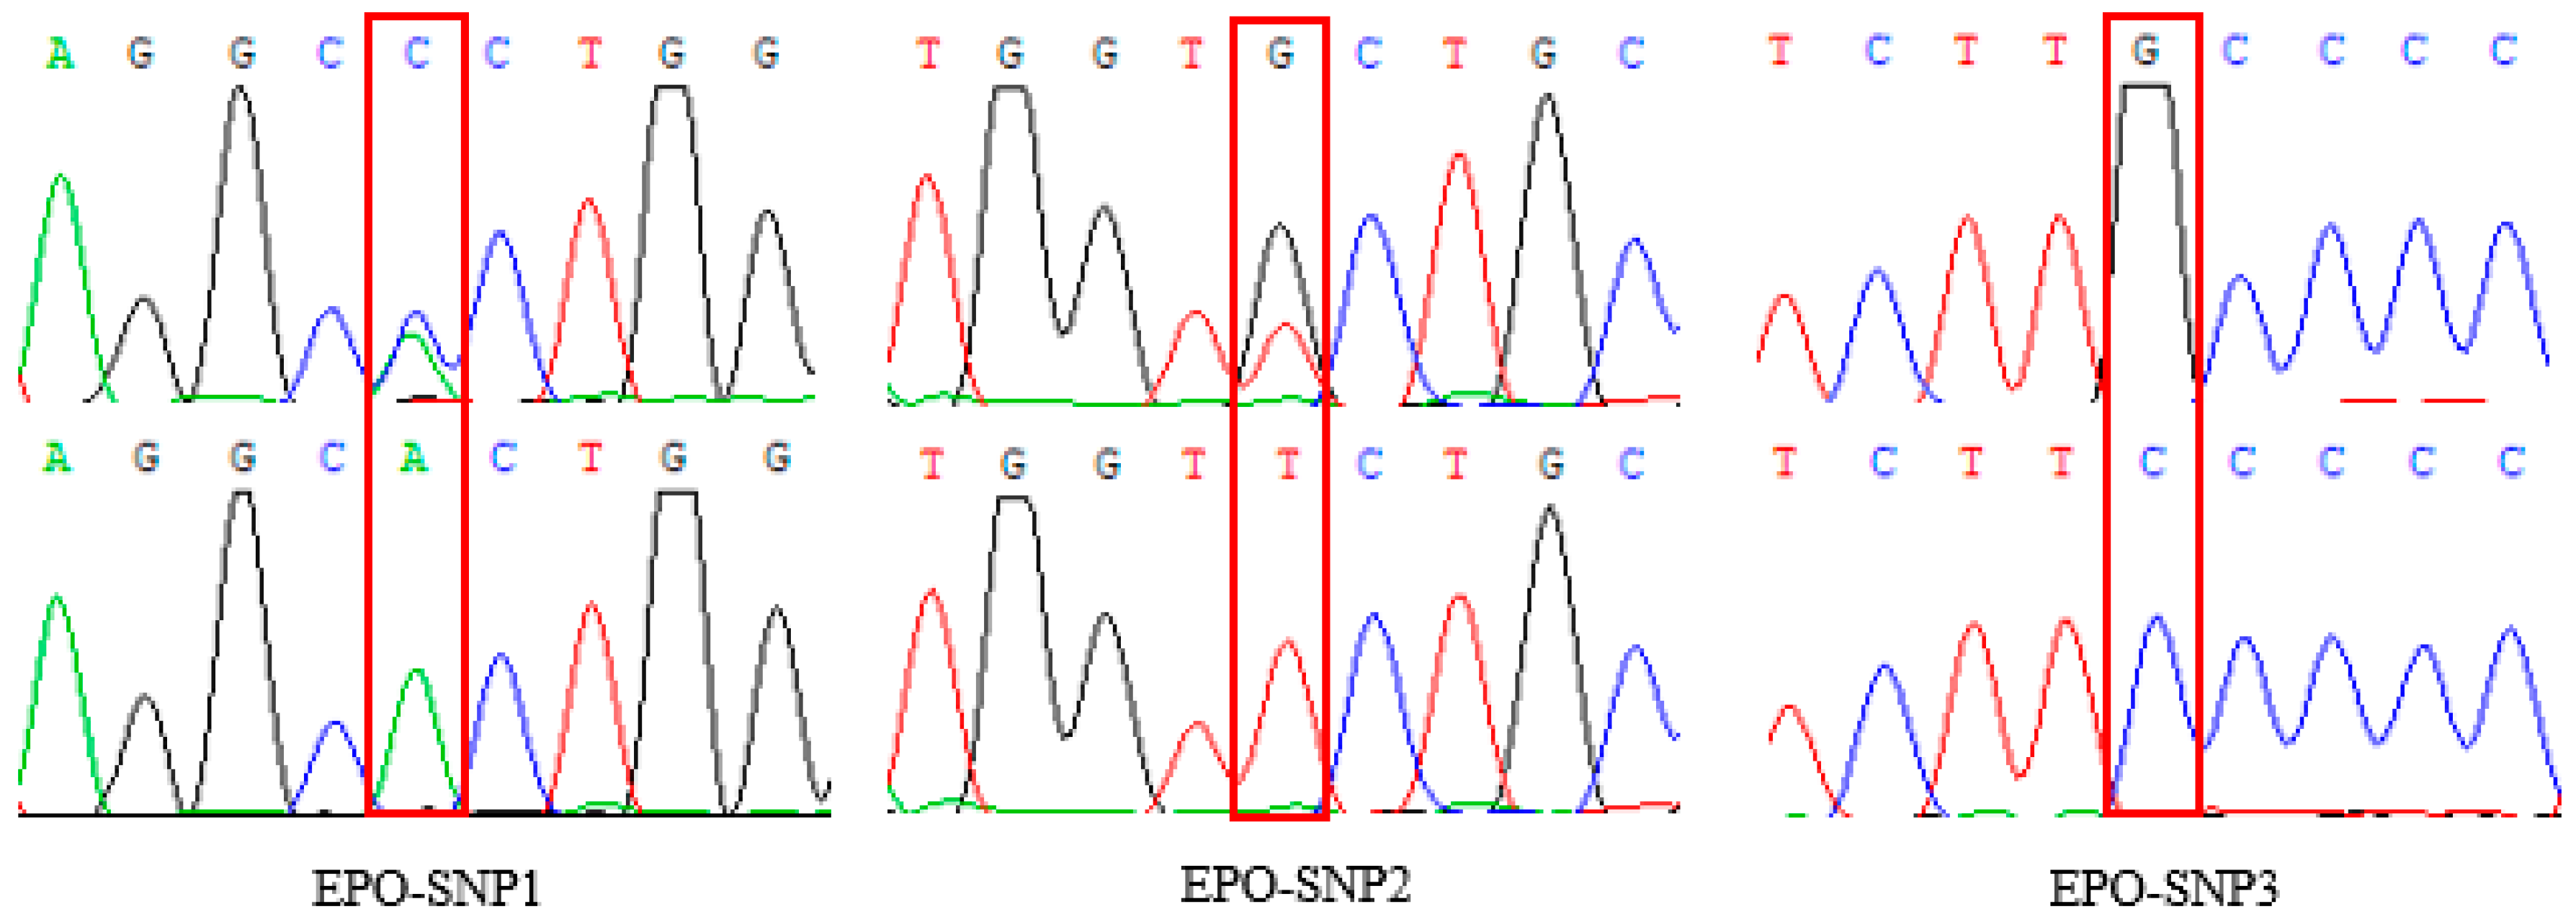
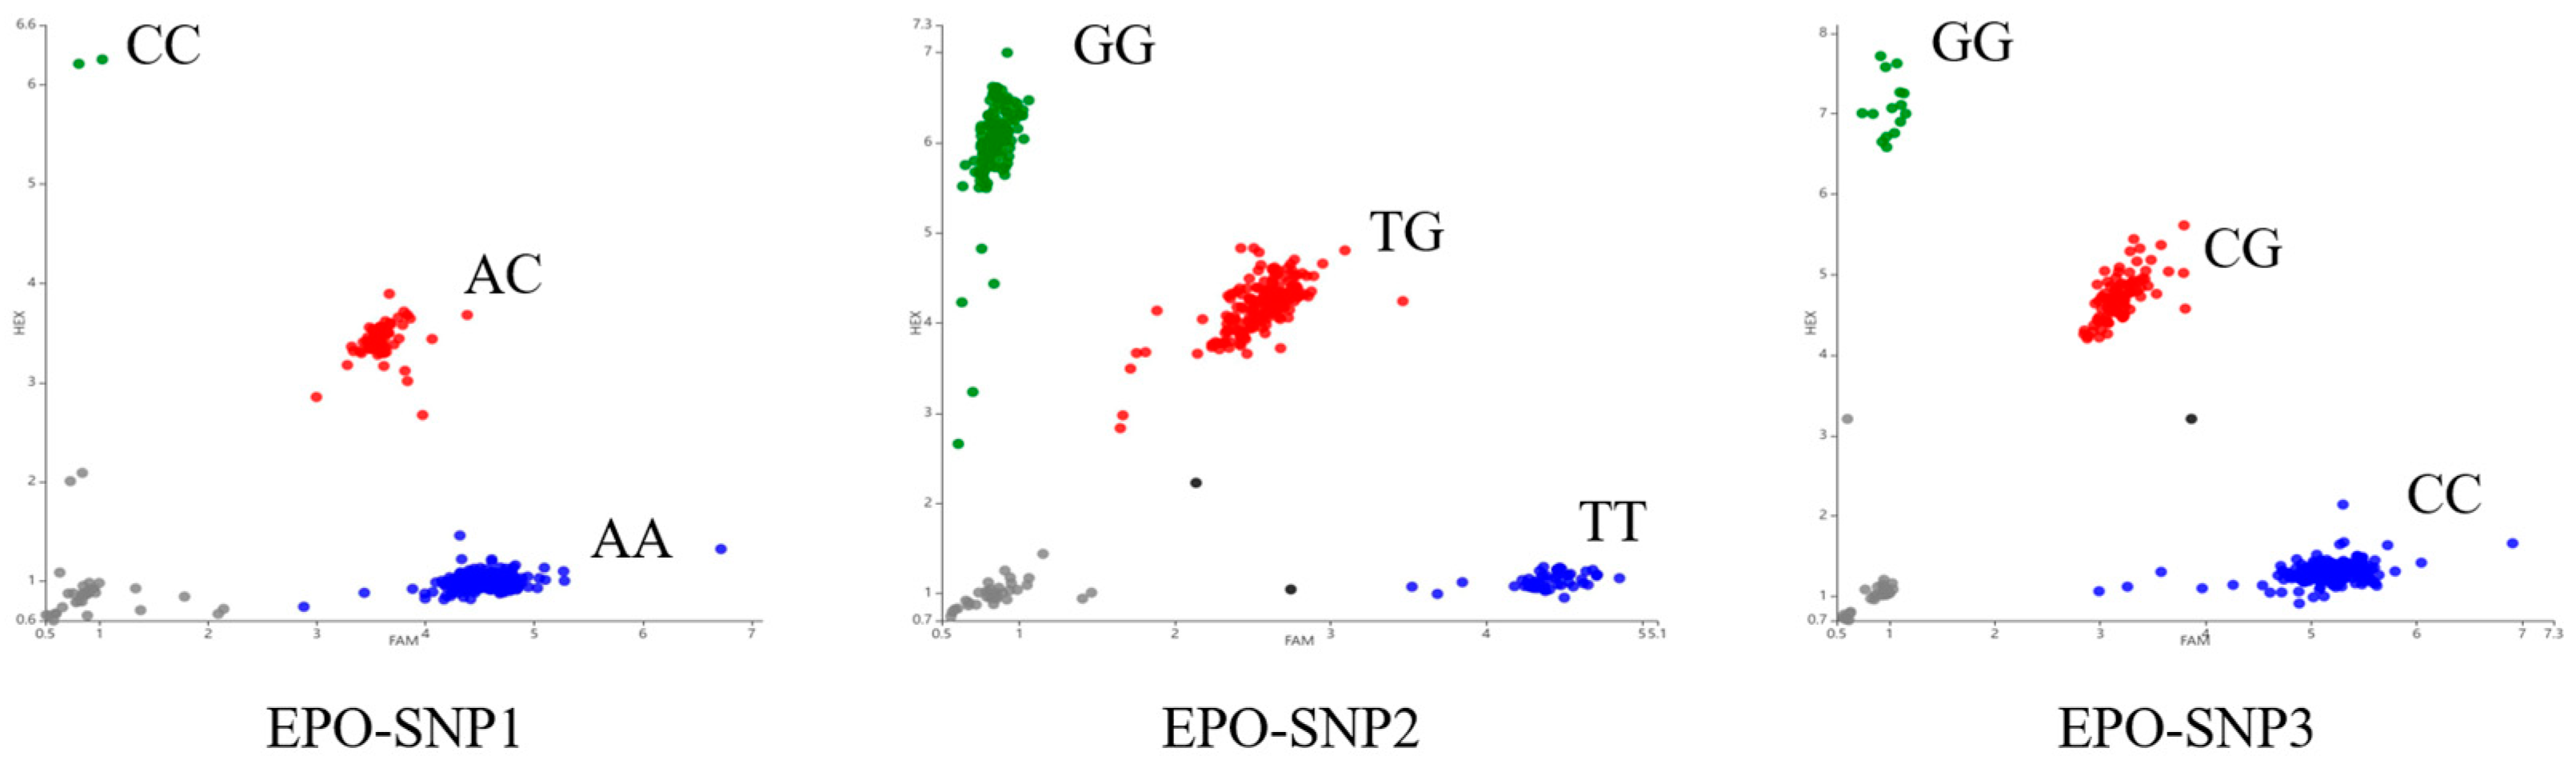
3.2. Variation of EPO in Tibetan Sheep

The amplification products of the EPO gene were detected by 1.5% agarose gel electrophoresis. The bands of the amplification products were complete, clear, and non-specific; their sizes were in line with the expected results, and the amplification products could be directly used for subsequent PCR product sequencing (Figure 2). The EPO gene sequences of 20 randomly selected Tibetan sheep were sequenced. After sequence comparison, one SNP locus, g.855 A > C, was detected in exon 1 of EPO gene, and two SNPs loci, g.1985 T > G and g.2115 G > C, were detected in exon 4 of the EPO gene. Among them, g.2115 G > C is a missense mutation, where glycine changes to alanine, and the other two sites are synonymous mutations. The three loci were named g.855 A > C, g.1985 T > G and g.2115 G > C, respectively (Figure 3). The three SNPs were genotyped by the KASP assay, and all three genotypes were present in Tibetan sheep: AA, CC, AC (g.855 A > C)/GG, TT, GT (g.1985 T > G)/CC, GG, CG (g.2115 G > C), respectively (Figure 4).

3.3. Population Genetic Diversity Analysis of EPO Gene

The AA genotype frequency of g.855 A > C was the highest (0.8195), and the A allele was the most frequent allele. The frequency of GT genotype at the g.1985 T > G locus was the highest (0.5029), and the G allele was the most frequent allele. The frequency of CC genotype at g.2115 G > C was the highest (0.6905), and the C allele was the most frequent allele (Table 2). The three SNPs of EPO gene were consistent with Hardy–Weinberg equilibrium in the Tibetan sheep population (p > 0.05), while the homozygosity (Ho) was high and the heterozygosity (He) was low. The number of effective alleles of g.1985 T > G (1.9077) was the highest, and g.855 A > C (1.2031) was the lowest. g.855 A > C and g.2115 G > C were in low polymorphism (PIC < 0.25) and g.1985 T > G was in moderate polymorphism (0.25 < PIC < 0.5) (Table 3).

3.4. Effect of Variation in EPO on Blood Gas

The g.2115 G > C site was significantly correlated with pO2 (p < 0.05), and the pO2 of TT-type individuals was significantly higher than that of GG- and GT-type individuals (p < 0.05), but there was no significant difference between GG- and GT-type individuals (p > 0.05). (Table 4) The results indicate that the data for these four traits all follow a normal distribution, with p values for pO2, pCO2, sO2 and p50 of 0.098, 0.067, 0.052 and 0.203, respectively.

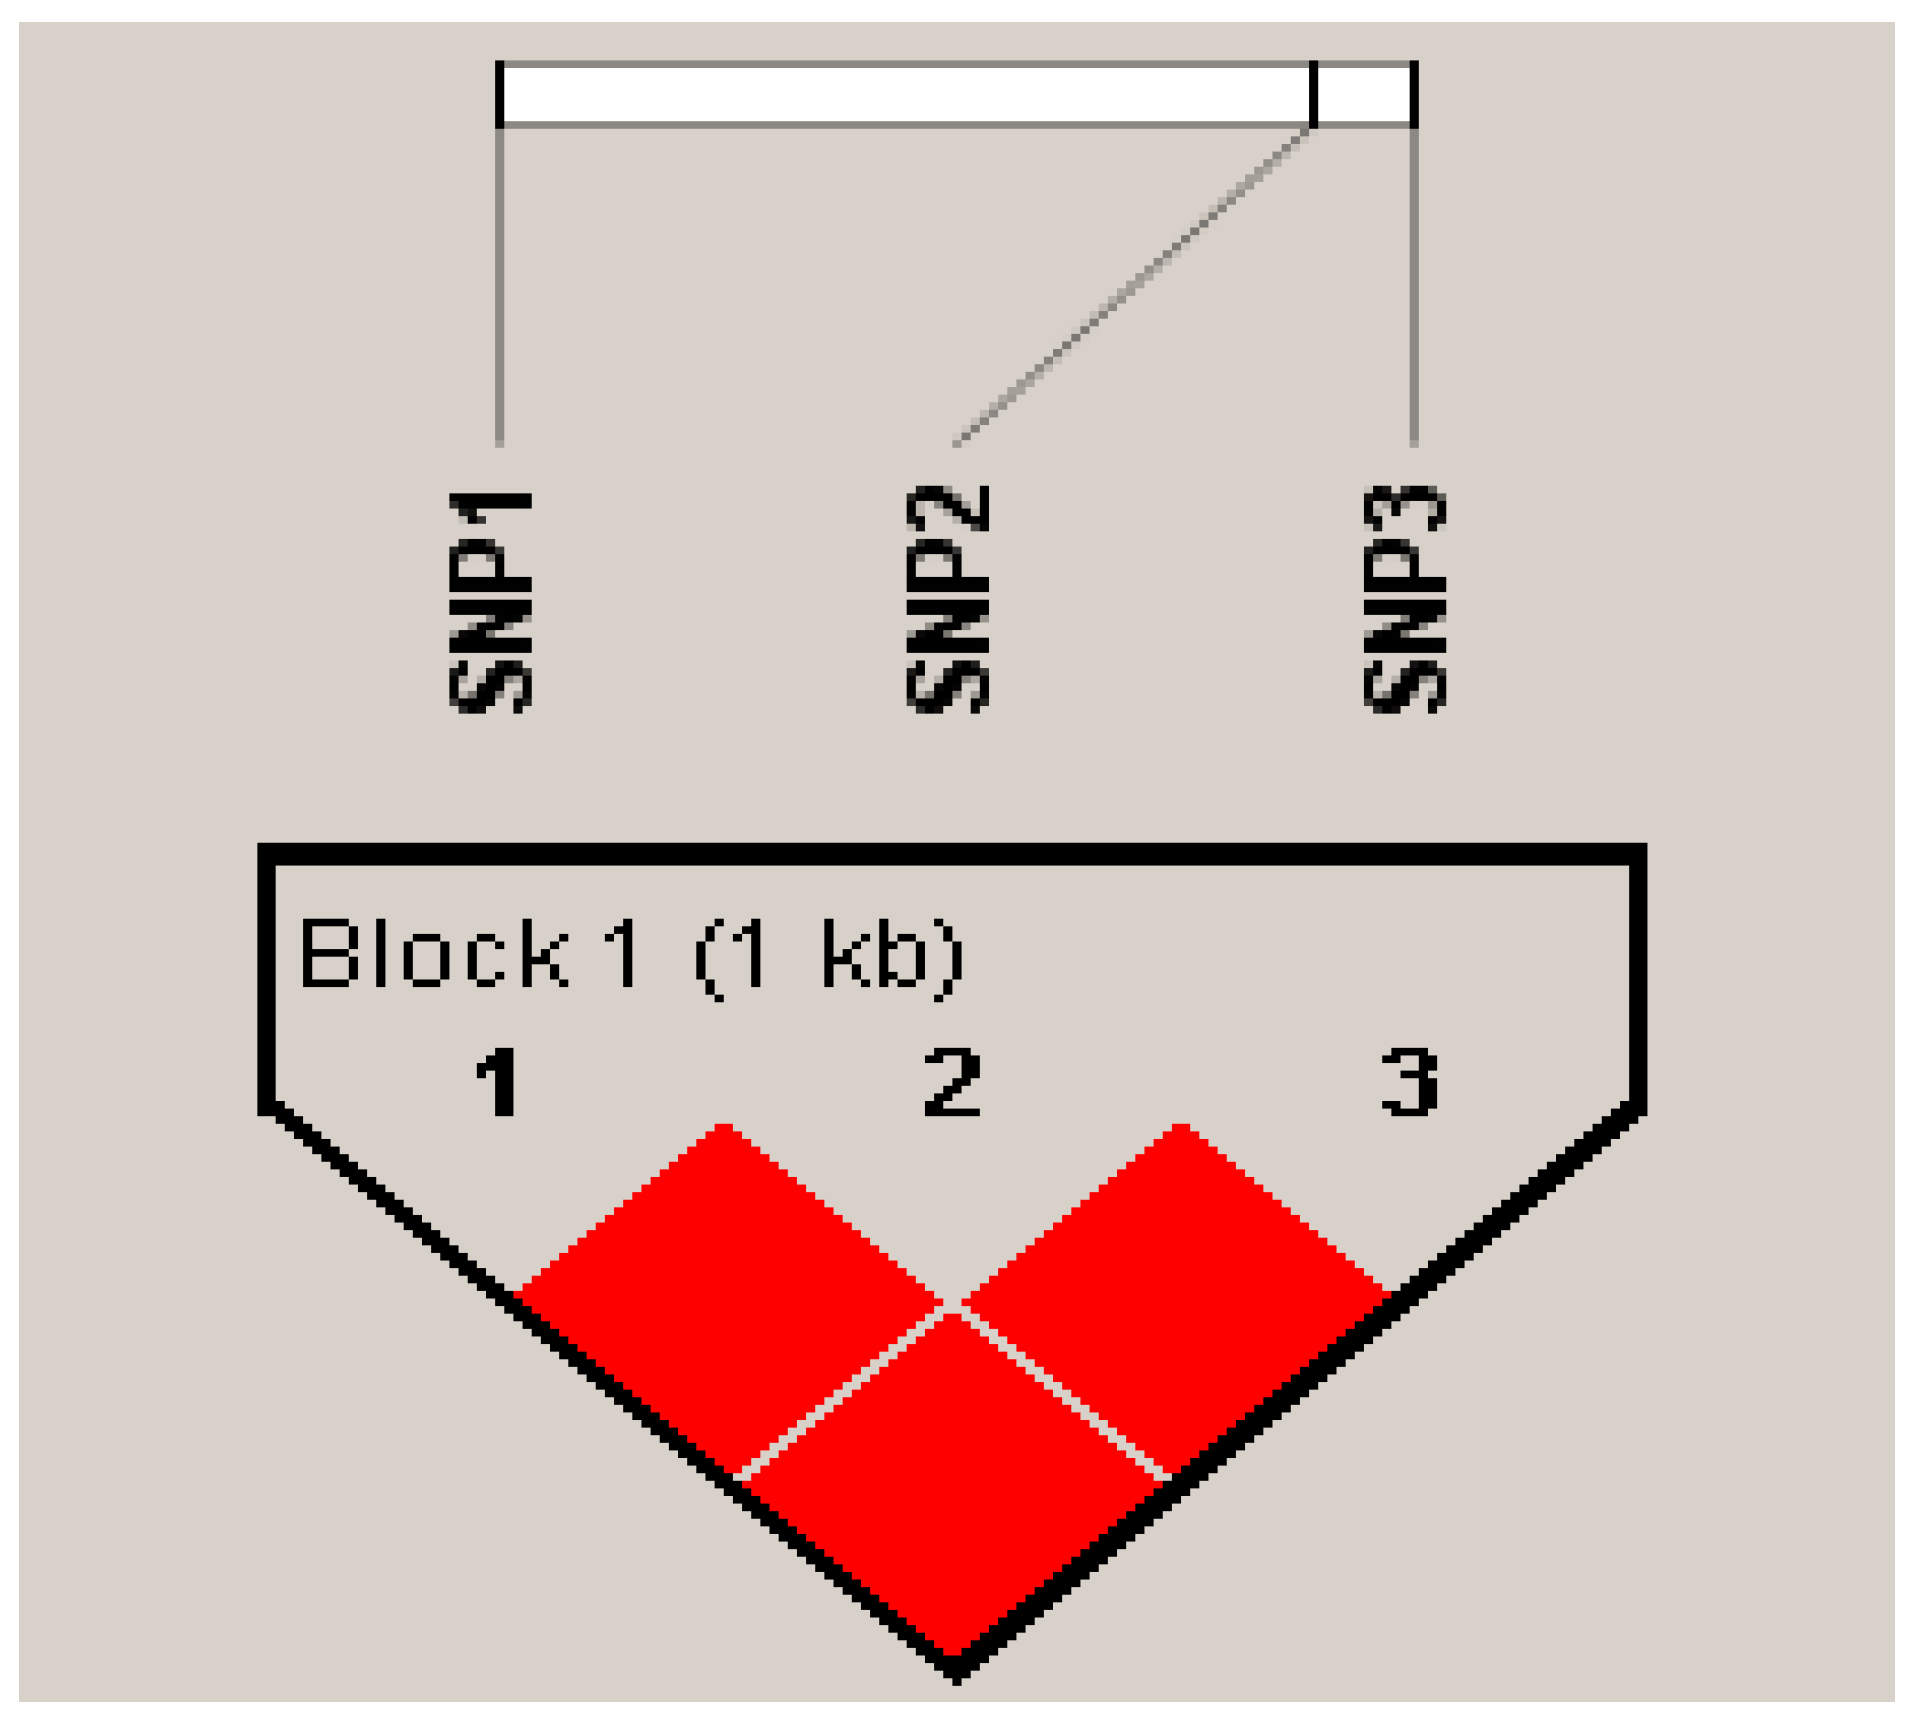
3.5. Analysis Linkage Disequilibrium

The linkage disequilibrium and haplotype of SNPs in the Tibetan sheep EPO gene were analyzed using Haploview 4.2 software. A haplotype block can be constructed at the three SNPs sites of the EPO gene, all of which are in a fully linked state (R2 = 1) (Figure 5). After the construction of the EPO gene haplotypes, there were four haplotypes with frequencies greater than 0.05, namely, H1 (ACT, 0.390), H2 (ACG, 0.344), H3 (AGG, 0.171) and H4 (CCG, 0.096). By combining the four haplotypes of the EPO gene, a total of 7 combinations with frequencies greater than 0.03 were obtained (Table 5).

3.6. Correlation Analysis between Haplotype Combination and Blood Gas

Correlation analysis was conducted between seven haplotype combinations of EPO gene and blood gas indexes of Tibetan sheep. Seven different haplotype combinations of the EPO gene were significantly correlated with pO2 (p < 0.05), among which the pO2 of H2H4 was significantly higher than that of H2H2 and H2H3, and the seven haplotype combinations had no significant association with other blood gas indexes (p > 0.05) (Table 6).

4. Discussion

Oxygen, like water and food, is necessary for the life of mammals. For aerobic animals, a change of oxygen concentration can cause a stress response in the body, and hypoxia will lead to the damage of tissue and organ function, and then affect the normal physiological function of the body [19]. Hypoxic adaptation, also known as hypoxic response, refers to an adaptive self-protection mechanism initiated by the body to maintain normal physiological functions under hypoxic stress [20]. To cope with this pressure, high-altitude indigenous animals have evolved unique adaptive strategies for circulation, respiration, and blood tolerance, including single-nucleotide variation, copy number variation, differential gene expression, isoforms, transposable elements, and methylation [21]. The core of the hypoxic response mechanism is hypoxic-inducing factor HIFs, which is composed of two subunits, α and β, in which α is a functional subunit (including 1α, 2α and 3α) and β is a structural subunit [22,23]. Hypoxia-inducible factor (HIFs) is a response regulator that mediates the adaptive response of cells under hypoxia conditions, and regulates the expression of hypoxia-related genes. Erythropoietin (EPO), vascular endothelial growth factor (VEGF) and platelet-derived growth factor (PDGF) are the downstream genes of HIFs, and their expression is regulated by HIFs [24].
Under hypoxic conditions, the EPO gene is widely expressed, plays an important role in erythropoiesis and tissue protection, and participates in many physiological processes [25,26]. EPO expression is the highest during hypoxia, when the body needs to increase red blood cell production to compensate for the reduced oxygen levels. Studies have shown that the expression of EPO in the kidney and liver of Tibetan sheep is higher than that of plain sheep [25], and it was also found that EPO levels rise in human plasma with increasing altitude [27]. The present study also found that the expression of EPO gene in the liver of Tibetan sheep was higher than that of Hu sheep, suggesting that EPO concentrations may be related to altitude (oxygen levels). Additionally, we observed the tissue-specific expression of EPO, with particularly high expression levels in the kidney, suggestive of their potential involvement in regulating hematopoiesis and hypoxia adaptation. In this study, it was found that the expression of EPO in the heart showed an increasing trend with the increase in altitude. The heart is an oxygen-demanding organ that relies on a continuous supply of oxygen to produce mechanically functional high-energy phosphate ATP, and the high expression of EPO in this organ with increasing altitude in sheep confirms the association of this gene with oxygen metabolism. These results suggest a potential role for this gene in determining the adaptability and fitness of Tibetan sheep in high-altitude environments.
In the plateau environment, due to the lower oxygen concentration, the animal organism requires a larger amount of red blood cells to provide sufficient oxygen. At this point, the variation in the EPO gene is important for animals to adapt to the plateau environment [28]. However, the specific genetic variants that contribute to this adaption are not fully understood. SNPs are the most common type of heritable variation and are widely present in the genome. Because SNPs are associated with many production traits of economic animals, they are thus the focus of methods to improve production performance. Therefore, SNPs are increasingly being used in research as a molecular genetic marker method [29]. In this study, three SNPs were detected in the EPO gene sequence, and population genotyping showed that the three SNPs of the EPO gene had three genotypes, among which the pO2 of CC and CG individuals at the g.2115 G > C locus was significantly lower than that of GG individuals (p < 0.05). There was no significant difference in pO2 between CC-type and CG-type individuals. Studies have shown that the body adaptively increases lung ventilation, heart rate, and total blood volume in order to ensure that there is enough oxygen to bind to hemoglobins in hypoxic environments. In tissues with low pO2 levels, oxygen often dissociates; in other words, low pO2 facilitates the separation of oxygen from hemoglobin [30], and the three genotypes had different hemoglobin-binding abilities to oxygen, which also suggests that the difference in blood gas index among different genotypes is mainly caused by the difference in altitude. Therefore, compared with GG-type individuals, CC- and CG-genotype individuals may have a stronger oxygen carrying capacity, and better adapt to the plateau environment. Haplotype analysis showed that the H2H2 and H2H3 haplotype combination had a lower pO2, and this made up 17% of the population, which suggests that the adaptability of these sheep may differ from that of other sheep.
Despite the progress made in understanding the role of EPO in hypoxia adaptation, efforts should be made to identify novel genetic variants of the EPO gene associated with hypoxia tolerance and production performance in plateau animals. Such knowledge will not only enhance our understanding of hypoxia adaptation, but also contribute to the development of more efficient breeding strategies for Tibetan sheep and yak, and other plateau livestock. But this requires more in-depth research in different sheep breeds and other species.

5. Conclusions

The expression of the EPO gene was closely related to changes in altitude (oxygen concentration), and the expression of EPO in some organs showed organ-specific and varietal differences. The variation in the EPO gene was correlated with some blood gas indexes of Tibetan sheep; that is, the g.2115 G > C site was significantly correlated with pO2 (p < 0.05). Seven different haplotype combinations of the EPO gene were significantly correlated with pO2 (p < 0.05), and the pO2 of H6H8 was significantly higher than those of H6H6 and H6H7.

Author Contributions

Conceptualization, Y.R., Z.H. and Q.X.; funding acquisition, S.L. and Y.R.; project administration, Q.X., S.L. and Y.R.; performed experiments, Y.R., Z.H., Q.X. and H.S.; data analysis, Y.R.; writing, Y.R., Q.X. and S.L. All authors have read and agreed to the published version of the manuscript.

Funding

This work was financially supported by the National Natural Science Foundation Project of China: 32360816, Key R&D Plan Projects in Gansu Province: 23YFWA0001 and Major Science and Technology Project of Xizang Autonomous Region: XZ202101ZD0001N.

Institutional Review Board Statement

The animals involved in the tests were approved by the Animal Protection Committee of Gansu Agricultural University (Date of approval: 17 June 2020; Approval No. GAU-LC-2020-056). The test animals were used in accordance with the Guidelines for the Protection and use of Animals developed by the Ministry of Science and Technology of the People’s Republic of China (Date of issue: 22 April 2006; Approval No. 2006-398.).

Informed Consent Statement

Not applicable.

Data Availability Statement

The raw data supporting the conclusions of this article will be made available by the authors on request.

Acknowledgments

We thank Shaobin Li and all the facilities involved.

Conflicts of Interest

The authors declare no conflict of interest.

References

  1. Tsiftsoglou, A.S. Erythropoietin (EPO) as a Key Regulator of Erythropoiesis, Bone Remodeling and Endothelial Transdifferentiation of Multipotent Mesenchymal Stem Cells (MSCs): Implications in Regenerative Medicine. Cells 2021, 10, 2140. [Google Scholar] [CrossRef]
  2. Chatterjee, P.K. Pleiotropic renal actions of erythropoietin. Lancet 2005, 365, 1890–1892. [Google Scholar] [CrossRef] [PubMed]
  3. Maiese, K.; Li, F.; Chong, Z.Z. New avenues of exploration for erythropoietin. JAMA 2005, 293, 90–95. [Google Scholar] [CrossRef]
  4. Jelkmann, W. Molecular biology of erythropoietin. Intern. Med. 2004, 43, 649–659. [Google Scholar] [CrossRef] [PubMed]
  5. Lappin, T.R.; Lee, F.S. Update on mutations in the HIF: EPO pathway and their role in erythrocytosis. Blood Rev. 2019, 37, 100590. [Google Scholar] [CrossRef]
  6. Storti, F.; Santambrogio, S.; Crowther, L.M.; Otto, T.; Abreu-Rodríguez, I.; Kaufmann, M.; Hu, C.J.; Dame, C.; Fandrey, J.; Wenger, R.H.; et al. A novel distal upstream hypoxia response element regulating oxygen-dependent erythropoietin gene expression. Haematologica 2014, 99, 45–48. [Google Scholar] [CrossRef] [PubMed]
  7. Hirano, I.; Suzuki, N.; Yamazaki, S.; Sekine, H.; Minegishi, N.; Shimizu, R.; Yamamoto, M. Renal Anemia Model Mouse Established by Transgenic Rescue with an Erythropoietin Gene Lacking Kidney-Specific Regulatory Elements. Mol. Cell Biol. 2017, 37, e00451-16. [Google Scholar] [CrossRef]
  8. Deji, B.Z.; Shang, P.; Danzeng, W.J.; Zhang, H.; Qiangba, Y.Z. Expression and hypoxia adaptation analysis of the EPO gene in different tissues of plateau Tibetan pigs. Genet. Mol. Res. 2015, 14, 1700–1706. [Google Scholar] [CrossRef]
  9. Zhou, Y.; Zhang, T.; Zhang, Y.Y.; Xu, J.; Li, M.; Zhang, Q.; Qiao, Z.; Yang, K. Expression and distribution of erythropoietin, vascular endothelial growth factor (VEGF) and VEGF receptor 2 in small intestine of yaks at different ages. Folia Morphol. 2023, 82, 683–695. [Google Scholar] [CrossRef]
  10. Scholz, H.; Schurek, H.J.; Eckardt, K.U.; Bauer, C. Role of erythropoietin in adaptation to hypoxia. Experientia 1990, 46, 1197–1201. [Google Scholar] [CrossRef]
  11. Wang, C.; Zhang, Q.; Liu, Y.; Xu, Q. Characterization of EPO H131S as a key mutation site in the hypoxia-adaptive evolution of Gymnocypris dobula. Fish. Physiol. Biochem. 2022, 48, 723–733. [Google Scholar] [CrossRef]
  12. Pang, K.; Lennikov, A.; Yang, M. Hypoxia adaptation in the cornea: Current animal models and underlying mechanisms. Anim. Model. Exp. Med. 2021, 4, 300–310. [Google Scholar] [CrossRef] [PubMed]
  13. Vočanec, D.; Prijatelj, T.; Debeljak, N.; Kunej, T. Genetic variants of erythropoietin (EPO) and EPO receptor genes in familial erythrocytosis. Int. J. Lab. Hematol. 2019, 41, 162–167. [Google Scholar] [CrossRef]
  14. Beall, C.M.; Cavalleri, G.L.; Deng, L.; Elston, R.C.; Gao, Y.; Knight, J.; Li, C.; Li, J.C.; Liang, Y.; McCormack, M.; et al. Natural selection on EPAS1 (HIF2α) associated with low hemoglobin concentration in Tibetan highlanders. Proc. Natl. Acad. Sci. USA 2010, 107, 11459–11464. [Google Scholar] [CrossRef]
  15. Zhou, H.; Hickford, J.G.; Fang, Q. A two-step procedure for extracting genomic DNA from dried blood spots on filter paper for polymerase chain reaction amplification. Anal. Biochem. 2006, 354, 159–161. [Google Scholar] [CrossRef]
  16. Lichtman, M.A.; Murphy, M.S.; Adamson, J.W. Detection of mutant hemoglobins with altered affinity for oxygen: A simplified technique. Ann. Intern. Med. 1976, 84, 517–520. [Google Scholar] [CrossRef]
  17. Livak, K.J.; Schmittgen, T.D. Analysis of relative gene expression data using real-time quantitative PCR and the 2−ΔΔCT Method. Methods 2001, 25, 402–408. [Google Scholar] [CrossRef] [PubMed]
  18. Botstein, D.; White, R.L.; Skolnick, M.; Davis, R.W. Construction of a genetic linkage map in man using restriction fragment length polymorphisms. Am. J. Hum. Genet. 1980, 32, 314–331. [Google Scholar] [PubMed]
  19. Stuart, J.A.; Aibueku, O.; Bagshaw, O.; Moradi, F. Hypoxia inducible factors as mediators of reactive oxygen/nitrogen species homeostasis in physiological normoxia. Med. Hypotheses 2019, 129, 109249. [Google Scholar] [CrossRef]
  20. Semenza, G.L. Perspectives on oxygen sensing. Cell 1999, 98, 281–284. [Google Scholar] [CrossRef]
  21. Li, F.; Qiao, Z.; Duan, Q.; Nevo, E. Adaptation of mammals to hypoxia. Anim. Models Exp. Med. 2021, 4, 311–318. [Google Scholar] [CrossRef]
  22. Schödel, J.; Grampp, S.; Maher, E.R.; Moch, H.; Ratcliffe, P.J.; Russo, P.; Mole, D.R. Hypoxia, Hypoxia-inducible Transcription Factors, and Renal Cancer. Eur. Urol. 2016, 69, 646–657. [Google Scholar] [CrossRef] [PubMed]
  23. Prabhakar, N.R.; Semenza, G.L. Adaptive and Maladaptive Cardiorespiratory Responses to Continuous and Intermittent Hypoxia Mediated by Hypoxia-Inducible Factors 1 and 2. Physiol. Rev. 2012, 92, 967–1003. [Google Scholar] [CrossRef]
  24. Figlus, M.; Kaczorowska, B.; Jaskólski, D.J.; Kępczyński, Ł. Von Hippel-Lindau syndrome—A case report. Pol. Merkur. Lek. 2018, 44, 248–252. [Google Scholar]
  25. Yang, K.; Zhang, L.; Chen, W.; Cheng, J.; Zhao, X.; Zhang, Y.; Li, R.; Zhou, M.; Yao, Y.; Li, Y.; et al. Expression of EPO and related factors in the liver and kidney of plain and Tibetan sheep. Histol. Histopathol. 2023, 38, 1337–1347. [Google Scholar]
  26. Crait, J.R.; Prange, H.D.; Marshall, N.A.; Harlow, H.J.; Cotton, C.J.; Ben-David, M. High-altitude diving in river otters: Coping with combined hypoxic stresses. J. Exp. Biol. 2012, 215, 256–263. [Google Scholar] [CrossRef]
  27. Siri, W.E.; Van Dyke, D.C.; Winchell, H.S.; Pollycove, M.; Parker, H.G.; Cleveland, A.S. Early erythropoietin, blood, and physiological responses to severe hypoxia in man. J. Appl. Physiol. 1966, 21, 73–80. [Google Scholar] [CrossRef]
  28. Xu, Q.; Zhang, C.; Zhang, D.; Jiang, H.; Peng, S.; Liu, Y.; Zhao, K.; Wang, C.; Chen, L. Analysis of the erythropoietin of a Tibetan Plateau schizothoracine fish (Gymnocypris dobula) reveals enhanced cytoprotection function in hypoxic environments. BMC Evol. Biol. 2016, 16, 11. [Google Scholar] [CrossRef]
  29. Benavides, M.V.; Sonstegard, T.S.; Van Tassell, C. Genomic Regions Associated with Sheep Resistance to Gastrointestinal Nematodes. Trends Parasitol. 2016, 32, 470–480. [Google Scholar] [CrossRef] [PubMed]
  30. Stembridge, M.; Williams, A.M.; Gasho, C.; Dawkins, T.G.; Drane, A.; Villafuerte, F.C.; Levine, B.D.; Shave, R.; Ainslie, P.N. The overlooked significance of plasma volume for successful adaptation to high altitude in Sherpa and Andean natives. Proc. Natl. Acad. Sci. USA 2019, 116, 16177–16179. [Google Scholar] [CrossRef] [PubMed]
Figure 1. Relative expression levels of EPO mRNA in different tissues of Hu sheep and Tibetan sheep from different altitudes. Note: The abscissa numbers 1, 2, 3, 4, 5 and 6 represent the heart, liver, spleen, lungs, kidney and longissimus dorsi tissue, respectively. In the legend, “Hu sheep” represents the Hu sheep, “Tibetan sheep (2500 m)” represents the Tibetan sheep at 2500 m altitude, “Tibetan sheep (3500 m)” represents the Tibetan sheep at 3500 m altitude, and “Tibetan sheep (4500 m)” represents the Tibetan sheep at 4500 m altitude. The bars represent the mean ± SE from three independent biological replicates, each performed with four technical replicates. The different letters indicate significant differences (p < 0.05), the same letter indicates no significant differences (p > 0.05).
Animals 14 00535 g001
Figure 2. Electrophoresis of EPO gene PCR amplification products of Tibetan sheep. The lanes labeled EPO-E1 and EPO-E4 are amplified products of exon 1 and exon4 of EPO gene, respectively. The lanes labeled M are the DNA marker.
Animals 14 00535 g002
Figure 3. Sequencing results of EPO SNPs’ PCR amplification products. The sites in the box are SNP sites.
Animals 14 00535 g003
Figure 4. KASP genotyping assay results of three loci of the EPO gene in Tibetan sheep. Horizontal and vertical coordinates for the two joints recognized by mutant base signaling, respectively. FAM is blue, HEX is green, and FAMHEX is red. Blue and green dots represent homozygotes and red dots represent heterozygotes. Gray dots represent unrecognized signals.
Animals 14 00535 g004
Figure 5. SNP linkage disequilibrium analysis of the EPO gene. These were in a fully linked state (R2 = 1).
Animals 14 00535 g005
Table 1. Primers for PCR and RT-qPCR.
GeneExonPrimer Sequence (5′→3′)Product Size (bp)Annealing Temperature/°CPurpose
EPO1F: TTGAAGTTTGGCCGGGAGAAGTG
R: CCAAGCCAGCCTCACTCTCCTCC
86458PCR
EPO4F: GCTGTTTCTGTAAAGTGAGAGAAGGGC
R: GCCAGTGGGGTCAAGAGGTCAG
100857PCR
EPOF: CTGTCTTTTCTGCTGTTTCCTCTG
R: CTCCATCCTCTTCCAGGCATA
20760RT-qPCR
β-actin F: AGCCTTCCTTCCTGGGCATGGA
R: GGACAGCACCGTGTTGGCGTAGA
11360RT-qPCR
Table 2. Genotype frequency and gene frequency of three SNPs’ loci in EPO gene.
SNP SiteNumberGenotype Frequency (Number)Allele Frequency
g.855 A > C349AAACCCAC
0.8195 (280)0.1748 (61)0.0057 (2)0.90690.0931
g.1985 T > G346GGGTTTGT
0.3584 (124)0.5029 (174)0.1387 (48)0.60980.3902
g.2115 G > C349CCCGGGCG
0.6905 (241)0.2665 (93)0.0430 (15)0.82380.1762
Table 3. The population genetic diversity of three SNPs of the EPO gene.
SNP SiteHoHeNePICHardy–Weinberg p-Value
g.855 A > C0.83120.16881.20310.1545p > 0.05
g.1985 T > G0.52420.47581.90770.3625p > 0.05
g.2115 G > C0.70960.29041.40920.2483p > 0.05
Table 4. The effects of genotypes of EPO SNPs on blood gas.
SNP SiteBlood GasGenotype
g.855 A > C AA (n = 286)AC (n = 61)CC (n = 2)
pCO240.453 ± 0.64341.742 ± 0.46440.557 ± 0.372
pO238.618 ± 0.36538.364 ± 0.54638.037 ± 0.407
sO270.587 ± 0.82370.561 ± 0.55471.701 ± 0.865
p5026.470 ± 0.78326.669 ± 0.05926.256 ± 0.697
g.1985 T > G GG (n = 124)GT (n = 172)TT (n = 48)
pCO240.236 ± 0.43141.057 ± 0.75840.531 ± 0.478
pO239.465 ± 0.66838.380 ± 1.44538.624 ± 0.930
sO270.493 ± 0.29270.562 ± 0.28170.537 ± 0.840
p5026.764 ± 0.84227.201 ± 0.32926.684 ± 0.506
g.2115 G > C CC (n = 241)CG (n = 93)GG (n = 15)
pCO240.127 ± 0.47340.757 ± 0.43740.140 ± 0.356
pO238.365 ± 0.566 b38.064 ± 0.442 b43.404 ± 0.494 a
sO270.642 ± 1.53770.066 ± 0.45770.791 ± 1.209
p5027.537 ± 0.80226.729 ± 0.59326.371 ± 0.401
Note: Estimates are given as X ± SE; data in the same line are significantly different with different letters (p < 0.05), and not significantly different with the same letters (p > 0.05). n: The number of observed sheep. Same as below.
Table 5. Frequency of haplotype and haplotype combination of SNP locus reconfiguration in the EPO gene.
HaplotypeSNP1SNP2SNP3Frequency/%Haplotype CombinationHaplotype Combination Frequency/%
H1(ACT)ACT0.390H1H10.1521
H2(ACG)ACG0.344H1H20.1342
H3(AGG)AGG0.171H1H30.0667
H4(CCG)CCG0.096H1H40.0374
H2H20.1183
H2H30.0588
H2H40.0330
Table 6. Effects of EPO gene reconfiguration haplotype on blood gas.
Haplotype
Combination
pCO2pO2sO2p50
H1H140.347 ± 0.64038.725 ± 0.305 ab70.621 ± 0.77326.484 ± 0.333
H1H240.821 ± 1.06337.923 ± 0.127 ab70.081 ± 0.49326.880 ± 0.453
H1H341.776 ± 0.90238.276 ± 0.884 ab69.796 ± 0.54526.633 ± 0.892
H1H440.901 ± 0.25838.190 ± 1.896 ab70.278 ± 0.98426.043 ± 1.574
H2H241.670 ± 0.51536.551 ± 0.295 b70.683 ± 0.99826.499 ± 0.339
H2H339.754 ± 0.86237.629 ± 0.653 b69.850 ± 0.73925.971 ± 0.509
H2H440.573 ± 0.16340.304 ± 0.796 a70.801 ± 1.47326.302 ± 0.331
Note: Different letters indicate significant differences (p < 0.05).
Disclaimer/Publisher’s Note: The statements, opinions and data contained in all publications are solely those of the individual author(s) and contributor(s) and not of MDPI and/or the editor(s). MDPI and/or the editor(s) disclaim responsibility for any injury to people or property resulting from any ideas, methods, instructions or products referred to in the content.

