Article

Evaluation of Dynamics, Demography and Estimation of Free-Roaming Dog Population in Herat City, Afghanistan

by
Zabihullah Nasiry
1,2,
Mazlina Mazlan
1,*,
Mustapha M. Noordin
1 and
Mohd Azmi Mohd Lila
1
1
Department of Veterinary Pathology & Microbiology, Faculty of Veterinary Medicine, Universiti Putra Malaysia (UPM), Serdang 43400, Selangor, Malaysia
2
Department of Paraclinic, Faculty of Veterinary Science, Herat University, Herat 3001, Afghanistan
*
Author to whom correspondence should be addressed.
Animals 2023, 13(7), 1126; https://doi.org/10.3390/ani13071126
Submission received: 5 February 2023 / Revised: 3 March 2023 / Accepted: 16 March 2023 / Published: 23 March 2023
(This article belongs to the Section Animal Welfare)

Abstract

:

Simple Summary

Understanding the demography, population size, and dynamics of free-roaming dogs (FRD) is essential for developing an effective dog-population-management and rabies-control programme. The existence of an uncontrolled FRD population in Herat, Afghanistan, is causing threats to public health and has raised concerns for their welfare. The aim of this study was to evaluate the demographic structures and estimate the FRD population size in Herat city, Afghanistan. The photographic sight–resight method utilized and human-to-FRD ratio in this study yielded a density of 10 dogs/km2 and an estimated ratio of 315:1. Dogs were predominantly adult males with a good health status and ideal body-condition score. The knowledge of FRD demography and population size provided by this study could be used by the local government for much more effective planning, implementation and monitoring of dog-population-control programmes.

Abstract

FRDs pose a serious challenge in countries where dog-bite-related rabies is endemic. Understanding the size and core demographic characteristics of FRD populations is essential for the planning and implementation of effective dog-population and canine-rabies-control programmes. The photographic sight–resight method was used to estimate the FRD population and evaluate its demographic characteristics in Herat city. A total of 928 free-roaming dogs (FRD) were identified through 3172 sightings, and the total free-roaming population was estimated to amount to 1821 (95% CI: 1565–2077), which led to the estimation of 10 dogs/km2 and the human-to-FRD ratio of 315:1. The male-to-female ratio was 2.85:1. The majority of them were healthy, with an ideal body score. Although the FRD density is considered low, it is still a concern and significant, since the majority of the people are unaware of the importance of canine populations in the transmission of zoonotic diseases such as rabies, and there were no specific measures for managing and controlling FRD populations. The information gained can be useful in animal health planning to design effective dog-population-control programmes, and for the planning of national rabies-prevention programmes.

1. Introduction

The familiar, widely distributed and phenotypically diversified domestic dog (Canis lupus familiaris) is one of our closest animal companions [1,2,3,4]. It is the most popular owned pet species in the world [5,6]. Dogs are considered part of the family, particularly in developed countries [7]. Although pet dogs are usually restricted in their behaviour, a significant proportion of global dog population are free-roaming on the streets (and are commonly known as free-roaming dogs/FRDs) [8]. Some reports have estimated that 75% of the 700 million world dogs population are stray FRDs [9,10,11,12]. Other reports estimated that there were 800 million dogs in the world and that 300 million were FRDs [13], explaining why they are a common sight in many countries [14]. The management of FRDs is challenging (because of relatively high fecundity) and is a significant problem in both developing and developed countries [15].
FRDs pose serious challenges in a community, such as risks of attacks or bites, the transmission of diseases, threats to wildlife population, vehicular accidents and pollution [8]. One of the great problems of FRDs is the threat of rabies, as the epidemiology of human rabies is closely connected with that of dogs, which are responsible for almost 99% of global human rabies deaths [12,16,17,18,19,20]. This has led to WHO recommending the control of rabies in FRDs through annual mass vaccination of FRDs, with coverage of at least 70% of the population [21].
Canine rabies is a zoonotic, fatal and progressive neurological infection caused by Lyssaviruses of the family Rhabdoviridae [22]. The disease causes an estimated 59,000 human deaths globally every year and an estimated loss of 3.7 million in disability-adjusted life years (DALYs) annually [18,19,23,24,25,26,27,28,29], which is more than any other zoonotic disease [16,19]. The disease is almost 100% lethal once clinical signs emerge [16,30]. Human rabies is transmitted from bites by infected animals, predominantly dogs [28,31]. It is reported that 99% of global rabies deaths are attributed to the transmission of rabies through dog bites [18]. The threat of this deadly disease affects more than 3.3 billion people globally [24], with the world’s poorest regions at highest risk [28]. The rabies virus is endemic, and dog bites are common in countries where over half of world’s population reside at [19] It was estimated that more than 29 million people worldwide receive rabies postexposure prophylaxis each year for dog bites [19,23]. Rabies accounts for economic losses of about USD 8.6 billion annually, mainly due to premature deaths and postexposure treatment (PET) costs [28]. Almost all mammal species are susceptible to rabies, and it has encroached livestock yields, with an estimated loss of USD 12.3 billion in Africa and Asia [24]. The disease can be prevented and controlled through the mass vaccination of dogs, movement restrictions of dogs and quarantining imported dogs [32,33]. Human rabies is almost entirely preventable through the prompt administration of postexposure prophylaxis (PEP) to bite victims [34].
Rabies is endemic in Afghanistan, with hundreds of deaths annually [35]. The country has the highest number of human rabies cases in South Asia, at 5.7 per 100,000 people [34].The likely root problems of the ongoing rabies being endemic in Afghanistan are attributed to inaccurate epidemiological information and the absence of specific and sustainable rabies-prevention and -control measures [35]. The country started to adopt mass dog vaccination with a neutering programme in Kabul, and tens of thousands of dogs were vaccinated against rabies between 2017 and 2019. However, the abundant number of FRDs, lack of regular vaccination, absence of regular-animal-birth-control programmes, limited human resources, and insufficient funds are the significant constraints in controlling rabies [34].
Rabies epidemiology is closely associated with dog ecology [36,37]. Additionally, it is now generally believed that a good knowledge of local domestic dog ecology is essential for implementing an effective rabies-control strategy [38]. Thus, understanding dog demographic characteristics and population density is essential for planning and monitoring dog-population management and control, as well as for designing appropriate rabies-control measures in dog populations [8,10,20,21,24,37,39]. Accordingly, many studies have been conducted worldwide on free-roaming dogs [7,14,17,20,21,37,39,40,41,42,43,44,45,46,47,48,49,50,51,52,53,54,55].
Herat is situated in the southwestern part of Afghanistan and it is the second most populated city in the country. The lack of epidemiological data on canine populations, coupled with ineffective control measures, means that canine rabies remains endemic in this province. Additionally, the existence of an uncontrolled FRD population has negatively influenced public health, leading to socioeconomic, political and animal welfare problems. The information generated by this research can be useful in animal health planning to design effective dog-population-management and -control programmes and can be valuable to the local government in planning national rabies-prevention programmes.

2. Materials and Methods

2.1. Study Area

The study was carried out in the Herat province (34.1769° N, 61.7006° E), which encompasses an area of 55,868.5 km2 and is situated in the southwestern part of Afghanistan, bordering Iran (Islam Qala Crossing) and Turkmenistan (Torghundi Crossing). It has internal borders with Badghis province in the north, Ghor in the east and Farah in the south. Herat, the provincial capital of Herat Province, is the densest and the second most populated city in the country, with more than 2 million people. Herat city covers 182 km2 and divided into 15 districts (Figure 1) (Afghanistan Statistical Yearbook, 2020). Herat city is quite densely populated, owing to being well known for its cultural heritage, industrial nature and manufacturing industries.

2.2. Study Design and Sampling

The study was designed as a cross-sectional study and was conducted between September 2020 and April 2021 in all 15 districts of Herat city using photographic sight–resight methods to estimate and evaluate the FRD population. In this study, FRDs were defined as dogs that were not under the direct control of any person or were possibly owned but roaming during the survey period. The FRD survey was enhanced by dividing Herat city into 31 blocks, and each block (demarcated by large roads) covered an area of ~5 km2. Each block was visited twice daily, in the early morning and evening. During the field survey, representatives from each predetermined area were informed the day before a survey of the area was conducted.

2.3. Survey Methods

The survey was conducted using the photographic sight–resight (PSR) method. A preliminary PSR survey revealed that the most active times for FRDs were the early morning (4:30–6:30 a.m.) and evening (6:30–8:30 p.m.). Streets and alleys were traversed by a car at a maximum speed of 20 km/h. Once a dog or group of dogs were observed, photographs were taken by using a Nikon COOLPIX P510 digital camera (Nikon company, Tokyo, Japan) at appropriate angles from a convenient distance. All observable characteristics of each dog were recorded including its sex (male; female; not verified), age (puppy (<6 months); young (6 months to 1 year); adult (>1 year)), reproductive status (pregnant; lactating; female in oestrus; not verified), body-condition scoring, observable health status (lameness; emaciation; skin lesions or dermatitis (abnormal changes in any area of the skin); mad dog signs), details of coat colour (composition; primary or secondary colour), coat condition (wounded; healthy; clean; dirty) and coat hair condition (long; medium; short), along with its GPS location (using a Garmin 60CS device). In addition, the activity of the FRD at the time of the survey (active; inactive; feeding or foraging), its social behaviour (alone; in a group), its reaction during the surveyor (friendly approaches; low-posture approaches; growls or barks; attacks the surveyor; ignores the surveyors; runs away), its location (road; sidewalk; playground; field; parking lot; underneath a car; bushes; dump sites; slaughterhouse; biological-waste-disposal sites; other places) and its proximity (presence ≤ 20 m) to garbage-disposal sites, such as garbage dumps/points or temporary accumulated litter along the streets and alley, were recorded.

2.4. Data Collection

All of the above parameters were provided in a predefined format to facilitate the data-collection process during the survey. Then, the photographs were reviewed to identify each dog by using distinguishable natural marks (on their flanks, ears, head and tail), body condition, details of coat colour, coat hair condition, age, sex, reproductive status and ears/tail amputation. The first time an individual dog was observed, this was defined as the initial sighting (capture) event. The subsequent encounters with the same dog were considered resighting (i.e., recapture). The identification of dogs relied on direct observation and photographs and, thus, none of the dogs were physically captured in this study. Following completion of the identification, each dog was given a unique identification code. The GPS location of each dog was loaded into GIS software (ArcMap version 10.4) and displayed on the map. Data through field survey using the PSR method were collected, then processed and analysed (Figure 2).

2.5. Data Management and Analysis

Collected data were computed using Microsoft Excel (version: 16.0.4266.1001). Descriptive statistics were produced and 95% confidence intervals were calculated by using GraphPad Prism version 8.0.2 for Windows (GraphPad software, Lajolla, CA, USA). The chi-square test was utilized to examine variation in different categories (sex, age group, body-condition score, reproductive status) between groups using GraphPad Prism. GPS points of FRDs were loaded into ArcGIS 10.4 to be displayed on the map. The estimation of the FRD populations was made using the Lincoln–Petersen formula with Chapman’s correction.
N = [ (   n 1 + 1 ) × ( n 2 + 1 ) ( m 2 + 1 ) ] 1
The variance of N was estimated using Seber’s formula [48]:
v a r ( N ) = [ ( n 1 + 1 ) ( n 2 + 1 ) ( n 1 m ) ( n 2 m ) ( m + 1 ) 2 ( m + 1 )
An approximate 95% confidence interval for N was estimated as:
N   ± 1.965 v a r ( N )
where N is the total population size, n1 is the number of dogs sighted/photographed on the first occasion, n2 is the number of dogs sighted/photographed on the second occasion, and m2 is the number of dogs resighted.

3. Results

3.1. Number of FRDs

A total of 928 unique FRDs (predominantly male) were identified through 3172 reliable sightings in fifteen districts of Herat city during the survey period (Figure 3).
Photos were available for 99.1% of these dogs (due to restrictions on photography on the roads around security areas, political representations of foreign countries and poor quality of photographs). The total FRD population was estimated to be 1821 (95% CI: 1565–2077), leading to an estimate of 10 dogs/km2, with a human-to-dog ratio of 315:1 (3.17 dogs per 1000 people). Most dogs were identified during the morning shift (probably due to ample amount of uncollected garbage, and less human interference). The number of dogs identified in each district ranged from 27 to 123, bearing a linear relationship of R² = 0.0627, y = 1.8643x + 46.952. Most dogs were recorded in districts 5, 9 and 15, while the lowest FRD population density was recorded in districts 2, 10, 1 and 7.

3.2. Demography Characteristics

Out of the 928 FRDs, 60.6% (562/928; 95% CI = 65.6–57.6%) were males, 21.2% (197/928; 95% CI = 23.1–18.3%) females and 18.2% (169/928; 95% CI = 20–17.6%) were of unverifiable sex. Overall, the male dogs were significantly more represented than other categories (χ2 = 65.33, df = 28, p < 0.001). The male-to-female ratio was 2.85:1 (95% CI = 3.6:1–2.7:1). The variations in sex ratio between districts was 1.33–5.83:1. The majority of dogs, 85.5% (793/928; 95% CI = 92.7–81.4%), were observed to be more than 1 year old (adult), 10.3% (96/928; 95% CI = 11.4–10%) were ≥ 6 months (young) and 4.2% (39/928; 95% CI = 4.4–4%) were <6 months of age (puppy). Adults were the largest percentage of all the categories (χ2 = 57.63, df = 28, p < 0.001). Out of 197 identified female dogs, 9.13% (18/197; 95% CI = 10–8.8%) were lactating (identified based on visual observation/presence of infant puppies), 7.61% (15/197; 95% CI = 8.4–7.4%) were pregnant dogs (recognized based on body condition and behaviour) and 8.62% (17/197; 95% CI = 9.5–8.4%) of the dogs were in oestrus (recognized based on being followed by male dogs). No significant variation was recorded in the reproductive status compositions of FRDs in districts during the survey period (χ2 = 51.81, df = 39, p < 0.08). All demographic details (sex, age distribution and reproductive status) of these FRDs are displayed in Table 1.

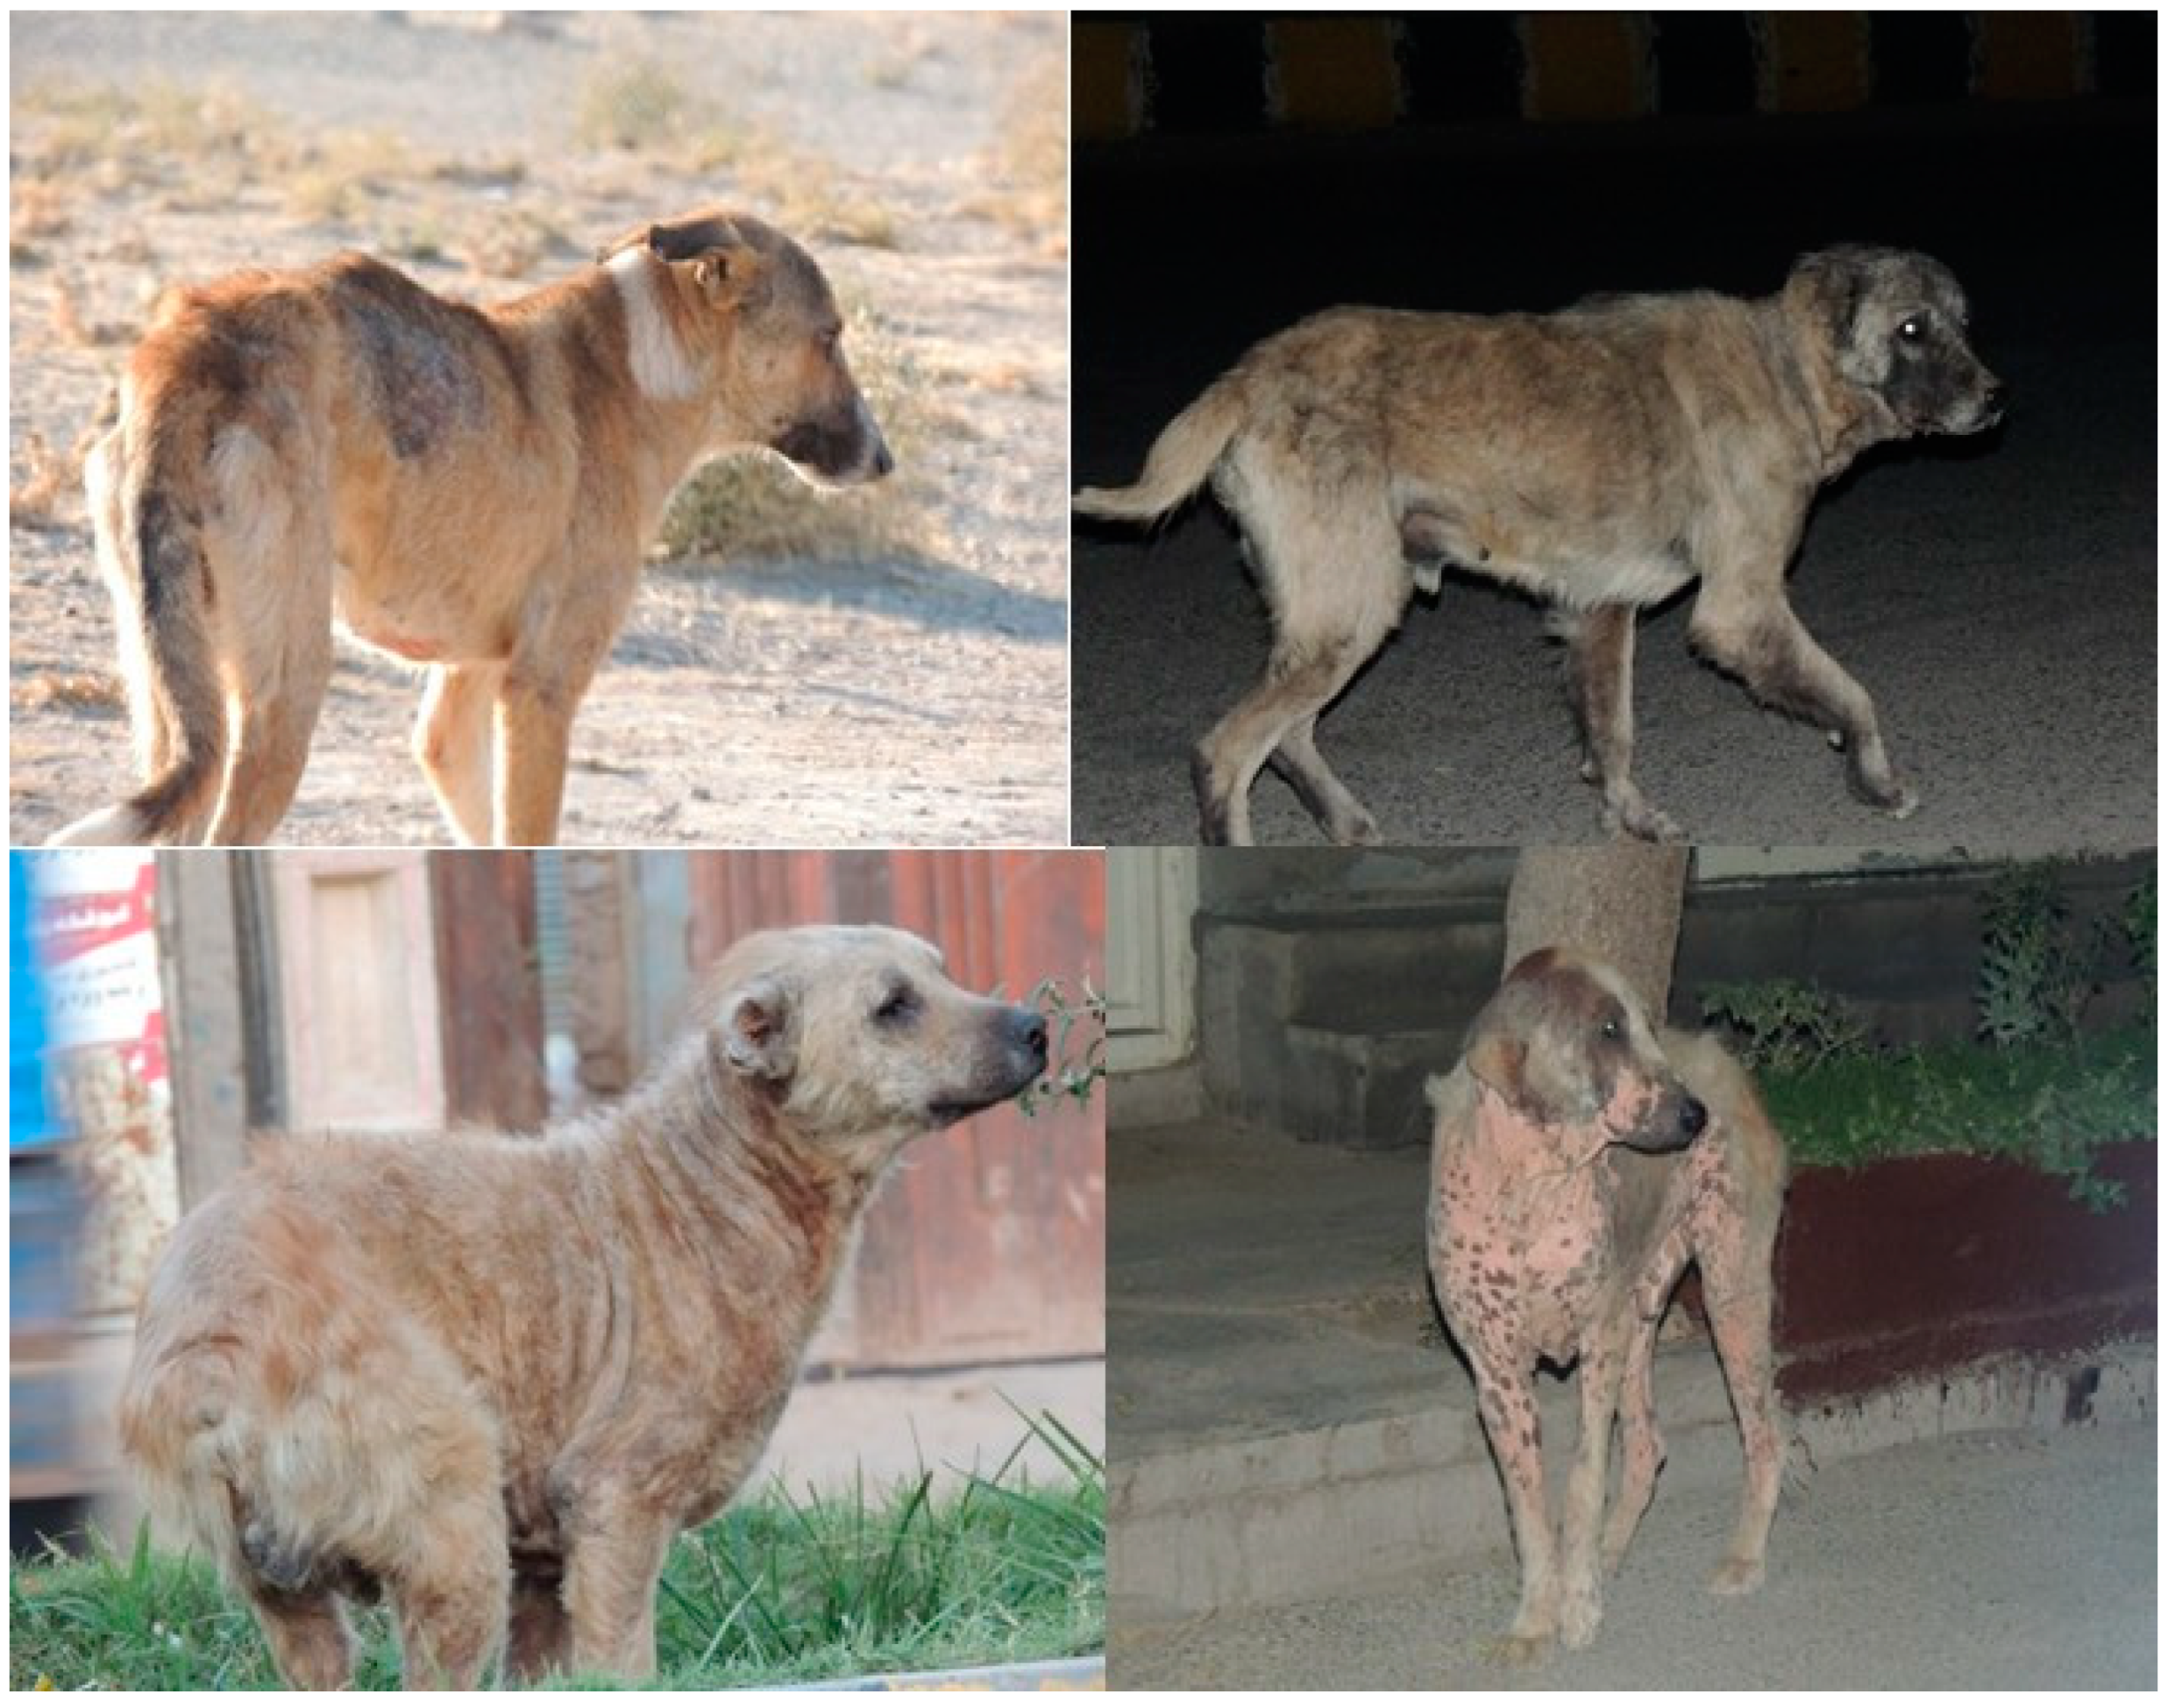
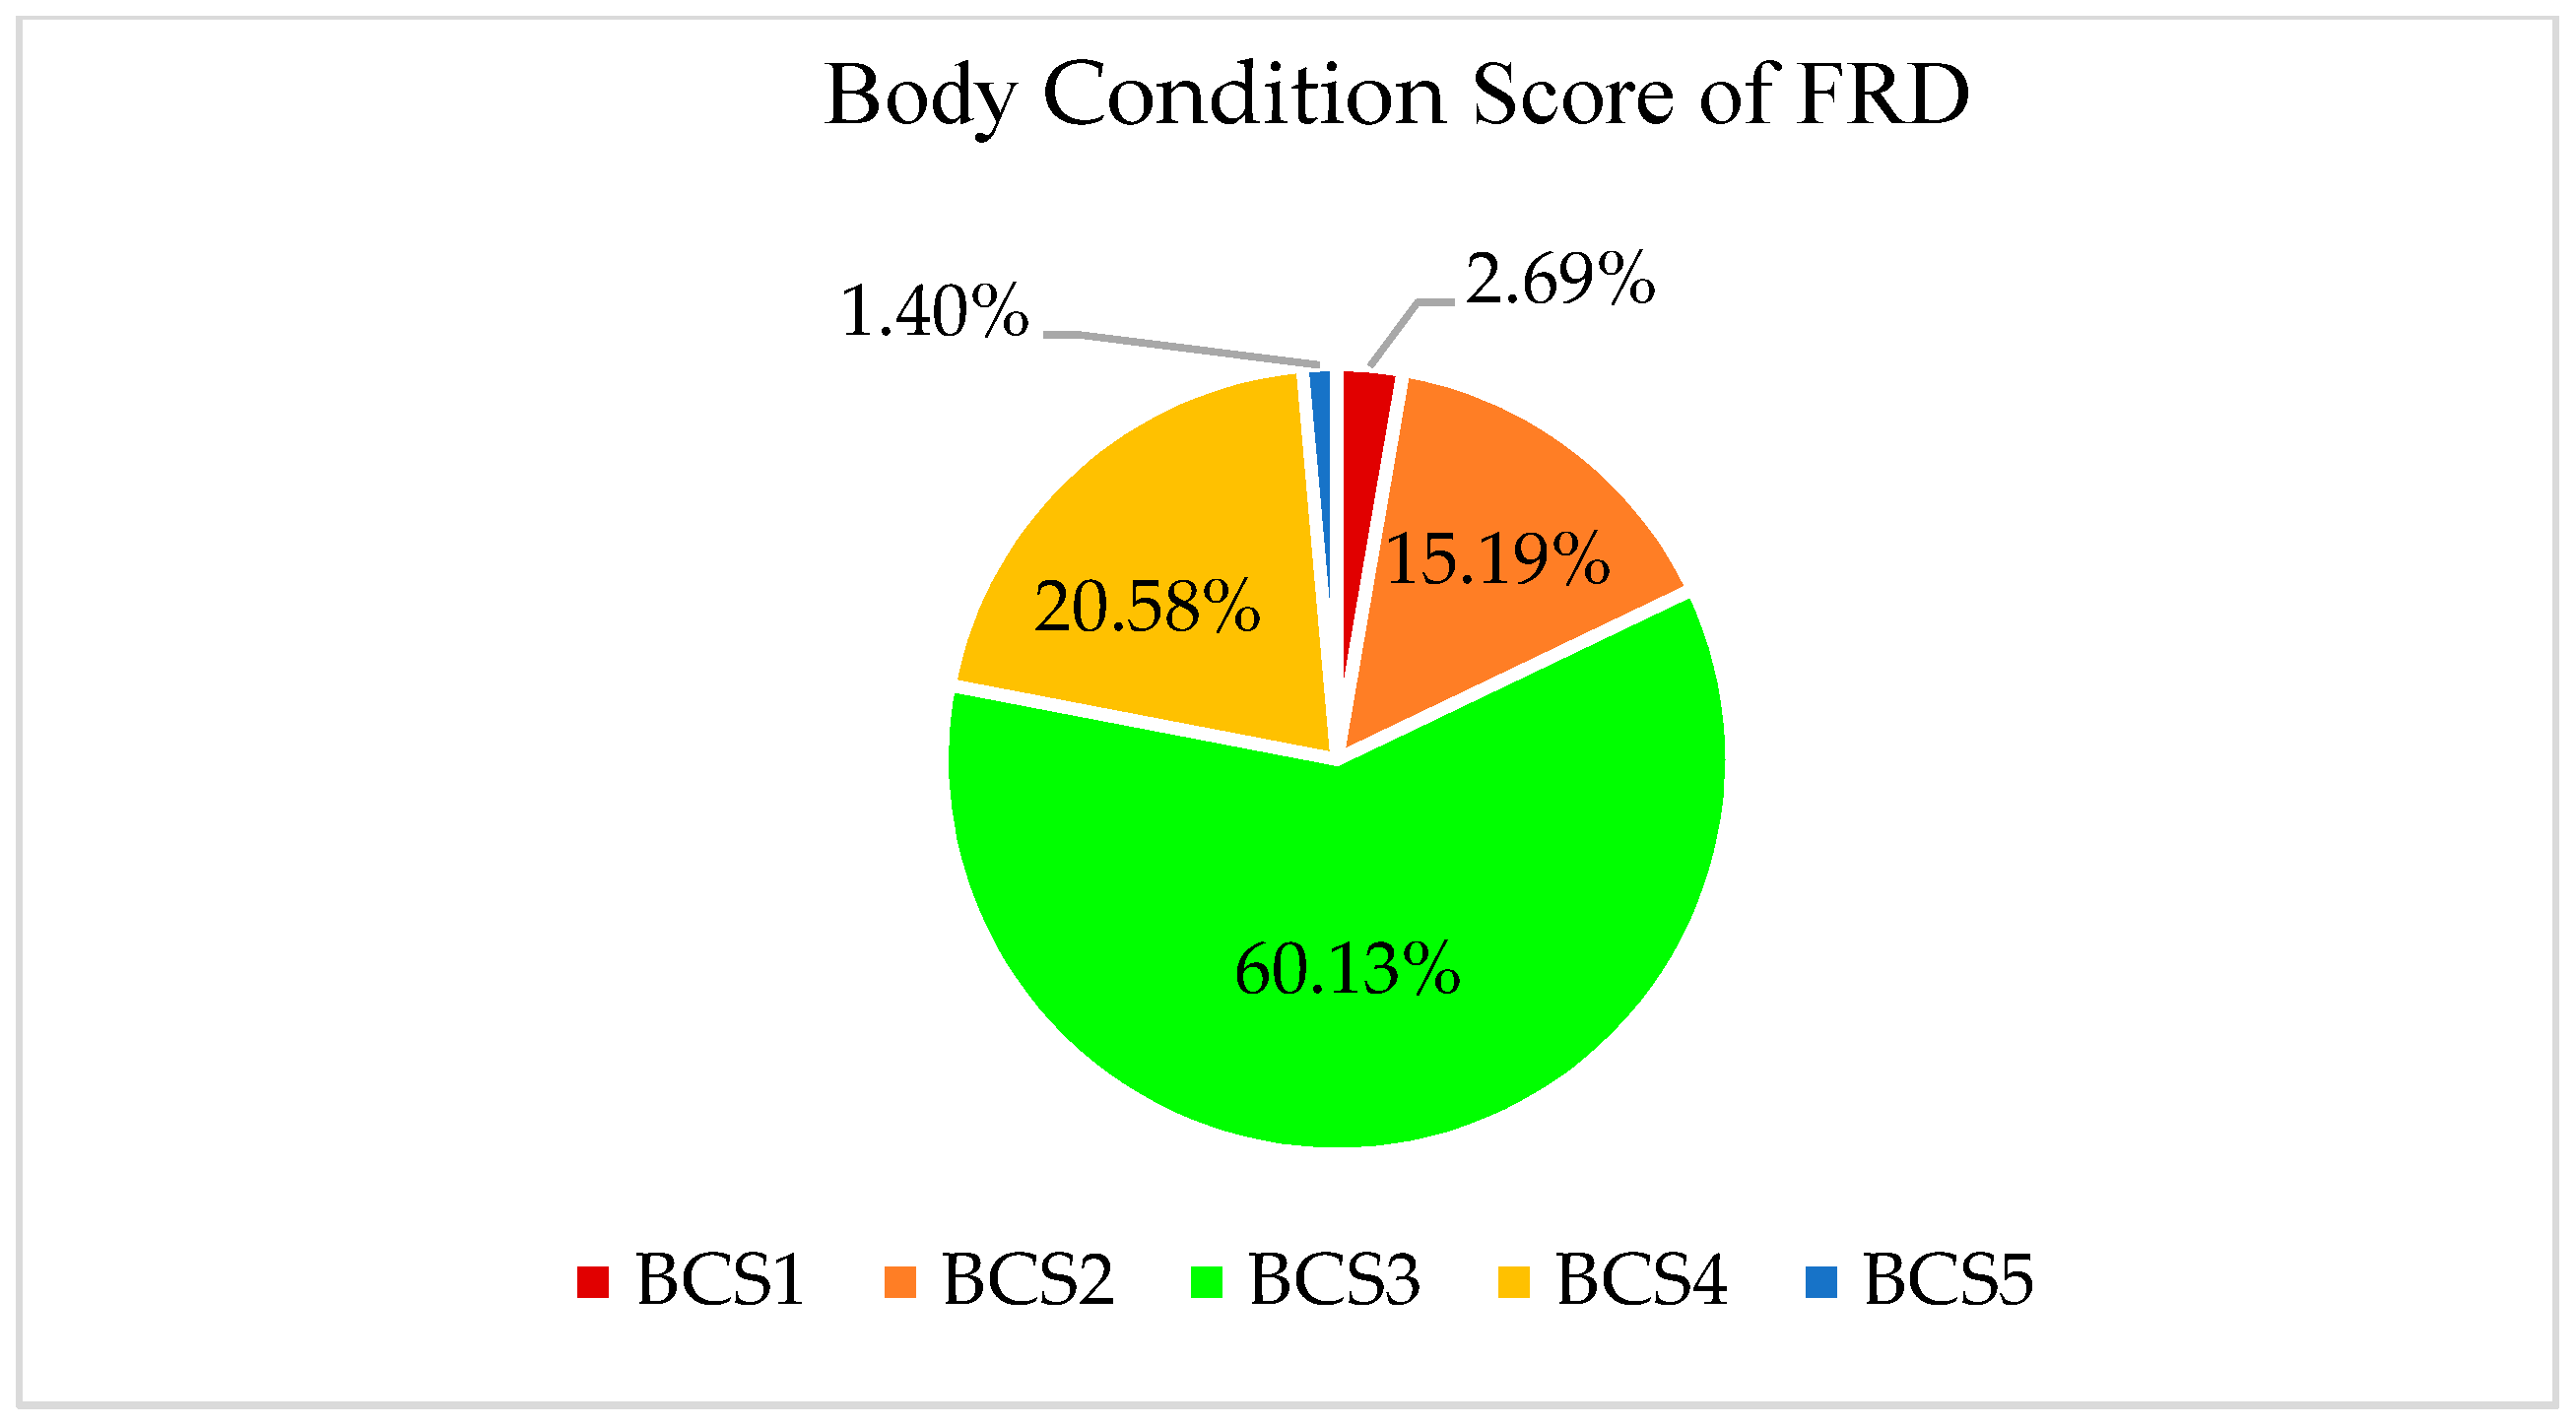
3.3. Health Status and Body-Condition Score

Generally, the health status of FRDs was good, with 82% (764/928; 95% CI = 89.6–78.6%) being healthy, while lameness, excessive emaciation and skin lesions or dermatitis were recorded in 18% (164/928; 95% CI = 19–16.7%) of FRDs (Figure 4 and Figure 5). Based on coat hair condition, 89.98% (835/928; 95% CI = 97.7–85.8%) and 10.02% (93/928; 95% CI = 10.8–9.5%) of FRDs were assessed as healthy and wounded, respectively. Coat sanitary condition was recorded to be 74.9% (695/928; 95% CI = 81.4–71.5%) clean, 2.7% (25/928; 95% CI = 2.9–2.5%) shiny and 22.4% (208/928; 95% CI = 24.25–21.2%) dirty.
The most common body-condition score (BCS) seen was BCS3, in around 60.13% (558/928; 95% CI = 65.6–57.6%) of the dogs, which is considered an ideal body condition (Figure 6). The amputation of the tail and ears of dogs is commonly carried out by dog owners when they want to keep the dogs as pets or guard dogs. We recorded ears/tails amputated in 33.65% (312/928; 95% CI = 36.6–32.2%) of free-roaming dogs, which might suggest that these particular dogs were owned abandoned dogs or owned free-roaming dogs.

3.4. Location of Free-Roaming Dogs during the Time of Survey

The location of dogs varied significantly (χ2 = 957.7, df = 154, p < 0.0001), and most dogs were seen on the roads (42.13%; 391/928; 95% CI = 45.8–40.3%) and sidewalks (32.76%; 304/928; 95% CI = 35.7–31.5%) (Table 2). The remaining FRDs were seen at dump sites (6.25%; 58/928; 7–6.24%), fields (6.03%; 56/928; 95% CI = 6.7–5.7%), boulevards (5.71%; 53/928; 95% CI = 6.4–5.6%), parking lots (2,59%; 24/928; 95% CI = 2.9–2.6%), slaughterhouses (2.37%; 22/928; 95% CI = 2.8–2.5%), parks (1.4%; 13/928; 95% CI = 1.6–1.43%), playgrounds, underneath cars and bushes (0.66%; 6/928; 95% CI = 0.68–0.65%) and at biological-waste-disposals sites (0.1%; 2/928; 95% CI = 0.12–0.11%).

3.5. Reaction of Free-Roaming Dogs during the Time of Survey

A significant variation was observed in FRD reaction (χ2 = 278.9, df = 70, p < 0.0001). Around 43.75% (406/928; 95% CI = 47.6–41.8%) of dogs did not tolerate human presence and fled whenever approached, which contrasts with 30.5% (283/928; 95% CI = 33.5–28.5%) of dogs, which had neutral approaches or ignored the surveyor during the survey. Slow approaches, growls and barks, attacks on the surveyor and friendly approaches were seen and recorded, respectively, in about 18.97% (176/928; 95% CI = 20.9–18.4%), 4.96% (46/728; 95% CI = 5.3–4.7%), 1.07% (10/928; 95% CI = 1.1–1%) and 0.75% (7/928; 95% CI = 0.8–0.74%) of dogs (Table 3).

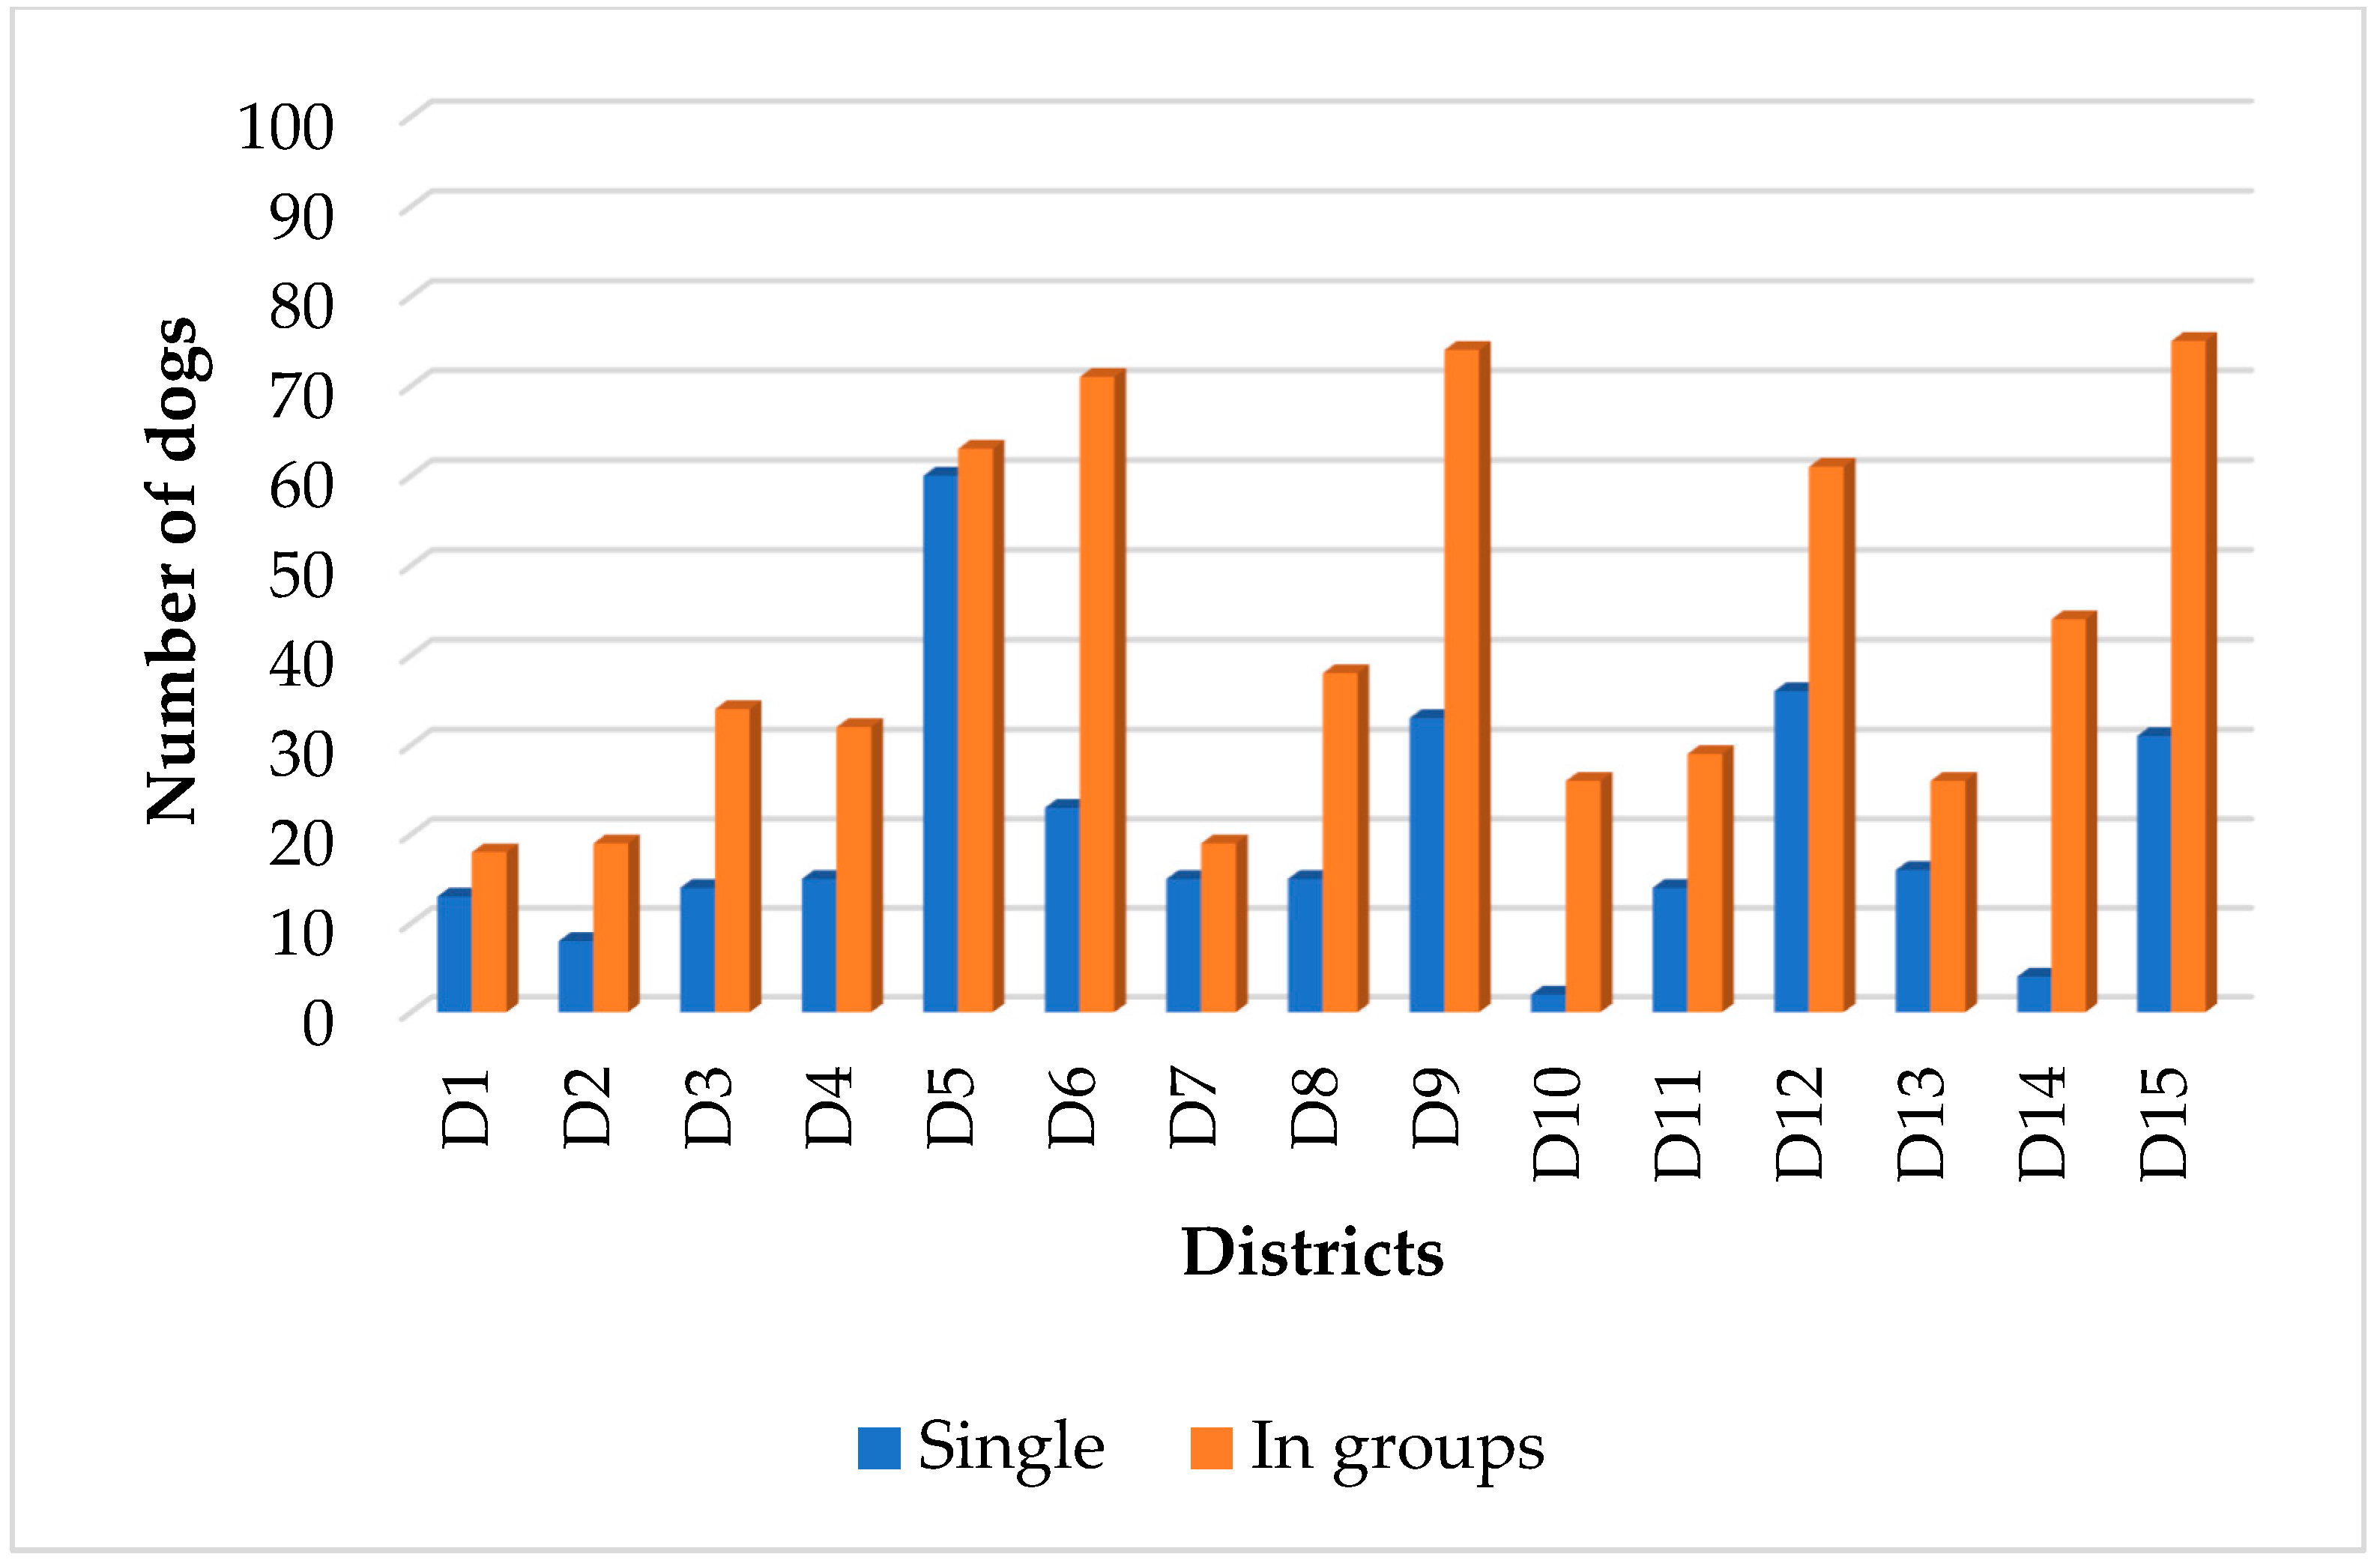
3.6. Social Behaviour and Activity

Dogs were seen in groups significantly more often (68%, 95% CI = 73.4–64.5%) than alone (χ2 = 45.10, df = 14, p < 0.0001). Additionally, 68% (631/928; 95% CI = 73.9–46.9%) of them were active (exploring, walking, interacting, feeding and foraging) during the survey time, and 32% (297/928; 95% CI = 34.7–30.4%) inactive (standing, sitting, laying down and sleeping) (Table 4).
Out of 928 FRDs, 441 (48%; 95% CI = 51.5–45%) were seen ≤20 m from the garbage sites (including places which accumulations of garbage are left temporarily, in small amounts such as the roadsides and sidewalks and official dump sites) (Table 4 and Figure 7). Although no significant variation was observed in the activities of FRDs during the survey time (χ2 = 38.70, df = 28, p < 0.08), a significant difference was found in the number of dogs sighted within 20 m of garbage dumps/accumulated litter (χ2 = 127.9, df = 14, p < 0.0001) across the districts.
Out of the 629 (68%) dogs that were seen in packs, 60.2% were male dogs, 21.5% were female dogs and 18.3% were dogs with unverified gender. Out of the total male dogs, female dogs and dogs with unverified gender, 67% (379/562), 68.5% (135/197) and 68% (115/169) were seen in packs during the survey period, respectively. The most common composition of social structure was observed as MM/0, MM/UF, MM/MF and UM/UF (Figure 8). The social behaviour was varied in each district (Figure 9).

4. Discussion

Estimating and evaluating of FRD populations is critical for the planning and implementation of effective dog-population- and canine-rabies-control programmes, particularly in countries where rabies is endemic such as Afghanistan. Although many studies have been conducted elsewhere [7,14,21,37,39,42,44,47,48,49,50,51,52,53,54,55], this was the first study that evaluated and estimated the size of FRD populations in Herat city, Afghanistan.
As in many previous studies around the world [7,21,40,46,50,55,56,57], the photographic sight–resight method was utilized in this study to evaluate demographic characteristics and estimate the FRD population size in Herat city. This method has several advantages, such as reducing the cost of the survey, reducing the risk of researchers’ exposure to dog bites or rabies and reducing the scaring of targeted FRDs in the study population, which would result in them fleeing away (because individual dogs are not physically captured in this method and only photographed from a distance without disturbing their natural behaviour). In addition, the use of digital photography is useful during field surveys to reduce misidentification of the individual dogs, which can lead to inaccurate evaluation and estimation. Like many previous studies conducted elsewhere [47,48,58,59], the Lincoln–Petersen formula with Chapman’s correction was applied to estimate the FRD population. This method has an advantage over other methods as it requires only two sighting sessions [60].
The FRD per km2 was estimated at 10 dogs/km2, in this study which is lower compared to findings from some other parts of the world, such as 1081 dogs/km2 in San Francisco de Campeche, a city in Mexico [50], 242 dogs/km2 in Tiswadi taluka, in the state of Goa in southwest India [61], 52 dogs/km2 in Dhaka city, Bangladesh [48], 57 dogs/km2 in Aarey Milk Colony, a suburb of Mumbai, India [46], 119 dogs/km2 in the Coquimbo region of Chile [1], 334 dogs/km2 in Iringa, Tanzania [62], and 225 dogs/km2 in Shimotsui, Kurashiki city, Japan [63], but rather high compared to the 1.3 dogs/km2 reported by Rinzin [59] in Bhutan. However, our finding was nearly consistent and comparable with the 14 dogs/km2 and 12.25 dogs/km2 reported by Hossain et al. [40] in Raipura Upazila, Bangladesh and Bouaddi et al. [38] in EL Jadida, Morocco, respectively. Nevertheless, the dog density was reported to completely vary, from as low as 1 dog/km2 [1] and 1.3 dogs/km2 [59] to as high as 1380 dogs/km2 [1] and 2930 dogs/km2 [54]. Therefore, this result generally reflects the lower abundance of free-roaming dogs than that reported elsewhere, probably due to the low percentage of owned dogs and high number of confined owned dogs, or possibly due to the recent fencing of public places, such as parks, which has restricted the shelter of stray dogs and interference of humans in garbage sites, which has restricted accessibility of free-roaming dogs to foods, consequently causing them to move to semi-urban and rural areas.
The FRD-to-human ratio (1:315/3.17 dogs per 1000 people) obtained in this study is considered quite high compared to the 1:828 in Dhaka city, Bangladesh, and 1:493 in Punjab, Pakistan, which were estimated and reported by Tenzin et al. [48] and Shah, [63], but is considered low compared to (1:14), (1:14.3), (1:139), (1:4.7), (1:6.7), (1:2.3) and (1:120) that were estimated and reported by Gsell et al. [62], Chaudhari [64], Ayiedun and Olugasa [65], Kato et al. [54], Pimburage et al. [44], Cortez-Aguirre et al. [50]. and Hossain et al. [40] in Tanzania, the Haryana state of India, Ilorin in Nigeria, Kathmandu in Nepal, Sri Lanka, a city in southern Mexico and rural Bangladesh, respectively. Additionally, it is almost comparable with the 1:400 reported by and Özen et al. [49]. However, the density of the dog population may vary between different areas and countries, due to differences in sociocultural, environmental and dog-control strategies. A likely reason for the result obtained here (Herat city) may be the cultural and religious barriers to keeping dogs.
The highest number of FRDs was recorded in districts 5, 9 and 15 of Herat city. The possible factors associated with the highest abundance of FRDs in district 5 were the high density of the human population, unrestricted properties for the roaming of dogs (parks, parking lots), many commercial storerooms, large food and construction markets and the existence of many restaurants and dump sites that directly or indirectly provided food and shelter for FRD populations. Additionally to the factors mentioned above, a part of district 9 is the transportation point and vehicle station of several villages, and when travellers leave the area, they usually leave behind edible garbage along the roads and sidewalks, which attracts more FRDs in the area during times of lower human interference (early morning/evening/night). The density of the FRD population in district 15 was probably due to the high density of people, the size of the area, the presence of more owned dogs, the relative poverty of the residents, the lack of municipal services such as regular garbage collection and the bringing and releasing of unwanted dogs to this area from other regions by their owners (according to several residents).
The sex ratio of FRDs in this study skewed towards males (61%), which is consistent with the findings from other parts of the world [7,21,40,41,44,48,50,51], but is in contrast to (55.3% females) reports in Bali and Indonesia by Hiby et al. [33]. However, many studies have reported male dogs outnumbering females in FRD populations, and this disparity could be attributed to the preference of communities for male dogs or a high female dog mortality rate [21]. Based on our visual observation, 7.61% of dogs were identified as pregnant in this study, which is close to the percentage reported by Rinzin et al. [59] of 6.2%.
The age distribution was highly skewed toward adults, which is similar to the findings reported by others [7,21,40,50,59]. Possibly, the low density of puppies and young FRDs is due to the death of FRD puppies by accidents and deliberate poisoning or the absence of any communal or group care of pups by other females, which would agree with the report by Tiwari et al. [21]. Furthermore, it may be due to their susceptibility to diseases, such as distemper and canine parvovirus, which has resulted in high mortality and a consequently lower percentage of young dogs.
A high proportion of dogs (60.13%) were found to have a good body-condition score (BCS3), which indicates higher survivability and better capabilities to reproduce. Our finding is quite similar to what was recorded by other researchers, but is slightly lower than the finding by Cortez-Aguirre et al. [50]. However, most of the identified FRDs in Herat city had an ideal body-condition score, which is probably related to the availability of food (edible garbage), feeding of FRDs by the community or the lower density of dogs, which causes less competition, or, perhaps, a proportion of these dogs were actually free-roaming owned dogs, freely allowed to roam the neighbourhood.
Generally, the health status of FRDs was good, considering their stray status. The percentage of FRDs with skin lesions or dermatitis which was recorded (mostly in the males) in this study was low compared to the findings reported by Tenzin et al. [48], Cortez-Aguirre et al. [50] and Hiby et al. [33] in Dhaka city in Bangladesh, Campeche city in Mexico and Sanur in Bali, respectively Moreover, the fact that skin lesions were recorded mostly in male dogs is consistent with the finding by Cortez-Aguirre et al. [50], but different from the finding by Tenzin et al. [48]. Emaciation was recorded only in 2.6% of the dogs in this study, which is inconsistent with the findings of 23.2% by Hiby et al. [33], 12% by Tiwari et al. [21] and 8.9–10.6% by Hiby and Hiby [14]. In this study, most dogs had no visible injuries, and only 10.02% of the FRD exhibited visible injuries or wounds, in which our finding concurs with the finding reported by Hiby et al. [33].
A high proportion of FRDs were seen on the roads and sidewalks, which is possibly correlated with the abundance of edible litter since garbage is not collected regularly, and this finding concurs with those reported by Kato [54], Tenzin et al. [48] and Cortez-Aguirre et al. [50]. It is believed that the distribution of roaming dogs is associated with the management of garbage-collection points [48]. In this study, around 48% of the FRDs were found around a 20 m radius of garbage sites, which is quite similar to the finding of Tiwari et al. [21]. Similarly, a high percentage of dogs (68%) were active, which is comparable to that observed and reported by Tiwari et al. [21], with 43%.
In this study, around 68% of dogs were observed in groups, which was comparable with the 59.2% reported in Antananarivo, Madagascar [36]. The most common composition of social structure was male groups and male–female groups. This is probably due to the outnumbering of males compared to females, where the male groups incorporate females depending on their availability. However, there are significant dangers in forming groups, as groups of roaming dogs are not normally tolerated by the public.

5. Conclusions

In conclusion, having knowledge of the FRD population is crucial for the effective control of dog populations and the implementation of rabies-control programmes. This study provided the size of the population, demographic data, health status and dynamics of FRDs in Herat city, Afghanistan, by using the photographic sight–resight method. The human-to-FRD ratio was estimated at 315:1, with a density of 10 dogs/km2. A higher proportion of dogs were male and they were predominately adults. Generally, the health status of FRDs was good, with the majority of the FRD population found to have an ideal body-condition score. Skin lesions/dermatitis, lameness and emaciation were recorded only in 18% of FRDs. Most dogs were seen on the roads and sidewalks and a high proportion were active, and almost half of them were seen near garbage sites. Nearly half of them did not tolerate human presence and fled whenever approached. The abundance of FRDs and lack of prophylactic programmes targeting FRDs have generated public health problems in Herat city. The baseline information gained by this study could be used by the local government for the planning, implementation and monitoring of effective dog-population-control interventions, as well as for animal health planning, such as in canine-rabies control. Therefore, we feel there is a value in further studies at different times of the year. Additionally, similar studies are recommended in rural areas of the Herat province to obtain comprehensive FRD ecological data for the effective control of the dog population and rabies.

Author Contributions

Conceptualization, Z.N., M.M., M.M.N. and M.A.M.L.; methodology, Z.N., M.M. and M.M.N.; software, Z.N. and M.M.; validation, Z.N., M.M., M.M.N. and M.A.M.L.; formal analysis, Z.N.; investigation, Z.N.; resources, M.M. and Z.N.; data curation, Z.N.; writing—original draft preparation, Z.N.; writing—review and editing, M.M., M.M.N. and M.A.M.L.; visualization, Z.N. and M.M.; supervision, M.M., M.M.N. and M.A.M.L.; founding acquisition, M.M.; project administration Z.N. and M.M. All authors have read and agreed to the published version of the manuscript.

Funding

This research received no external funding.

Institutional Review Board Statement

This study received ethical approval from the Research Ethics Committee of Herat University, Afghanistan (No. HU-198-2. In addition, permission from the local municipality of Herat city was also obtained (No. 749/554).

Informed Consent Statement

Not applicable.

Data Availability Statement

Data sharing is not applicable to this article.

Acknowledgments

The authors gratefully acknowledge the Ministry of Higher Education for the provision of the financial support under the Fundamental Research Grant Scheme (FRGS/1/2018/WAB01/UPM/01/1).

Conflicts of Interest

The authors declare that there are no conflict of interest regarding the publication of this paper.

References

  1. Acosta-Jamett, G.; Cleaveland, S.; Cunningham, A.A.; Bronsvoort, B.M.d.C. Demography of Domestic Dogs in Rural and Urban Areas of the Coquimbo Region of Chile and Implications for Disease Transmission. Prev. Vet. Med. 2010, 94, 272–281. [Google Scholar] [CrossRef] [PubMed]
  2. Galibert, F.; Quignon, P.; Hitte, C.; Andre, C. Comptes Rendus Biologies Toward Understanding Dog Evolutionary and Domestication History Histoire de La Domestication Du Chien. C. R. Biol. 2011, 334, 190–196. [Google Scholar] [CrossRef]
  3. Larson, G.; Karlsson, E.K.; Perri, A.; Webster, M.T.; Ho, S.Y.W.; Peters, J.; Stahl, P.W.; Piper, P.J.; Lingaas, F.; Fredholm, M.; et al. Rethinking Dog Domestication by Integrating Genetics, Archeology, and Biogeography. Proc. Natl. Acad. Sci. USA 2012, 109, 8878–8883. [Google Scholar] [CrossRef] [Green Version]
  4. Wang, G.; Zhai, W.; Yang, H.; Wang, L.; Zhong, L.; Liu, Y.; Fan, R.; Yin, T.; Zhu, C.; Poyarkov, A.D.; et al. Out of Southern East Asia: The Natural History of Domestic Dogs across the World. Nat. Publ. Gr. 2015, 26, 21–33. [Google Scholar] [CrossRef] [PubMed]
  5. do Vale, B.; Lopes, A.P.; Fontes, M.d.C.; Silvestre, M.; Cardoso, L.; Coelho, C.A. A Cross-Sectional Study of Knowledge on Ownership, Zoonoses and Practices among Pet Owners in Northern Portugal. Animals 2021, 11, 3543. [Google Scholar] [CrossRef] [PubMed]
  6. Westgarth, C.; Boddy, L.M.; Stratton, G.; German, A.J.; Gaskell, R.M.; Coyne, K.P.; Bundred, P.; McCune, S.; Dawson, S. Pet Ownership, Dog Types and Attachment to Pets in 9–10 Year Old Children in Liverpool, UK. BMC Vet. Res. 2013, 9, 102. [Google Scholar] [CrossRef] [Green Version]
  7. Mustiana, A.; Toribio, J.A.; Abdurrahman, M.; Suadnya, I.W.; Hernandez-Jover, M.; Putra, A.A.G.; Ward, M.P. Owned and Unowned Dog Population Estimation, Dog Management and Dog Bites to Inform Rabies Prevention and Response on Lombok Island, Indonesia. PLoS ONE 2015, 10, e0124092. [Google Scholar] [CrossRef] [Green Version]
  8. Belo, V.S.; Werneck, G.L.; da Silva, E.S.; Barbosa, D.S.; Struchiner, C.J. Population Estimation Methods for Free-Ranging Dogs: A Systematic Review. PLoS ONE 2015, 10, e0144830. [Google Scholar] [CrossRef]
  9. Hughes, J.; Macdonald, D.W. A Review of the Interactions between Free-Roaming Domestic Dogs and Wildlife. Biol. Conserv. 2013, 157, 341–351. [Google Scholar] [CrossRef]
  10. Kisiel, L.M.; Jones-Bitton, A.; Sargeant, J.M.; Coe, J.B.; Flockhart, D.T.T.; Reynoso Palomar, A.; Canales Vargas, E.J.; Greer, A.L. Owned Dog Ecology and Demography in Villa de Tezontepec, Hidalgo, Mexico. Prev. Vet. Med. 2016, 135, 37–46. [Google Scholar] [CrossRef]
  11. Smith, L.; Munteanu, A.; Quinnell, R.J.; Collins, L.M. The Effectiveness of Dog Population Management: A Systematic Review. Animals 2019, 9, 1020. [Google Scholar] [CrossRef] [Green Version]
  12. Wallace, R.M.; Undurraga, E.A.; Blanton, J.D.; Cleaton, J.; Franka, R. Elimination of Dog-Mediated Human Rabies Deaths by 2030: Needs Assessment and Alternatives for Progress Based on Dog Vaccination. Front. Vet. Sci. 2017, 4, 9. [Google Scholar] [CrossRef] [PubMed] [Green Version]
  13. Andrew Rowan, D.p. WellBeing International’s Global Dog Campaign to End Dog Homelessness. Available online: https://wellbeingintl.org/global-dog-campaign/about-gdc/ (accessed on 1 November 2021).
  14. Hiby, E.; Hiby, L. Direct Observation of Dog Density and Composition during Street Counts as a Resource Efficient Method of Measuring Variation in Roaming Dog Populations over Time and between Locations. Animals 2017, 7, 57. [Google Scholar] [CrossRef] [PubMed] [Green Version]
  15. Sparkes, J.; Körtner, G.; Ballard, G.; Fleming, P.J.S.; Brown, W.Y. Effects of Sex and Reproductive State on Interactions between Free-Roaming Domestic Dogs. PLoS ONE 2014, 9, e116053. [Google Scholar] [CrossRef]
  16. Fooks, A.R.; Banyard, A.C.; Horton, D.L.; Johnson, N.; McElhinney, L.M.; Jackson, A.C. Current Status of Rabies and Prospects for Elimination. Lancet 2014, 384, 1389–1399. [Google Scholar] [CrossRef] [PubMed]
  17. Hudson, E.G.; Brookes, V.J.; Ward, M.P.; Dürr, S. Using Roaming Behaviours of Dogs to Estimate Contact Rates: The Predicted Effect on Rabies Spread. Epidemiol. Infect. 2019, 147, e135. [Google Scholar] [CrossRef] [Green Version]
  18. Kumar, H.; Id, T.; Robertson, I.D.; Dea, M.O.; Vanak, A.T. Knowledge, Attitudes and Practices (KAP) towards Rabies and Free Roaming Dogs (FRD) in Panchkula District of North India: A Cross-Sectional Study of Urban Residents. PLoS Negl. Trop. Dis. 2019, 13, e0007384. [Google Scholar]
  19. Ma, X.; Blanton, J.D.; Millien, M.F.; Medley, A.M.; Etheart, M.D.; Fénelon, N.; Wallace, R.M. Quantifying the Risk of Rabies in Biting Dogs in Haiti. Sci. Rep. 2020, 10, 1062. [Google Scholar] [CrossRef] [Green Version]
  20. Hambolu, S.E.; Dzikwi, A.A.; Kwaga, J.K.P.; Kazeem, H.M.; Umoh, J.U.; Hambolu, D.A. Dog Ecology and Population Studies in Lagos State, Nigeria. Glob. J. Health Sci. 2014, 6, 209–220. [Google Scholar] [CrossRef] [Green Version]
  21. Tiwari, H.K.; Robertson, I.D.; O’Dea, M.; Vanak, A.T. Demographic Characteristics of Free-Roaming Dogs (FRD) in Rural and Urban India Following a Photographic Sight-Resight Survey. Sci. Rep. 2019, 9, 16562. [Google Scholar] [CrossRef] [Green Version]
  22. Singh, R.; Singh, K.P.; Cherian, S.; Saminathan, M.; Reddy, G.B.M.; Panda, S.; Dhama, K. Rabies—Epidemiology, Pathogenesis, Public Health Concerns and Advances in Diagnosis and Control: A Comprehensive Review. Vet. Q. 2017, 37, 212–251. [Google Scholar] [CrossRef] [Green Version]
  23. Ghosh, S.; Chowdhury, S.; Haider, N.; Bhowmik, R.K.; Rana, S.; Marma, A.S.P.; Hossain, M.B.; Debnath, N.C.; Ahmed, B. Original Article Awareness of Rabies and Response to Dog Bites in a Bangladesh Community. Vet. Med. Sci. 2016, 3, 161–169. [Google Scholar] [CrossRef] [PubMed] [Green Version]
  24. Gill, G.S.; Singh, B.B.; Dhand, N.K.; Aulakh, R.S.; Sandhu, B.S.; Ward, M.P.; Brookes, V.J. Estimation of the Incidence of Animal Rabies in Punjab, India. PLoS ONE 2019, 14, e0222198. [Google Scholar] [CrossRef] [PubMed] [Green Version]
  25. Amaku, M.; Dias, R.A.; Ferreira, F. Dynamics and Control of Stray Dog Populations. Math. Popul. Stud. 2010, 17, 69–78. [Google Scholar] [CrossRef]
  26. Morters, M.K.; Restif, O.; Hampson, K.; Cleaveland, S.; Wood, J.L.N.; Conlan, A.J.K. Evidence-Based Control of Canine Rabies: A Critical Review of Population Density Reduction. J. Anim. Ecol. 2013, 82, 6–14. [Google Scholar] [CrossRef]
  27. Rattanavipapong, W.; Thavorncharoensap, M.; Youngkong, S.; Genuino, A.J.; Anothaisintawee, T.; Chaikledkaew, U.; Meeyai, A. The Impact of Transmission Dynamics of Rabies Control: Systematic Review. Vaccine 2018, 37, A154–A165. [Google Scholar] [CrossRef]
  28. Hampson, K.; Coudeville, L.; Lembo, T.; Sambo, M.; Kieffer, A.; Attlan, M.; Barrat, J.; Blanton, J.D.; Briggs, D.J.; Cleaveland, S.; et al. Estimating the Global Burden of Endemic Canine Rabies. PLoS Negl. Trop. Dis. 2015, 9, e0003709. [Google Scholar] [CrossRef] [Green Version]
  29. Beyene, T.J.; Mourits, M.C.M.; Kidane, A.H.; Hogeveen, H. Estimating the Burden of Rabies in Ethiopia by Tracing Dog Bite Victims. PLoS ONE 2018, 13, e0192313. [Google Scholar] [CrossRef] [Green Version]
  30. Digafe, R.T.; Kifelew, L.G.; Mechesso, A.F. Knowledge, Attitudes and Practices towards Rabies: Questionnaire Survey in Rural Household Heads of Gondar Zuria District, Ethiopia. BMC Res. Notes 2015, 8, 400. [Google Scholar] [CrossRef] [PubMed] [Green Version]
  31. Soler-Rangel, S.; Jiménez-Restrepo, N.; Nariño, D.; Rosselli, D. Rabies Encephalitis and Extra-Neural Manifestations in a Patient Bitten by a Domestic Cat. Rev. Inst. Med. Trop. Sao Paulo 2020, 62, 1–5. [Google Scholar] [CrossRef]
  32. Wera, E.; Velthuis, A.G.J.; Geong, M.; Hogeveen, H. Costs of Rabies Control: An Economic Calculation Method Applied to Flores Island. PLoS ONE 2013, 8, e83654. [Google Scholar] [CrossRef] [PubMed]
  33. Hiby, E.; Agustina, K.K.; Atema, K.N.; Bagus, G.N.; Girardi, J.; Harfoot, M.; Haryono, Y.; Hiby, L.; Irawan, H.; Kalalo, L.; et al. Dog Ecology and Rabies Knowledge of Owners and Non-Owners in Sanur, a Sub-District of the Indonesian Island Province of Bali. Animals 2018, 8, 112. [Google Scholar] [CrossRef] [PubMed] [Green Version]
  34. Acharya, K.P.; Subedi, D.; Wilson, R.T. Rabies Control in South Asia Requires a One Health Approach. One Health 2021, 12, 100215. [Google Scholar] [CrossRef]
  35. Tenzin; Ward, M.P. Review of Rabies Epidemiology and Control in South, South East and East Asia: Past, Present and Prospects for Elimination. Zoonoses Public Health 2012, 59, 451–467. [Google Scholar] [CrossRef]
  36. Ratsitorahina, M.; Rasambainarivo, J.H.; Raharimanana, S.; Rakotonandrasana, H.; Andriamiarisoa, M.-P.; Rakalomanana, F.A.; Richard, V. Dog Ecology and Demography in Antananarivo, 2007. BMC Vet. Res. 2009, 5, 21. [Google Scholar] [CrossRef] [Green Version]
  37. Otolorin, G.R.; Umoh, J.U.; Dzikwi, A.A. Demographic and Ecological Survey of Dog Population in Aba, Abia State, Nigeria. ISRN Vet. Sci. 2014, 2014, 806849. [Google Scholar] [CrossRef] [Green Version]
  38. Bouaddi, K.; Bitar, A.; Ferssiwi, A.; Bouslikhane, M.; Fitani, A.; Mshelbwala, P.P.; Audu, S.W. Socioecology of the Canine Population in the Province of El Jadida, Morocco. Vet. Med. Int. 2018, 2018, 4234791. [Google Scholar] [CrossRef] [Green Version]
  39. Sambo, M.; Hampson, K.; Changalucha, J.; Cleaveland, S.; Lembo, T.; Lushasi, K.; Mbunda, E.; Mtema, Z.; Sikana, L.; Johnson, P. Estimating the Size of Dog Populations in Tanzania to Inform Rabies Control. Vet. Sci. 2018, 5, 77. [Google Scholar] [CrossRef] [PubMed] [Green Version]
  40. Hossain, M.; Ahmed, K.; Marma, A.S.P.; Hossain, S.; Ali, M.A.; Shamsuzzaman, A.K.M.; Nishizono, A. A Survey of the Dog Population in Rural Bangladesh. Prev. Vet. Med. 2013, 111, 134–138. [Google Scholar] [CrossRef]
  41. Conan, A.; Akerele, O.; Simpson, G.; Reininghaus, B.; van Rooyen, J.; Knobel, D. Population Dynamics of Owned, Free-Roaming Dogs: Implications for Rabies Control. PLoS Negl. Trop. Dis. 2015, 9, e0004177. [Google Scholar] [CrossRef] [Green Version]
  42. Pimburage, R.M.S.; Harischandra, P.A.L.; Gunatilake, M.; Jayasinhe, D.N.; Balasuriya, A.; Amunugama, R.M.S.K. Erratum to ‘a Cross-Sectional Survey on Dog Ecology and Dog Anti-Rabies Vaccination Coverage in Selected Areas in Sri Lanka’ [S.L.Vet.J. 2017, 64:1(A): 1–9]. Sri Lanka Vet. J. 2017, 64, 17. [Google Scholar] [CrossRef] [Green Version]
  43. Atuman, Y.J.; Ogunkoya, A.B.; Adawa, D.A.Y.; Nok, A.J.; Biallah, M.B. Dog Ecology, Dog Bites and Rabies Vaccination Rates in Bauchi State, Nigeria. Int. J. Vet. Sci. Med. 2014, 2, 41–45. [Google Scholar] [CrossRef] [Green Version]
  44. Totton, S.C.; Wandeler, A.I.; Zinsstag, J.; Bauch, C.T.; Ribble, C.S.; Rosatte, R.C.; McEwen, S.A. Stray Dog Population Demographics in Jodhpur, India Following a Population Control/Rabies Vaccination Program. Prev. Vet. Med. 2010, 97, 51–57. [Google Scholar] [CrossRef]
  45. Aiyedun, J.O.; Olugasa, B.O. Identification and Analysis of Dog Use, Management Practices and Implications for Rabies Control in Ilorin, Nigeria. Sokoto J. Vet. Sci. 2012, 10, 1–6. [Google Scholar] [CrossRef] [Green Version]
  46. Punjabi, G.A.; Athreya, V.; Linnell, J.D.C. Using Natural Marks to Estimate Free-Ranging Dog Canis Familiaris Abundance in a Mark-Resight Framework in Suburban Mumbai, India. Trop. Conserv. Sci. 2012, 5, 510–520. [Google Scholar] [CrossRef] [Green Version]
  47. Dias, R.A.; Guilloux, A.; Borba, M.R.; Guarnieri, M.C.D.L.; Prist, R.; Ferreira, F.; Amaku, M.; Neto, J.S.F.; Stevenson, M. Size and Spatial Distribution of Stray Dog Population in the University of São Paulo Campus, Brazil. Prev. Vet. Med. 2013, 110, 263–273. [Google Scholar] [CrossRef] [Green Version]
  48. Tenzin, T.; Ahmed, R.; Debnath, N.C.; Ahmed, G.; Yamage, M. Free-Roaming Dog Population Estimation and Status of the Dog Population Management and Rabies Control Program in Dhaka City, Bangladesh. PLoS Negl. Trop. Dis. 2015, 9, e0003784. [Google Scholar] [CrossRef] [Green Version]
  49. Özen, D.; Böhning, D.; Gürcan, I.S. Estimation of Stray Dog and Cat Populations in Metropolitan Ankara, Turkey. Turkish J. Vet. Anim. Sci. 2016, 40, 7–12. [Google Scholar] [CrossRef]
  50. Cortez-Aguirre, G.R.; Jiménez-Coello, M.; Gutiérrez-Blanco, E.; Ortega-Pacheco, A. Stray Dog Population in a City of Southern Mexico and Its Impact on the Contamination of Public Areas. Vet. Med. Int. 2018, 2018, 2381583. [Google Scholar] [CrossRef] [PubMed]
  51. Silva, J.E.; Rodrigues, T.D.O.; E Silva, A.J.A.; Queiroz, L.H. Evaluating the Movement of Free-Roaming Dogs Using Georeferencing and the Photographic Capture-Recapture Method. Acta Vet. Bras. 2019, 13, 70–76. [Google Scholar] [CrossRef]
  52. Park, N.; Hu, C.; Yu, P.; Kang, C.; Ling, H.; Yen, S. Demography and Welfare Status of Free-Roaming Dogs in Yangmingshan. Prev. Vet. Med. 2019, 166, 49–55. [Google Scholar] [CrossRef]
  53. Kwaghe, A.V.; Okomah, D.; Okoli, I.; Kachalla, M.G.; Aligana, M.; Alabi, O.; Mshelbwala, G.M. Estimation of Dog Population in Nasarawa State Nigeria: A Pilot Study. Pan Afr. Med. J. 2019, 34, 1–12. [Google Scholar] [CrossRef]
  54. Kato, M.; Inukai, Y.; Yamamoto, H.; Kira, S. Survey of the Stray Dog Population and the Health Education Program on the Prevention of Dog Bites and Dog-Acquired Infections: A Comparative Study in Nepal and Okayama Prefecture, Japan. Acta Med. Okayama 2003, 57, 261–266. [Google Scholar] [CrossRef]
  55. Cleaton, J.M.; Blanton, J.D.; Dilius, P.; Ludder, F.; Crowdis, K.; Medley, A.; Chipman, R.; Estime, F.; Maciel, E.; Wallace, R.M. Use of Photography to Identify Free-Roaming Dogs during Sight-Resight Surveys: Impacts on Estimates of Population Size and Vaccination Coverage, Haiti 2016. Vaccine X 2019, 2, 100025. [Google Scholar] [CrossRef]
  56. Belo, V.S.; Struchiner, C.J.; Werneck, G.L.; Teixeira Neto, R.G.; Tonelli, G.B.; de Carvalho Júnior, C.G.; Ribeiro, R.A.N.; da Silva, E.S. Abundance, Survival, Recruitment and Effectiveness of Sterilization of Free-Roaming Dogs: A Capture and Recapture Study in Brazil. PLoS ONE 2017, 12, e0187233. [Google Scholar] [CrossRef] [Green Version]
  57. Arief, R.A.; Hampson, K.; Jatikusumah, A.; Widyastuti, M.D.W.; Sunandar; Basri, C.; Putra, A.A.G.; Willyanto, I.; Estoepangestie, A.T.S.; Mardiana, I.W.; et al. Determinants of Vaccination Coverage and Consequences for Rabies Control in Bali, Indonesia. Front. Vet. Sci. 2017, 3, 123. [Google Scholar] [CrossRef] [Green Version]
  58. Gill, G.S.; Singh, B.B.; Dhand, N.K.; Aulakh, R.S.; Ward, M.P.; Brookes, V.J. Stray Dogs and Public Health: Population Estimation in Punjab, India. Vet. Sci. 2022, 9, 75. [Google Scholar] [CrossRef] [PubMed]
  59. Rinzin, K.; Tenzin, T.; Robertson, I. Size and Demography Pattern of the Domestic Dog Population in Bhutan: Implications for Dog Population Management and Disease Control. Prev. Vet. Med. 2016, 126, 39–47. [Google Scholar] [CrossRef] [PubMed]
  60. Tiwari, H.K.; Vanak, A.T.; O’Dea, M.; Gogoi-Tiwari, J.; Robertson, I.D. A Comparative Study of Enumeration Techniques for Free-Roaming Dogs in Rural Baramati, District Pune, India. Front. Vet. Sci. 2018, 5, 104. [Google Scholar] [CrossRef]
  61. Meunier, N.V.; Gibson, A.D.; Corfmat, J.; Mazeri, S.; Handel, I.G.; Gamble, L.; Bronsvoort, B.M.C.; Mellanby, R.J. A Comparison of Population Estimation Techniques for Individually Unidentifiable Free-Roaming Dogs. BMC Vet. Res. 2019, 15, 190. [Google Scholar] [CrossRef] [PubMed] [Green Version]
  62. Gsell, A.S.; Knobel, D.L.; Cleaveland, S.; Kazwala, R.R.; Vounatsou, P.; Zinsstag, J. Domestic Dog Demographic Structure and Dynamics Relevant to Rabies Control Planning in Urban Areas in Africa: The Case of Iringa, Tanzania. BMC Vet. Res. 2012, 8, 236. [Google Scholar] [CrossRef] [PubMed] [Green Version]
  63. Shah, S.I. Ecology and Demography of the Dog Population in Rawalpindi District Ecology and Demography of the Dog Population; Arid Agriculture University Rawalpindi: Rawalpindi, Pakistan, 2015. [Google Scholar]
  64. Chaudhari, A. Baseline Survey for Street Dogs in Haryana State, India Baseline Survey for Street Dogs in Haryana State, India June and October 2014. Stray Feral Anim. Popul. Collect. 2014, 3, 1–24. Available online: https://www.wellbeingintlstudiesrepository.org/cgi/viewcontent.cgi?article=1005&context=strfapop (accessed on 1 November 2021).
  65. Aiyedun, J.; Olugasa, B. Use of Aerial Photograph to Enhance Dog Population Census in Ilorin, Nigeria. Sokoto J. Vet. Sci. 2012, 10, 22–27. [Google Scholar] [CrossRef] [Green Version]
Figure 1. Map of Herat city (study area) and its urban districts. (D = district).
Animals 13 01126 g001
Figure 2. Flowchart of the data collection through field survey using PSR method. 391 photos were excluded due to poor quality and duplication.
Animals 13 01126 g002
Figure 3. Total number of identified FRDs in 15 districts of Herat city during the survey period.
Animals 13 01126 g003
Figure 4. Health status of FRDs during the survey based on visual observation (direct observation during the survey or from reviewing photographs).
Animals 13 01126 g004
Figure 5. Selected images of dogs surveyed. Evidence of emaciation and skin lesion or dermatitis in FRDs recorded in Herat city.
Animals 13 01126 g005
Figure 6. Body-condition score (BCS) of FRDs (assessed based on visual observation with regards to features that the ACIM organization has defined for each category of body-condition scoring of dogs).
Animals 13 01126 g006
Figure 7. Images of FRDs in Herat city foraging edible materials from uncollected garbage along the streets and sidewalks.
Animals 13 01126 g007
Figure 8. Group structure of FRD population during the survey period in Herat city. UM/UF (one male with one female), UM/MF (one male with multiple females), MM/MF (multiple males with multiple females), MM/UF (multiple males with one female), MM/0 (group of multiple males), FF/0 (group of multiple females), MUN/0 (group of multiple unverified gender), UUN/UM (one of unverified gender with one male), UUN/UF (one of unverified gender with one female), UM/MUN (one male with multiple of unverified gender), UF/MUN (one female with multiple of unverified gender), UUN/MF (one of unverified gender with multiple females), MUN/MMF (multiple of unverified gender with multiple males and females).
Animals 13 01126 g008
Figure 9. Social behaviour/structure of FRD population during the survey period in each district of Herat city.
Animals 13 01126 g009
Table 1. Demographic details (sex, age distribution and reproductive status) of FRDs observed in 15 districts of Herat city.
DistrictsTotal DogsSEXAge CategoryReproductive Status
Male (%)Female (%)Nonverifiable (%)Puppy (%)Young (%)Adult (%)Pregnant (%)Lactating (%)Female in Oestrus (%)Nonverifiable (%)
1st3131 (100)0 (0)0 (0)1 (3)3 (10)27 (87)0 (0)0 (0)0 (0)0 (0)
2nd2717 (63)5 (18.5)5 (18.5)0 (0)2 (7)25 (93)1 (20)1 (20)0 (0)3 (60)
3rd4829 (60.5)13 (27)6 (12.5)1 (2)9 (19)38 (79)0 (0)2 (15)0 (0)11 (85)
4th4731 (66)9 (19)7 (15)5 (11)6 (13)36 (76)0 (0)1 (11)2 (22)6 (67)
5th12373 (59)22 (18)28 (23)3 (2)23 (19)97 (79)4 (18)1 (4)3 (14)14 (64)
6th9462 (66)19 (20)13 (14)6 (6)2 (2)86 (92)2 (10.5)2 (10.5)2 (10.5)13 (68.5)
7th3422 (65)9 (26)3 (9)0 (0)3 (9)31 (91)1 (11)1 (11)0 (0)7 (78)
8th5324 (45)18 (34)11 (21)7 (13)2 (4)44 (83)1 (5.5)1(5.5)1 (5.5)15 (83.5)
9th10752 (48.5)18 (17)37 (34.5)4 (4)14 (13)89 (83)0 (0)4 (22)1 (6)13 (72)
10th2817 (61)8 (28)3 (11)1 (3.5)1 (3.5)26 (93)0 (0)1 (12)0 (0)7 (88)
11th4330 (70)8 (19)5 (11)1 (2)0 (0)42 (98)1 (12)0 (0)0 (0)7 (88)
12th9751 (52)25 (26)21 (22)6 (6)14 (15)77 (79)3 (12)1 (4)1(4)20 (80)
13th4227 (64)10 (24)5 (12)1 (2)4 (10)37 (88)1 (10)1 (10)1 (10)7 (70)
14th4835 (73)6 (12.5)7 (14.5)2 (4)5 (11)41 (84)1 (17)0 (0)1 (17)4 (66)
15th10661 (58)27 (25)18 (17)1 (1)8 (8)97 (91)0 (0)2 (7)5 (19)20 (74)
Total928562 (61)197 (21)169 (18)39 (4.20)96 (10.34)793 (85.45)15 (7.61)18 (9.13)17 (8.62)147 (74.62)
Chi-Square and
p-value
χ2 = 65.33, df = 28, p < 0.001χ2 = 57.63, df = 28, p < 0.001χ2 = 51.81, df = 39, p < 0.08
The age of FRDs were estimated, based on visual observation, as puppy (<6 months), young (6 months to 1 year) and adult (>1 year). The percentages of sex and age categories in each district were calculated based on the total dogs in each district, and the reproductive status was calculated from the total female dogs in each district.
Table 2. Details of locations FRDs were sighted during the survey in each district of Herat city.
Location during the Survey
DistrictsRoad (%)Sidewalk (%)Park (%)Playground (%)Field (%)Parking Lot (%)Underneath a Car (%)Bush (%)Dump Sites= (%)Slaughterhouse (%)Biological-Waste-Disposal Site (%)Boulevard (%)
1st1 (3)25 (81)0 (0)0 (0)0 (0)5 (16)0 (0)0 (0)0 (0)0 (0)0 (0)0 (0)
2nd17 (63)3 (11)0 (0)0 (0)0 (0)1 (4)0 (0)0 (0)1 (4)0 (0)0 (0)5 (18)
3rd24 (50)13 (27)0 (0)0 (0)0 (0)0 (0)0 (0)0 (0)2 (4)0 (0)0 (0)9 (19)
4th17 (36)29 (62)0 (0)0 (0)0 (0)0 (0)0 (0)0 (0)0 (0)0 (0)0 (0)1 (2)
5th53 (43)39 (32)4 (3)1 (1)2 (1)0 (0)0 (0)0 (0)2 (2)0 (0)0 (0)22 (18)
6th35 (37)30 (32)0 (0)0 (0)2 (2)0 (0)0 (0)0 (0)26 (28)0 (0)0 (0)1 (1)
7th22 (65)8 (23)1 (3)0 (0)0 (0)0 (0)0 (0)1 (3)0 (0)0 (0)0 (0)2 (6)
8th34 (64)16 (30)0 (0)0 (0)0 (0)0 (0)0 (0)0 (0)3 (6)0 (0)0 (0)0 (0)
9th33 (31)38 (35)8 (7)0 (0)17 (16)6 (6)0 (0)0 (0)1 (1)0 (0)0 (0)4 (4)
10th12 (43)3 (11)0 (0)0 (0)0 (0)0 (0)0 (0)0 (0)6 (21)0 (0)0 (0)7 (25)
11th27 (63)6 (14)0 (0)0 (0)0 (0)0 (0)0 (0)0 (0)10 (23)0 (0)0 (0)0 (0)
12th27 (28)46 (48)0 (0)1 (1)6 (6)12 (12)2 (2)1 (1)0 (0)0 (0)0 (0)2 (2)
13th9 (21)8 (19)0 (0)0 (0)5 (12)0 (0)0 (0)0 (0)0 (0)20 (48)0 (0)0 (0)
14th19 (39.5)18 (37.5)0 (0)0 (0)9 (19)0 (0)0 (0)0 (0)0 (0)2 (4)0 (0)0 (0)
15th61 (57)22 (21)0 (0)0 (0)15 (14)0 (0)0 (0)0 (0)7 (7)0 (0)1 (1)0 (0)
Total391 (42.13)304 (32.76)13 (1.40)2 (0.22)56 (6.03)24 (2.59)2 (0.22)2 (0.22)58 (6.25)22 (2.37)1 (0.10)53 (5.71)
Chi-Square and p-valueχ2 = 957.7, df = 154, p < 0.0001
Table 3. Details of reactions of sighted FRDs during the survey period in each district of Herat city.
Reaction during the Survey
DistrictsApproaches (Friendly) (%)Approaches (Slowly, Low Posture) (%)Growls/Barks (%)Attacks the Surveyor (%)Neutral (e.g., Ignores the Surveyor) (%)Runs Away (%)
1st1 (3)12 (39)2 (6)0 (0)9 (29)7 (23)
2nd0 (0)4 (15)0 (0)1 (4)13 (48)9 (33)
3rd0 (0)12 (25)4 (8)1 (2)12 (25)19 (40)
4th0 (0)0 (0)2 (4)1 (2)17 (36)27 (58)
5th1 (1)3 (2.4)4 (3.2)1 (1)52 (42)62 (50.4)
6th2 (2)31 (33)3 (3)1 (1)11 (12)46 (49)
7th1 (3)1 (3)1 (3)0 (0)18 (53)13 (38)
8th0 (0)19 (36)1 (2)2 (4)8 (15)23 (43)
9th0 (0)3 (3)6 (6)055 (51)43 (40)
10th0 (0)13 (46)1 (4)0 (0)1 (4)13 (46)
11th0 (0)17 (40)2 (5)0 (0)1 (2)23 (53)
12th0 (0)3 (3)7 (7)0 (0)49 (51)38 (39)
13th0 (0)2 (5)4 (9.5)0 (0)16 (38)20 (47.5)
14th1 (2)11 (23)4 (8)1 (2)13 (27)18 (38)
15th1 (1)45 (42)5 (5)2 (2)8 (8)45 (42)
Total7 (0.75)176 (18.97)46 (4.96)10 (1.07)283 (30.5)406 (43.75)
Chi-Square and p-valueχ2 = 278.9, df = 70, p < 0.0001
Table 4. Details of activity, social behaviour and sightings within 20 m of garbage points for FRDs sighted across fifteen districts of Herat city.
DistrictsActivitySocial BehaviourProximity to Garbage Point
Active (%)Inactive (%)Feeding/Foraging (%)Single (%)In Packs (%)≤20 m (%)>20 m (20)
1st15 (48)14 (45)2 (7)13 (42)18 (48)5 (16)26 (84)
2nd14 (52)7 (26)6 (22)8 (30)19 (70)20 (74)7 (26)
3rd25 (52)16 (33)7 (15)14 (29)34 (71)24 (50)24 (50)
4th25 (53)21 (45)1 (2)15 (32)32 (68)27 (57)20 (43)
5th76 (62)27 (22)20 (16)60 (49)63 (51)35 (28)88 (71)
6th60 (64)25 (26.5)9 (9.5)23 (24)71 (76)66 (70)28 (30)
7th20 (59)8 (23.5)6 (17.5)15 (44)19 (56)21 (62)13 (38)
8th25 (47)20 (38)8 (15)15 (28)38 (72)37 (70)16 (30)
9th61 (57)35 (33)11 (10)33 (31)74 (69)25 (23)82 (77)
10th15 (54)10 (36)3 (10)2 (7)26 (93)18 (64)10 (34)
11th24 (56)15 (35)4 (9)14 (33)29 (67)31 (72)12 (28)
12th48 (50)40 (41)9 (9)36 (37)61 (63)37 (38)60 (62)
13th25 (60)14 (33)3 (7)16 (38)26 (62)13 (31)29 (69)
14th29 (60)11 (23)8 (17)4 (8)44 (92)33 (69)15 (31)
15th67 (63)34 (32)5 (5)31 (29)75 (71)49 (46)57 (54)
Total529 (57)297 (32)102 (11)299 (32)629 (68)441 (48)487 (52)
Chi-square and p valueχ2 = 38.70, df = 28, p < 0.08χ2 = 45.10, df = 14, p < 0.0001χ2 = 127.9, df = 14, p < 0.0001
Disclaimer/Publisher’s Note: The statements, opinions and data contained in all publications are solely those of the individual author(s) and contributor(s) and not of MDPI and/or the editor(s). MDPI and/or the editor(s) disclaim responsibility for any injury to people or property resulting from any ideas, methods, instructions or products referred to in the content.

