
Sympathetic Arousal Detection in Horses Using Electrodermal Activity


Abstract
:Simple Summary
Abstract
1. Introduction
2. Materials and Methods
2.1. Animals
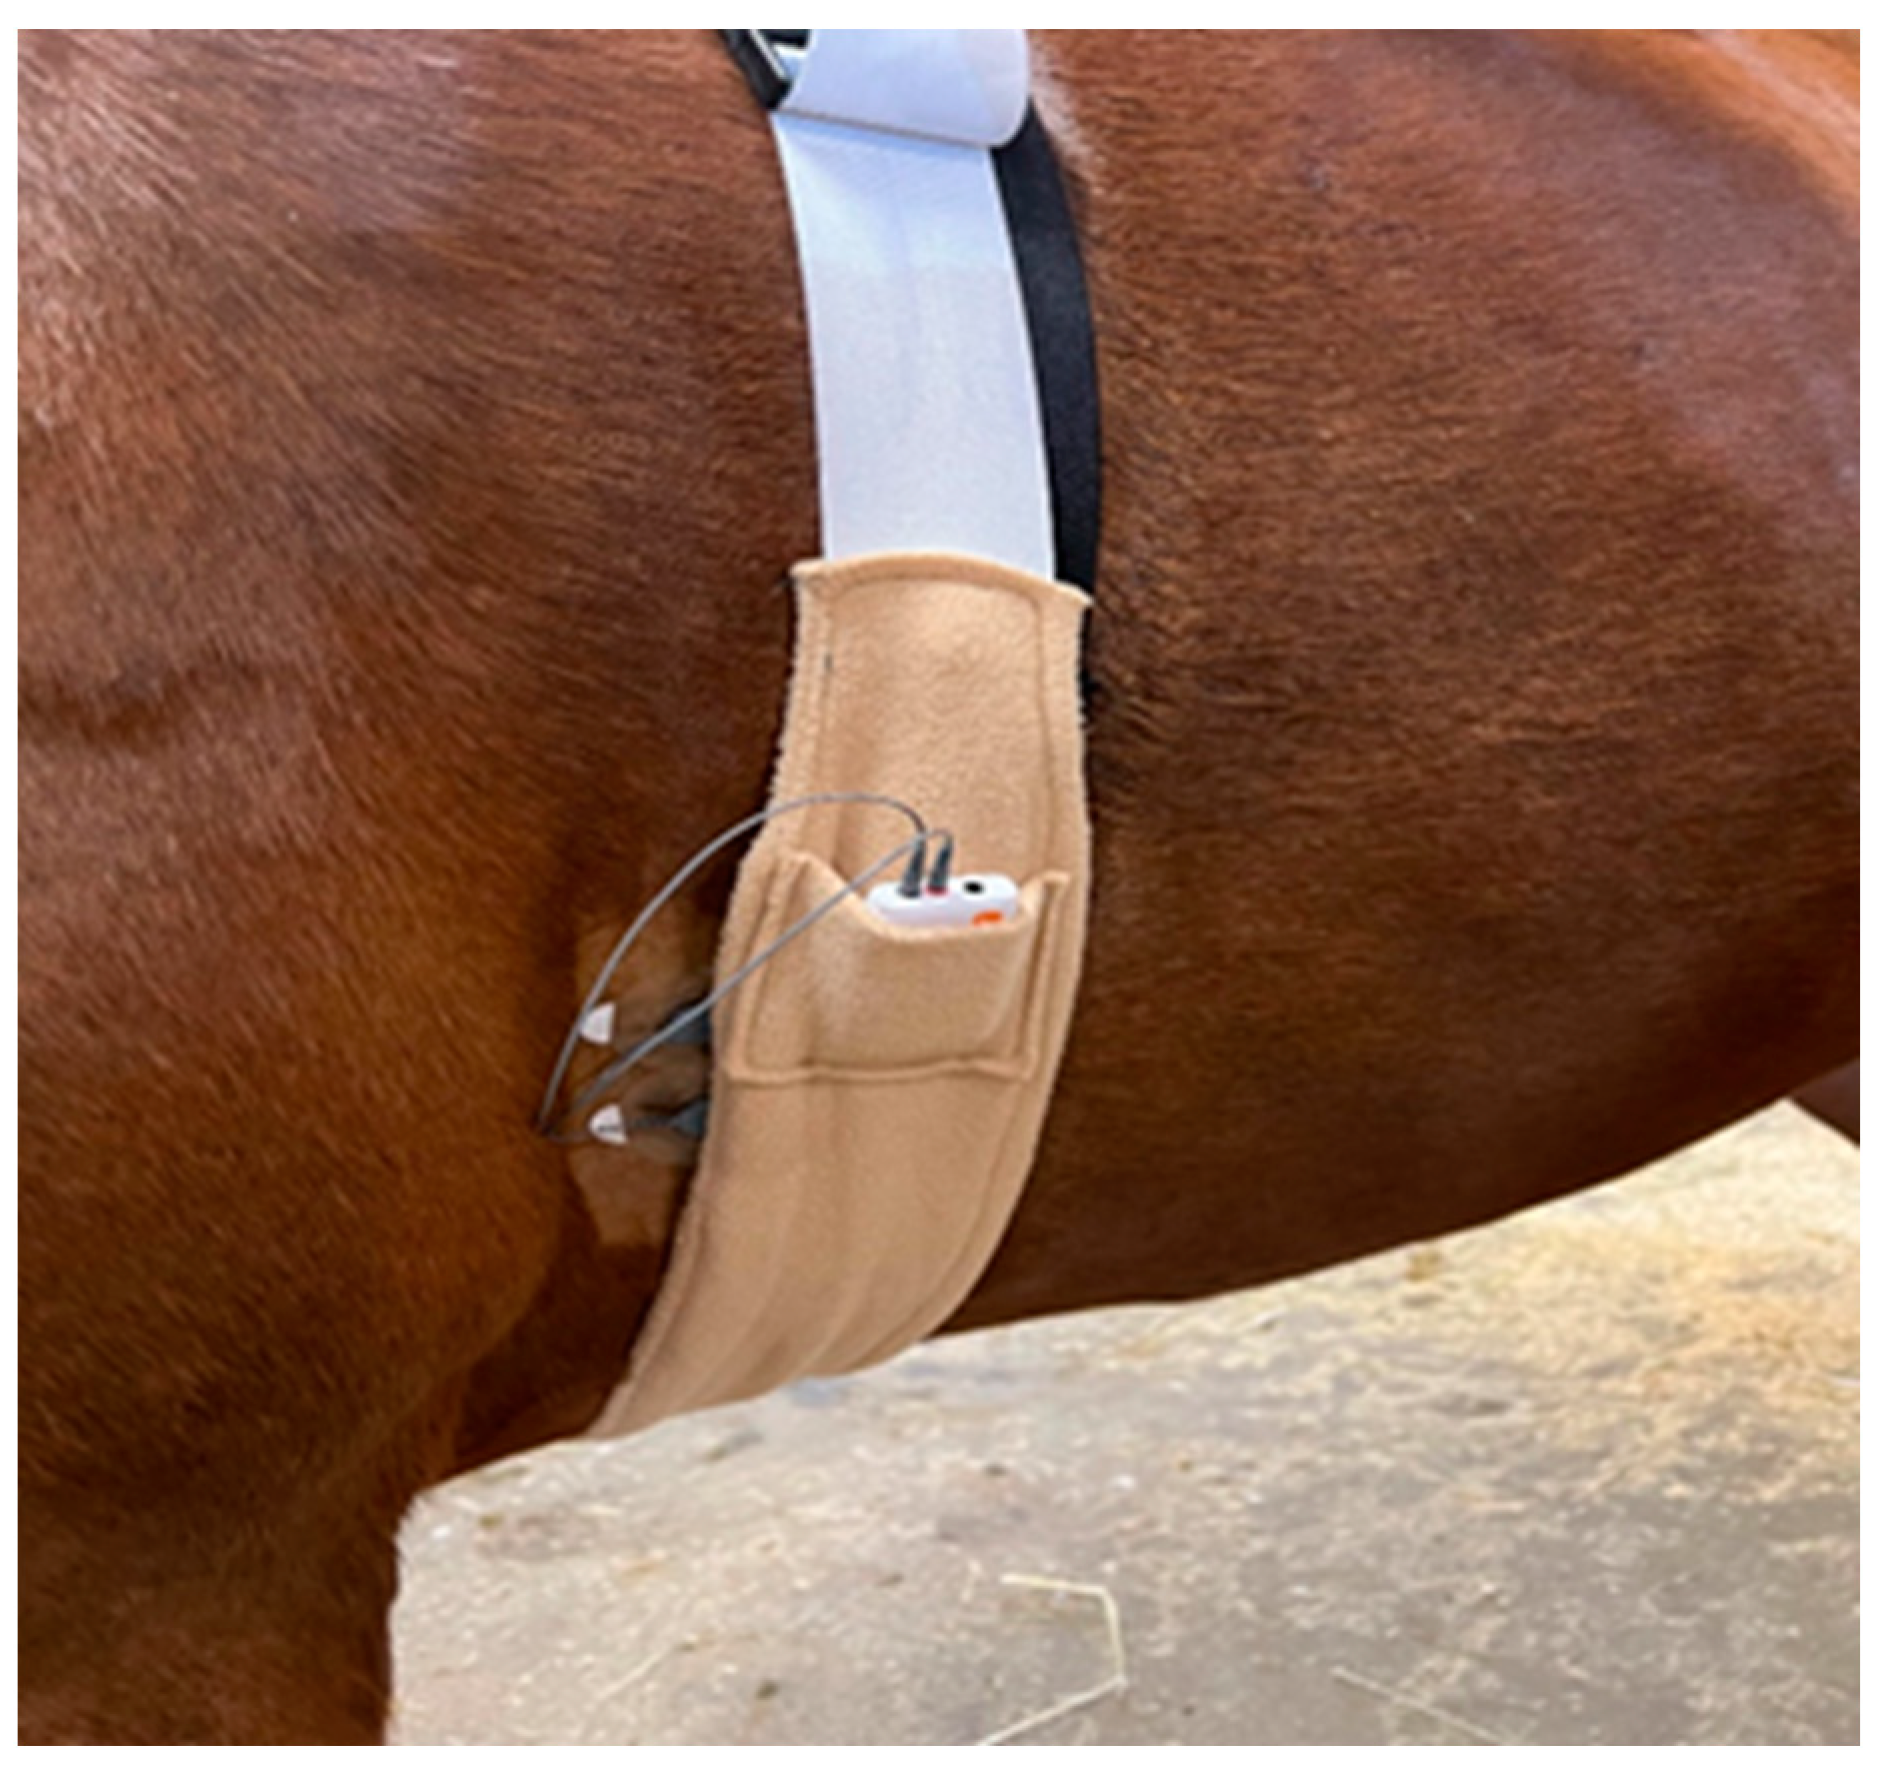
2.2. Device Setup
2.3. Protocol
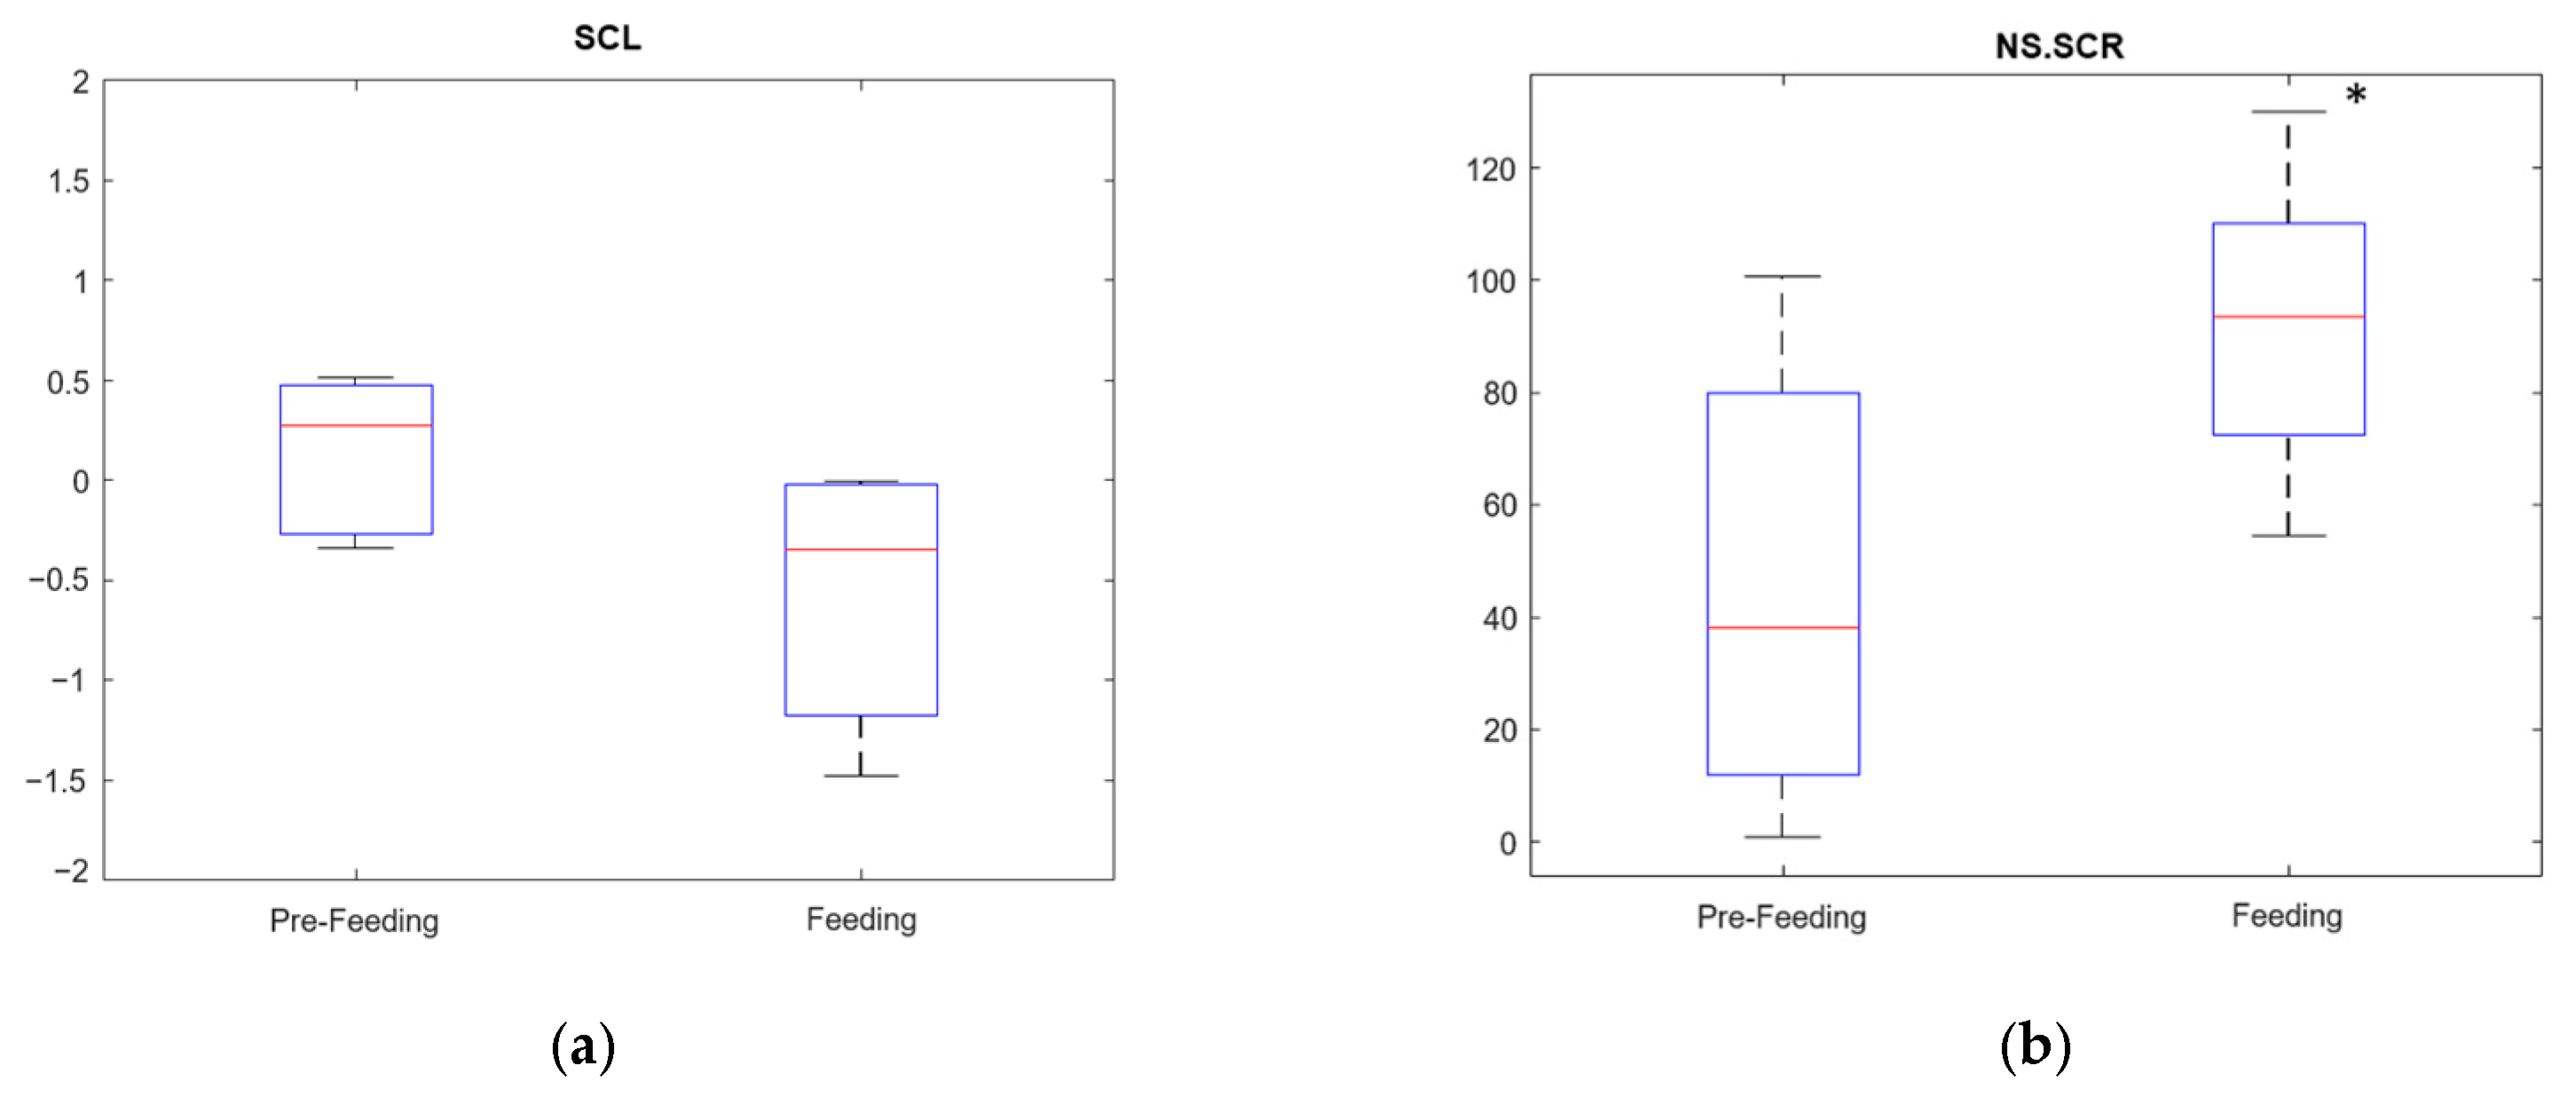
- Feeding test: Feeding tests were carried out at the animal’s regular feeding time at 2:00 pm [42]. For each animal, a continuous 4 min segment was extracted, comprising 2 min of baseline (pre-feeding) data followed by a 2 min feeding stage. Animals were fed hay followed by grain on their normal feeding schedule in their assigned stall. Maintaining their normal schedule avoided additional disturbances that could create undesirable arousal linked to a change in their routine. The recording was performed for four animals at a time.
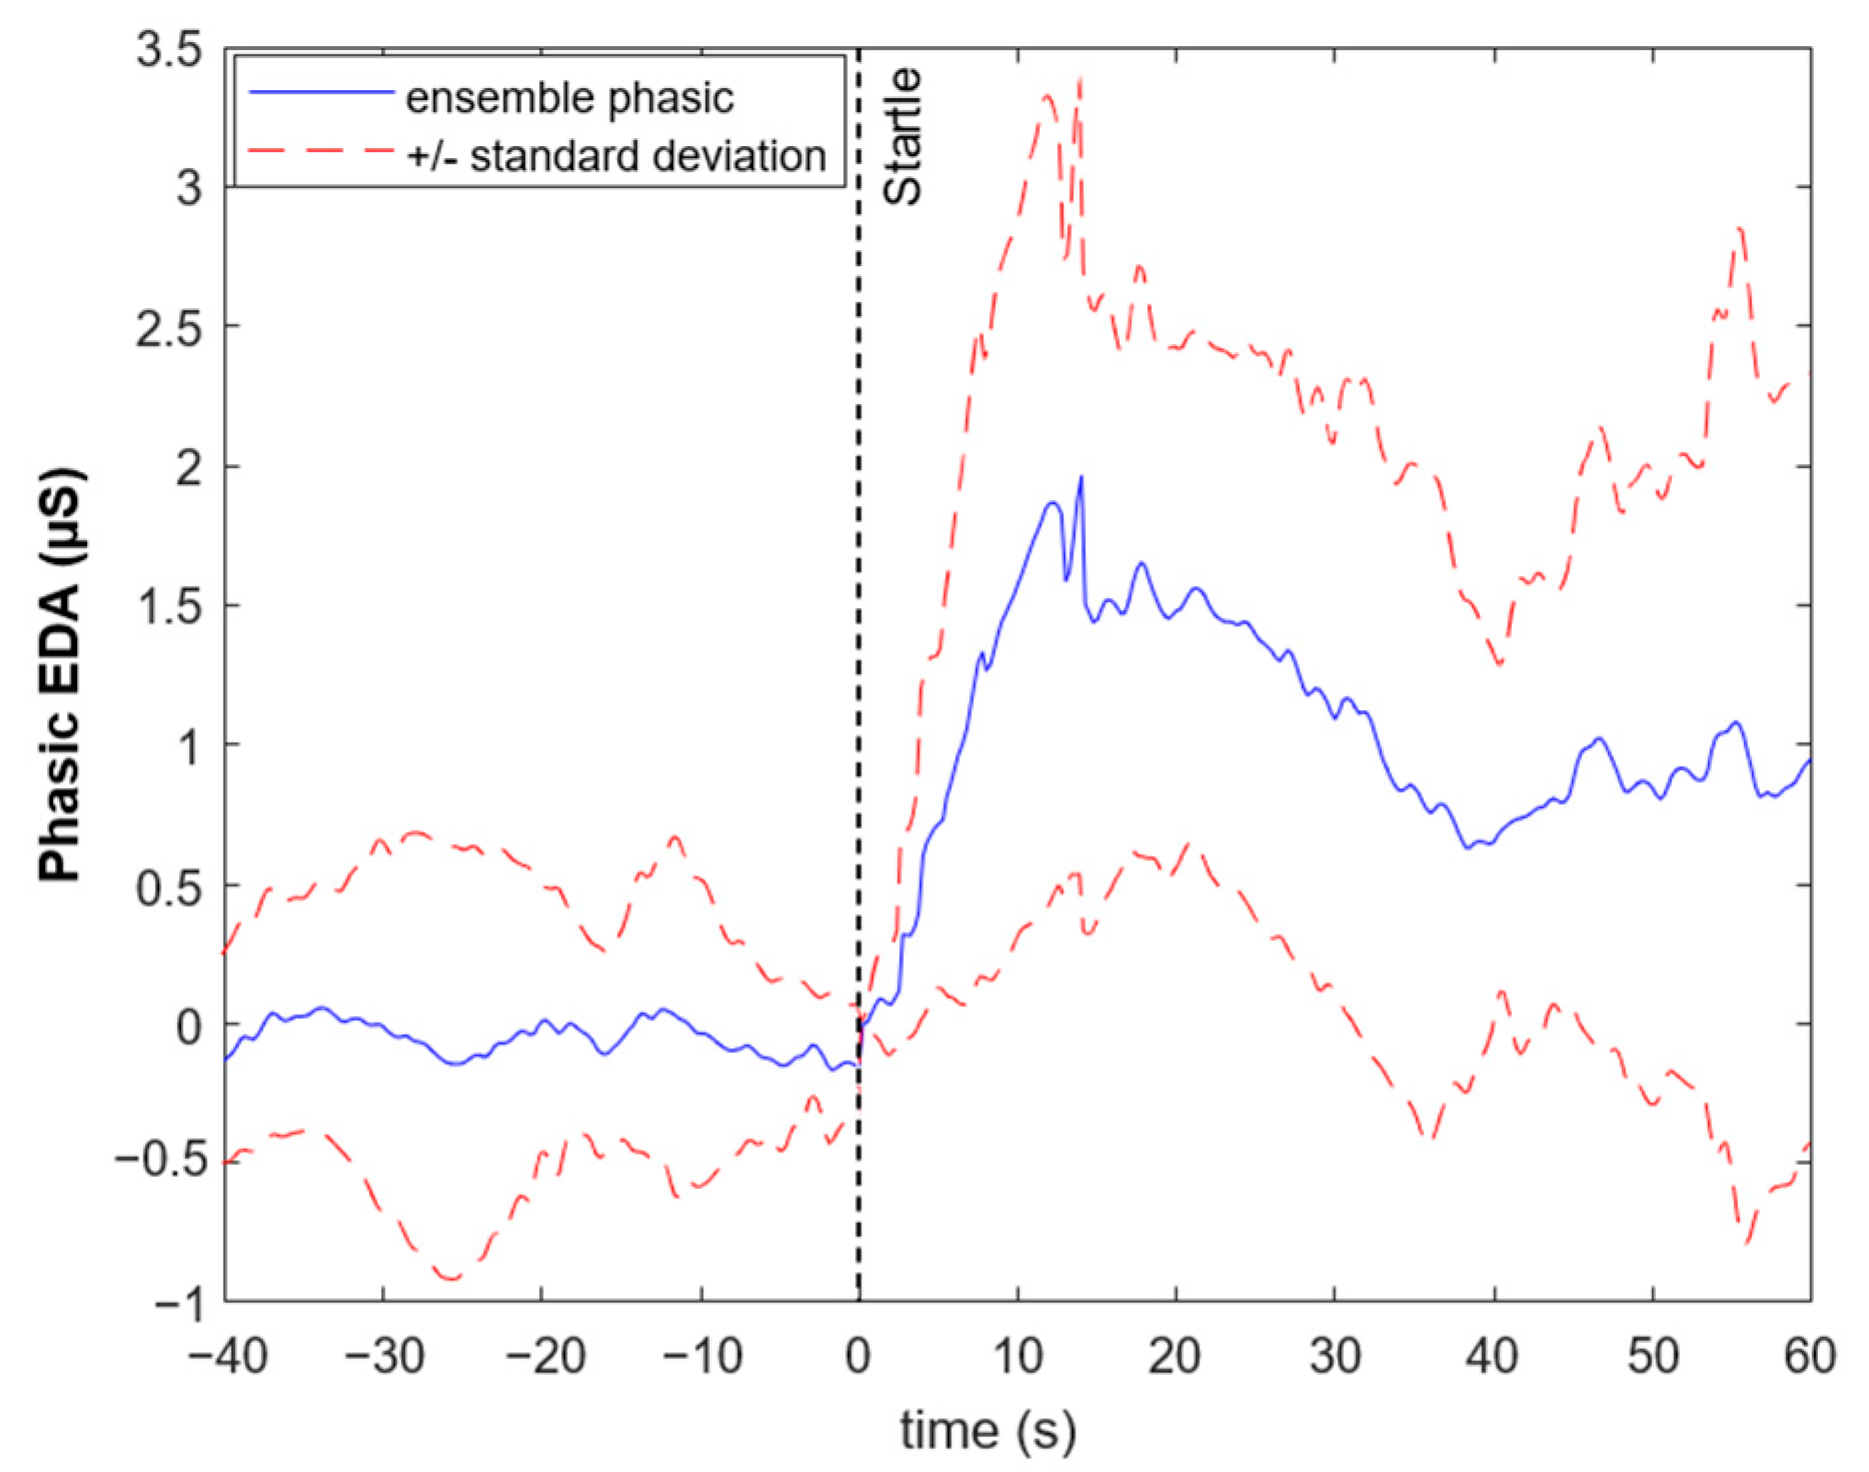
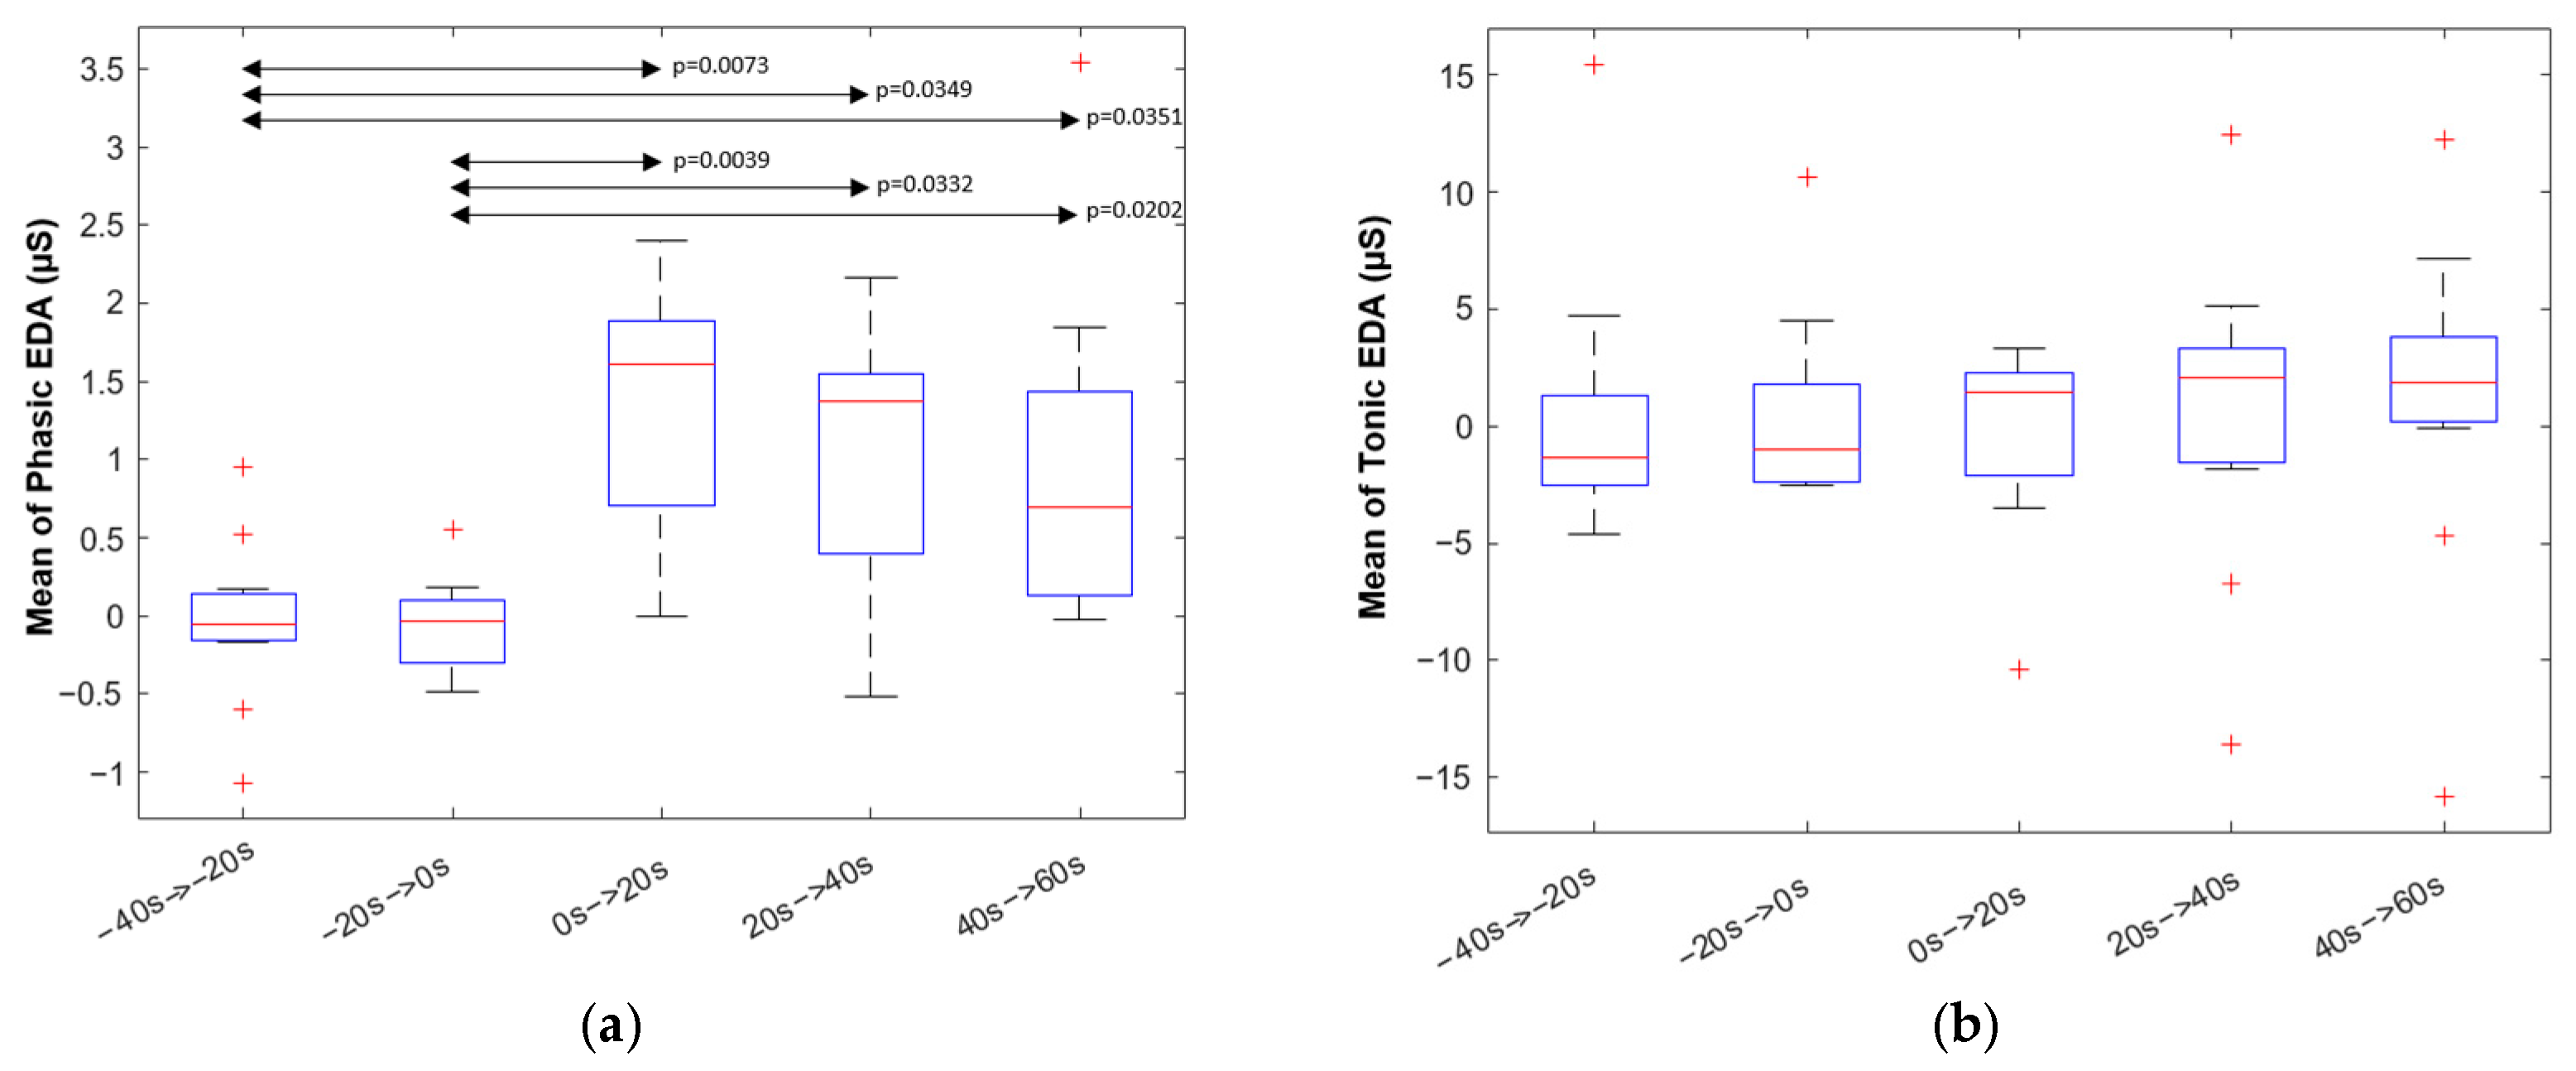
- Startle test: In the Startle test [22], the horses were taken one by one to a familiar, quiet, covered arena by an experienced handler familiar to the horses. The same handler handled all horses used. The horse was stood quietly in front of the solid wall that surrounds the arena. First, two minutes of baseline data were recorded. After that, a rainbow umbrella was opened abruptly from behind the wall and spun for one minute. The umbrella was positioned in the visual field of the horse. Data recording continued for two minutes after the conclusion of the spinning. Accordingly, the total length of the recording for the Startle test was 5 min (2 min baseline, 1 min after umbrella was opened, and 2 min after umbrella was removed).
2.4. EDA Signal Processing
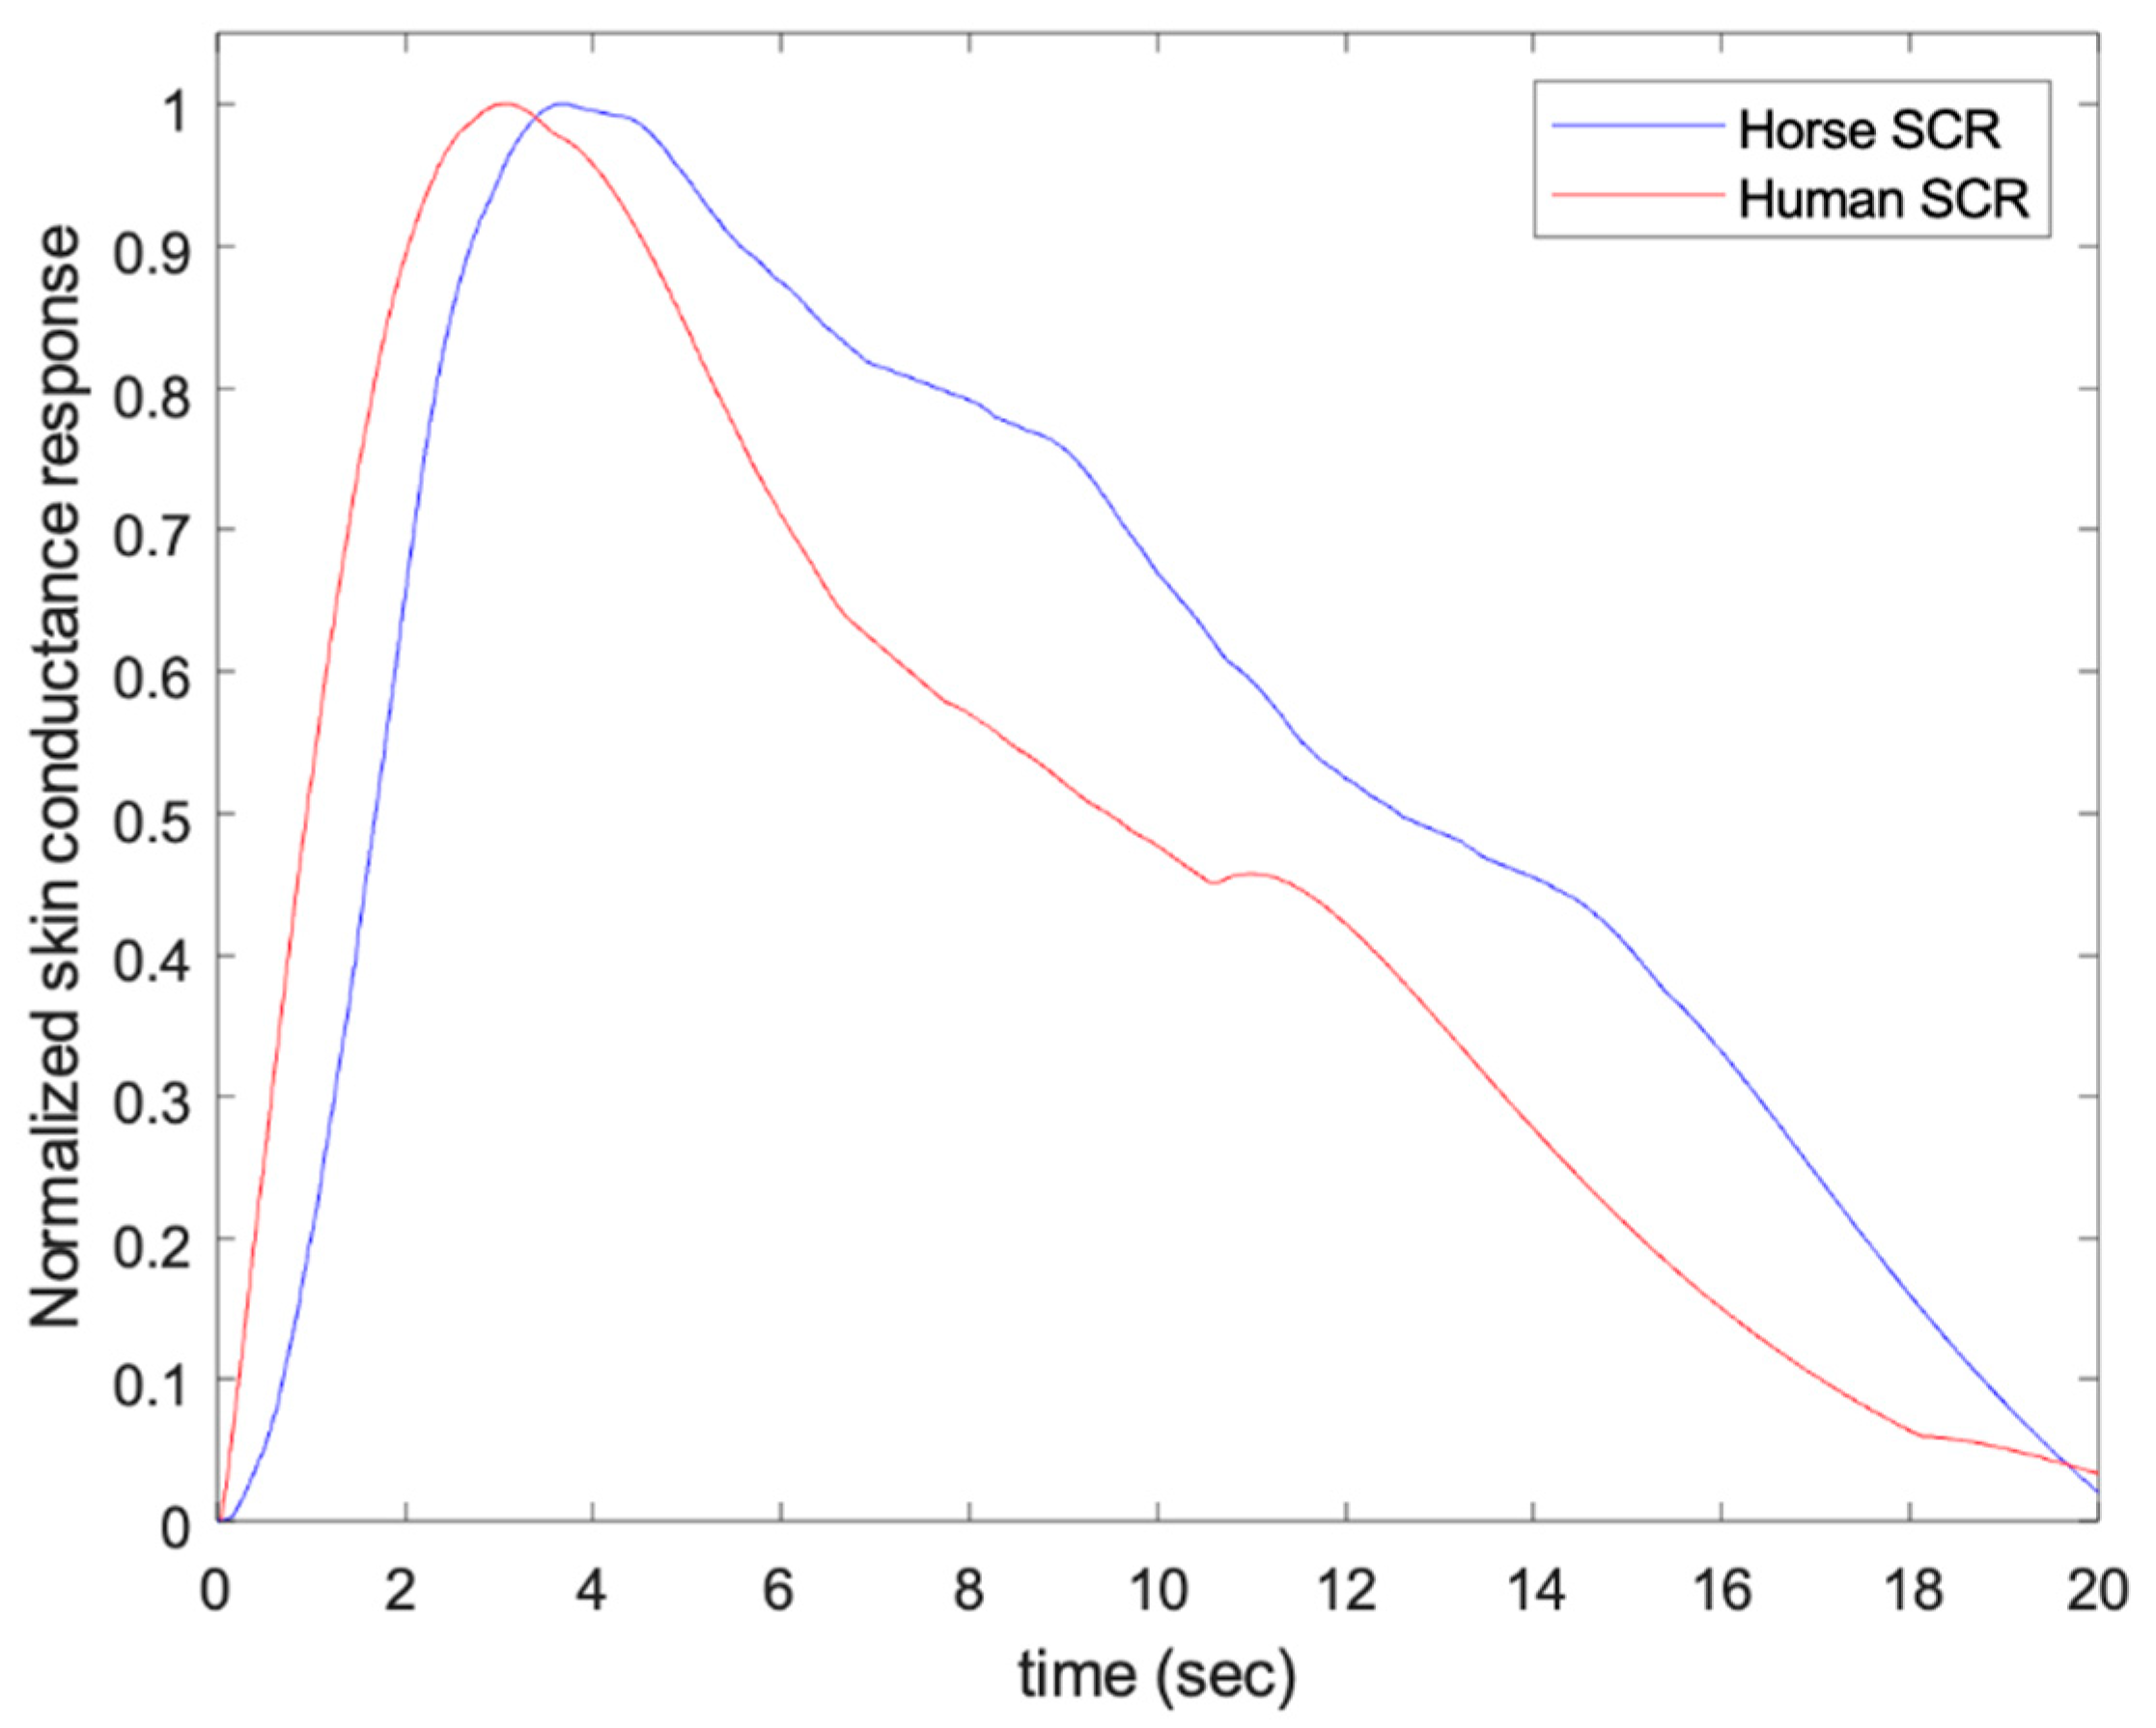
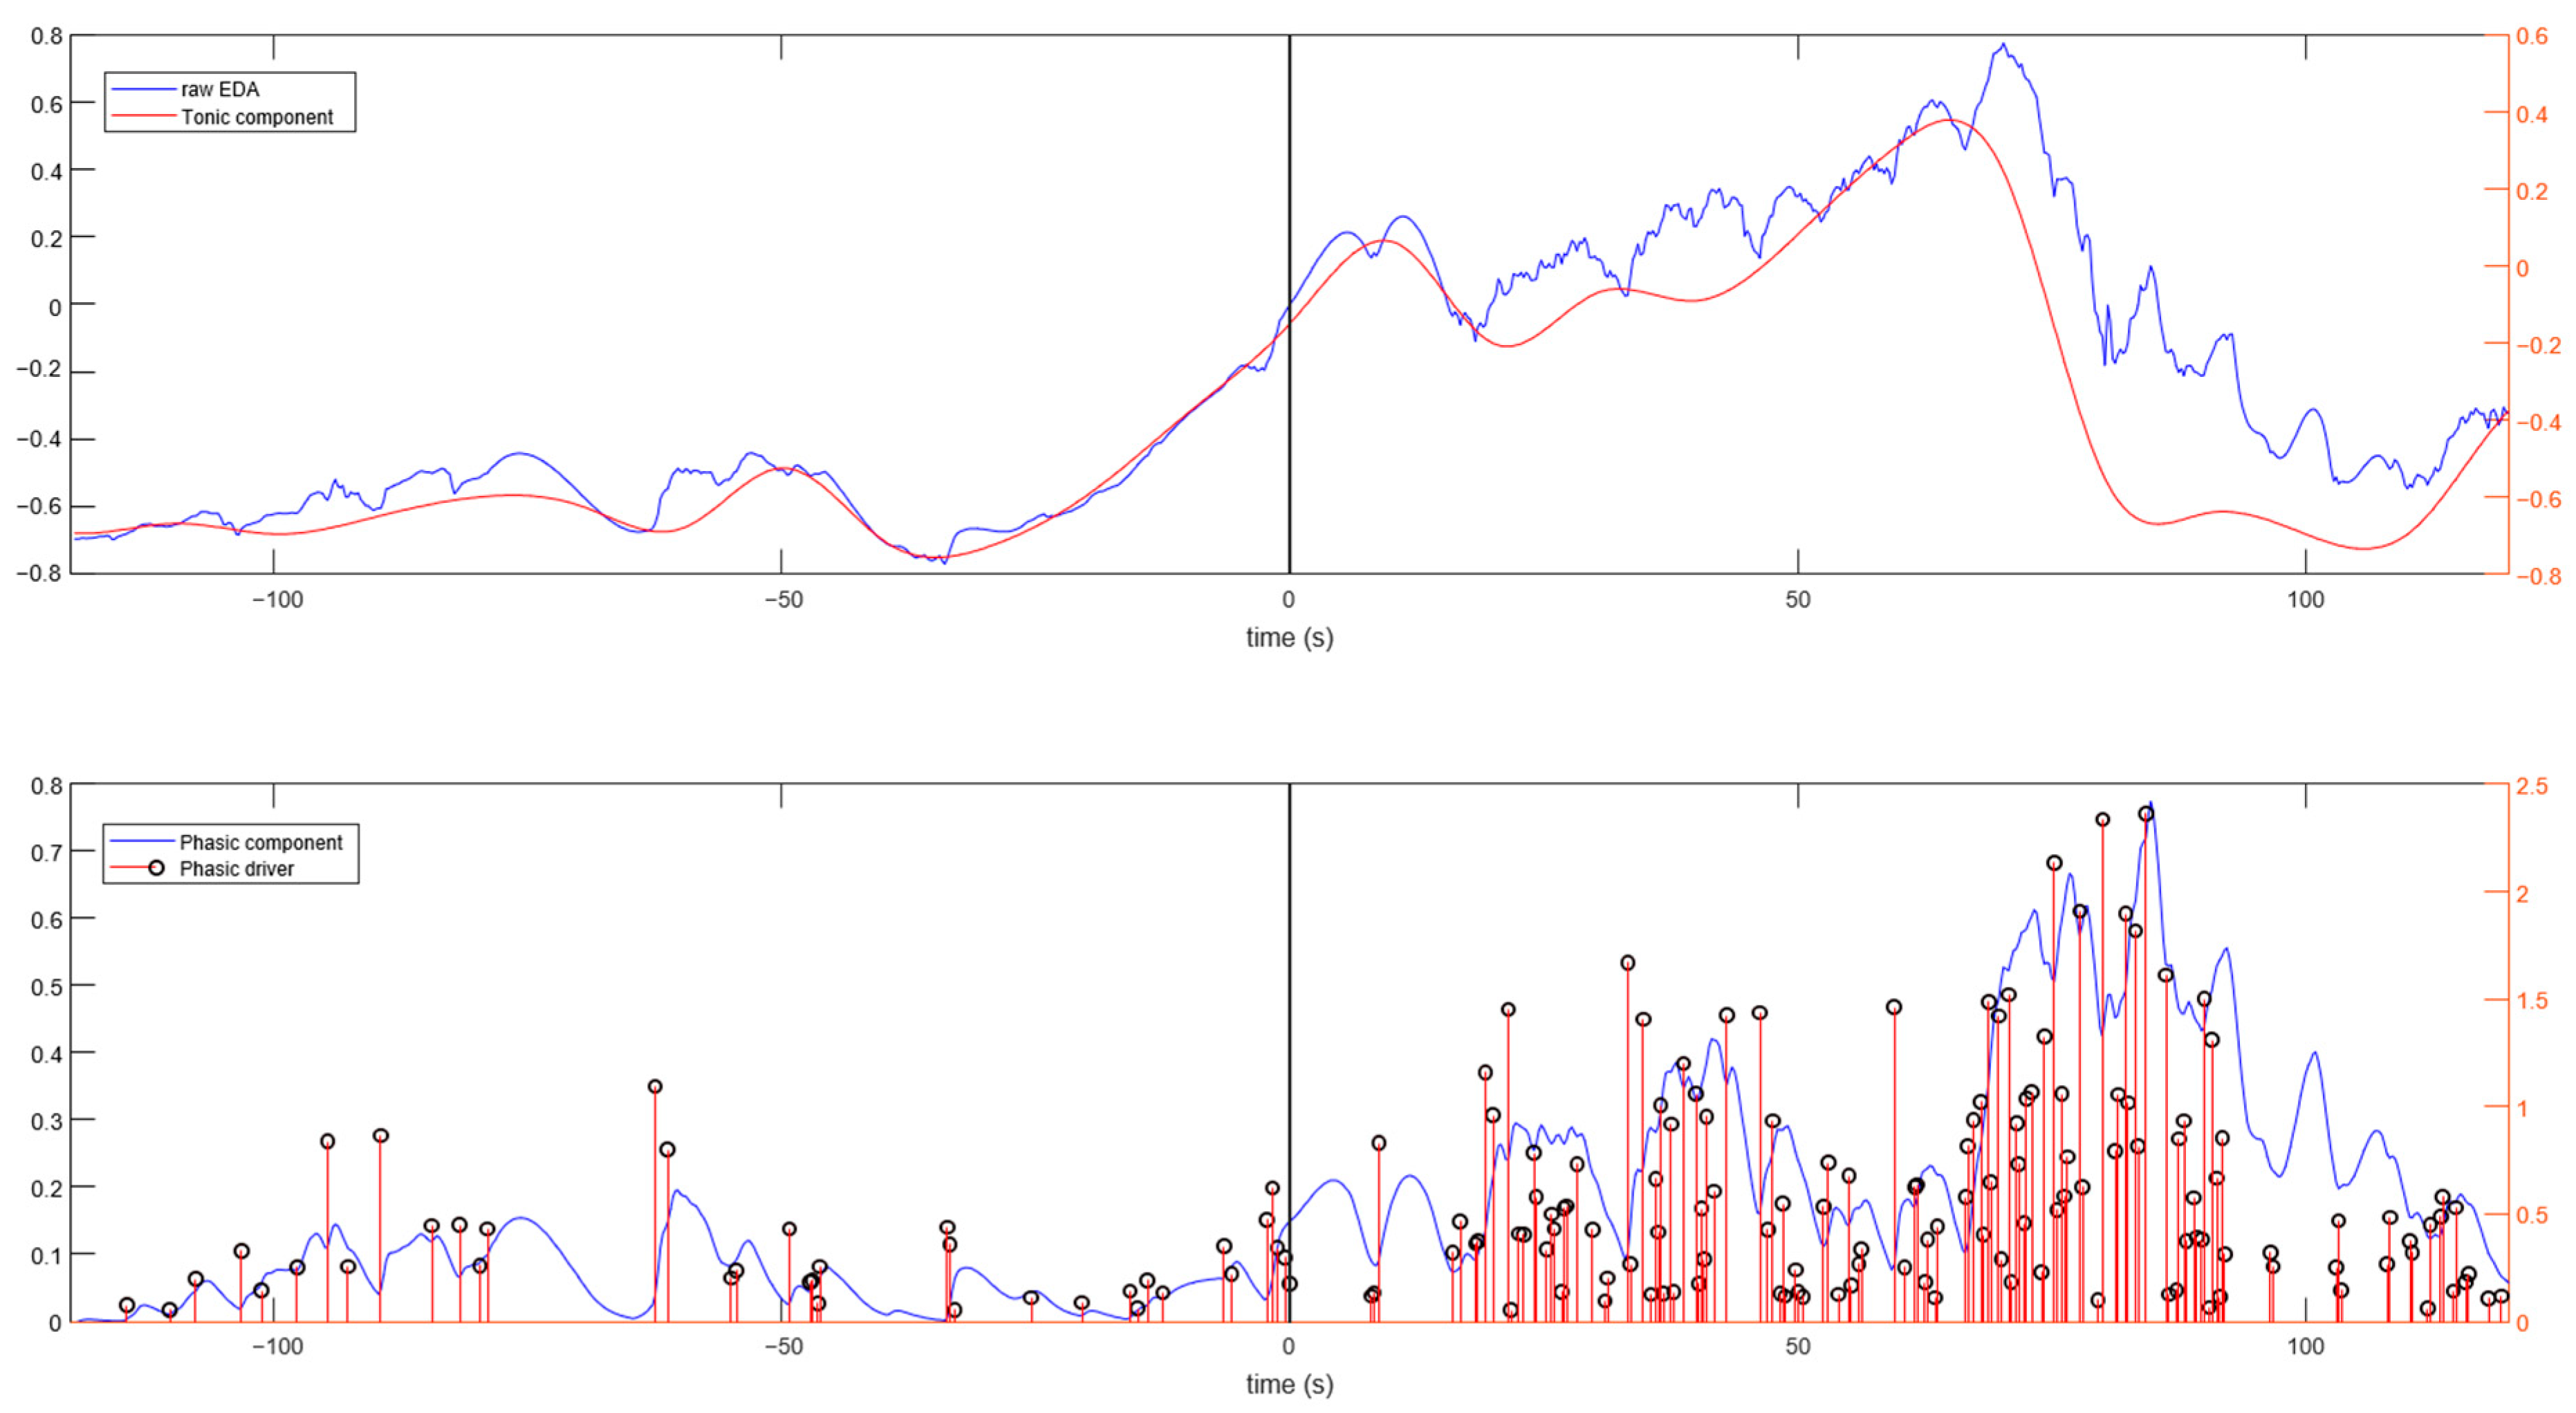
2.4.1. Preprocessing of EDA Data
2.4.2. Time-Domain Indices of EDA
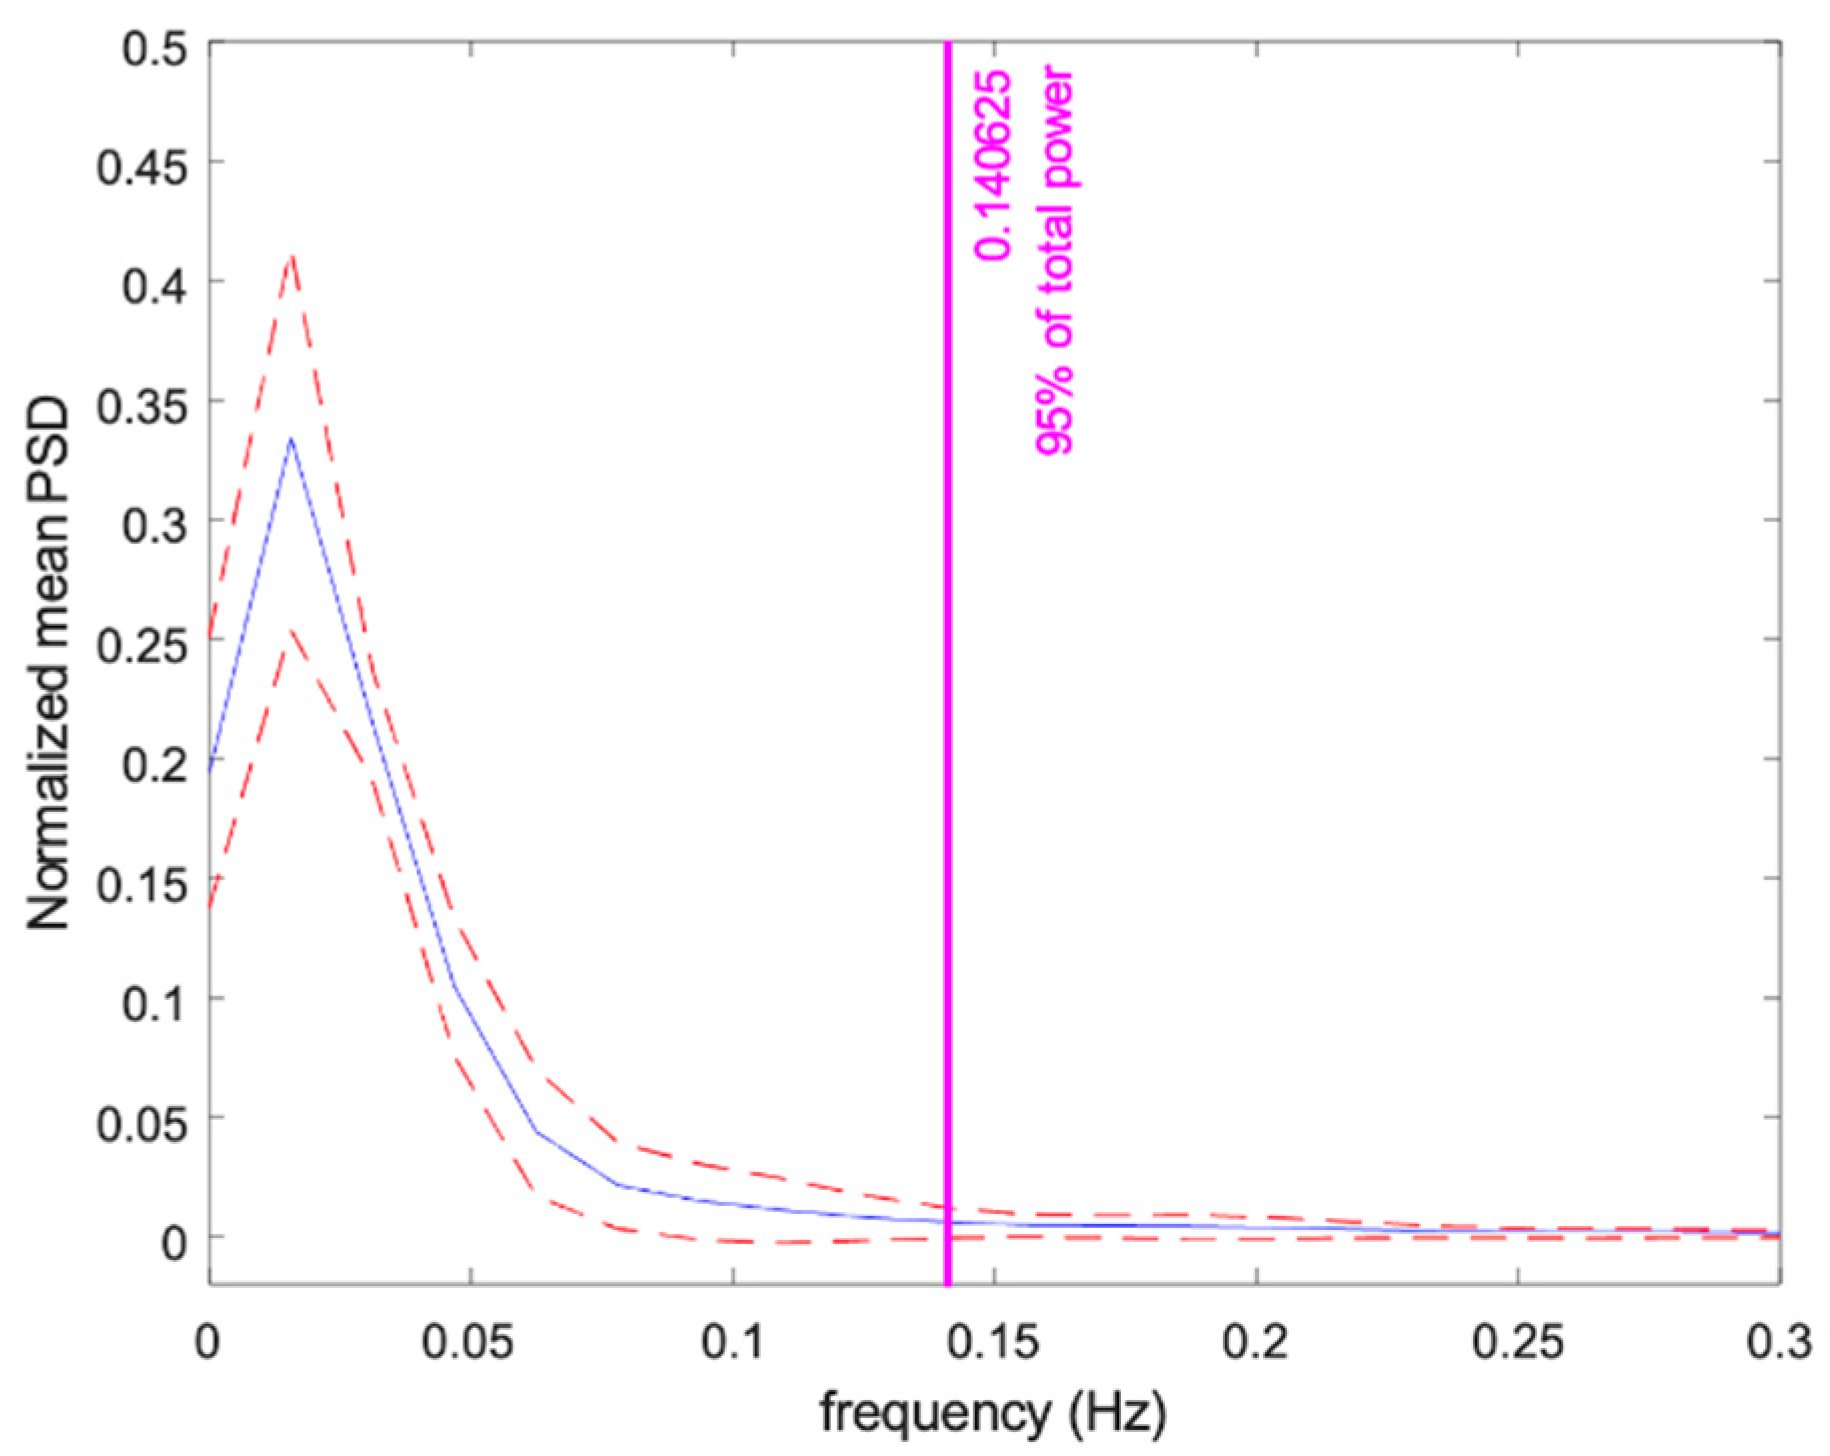
2.4.3. Spectral Analysis of EDA
2.4.4. Statistical Analysis
3. Results
4. Discussion
5. Conclusions
Author Contributions
Funding
Institutional Review Board Statement
Informed Consent Statement
Data Availability Statement
Conflicts of Interest
References
- Möstl, E.; Palme, R. Hormones as indicators of stress. Domest. Anim. Endocrinol. 2002, 23, 67–74. [Google Scholar] [CrossRef] [PubMed]
- Sanmartín Sánchez, L.; Blanco-Penedo, I.; Perea Muñoz, J.M.; Quiñones Pérez, C.; Delgado, J.V.; Vega-Pla, J.L. Welfare assessment at a Spanish Army Equine Breeding Centre. Ital. J. Anim. Sci. 2020, 19, 137–146. [Google Scholar] [CrossRef] [Green Version]
- Kaufman, J.M. Investigation of Pain in Equine Patients Using Heart Rate Variability, Salivary Cortisol Concentration, and Behavioural Pain Scores. Master’s Thesis, University of Prince Edward Island, Charlottetown, PE, Canada, 2022. [Google Scholar]
- Lesimple, C. Indicators of Horse Welfare: State-of-the-Art. Animals 2020, 10, 294. [Google Scholar] [CrossRef] [PubMed] [Green Version]
- Visser, E.K.; van Reenen, C.G.; van der Werf, J.T.N.; Schilder, M.B.H.; Knaap, J.H.; Barneveld, A.; Blokhuis, H.J. Heart rate and heart rate variability during a novel object test and a handling test in young horses. Physiol. Behav. 2002, 76, 289–296. [Google Scholar] [CrossRef]
- Physick-Sheard, P.W.; Marlin, D.J.; Thornhill, R.; Schroter, R.C. Frequency domain analysis of heart rate variability in horses at rest and during exercise. Equine Vet. J. 2000, 32, 253–262. [Google Scholar] [CrossRef]
- Posada-Quintero, H.F.; Florian, J.P.; Orjuela-Cañón, Á.D.; Chon, K.H. Highly sensitive index of sympathetic activity based on time-frequency spectral analysis of electrodermal activity. Am. J. Physiol. Regul. Integr. Comp. Physiol. 2016, 311, R582–R591. [Google Scholar] [CrossRef] [Green Version]
- Shaffer, F.; Ginsberg, J.P. An Overview of Heart Rate Variability Metrics and Norms. Front. Public Health 2017, 5, 258. [Google Scholar] [CrossRef] [Green Version]
- Mitchell, K.J.; Schwarzwald, C.C. Heart rate variability analysis in horses for the diagnosis of arrhythmias. Vet. J. 2021, 268, 105590. [Google Scholar] [CrossRef]
- Calvert, C.A.; Jacobs, G.J. Heart rate variability in Doberman Pinschers with and without echocardiographic evidence of dilated cardiomyopathy. Am. J. Vet. Res. 2000, 61, 506–511. [Google Scholar] [CrossRef]
- Spier, A.W.; Meurs, K.M. Assessment of heart rate variability in Boxers with arrhythmogenic right ventricular cardiomyopathy. J. Am. Vet. Med. Assoc. 2004, 224, 534–537. [Google Scholar] [CrossRef]
- Abbott, J.A. Heart rate and heart rate variability of healthy cats in home and hospital environments. J. Feline Med. Surg. 2005, 7, 195–202. [Google Scholar] [CrossRef]
- Rowan, W.H.; Campen, M.J.; Wichers, L.B.; Watkinson, W.P. Heart rate variability in rodents: Uses and caveats in toxicological studies. Cardiovasc. Toxicol. 2007, 7, 28–51. [Google Scholar] [CrossRef]
- von Borell, E.; Langbein, J.; Després, G.; Hansen, S.; Leterrier, C.; Marchant-Forde, J.; Marchant-Forde, R.; Minero, M.; Mohr, E.; Prunier, A.; et al. Heart rate variability as a measure of autonomic regulation of cardiac activity for assessing stress and welfare in farm animals—A review. Physiol. Behav. 2007, 92, 293–316. [Google Scholar] [CrossRef] [PubMed]
- Moïse, N.S.; Gladuli, A.; Hemsley, S.A.; Otani, N.F. “Zone of avoidance”: RR interval distribution in tachograms, histograms, and Poincaré plots of a Boxer dog. J. Vet. Cardiol. 2010, 12, 191–196. [Google Scholar] [CrossRef] [PubMed] [Green Version]
- Rasmussen, C.E.; Falk, T.; Zois, N.E.; Moesgaard, S.G.; Häggström, J.; Pedersen, H.D.; Ablad, B.; Nilsen, H.Y.; Olsen, L.H. Heart rate, heart rate variability, and arrhythmias in dogs with myxomatous mitral valve disease. J. Vet. Intern. Med. 2012, 26, 76–84. [Google Scholar] [CrossRef] [PubMed]
- Rasmussen, C.E.; Falk, T.; Domanjko Petrič, A.; Schaldemose, M.; Zois, N.E.; Moesgaard, S.G.; Ablad, B.; Nilsen, H.Y.; Ljungvall, I.; Höglund, K.; et al. Holter monitoring of small breed dogs with advanced myxomatous mitral valve disease with and without a history of syncope. J. Vet. Intern. Med. 2014, 28, 363–370. [Google Scholar] [CrossRef] [Green Version]
- Blake, R.R.; Shaw, D.J.; Culshaw, G.J.; Martinez-Pereira, Y. Poincaré plots as a measure of heart rate variability in healthy dogs. J. Vet. Cardiol. 2018, 20, 20–32. [Google Scholar] [CrossRef]
- Moïse, N.S.; Flanders, W.H.; Pariaut, R. Beat-to-Beat Patterning of Sinus Rhythm Reveals Non-linear Rhythm in the Dog Compared to the Human. Front. Physiol. 2019, 10, 1548. [Google Scholar] [CrossRef]
- Thayer, J.F.; Hahn, A.W.; Sollers, J.J.; van Doornen, L.; Johnson, P.J. Heart rate variability in the horse by ambulatory monitoring. Biomed. Sci. Instrum. 1997, 33, 482–485. [Google Scholar] [PubMed]
- Rietmann, T.R.; Stauffacher, M.; Bernasconi, P.; Auer, J.A.; Weishaupt, M.A. The association between heart rate, heart rate variability, endocrine and behavioural pain measures in horses suffering from laminitis. J. Vet. Med. A Physiol. Pathol. Clin. Med. 2004, 51, 218–225. [Google Scholar] [CrossRef]
- Villas-Boas, J.D.; Dias, D.P.M.; Trigo, P.I.; dos Santos Almeida, N.A.; Queiroz de Almeida, F.; Alves de Medeiros, M. Behavioural, endocrine and cardiac autonomic responses to a model of startle in horses. Appl. Anim. Behav. Sci. 2016, 174, 76–82. [Google Scholar] [CrossRef] [Green Version]
- Ohmura, H.; Hiraga, A. Effect of restraint inside the transport vehicle on heart rate and heart rate variability in Thoroughbred horses. J. Equine Sci. 2022, 33, 13–17. [Google Scholar] [CrossRef] [PubMed]
- McDuffee, L.; Carr, L.; Montelpare, W. An observational evaluation of stress in horses during therapeutic riding sessions. J. Vet. Behav. 2022, 49, 53–64. [Google Scholar] [CrossRef]
- Rietmann, T.R.; Stuart, A.E.A.; Bernasconi, P.; Stauffacher, M.; Auer, J.A.; Weishaupt, M.A. Assessment of mental stress in warmblood horses: Heart rate variability in comparison to heart rate and selected behavioural parameters. Appl. Anim. Behav. Sci. 2004, 88, 121–136. [Google Scholar] [CrossRef]
- Jansen, F.; Van der Krogt, J.; Van Loon, K.; Avezzù, V.; Guarino, M.; Quanten, S.; Berckmans, D. Online detection of an emotional response of a horse during physical activity. Vet. J. 2009, 181, 38–42. [Google Scholar] [CrossRef]
- Boucsein, W. Electrodermal Activity; Springer: Boston, MA, USA, 2012; ISBN 978-1-4614-1125-3. [Google Scholar]
- Ellaway, P.H.; Kuppuswamy, A.; Nicotra, A.; Mathias, C.J. Sweat production and the sympathetic skin response: Improving the clinical assessment of autonomic function. Auton. Neurosci. 2010, 155, 109–114. [Google Scholar] [CrossRef]
- Benedek, M.; Kaernbach, C. A continuous measure of phasic electrodermal activity. J. Neurosci. Methods 2010, 190, 80–91. [Google Scholar] [CrossRef] [Green Version]
- Illigens, B.M.W.; Gibbons, C.H. Sweat testing to evaluate autonomic function. Clin. Auton. Res. 2009, 19, 79–87. [Google Scholar] [CrossRef] [Green Version]
- Setz, C.; Arnrich, B.; Schumm, J.; La Marca, R.; Tröster, G.; Ehlert, U. Discriminating Stress From Cognitive Load Using a Wearable EDA Device. IEEE Trans. Inf. Technol. Biomed. 2010, 14, 410–417. [Google Scholar] [CrossRef] [PubMed]
- Healey, J.A.; Picard, R.W. Detecting stress during real-world driving tasks using physiological sensors. IEEE Trans. Intell. Transp. Syst. 2005, 6, 156–166. [Google Scholar] [CrossRef]
- Greenfield, N.S.; Sternbach, R.A. Handbook of Psychophysiology; Holt, Rinehart & Winston: Oxford, UK, 1972. [Google Scholar]
- Anaesthesia UK: Autonomic Nervous System. Available online: https://www.frca.co.uk/article.aspx?articleid=100506 (accessed on 3 January 2023).
- Posada-Quintero, H.F.; Florian, J.P.; Orjuela-Cañón, A.D.; Aljama-Corrales, T.; Charleston-Villalobos, S.; Chon, K.H. Power Spectral Density Analysis of Electrodermal Activity for Sympathetic Function Assessment. Ann. Biomed. Eng. 2016, 44, 3124–3135. [Google Scholar] [CrossRef] [PubMed]
- Kong, Y.; Posada-Quintero, H.F.; Chon, K.H. Sensitive Physiological Indices of Pain Based on Differential Characteristics of Electrodermal Activity. IEEE Trans. Biomed. Eng. 2021, 68, 3122–3130. [Google Scholar] [CrossRef]
- Posada-Quintero, H.F.; Kong, Y.; Nguyen, K.; Tran, C.; Beardslee, L.; Chen, L.; Guo, T.; Cong, X.; Feng, B.; Chon, K.H. Using electrodermal activity to validate multilevel pain stimulation in healthy volunteers evoked by thermal grills. Am. J. Physiol.-Regul. Integr. Comp. Physiol. 2020, 319, R366–R375. [Google Scholar] [CrossRef] [PubMed]
- Kong, Y.; Posada-Quintero, H.F.; Chon, K.H. Real-Time High-Level Acute Pain Detection Using a Smartphone and a Wrist-Worn Electrodermal Activity Sensor. Sensors 2021, 21, 3956. [Google Scholar] [CrossRef] [PubMed]
- Greco, A.; Valenza, G.; Lazaro, J.; Garzon-Rey, J.M.; Aguilo, J.; De-la-Camara, C.; Bailon, R.; Scilingo, E.P. Acute stress state classification based on electrodermal activity modeling. IEEE Trans. Affect. Comput. 2021, 1. [Google Scholar] [CrossRef]
- Posada-Quintero, H.F.; Landon, C.S.; Stavitzski, N.M.; Dean, J.B.; Chon, K.H. Seizures Caused by Exposure to Hyperbaric Oxygen in Rats Can Be Predicted by Early Changes in Electrodermal Activity. Front. Physiol. 2022, 12, 2319. [Google Scholar] [CrossRef]
- Posada-Quintero, H.F.; Derrick, B.J.; Winstead-Derlega, C.; Gonzalez, S.I.; Claire Ellis, M.; Freiberger, J.J.; Chon, K.H. Time-varying Spectral Index of Electrodermal Activity to Predict Central Nervous System Oxygen Toxicity Symptoms in Divers: Preliminary results. In Proceedings of the 2021 43rd Annual International Conference of the IEEE Engineering in Medicine Biology Society (EMBC), Mexico City, Mexico, 1–5 November 2021; pp. 1242–1245. [Google Scholar]
- Safryghin, A.; Hebesberger, D.V.; Wascher, C.A.F. Testing for Behavioral and Physiological Responses of Domestic Horses (Equus caballus) Across Different Contexts—Consistency Over Time and Effects of Context. Front. Psychol. 2019, 10, 849. [Google Scholar] [CrossRef]
- Boucsein, W.; Fowles, D.C.; Grimnes, S.; Ben-Shakhar, G.; Roth, W.T.; Dawson, M.E.; Filion, D.L. Society for Psychophysiological Research Ad Hoc Committee on Electrodermal Measures Publication recommendations for electrodermal measurements. Psychophysiology 2012, 49, 1017–1034. [Google Scholar] [CrossRef]
- Posada-Quintero, H.F.; Chon, K.H. Innovations in Electrodermal Activity Data Collection and Signal Processing: A Systematic Review. Sensors 2020, 20, 479. [Google Scholar] [CrossRef] [Green Version]
- Greco, A.; Valenza, G.; Lanata, A.; Scilingo, E.P.; Citi, L. cvxEDA: A Convex Optimization Approach to Electrodermal Activity Processing. IEEE Trans. Biomed. Eng. 2016, 63, 797–804. [Google Scholar] [CrossRef]
- Massey, F.J., Jr. The Kolmogorov-Smirnov test for goodness of fit. J. Am. Stat. Assoc. 1951, 46, 68–78. [Google Scholar] [CrossRef]
- Miller, L.H. Table of percentage points of Kolmogorov statistics. J. Am. Stat. Assoc. 1956, 51, 111–121. [Google Scholar] [CrossRef]
- Wang, J.; Tsang, W.W.; Marsaglia, G. Evaluating Kolmogorov’s distribution. J. Stat. Softw. 2003, 8, 1–4. [Google Scholar]
- Posada-Quintero, H.F.; Dimitrov, T.; Moutran, A.; Park, S.; Chon, K.H. Analysis of Reproducibility of Noninvasive Measures of Sympathetic Autonomic Control Based on Electrodermal Activity and Heart Rate Variability. IEEE Access 2019, 7, 22523–22531. [Google Scholar] [CrossRef]
- Posada–Quintero, H.F.; Kong, Y.; Chon, K.H. Objective pain stimulation intensity and pain sensation assessment using machine learning classification and regression based on electrodermal activity. Am. J. Physiol.-Regul. Integr. Comp. Physiol. 2021, 321, R186–R196. [Google Scholar] [CrossRef]
- Costa, E.D.; Minero, M.; Lebelt, D.; Stucke, D.; Canali, E.; Leach, M.C. Development of the Horse Grimace Scale (HGS) as a Pain Assessment Tool in Horses Undergoing Routine Castration. PLoS ONE 2014, 9, e92281. [Google Scholar] [CrossRef] [Green Version]
- van Loon, J.P.A.M.; Van Dierendonck, M.C. Monitoring acute equine visceral pain with the Equine Utrecht University Scale for Composite Pain Assessment (EQUUS-COMPASS) and the Equine Utrecht University Scale for Facial Assessment of Pain (EQUUS-FAP): A scale-construction study. Vet. J. 2015, 206, 356–364. [Google Scholar] [CrossRef] [PubMed]
- VanDierendonck, M.C.; van Loon, J.P.A.M. Monitoring acute equine visceral pain with the Equine Utrecht University Scale for Composite Pain Assessment (EQUUS-COMPASS) and the Equine Utrecht University Scale for Facial Assessment of Pain (EQUUS-FAP): A validation study. Vet. J. 2016, 216, 175–177. [Google Scholar] [CrossRef]
- Gleerup, K.B.; Lindegaard, C. Recognition and quantification of pain in horses: A tutorial review. Equine Vet. Educ. 2016, 28, 47–57. [Google Scholar] [CrossRef]
- Ashley, F.H.; Waterman-Pearson, A.E.; Whay, H.R. Behavioural assessment of pain in horses and donkeys: Application to clinical practice and future studies. Equine Vet. J. 2005, 37, 565–575. [Google Scholar] [CrossRef]
- Ask, K.; Andersen, P.H.; Tamminen, L.-M.; Rhodin, M.; Hernlund, E. Performance of four equine pain scales and their association to movement asymmetry in horses with induced orthopedic pain. Front. Vet. Sci. 2022, 9, 938022. [Google Scholar] [CrossRef]
- Anusha, A.S.; Joy, J.; Preejith, S.P.; Joseph, J.; Sivaprakasam, M. Differential effects of physical and psychological stressors on electrodermal activity. In Proceedings of the 2017 39th Annual International Conference of the IEEE Engineering in Medicine and Biology Society (EMBC), Jeju, Korea, 11–15 July 2017; pp. 4549–4552. [Google Scholar]
- Al Machot, F.; Elmachot, A.; Ali, M.; Al Machot, E.; Kyamakya, K. A Deep-Learning Model for Subject-Independent Human Emotion Recognition Using Electrodermal Activity Sensors. Sensors 2019, 19, 1659. [Google Scholar] [CrossRef] [PubMed] [Green Version]
- Poh, M.-Z. Continuous Assessment of Epileptic Seizures with Wrist-Worn Biosensors. Ph.D. Thesis, Massachusetts Institute of Technology, Cambridge, MA, USA, 2011. [Google Scholar]
- Mansour, C.; Mocci, R.; Santangelo, B.; Sredensek, J.; Chaaya, R.; Allaouchiche, B.; Bonnet-Garin, J.-M.; Boselli, E.; Junot, S. Performance of the Parasympathetic Tone Activity (PTA) index to predict changes in mean arterial pressure in anaesthetized horses with different health conditions. Res. Vet. Sci. 2021, 139, 43–50. [Google Scholar] [CrossRef] [PubMed]
- Ruíz-López, P.; Morgaz, J.; Quirós-Carmona, S.; Navarrete-Calvo, R.; Domínguez, J.M.; Gómez-Villamandos, R.J.; Granados, M.M. Parasympathetic Tone Changes in Anesthetized Horses after Surgical Stimulation, and Morphine, Ketamine, and Dobutamine Administration. Animals 2022, 12, 1038. [Google Scholar] [CrossRef]
- Stucke, D.; Große Ruse, M.; Lebelt, D. Measuring heart rate variability in horses to investigate the autonomic nervous system activity—Pros and cons of different methods. Appl. Anim. Behav. Sci. 2015, 166, 1–10. [Google Scholar] [CrossRef]
- Kuwahara, M.; Hashimoto, S.; Ishii, K.; Yagi, Y.; Hada, T.; Hiraga, A.; Kai, M.; Kubo, K.; Oki, H.; Tsubone, H.; et al. Assessment of autonomic nervous function by power spectral analysis of heart rate variability in the horse. J. Auton. Nerv. Syst. 1996, 60, 43–48. [Google Scholar] [CrossRef] [PubMed]
- Hossain, M.-B.; Kong, Y.; Posada-Quintero, H.F.; Chon, K.H. Comparison of Electrodermal Activity from Multiple Body Locations Based on Standard EDA Indices’ Quality and Robustness against Motion Artifact. Sensors 2022, 22, 3177. [Google Scholar] [CrossRef]
- Hossain, M.-B.; Posada-Quintero, H.F.; Kong, Y.; McNaboe, R.; Chon, K.H. Automatic motion artifact detection in electrodermal activity data using machine learning. Biomed. Signal Process. Control. 2022, 74, 103483. [Google Scholar] [CrossRef]
- Hossain, M.B.; Posada-Quintero, H.; Chon, K. A Deep Convolutional Autoencoder for Automatic Motion Artifact Removal in Electrodermal Activity. IEEE Trans. Biomed. Eng. 2022, 69, 3601–3611. [Google Scholar] [CrossRef]


Disclaimer/Publisher’s Note: The statements, opinions and data contained in all publications are solely those of the individual author(s) and contributor(s) and not of MDPI and/or the editor(s). MDPI and/or the editor(s) disclaim responsibility for any injury to people or property resulting from any ideas, methods, instructions or products referred to in the content. |
© 2023 by the authors. Licensee MDPI, Basel, Switzerland. This article is an open access article distributed under the terms and conditions of the Creative Commons Attribution (CC BY) license (https://creativecommons.org/licenses/by/4.0/).
Share and Cite
Golzari, K.; Kong, Y.; Reed, S.A.; Posada-Quintero, H.F. Sympathetic Arousal Detection in Horses Using Electrodermal Activity. Animals 2023, 13, 229. https://doi.org/10.3390/ani13020229
Golzari K, Kong Y, Reed SA, Posada-Quintero HF. Sympathetic Arousal Detection in Horses Using Electrodermal Activity. Animals. 2023; 13(2):229. https://doi.org/10.3390/ani13020229
Chicago/Turabian StyleGolzari, Kia, Youngsun Kong, Sarah A. Reed, and Hugo F. Posada-Quintero. 2023. "Sympathetic Arousal Detection in Horses Using Electrodermal Activity" Animals 13, no. 2: 229. https://doi.org/10.3390/ani13020229