
Broiler Age Influences the Apparent Metabolizable Energy of Soybean Meal and Canola Meal

 , , and
Abstract
:Simple Summary
Abstract
1. Introduction
2. Materials and Methods
2.1. Ingredients
2.2. Diets, Birds and Housing
2.3. Determination of Metabolizable Energy
2.4. Chemical Analysis
2.5. Calculations
2.6. Statistical Analysis
3. Results
4. Discussion
5. Conclusions
Author Contributions
Funding
Institutional Review Board Statement
Data Availability Statement
Acknowledgments
Conflicts of Interest
References
- Hill, F.; Anderson, D. Comparison of metabolizable energy and productive energy determinations with growing chicks. J. Nutr. 1958, 64, 587–603. [Google Scholar] [CrossRef]
- Sibbald, I.R. Measurement of bioavailable energy in poultry feedingstuffs: A review. Can. J. Anim. Sci. 1982, 62, 983–1048. [Google Scholar] [CrossRef]
- Hossain, M.A.; Islam, A.F.; Iji, P.A. Energy utilization and performance of broiler chickens raised on diets with vegetable proteins or conventional feeds. Asian J. Poult. Sci. 2012, 6, 117–128. [Google Scholar] [CrossRef] [Green Version]
- Veluri, S.; Olukosi, O.A. Metabolizable energy of soybean meal and canola meal as influenced by the reference diet used and assay method. Animals 2020, 10, 2132. [Google Scholar] [CrossRef]
- Mateos, G.G.; Sueiro, S.; González, M.R.; Safaa, H.M.; Frikha, M. Recognizing the nutritional quality of soybean meal in diets for poultry. Ukrania 2008, 62, 79–101. [Google Scholar]
- Khajali, F.; Slominski, B.A. Factors that affect the nutritive value of canola meal for poultry. Poult. Sci. 2012, 91, 2564–2575. [Google Scholar] [CrossRef]
- Mateos, G.G.; Cámara, L.; Fondevila, G.; Lázaro, R.P. Critical review of the procedures used for estimation of the energy content of diets and ingredients in poultry. J. Appl. Poult. Res. 2019, 28, 506–525. [Google Scholar] [CrossRef]
- Batal, A.B.; Parsons, C.M. Utilization of different soy products as affected by age in chicks. Poult. Sci. 2003, 82, 454–462. [Google Scholar] [CrossRef]
- Leslie, M.A.; Moran Jr, E.T.; Bedford, M.R. The effect of phytase and glucanase on the ileal digestible energy of corn and soybean meal fed to broilers. Poult. Sci. 2007, 86, 2350–2357. [Google Scholar] [CrossRef]
- Lopez, G.; Leeson, S. Assessment of the nitrogen correction factor in evaluating metabolizable energy of corn and soybean meal in diets for broilers. Poult. Sci. 2008, 87, 298–306. [Google Scholar] [CrossRef]
- Sklan, D.; Noy, Y. Hydrolysis and absorption in the intestine of newly hatched chicks. Poult. Sci. 2000, 79, 1306–1310. [Google Scholar] [CrossRef]
- Bartov, I. Differential effect of age on metabolisable energy content of high protein-low energy and low protein-high energy diets in young broiler chicks1. Br. Poult. Sci. 1995, 36, 631–643. [Google Scholar] [CrossRef]
- Khalil, M.M.; Abdollahi, M.R.; Zaefarian, F.; Chrystal, P.V.; Ravindran, V. Influence of broiler age on the apparent metabolizable energy of cereal grains determined using the substitution method. Animals 2022, 12, 183. [Google Scholar] [CrossRef]
- Titus, H.W.; Mehring, A.L.; Johnson, D., Jr.; Nesbitt, L.L., Jr.; Tomas, T. An evaluation of M.C.F. (Micro-Cel-Fat), a new type of fat product. Poult. Sci. 1959, 38, 1114–1119. [Google Scholar] [CrossRef]
- SAS Institute. SAS® Qualification Tools User’s Guide; Version 9.4; SAS Institute Inc.: Cary, NC, USA, 2015. [Google Scholar]
- Dozier III, W.A.; Purswell, J.L.; Kidd, M.T.; Corzo, A.L.E.X.; Branton, S.L. Apparent metabolizable energy needs of broilers from two to four kilograms as influenced by ambient temperature. J. Appl. Poult. Res. 2007, 16, 206–218. [Google Scholar] [CrossRef]
- Abdollahi, M.R.; Wiltafsky-Martin, M.; Ravindran, V. Application of Apparent Metabolizable Energy versus Nitrogen-Corrected Apparent Metabolizable Energy in Poultry Feed Formulations: A Continuing Conundrum. Animals 2021, 11, 2174. [Google Scholar] [CrossRef]
- Ravindran, V.; Abdollahi, M.R. Nutrition and Digestive Physiology of the Broiler Chick: State of the Art and Outlook. Animals 2021, 11, 2795. [Google Scholar] [CrossRef]
- Stefanello, C.; Vieira, S.L.; Xue, P.; Ajuwon, K.M.; Adeola, O. Age-related energy values of bakery meal for broiler chickens determined using the regression method. Poult. Sci. 2016, 95, 1582–1590. [Google Scholar] [CrossRef]
- Adeola, O.; Anwar, M.N.; Abdollahi, M.R.; Ravindran, V. Age-related energy values of meat and bone meal for broiler chickens. Poult. Sci. 2018, 97, 2516–2524. [Google Scholar] [CrossRef]
- Schneider, W.; Lantzsch, H.J. Zum Einfluss des Alters auf das Verdauungsvermôgen von Masthybriden. Landwirtsch. Forsch. 1969, 22, 182–185. [Google Scholar]
- Bartov, I. Effect of age of broiler chicks and method of determination on the metabolizable energy of corn. In Proceedings of the 18th World’s Poultry Congress, Nagoya, Japan, 4–9 September 1988; pp. 787–789. [Google Scholar]
- Negm, H.M. Die Verdaulichkeit des Hundefutters und ihre Beeinflussung durch Tiermaterial und Futterform. Ph.D. Thesis, Stuttgart-Hohenheim, Stuttgart, Germany, 1966. [Google Scholar]
- Matterson, L.D.; Prince, R. The effect of age and environment on the metabolizable energy value of feedstuffs. In Proceedings Maryland Nutrition Conference for Feed Manufacturers; Maryland Nutrition Conference for Feed Manufacturers: Washington, DC, USA, 1969; p. 97. [Google Scholar]
- Siregar, A.P.; Farrell, D.J. A comparison of the energy and nitrogen metabolism of fed ducklings and chickens. Br. Poult. Sci. 1980, 21, 213–222. [Google Scholar] [CrossRef] [PubMed]
- Fonolla, J.; Prieto, C.; Sanz, R. Influence of age on the nutrient utilization of diets for broilers. Anim. Feed Sci. Technol. 1981, 6, 405–411. [Google Scholar] [CrossRef]
- Batal, A.B.; Parsons, C.M. Effect of age on nutrient digestibility in chicks fed different diets. Poult. Sci. 2002, 81, 400–407. [Google Scholar] [CrossRef] [PubMed]
- Yang, Z.; Pirgozliev, V.R.; Rose, S.P.; Woods, S.; Yang, H.M.; Wang, Z.Y.; Bedford, M.R. Effect of age on the relationship between metabolizable energy and digestible energy for broiler chickens. Poult. Sci. 2020, 99, 320–330. [Google Scholar] [CrossRef]
- Krás, R.V.; Kessler, A.D.M.; Ribeiro, A.M.L.; Henn, J.D.; Bockor, L.; Sbrissia, A.F. Effect of dietary fiber, genetic strain and age on the digestive metabolism of broiler chickens. Bra. J. Poult. Sci. 2013, 15, 83–90. [Google Scholar] [CrossRef] [Green Version]
- Thomas, D.V.; Ravindran, V.; Ravindran, G. Nutrient digestibility and energy utilisation of diets based on wheat, sorghum or maize by the newly hatched broiler chick. Br. Poult. Sci. 2008, 49, 429–435. [Google Scholar] [CrossRef]
- Zelenka, J. Influence of the age of chicken on the metabolisable energy values of poultry diets. Br. Poult. Sci. 1968, 9, 135–142. [Google Scholar] [CrossRef]
- Murakami, H.; Akiba, Y.; Horiguchi, M. Growth and utilization of nutrients in newly hatched chicks with or without removal of residual yolk. Growth Dev. Aging 1992, 56, 75–84. [Google Scholar]
- Gracia, M.I.; Latorre, M.A.; Garcia, M.; Lazaro, R.; Mateos, G.G. Heat processing of barley and enzyme supplementation of diets for broilers. Poult. Sci. 2003, 82, 1281–1291. [Google Scholar] [CrossRef]
- Moss, A.F.; Khoddami, A.; Chrystal, P.V.; Sorbara, J.O.B.; Cowieson, A.J.; Selle, P.H.; Liu, S.Y. Starch digestibility and energy utilisation of maize-and wheat-based diets is superior to sorghum-based diets in broiler chickens offered diets supplemented with phytase and xylanase. Anim. Feed Sci. Technol. 2020, 264, 114475. [Google Scholar] [CrossRef]
- Scott, T.A.; Silversides, F.G. Defining the effects of wheat type, water inclusion level, and wet-diet restriction on variability in performance of broilers fed wheat-based diets with added water. Can. J. Anim. Sci. 2003, 83, 265–272. [Google Scholar] [CrossRef]
- Massuquetto, A.; Panisson, J.C.; Schramm, V.G.; Surek, D.; Krabbe, E.L.; Maiorka, A. Effects of feed form and energy levels on growth performance, carcass yield and nutrient digestibility in broilers. Animal 2020, 14, 1139–1146. [Google Scholar] [CrossRef] [PubMed]
- Vergara, P.; Jiminez, M.; Ferrando, C.; Fernandez, E.; Gonalons, E. Age influence on digestive transit time of particulate and soluble markers in broiler chickens. Poult. Sci. 1989, 68, 185–189. [Google Scholar] [CrossRef] [PubMed]
- Uni, Z.; Noy, Y.; Sklan, D. Posthatch changes in morphology and function of the small intestines in heavy- and light-strain chicks. Poult. Sci. 1995, 74, 1622–1629. [Google Scholar] [CrossRef]
- Rougiere, N.; Carré, B. Comparison of gastrointestinal transit times between chickens from D+ and D- genetic lines selected for divergent digestion efficiency. Animal 2010, 4, 1861–1872. [Google Scholar] [CrossRef] [Green Version]
- Lima, L.I.; Silva, J.D.D.; Rostagno, S.H.; Tarfuri, M.L. Composição química e valores energéticos de alguns alimentos determinados com pintos e galos, utilizando duas metodologias. Rev. Bras. De Zootec. 1989, 18, 546–556. [Google Scholar]
- Murakami, H.; Akiba, Y.; Horiguchi, M. A Modified Bioassay for Energy Utilization in Newly Hatched Chicks: 2. Determination of Feed Input and Procedures to Estimate Endogenous Energy Loss. Poult. Sci. 1995, 74, 343–351. [Google Scholar] [CrossRef]
- Jin, S.H.; Corless, A.; Sell, J.L. Digestive system development in post-hatch poultry. World’s Poult. Sci. J. 1998, 54, 335–345. [Google Scholar] [CrossRef]
- Sell, J.L.; Angel, C.R.; Piquer, F.J.; Mallarino, E.G.; Al-Batsham, H.A. Developmental patterns of selected characteristics of the gastrointestinal tract of young turkeys. Poult. Sci. 1991, 70, 1200–1205. [Google Scholar] [CrossRef]
- Hartel, H. Influence of food input and procedure of determination on metabolisable energy and digestibility of a diet measured with young and adult birds. Br. Poult. Sci. 1986, 27, 11–39. [Google Scholar] [CrossRef]
- Noble, R.C.; Cocchi, M. Lipid metabolism and the neonatal chicken. Prog. Lipid Res. 1990, 29, 107–140. [Google Scholar] [CrossRef] [PubMed]
- Chamblee, T.N.; Brake, J.D.; Schultz, C.D.; Thaxton, J.P. Yolk sac absorption and initiation of growth in broilers. Poult. Sci. 1992, 71, 1811–1816. [Google Scholar] [CrossRef]
- Speake, B.K.; Murray, A.M.; Noble, R.C. Transport and transformations of yolk lipids during development of avian embryo. Prog. Lipid Res. 1998, 37, 1–32. [Google Scholar] [CrossRef] [PubMed]
- Dzoma, B.M.; Dorrestein, G.M. Yolk sac retention in the ostrich (Struthia camelus): Histopathologic, anatomic, and physiologic considerations. J. Avian Med. Surg. 2001, 15, 81–89. [Google Scholar] [CrossRef]
- Sato, M.; Tachibana, T.; Furuse, M. Heat production and lipid metabolism in broiler and layer chickens during embryonic development. Comp. Biochem. Physiol. Part A Mol. Integr. Physiol. 2006, 143, 382–388. [Google Scholar] [CrossRef]
- Van der Wagt, I.; de Jong, I.C.; Mitchell, M.A.; Molenaar, R.; van den Brand, H. A review on yolk sac utilization in poultry. Poult. Sci. 2020, 99, 2162–2175. [Google Scholar] [CrossRef]
- Ravindran, V.; Abdollahi, M.R.; Bootwalla, S.M. Nutrient analysis, metabolizable energy, and digestible amino acids of soybean meals of different origins for broilers. Poult. Sci. 2014, 93, 2567–2577. [Google Scholar] [CrossRef]
- Olukosi, O.A. Investigation of the effects of substitution levels, assay methods and length of adaptation to experimental diets on determined metabolisable energy value of maize, barley and soya bean meal. Br. Poult. Sci. 2021, 62, 278–284. [Google Scholar] [CrossRef]
- Ahiwe, E.U.; Omede, A.A.; Abdallh, M.B.; Iji, P.A. Managing dietary energy intake by broiler chickens to reduce production costs and improve product quality. In Animal Husbandry and Nutrition; Yucel, B., Taskin, T., Eds.; Infotech Open Ltd.: London, UK, 2018; pp. 115–145. [Google Scholar]


| Item | Soybean Meal | Canola Meal |
|---|---|---|
| DM a | 921 | 911 |
| Ash | 65.4 | 72.5 |
| Nitrogen | 77.4 | 56.9 |
| Protein | 489 | 356 |
| Fat | 12.3 | 48.5 |
| NDF a | 84.6 | 250 |
| Ca a | 3.26 | 5.78 |
| P a | 6.61 | 10.5 |
| GE a (MJ/kg) | 17.67 | 17.83 |
| Ingredient | Basal Diet | Starter Diet | Finisher Diet |
|---|---|---|---|
| Corn | 604.4 | 574.2 | 660.0 |
| Soybean meal, 460 g/kg | 338.1 | 381.4 | 295.7 |
| Soybean oil | 14.2 | 8.8 | 13.6 |
| Dicalcium phosphate | 15.8 | 10.7 | 8.2 |
| Limestone | 10.4 | 11.3 | 9.9 |
| L Lysine HCl | 3.7 | 2.0 | 1.9 |
| DL Methionine | 3.1 | 3.3 | 3.0 |
| L Threonine | 2.0 | 1.0 | 0.7 |
| L Valine | 0.7 | - | - |
| Sodium chloride | 1.0 | 2.5 | 2.5 |
| Sodium bicarbonate | 3.9 | 2.7 | 2.5 |
| Trace mineral premix 2 | 1.0 | 1.0 | 1.0 |
| Vitamin premix 2 | 1.0 | 1.0 | 1.0 |
| Choline Chloride 60% | 0.7 | - | - |
| Ronozyme HiPhos (Phytase) | - | 0.1 | 0.1 |
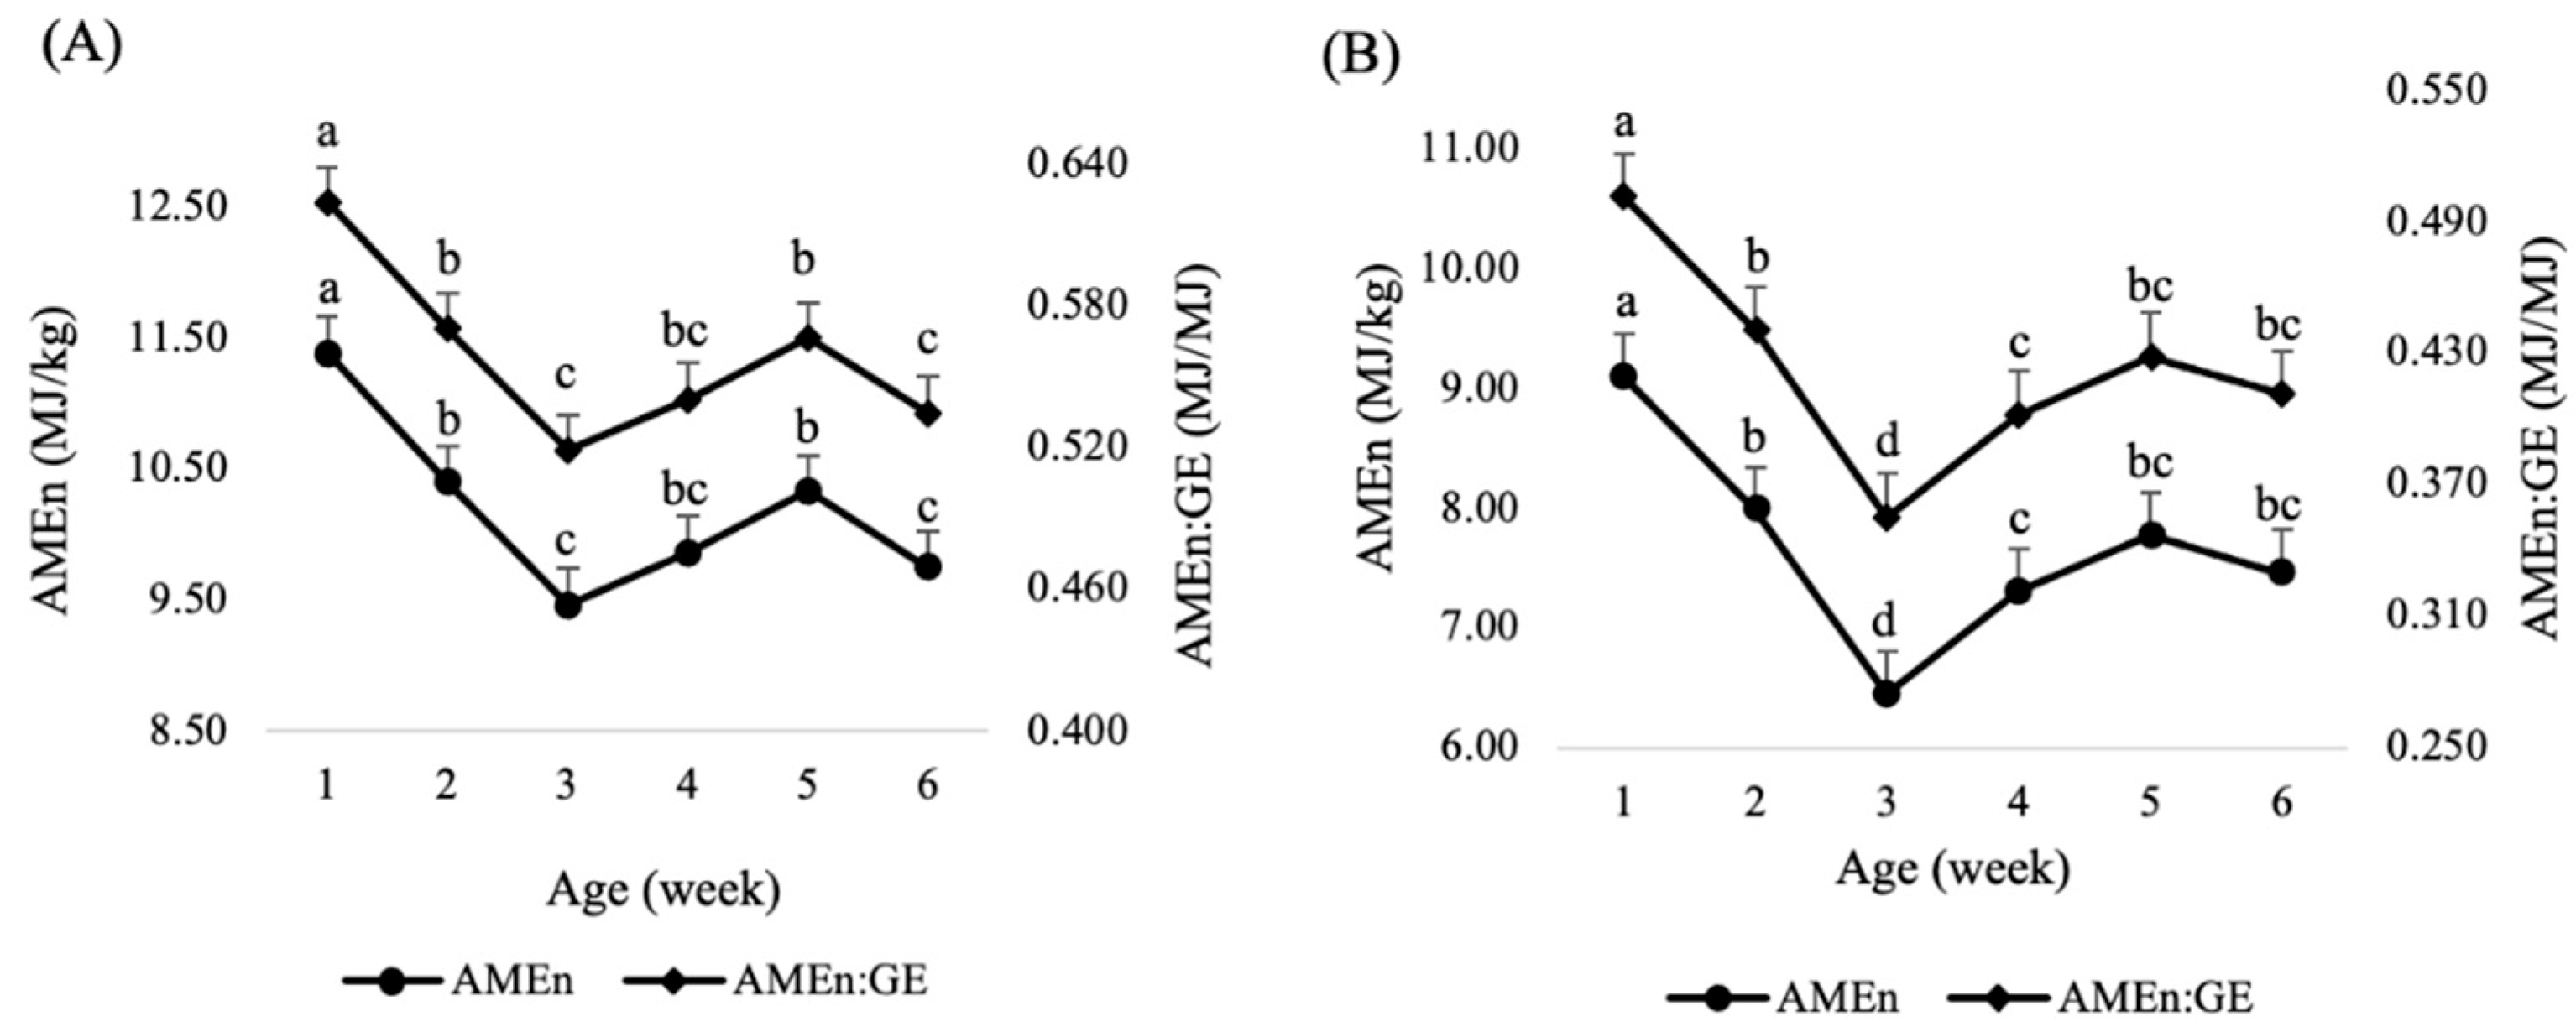
| Age (Week) | DM Retention | N Retention | AME | AMEn | AMEn:GE |
|---|---|---|---|---|---|
| 1 | 76.2 | 66.3 | 12.99 | 11.38 | 0.624 |
| 2 | 70.9 | 58.3 | 11.70 | 10.40 | 0.570 |
| 3 | 66.8 | 55.9 | 10.17 | 9.46 | 0.519 |
| 4 | 67.3 | 56.6 | 10.98 | 9.86 | 0.541 |
| 5 | 68.0 | 56.3 | 11.64 | 10.33 | 0.567 |
| 6 | 63.9 | 47.1 | 10.60 | 9.75 | 0.535 |
| SEM 2 | 0.55 | 1.10 | 0.280 | 0.191 | 0.0105 |
| Orthogonal polynomial contrast, p ≤ | |||||
| Linear | 0.001 | 0.001 | 0.001 | 0.001 | 0.001 |
| Quadratic | 0.001 | 0.811 | 0.001 | 0.001 | 0.001 |
| Age (Week) | DM Retention | N Retention | AME | AMEn | AMEn:GE |
|---|---|---|---|---|---|
| 1 | 72.9 | 66.3 | 10.56 | 9.10 | 0.501 |
| 2 | 68.7 | 63.2 | 9.53 | 7.99 | 0.440 |
| 3 | 63.0 | 56.9 | 7.27 | 6.44 | 0.355 |
| 4 | 63.9 | 58.5 | 8.30 | 7.30 | 0.402 |
| 5 | 64.8 | 58.7 | 9.22 | 7.78 | 0.428 |
| 6 | 61.0 | 48.1 | 8.18 | 7.46 | 0.411 |
| SEM 2 | 0.58 | 0.81 | 0.348 | 0.229 | 0.0127 |
| Orthogonal polynomial contrast, p ≤ | |||||
| Linear | 0.001 | 0.001 | 0.001 | 0.001 | 0.001 |
| Quadratic | 0.001 | 0.140 | 0.001 | 0.001 | 0.001 |
| Age (Week) | Soybean Meal | Canola Meal | ||
|---|---|---|---|---|
| Excreta GE (MJ/kg) | Excreta Output: Feed Intake | Excreta GE (MJ/kg) | Excreta Output: Feed Intake | |
| 1 | 15.79 | 0.24 | 16.29 | 0.27 |
| 2 | 16.12 | 0.29 | 16.80 | 0.31 |
| 3 | 16.12 | 0.33 | 16.62 | 0.37 |
| 4 | 15.80 | 0.33 | 16.33 | 0.36 |
| 5 | 15.56 | 0.32 | 15.99 | 0.35 |
| 6 | 15.44 | 0.36 | 15.94 | 0.39 |
| SEM 2 | 0.048 | 0.006 | 0.079 | 0.006 |
| Orthogonal polynomial contrast, p ≤ | ||||
| Linear | 0.001 | 0.001 | 0.001 | 0.001 |
| Quadratic | 0.001 | 0.001 | 0.001 | 0.001 |
Disclaimer/Publisher’s Note: The statements, opinions and data contained in all publications are solely those of the individual author(s) and contributor(s) and not of MDPI and/or the editor(s). MDPI and/or the editor(s) disclaim responsibility for any injury to people or property resulting from any ideas, methods, instructions or products referred to in the content. |
© 2023 by the authors. Licensee MDPI, Basel, Switzerland. This article is an open access article distributed under the terms and conditions of the Creative Commons Attribution (CC BY) license (https://creativecommons.org/licenses/by/4.0/).
Share and Cite
Khalil, M.M.; Abdollahi, M.R.; Zaefarian, F.; Chrystal, P.V.; Ravindran, V. Broiler Age Influences the Apparent Metabolizable Energy of Soybean Meal and Canola Meal. Animals 2023, 13, 219. https://doi.org/10.3390/ani13020219
Khalil MM, Abdollahi MR, Zaefarian F, Chrystal PV, Ravindran V. Broiler Age Influences the Apparent Metabolizable Energy of Soybean Meal and Canola Meal. Animals. 2023; 13(2):219. https://doi.org/10.3390/ani13020219
Chicago/Turabian StyleKhalil, Mahmoud M., Mohammad Reza Abdollahi, Faegheh Zaefarian, Peter V. Chrystal, and Velmurugu Ravindran. 2023. "Broiler Age Influences the Apparent Metabolizable Energy of Soybean Meal and Canola Meal" Animals 13, no. 2: 219. https://doi.org/10.3390/ani13020219